


Abstract
The present study aimed to determine the correlation between serum carcinoembryonic antigen (CEA) level and the severity of interstitial lung disease (ILD) in clinically amyopathic DM (CADM) patients.
We performed a retrospective study including 41 Chinese CADM patients without malignancy. Serum CEA levels, clinical and laboratory findings were collected. Association tests between CEA levels and disease activity parameters were performed.
Among the 41 patients, 16 (39.0%) developed rapidly progressive (RP)-ILD; of them, 14 (87.5%) had elevated serum CEA levels. Multivariate logistic regression analysis indicated that an elevated serum CEA level was an independent risk factor for RP-ILD. The incidence of elevated CEA level was significantly higher in patients with RP-ILD than in those without RP-ILD (87.5 vs 16.0%, P < 0.001). Furthermore, CEA levels were higher in patients with CADM with RP-ILD [26.87 (6.71) μg/l] than in those without RP-ILD [3.23 (0.64) μg/l] (P < 0.001). CEA levels in CADM patients were associated with the ferritin, alanine aminotransferase, aspartate aminotransferase and lactate dehydrogenase levels, and CT scores of the lungs. Also, elevated CEA levels are related to the organizing pneumonia pattern and lower lung zone consolidation in high-resolution CT. Moreover, the cumulative survival rate was significantly lower (68.4 vs 31.6%, P < 0.001) in the group with a CEA level >8.75 μg/l than that in the group with a CEA level <8.75 μg/l.
An elevated serum CEA level is common in patients with CADM, and a higher serum CEA level is a powerful indicator of RP-ILD and poor prognosis in those patients.
An elevated carcinoembryonic antigen level is common in Chinese patients with clinically amyopathic DM.
Carcinoembryonic antigen is a useful biomarker to predict rapidly progressive interstitial lung disease and prognosis in Chinese patients with clinically amyopathic DM.
Introduction
Clinically amyopathic DM (CADM), a subgroup of DM characterized by the typical DM cutaneous manifestations but no myositis [1], includes patients with amyopathic DM and hypomyopathic DM [2, 3]. The incidence of CADM was 20% among patients with DM [4]. CADM shares common denominators with classic DM including characteristic cutaneous manifestations, interstitial lung disease (ILD) and malignancy. However, CADM is more intriguing because of the high incidence of fatal ILD in eastern Asian countries including Japan and China [5–7]. This fatal ILD refers to the rapidly progressive ILD (RP-ILD), a progressive deterioration of the ILD that occurs within 3 months [8]. RP-ILD is extremely difficult to treat and related with a high mortality rate, with a 6-month survival rate of only 41% [9].
DM is a paraneoplastic disease, and 14–20% of patients with CADM are complicated with malignancy. Carcinoembryonic antigen (CEA) is a common tumour marker that is overexpressed in many cancers such as gastric, breast, ovarian, lung, pancreatic and especially colorectal cancer. Elevated CEA levels in CADM are clinically relevant with the tumour by default. It was recently reported that CEA level may be associated with ILD in patients with CTD [10]. However, whether CEA level is increased in patients with CADM and the association between CEA level and ILD severity in CADM remains unknown.
Here we explored the CEA levels of Chinese patients with CADM without malignancy as well as the association between serum CEA level and ILD severity in CADM patients.
Methods
Patients and study design
We retrospectively reviewed medical records to identify patients with CADM treated at the First Affiliated Hospital of Zhejiang University School of Medicine between January 2010 and May 2019. The diagnosis of CADM was made according to the Sontheimer criteria [11]. Patients were excluded in the following situations: (i) patients that were already diagnosed with tumours before our study were excluded; (ii) all patients underwent physical examinations and PET-CT or whole-body imaging such as CT/MRI during their hospital admission, and patients who were diagnosed with tumours were excluded; (iii) all patients were followed up for at least 2 years and patients after May 2019 were followed up for 1.5 years after their hospital admission, and patients who were diagnosed with tumours were excluded; (iv) patients with overlap syndromes including SLE, RA, scleroderma, and SS were excluded. Patients’ clinical, histopathological, lung imaging and laboratory data were collected. The clinical, lung imaging and laboratory data were compared between CADM patients with RP-ILD and those without RP-ILD. Thirty-four age- and sex-matched patients with SLE were included as a control group. This study was performed with the approval of the Human Ethics Board of the the First Affiliated Hospital, College of Medicine, Zhejiang University.
Interstitial lung disease
The diagnosis of ILD was defined as pulmonary fibrosis detected on chest radiography or high-resolution CT (HRCT) of the lung. All HRCT images were judged by two radiologists. According to the different clinical presentations, ILD with CADM was divided into RP-ILD and chronic ILD. RP-ILD was defined as a previous or concurrent diagnosis of ILD and acute and progressive worsening of dyspnoea secondary to ILD requiring hospitalization, supplementary oxygen or respiratory failure requiring intubation within 3 months of the diagnosis of ILD [12].
HRCT analysis
All HRCT images were judged by two radiologists who were blinded to the clinical information. According to American Thoracic Society/European Respiratory Society guidelines, the HRCT images were categorized as presenting one of the following three patterns in [13]: (i) nonspecific interstitial pneumonia (NSIP) pattern; (ii) organizing pneumonia pattern (OP) pattern; and (iii) NSIP combined with OP pattern. Consolidation in the lower lung zone was characterized by a homogeneous increase in pulmonary parenchymal opacity that obscured the margins of the vessels and airway walls and the lesions distributed below the inferior pulmonary vein [14]. All cases with ILD were categorized by HRCT patterns, as described previously. The extent of ILD-characteristic abnormalities on HRCT in each case was evaluated according to Goh’s scoring system. In all the cases, the HRCT score was calculated based on a 1–6 scale and the extent of each abnormality was determined by visually estimating the percentage (to the nearest 5%) of the affected lung parenchyma in each zone. The 6 zone scores were averaged to determine the total score for each patient [15].
Statistical analysis
We compared the features of patients with RP-ILD and those without RP-ILD using Student’s t-test, the Mann–Whitney U test and the χ2 test. Fisher’s exact test was used to identify and evaluate the frequencies of elevated CEA levels in patients with and those without RP-ILD. The Mann–Whitney U test was used to compare the CEA levels of patients among the groups. The correlation between CEA level, CT score and serum ferritin, alanine aminotransferase (ALT), aspartate aminotransferase (AST) and lactate dehydrogenase (LDH) levels were evaluated by Spearman rank correlation analysis. The cumulative survival rate was calculated using the Kaplan–Meier test. The log-rank test was also used to compare survival. Receiver operating characteristic analysis was used to evaluate the separation performance of different serum CEA concentrations as cut-off points. Values of P < 0.05 were considered statistically significant.
Results
Clinical and laboratory features of CADM patients
We identified 41 Chinese patients with CADM treated at our institution between January 2010 and May 2019. The muscle enzymes such as creatine kinase and creatine kinase isoenzymes of all the patients were basically normal. Thirty-four patients (82.9%) had ILD, while 16 (39%) were diagnosed with RP-ILD. Eighteen patients (43.9%) had significantly increased serum CEA levels [mean (s.d.) 18.34 (5.9) μg/l; range 5–115.4 μg/l].
Features of CADM patients with vs those without RP-ILD
Table 1 shows the results of the baseline clinical and laboratory examinations performed on admission. We found that age and the serum levels of CEA, ferritin, ALT, AST and LDH were higher in patients with CADM and RP-ILD than in those without RP-ILD. Regarding smoking, there was no difference in two subgroups (P = 0.13).
Clinical and laboratory features of 41 CADM patients with vs those without RP-ILD
| CADM (n = 41) | With RP-ILD (n = 16) | Without RP-ILD (n = 25) | P-value | |
|---|---|---|---|---|
| Age, mean (s.d.), years | 52.7 (1.78) | 56.68 (2.32) | 49.28 (2.38) | 0.042* |
| Female gender, n (%) | 31 (75.6) | 10 (62.5) | 21 (84.0) | 0.15 |
| Smoking, n (%) | 8 (19.5) | 5 (31.2) | 3 (12) | 0.13 |
| Heliotrope rash, n (%) | 23 (56.1) | 7 (43.8) | 16 (64) | 0.334 |
| Gottron’s papules, n (%) | 19 (46.3) | 8 (50) | 11 (44) | 0.757 |
| Gottron’s sign, n (%) | 22 (53.7) | 12 (75) | 10 (40) | 0.053 |
| Mechanic’s hands, n (%) | 6 (14.6) | 2 (12.5) | 4 (16) | 0.757 |
| Poikiloderma, n (%) | 5 (12.2) | 1 (6.2) | 4 (16) | 0.632 |
| V-neck sign, n (%) | 11 (26.8) | 2 (12.5) | 9 (36) | 0.152 |
| Shawl sign, n (%) | 3 (7.3) | 1 (6.2) | 2 (8) | 0.834 |
| Skin ulcers, n (%) | 5 (12.2) | 3 (18.7) | 2 (8) | 0.362 |
| Pruritus, n (%) | 9 (22) | 4 (25) | 5 (20) | 0.717 |
| Periungual erythema, n (%) | 4 (9.8) | 00 | 4 (16) | 0.143 |
| Fatigue, n (%) | 13 (31.7) | 7 (43.7) | 6 (24) | 0.302 |
| Fever, n (%) | 19 (46.3) | 9 (56.2) | 10 (40) | 0.352 |
| Arthralgia, n (%) | 20 (48.8) | 9 (56.2) | 11 (44) | 0.530 |
| Shortness of breath, n (%) | 12 (29.3) | 6 (37.5) | 6 (24) | 0.485 |
| Elevated CEA, n (%) | 18 (43.9) | 14 (87.5) | 4 (16) | <0.001*** |
| CEA level, mean (s.d.), μg/l | 9.47 (2.84) | 26.87 (6.71) | 3.58 (0.64) | 0.001*** |
| Ferritin level, mean (s.d.), ng/ml | 1410.72 (304.99) | 2376.36 (538.72) | 792.72 (312.06) | 0.001** |
| ALT, mean (s.d.), U/l | 66.41 (11.85) | 72.87 (16.26) | 62.28 (16.63) | 0.007** |
| AST, mean (s.d.), U/l | 90.48 (23.83) | 120.81 (52.18) | 71.08 (20.55) | 0.021* |
| LDH, mean (s.d.), U/l | 402.92 (33.43) | 519.12 (55.68) | 328.56 (34.75/) | 0.004** |
P < 0.05;
P < 0.01;
P < 0.001.
ALT: alanine aminotransferase; AST: aspartate aminotransferase; CADM: clinically amyopathic DM; CEA: carcinoembryonic antigen; LDH: lactate dehydrogenase; RP-ILD: rapidly progressive interstitial lung disease.
Logistic regression analysis of risk factors for RP-ILD
Univariate logistic regression analysis indicated that elevated levels of CEA (P < 0.001), ferritin (P = 0.028) and LDH (P = 0.022) were risk factors for RP-ILD (supplementary Table S1, available at Rheumatology online).
Although ALT and AST levels were not risk factors of RP-ILD on univariate logistic regression analysis, the Mann–Whitney U test and previous studies showed that they may be correlated with RP-ILD in patients with DM [16]. Therefore, we entered them into multiple logistic regression analysis. We used two models in the multiple logistic regression analysis to examine risk factors for the presence of RP-ILD (Table 2). In model 1, which included elevated CEA (cut-off, 5 μg/l) level in addition to ferritin, AST, ALT and LDH levels as independent variables, elevated CEA level was an independent risk factor for the presence of RP-ILD (odds ratio 57.39; 95% CI 4.58, 718.33; P = 0.002). In model 2, elevated CEA was replaced with CEA level and it was demonstrated that CEA level was also an independent factor for the presence of RP-ILD (odds ratio 1.51; 95% CI 1.09, 2.09; P = 0.01).
Multiple logistic regression analysis on risk factors associated with RP-ILD in CADM patientsa
| Model 1 | Model 2 | |||||
|---|---|---|---|---|---|---|
| OR | 95% CI | P-value | OR | 95% CI | P-value | |
| Age | 1.02 | 0.9 1, 1.14 | 0.73 | 1.08 | 0.9 4, 1.23 | 0.26 |
| Ferritin | 1.00 | 1.0 0, 1.01 | 0.66 | 1.00 | 0.9 9, 1.00 | 0.75 |
| ALT | 0.99 | 0.9 7, 1.00 | 0.63 | 1.00 | 0.9 7, 1.02 | 0.98 |
| AST | 1.00 | 0.9 8, 1.01 | 0.94 | 0.99 | 0.9 1, 1.14 | 0.49 |
| LDH | 1.00 | 0.9 9, 1.01 | 0.09 | 1.00 | 0.9 9, 1.01 | 0.08 |
| Elevated CEA | 57.39 | 4.5 8, 718.33 | 0.002** | – | – | – |
| CEA | – | – | – | 1.51 | 1.0 9, 2.09 | 0.01* |
Multiple logistic regression analysis of factors associated with RP-ILD level. Model 1 used elevated CEA (cut-off, 5.0 μg/l), while model 2 used CEA level. CADM: clinically amyopathic DM; CEA: carcinoembryonic antigen; OR: odds ratio; RP-ILD: rapidly progressive interstitial lung disease. *P < 0.05; **P < 0.01.
Comparison of the rate of CEA elevation in patients with RP-ILD and without RP-ILD
We revealed that 14 of 16 (87.5%) patients with RP-ILD had elevated serum CEA levels. Table 3 shows that the frequency of RP-ILD was significantly higher in the elevated CEA level group [14 of 16 (87.5%)] than that in the non-elevated CEA group [4 of 25 (16.0%)]. CADM patients with RP-ILD more frequently had an elevated CEA level (P < 0.001) (Table 3). We then subdivided the patients without RP-ILD into those with chronic ILD and those without ILD. Also, the rate of elevated CEA among patients with RP-ILD was significantly higher than those with chronic ILD (87.5 vs 22.2%, P < 0.001). The rate of elevated CEA among patients with RP-ILD was significantly higher than those without ILD (87.5 vs 0%, P < 0.001) (Table 3). There was no statistically significant difference in the frequency of patients with chronic ILD and those without ILD (P = 0.141).
Comparison of CEA elevation in CADM patients with and without RP-ILDa
| Patient subgroups | Normal CEA (N = 23) | Elevated CEA (N = 18) | P-value |
|---|---|---|---|
| CADM with RP-ILD (n = 16) | 2 | 14 (87.5%) | – |
| CADM without RP-ILD (n = 25) | 21 | 4 (16.0%) | <0.001*** |
| CADM with chronic ILD (n = 18) | 14 | 4 (22.2%) | <0.001*** |
| CADM without ILD (n = 7) | 7 | 0 | <0.001*** |
Compared with CADM with RP-ILD. CADM: clinically amyopathic DM; CEA: carcinoembryonic antigen; RP-ILD: rapidly progressive interstitial lung disease.
P < 0.001.
Comparison of serum CEA levels in CADM patients with vs those without RP-ILD
The mean (s.d.) CEA level of the 41 CADM patients was higher than that of those with SLE [9.47 (2.84) vs 2.43 (0.31) μg/l, P < 0.001; supplementary Fig. S1A, available at Rheumatology online]. We then compared the mean serum CEA level between CADM patients with RP-ILD and those without RP-ILD. The mean (s.d.) serum CEA levels among patients with RP-ILD were significantly higher than those without RP-ILD [26.87 (6.71) vs 3.23 (0.640) μg/l, P < 0.001; Table 4, supplementary Fig. S1B, available at Rheumatology online]. We subdivided the patients without RP-ILD into those with chronic ILD and those without ILD. Also, the mean serum CEA levels among patients with RP-ILD were significantly higher than those with chronic ILD [26.87 (6.71) vs 4.4 (0.81) μg/l, P < 0.001]. The mean serum CEA levels among patients with RP-ILD was significantly higher than those without ILD [26.87 (6.71) vs 1.47 (0.39) μg/l, P < 0.001; Table 4].
Comparison of serum CEA levels between CADM patients with and those without RP-ILDa
| Patient subgroups | Median (range) CEA level (μg/l) | Mean (s.d.) CEA level (μg/l) | P-value |
|---|---|---|---|
| CADM with RP-ILD (n = 16) | 10.25 | 26.87 (6.71) | – |
| CADM without RP-ILD (n = 25) | 3.00 | 3.23 (0.64) | <0.001*** |
| CADM with chronic ILD (n = 18) | 3.55 | 4.4 (0.81) | <0.001*** |
| CADM without ILD (n = 7) | 1.1 | 1.47 (0.39) | <0.001*** |
Compared with patients with CADM and RP-ILD. CADM: clinically amyopathic DM; CEA: carcinoembryonic antigen; RP-ILD: rapidly progressive interstitial lung disease.
P < 0.001.
Correlation between serum CEA levels and other laboratory findings
The mean (s.d.) CT score of the 41 CADM patients was [182.73 (14.41)]. The mean CT score of the patients with RP-ILD was [261.56 (22.91)] and the mean score of the patients without RP-ILD was [132.28 (9.28)]. The correlations between serum CEA levels and other laboratory parameters are shown in Fig. 1. There was a significant association between CEA level, CT scores, and levels of serum ferritin, ALT, AST and LDH (P < 0.001; Fig. 1).
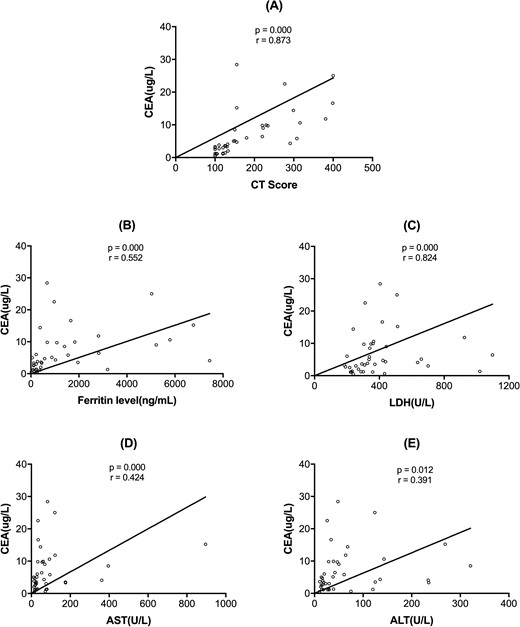
Spearman analysis revealed correlations between serum CEA levels and other laboratory findings
(A) CEA levels and CT scores (P < 0.001); (B) CEA levels and ferritin levels (P < 0.001); (C) CEA levels and LDH levels (P < 0.001); (D) CEA levels and AST (P < 0.001); (E) CEA levels and ALT (P = 0.012). ALT: alanine aminotransferase; AST: aspartate aminotransferase; CEA: carcinoembryonic antigen; LDH: lactate dehydrogenase.
Correlation between serum CEA levels and radiological patterns of HRCT in CADM patients with ILD
Usual interstitial pneumonia was absent in our patients and OP, NSIP and OP + NSIP were the main patterns found in the HRCT assessments of our patient cohort. As shown in supplementary Table S2, available at Rheumatology online, in 34 patients with ILD, the frequency of OP/OP + NSIP radiological patterns in patients with RP-ILD [14 of 16 (87.5%)] was significantly higher than that in patients with chronic ILD [6 of 18 (33.3%)]. CADM patients with RP-ILD more frequently had an OP/OP + NSIP radiological patterns of HRCT (P = 0.004). Also, the rate of the lower lung zone consolidation among patients with RP-ILD was significantly higher than that in patients with chronic ILD [14 of 16 (87.5%) vs 7 of 18 (38.8%), P = 0.008].
The frequency of OP/OP + NSIP radiological patterns of HRCT in patients with elevated CEA level group [16 of 18 (87.5%)] was significantly higher than in patients with chronic ILD [6 of 18 (33.3%)]. Patients with elevated CEA level more frequently had an OP/OP + NSIP radiological patterns of HRCT (P = 0.001). Also, the frequency of the lower lung zone consolidation among patients with elevated CEA level was significantly higher than that in patients in the non-elevated CEA group [16 of 18 (88.8%) vs 4 of 16 (25.0%), P = 0.002]. The mean CEA level of OP/OP + NSIP radiological patterns was higher than that with NSIP radiological pattern [16.16 (5.47) vs 3.29 (0.86) μg/l, P < 0.001]. The mean CEA level of the lower lung zone consolidation was higher than that without the lower lung zone consolidation [15.62 (5.23) vs 3.85 (0.94) μg/l, P < 0.001].
Survival
The 20-week cumulative survival rate for patients with CADM but without RP-ILD was 100%, while the rate of patients with CADM and RP-ILD was only 13.3% (P < 0.001) (Fig. 2A). To define the optimal cut-off point with the highest diagnostic accuracy, we performed receiver operating characteristic analysis of distinct serum CEA concentrations. The highest area under the curve was calculated for a baseline serum CEA concentration of 8.75 μg/l. The two subsets were classified by serum CEA concentration of 8.75 μg/l (sensitivity 0.69; specificity 0.88). Within 20 weeks, the cumulative survival rate was significantly lower in patients with a CEA level >8.75 μg/l than that in patients with a CEA level <8.75 μg/l (31.6 vs 68.4%, P < 0.001; Fig. 2B).
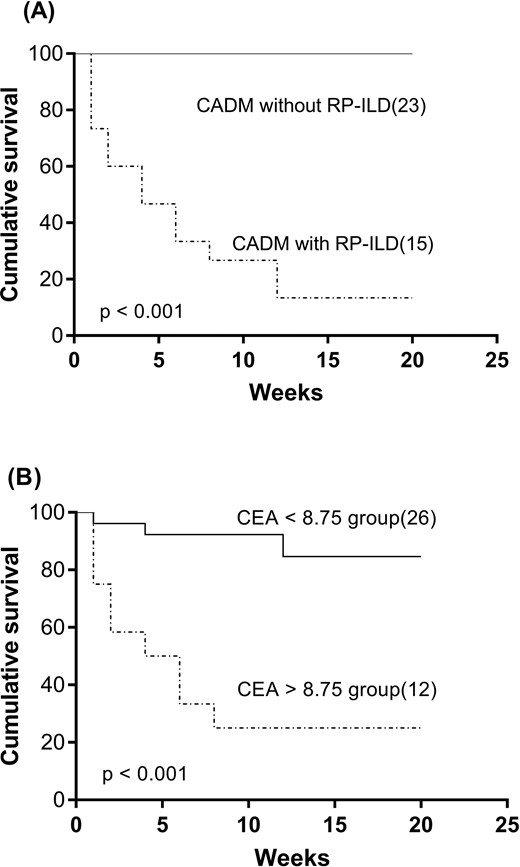
The cumulative 20-week survival rate in different groups
(A) The cumulative survival rate was significantly lower in patients with RP-ILD than in those without RP-ILD (13.3 vs 100%, P < 0.001). (B) The cumulative survival rate was significantly lower in the group with a CEA level >8.75 μg/l than in those with a CEA level <8.75 μg/l (31.6 vs 68.4%, P < 0.001). CEA: carcinoembryonic antigen; RP-ILD: rapidly progressive interstitial lung disease.
Discussion
In the present study, we demonstrated that high serum CEA levels were associated with RP-ILD in Chinese patients with CADM. Serum CEA levels were also associated with several clinical factors related to RP-ILD and a poor prognosis.
Although serum CEA level is a diagnostic biomarker for cancer, it was revealed that an elevated serum CEA level may be associated with inflammatory diseases [17, 18]. CEA levels were higher in CTD patients with ILD as well as RA patients [10, 19]. Some studies showed that serum CEA levels were correlated with the severity of idiopathic pulmonary fibrosis [10, 17, 18]. Zuo et al. described that the OP/OP + NSIP radiological pattern and the lower lung zone consolidation in HRCT were correlated with RP-ILD in DM patients [14]. Consistent with the previous study, our findings illustrated that CEA levels were correlated with CT scores in CADM. In the present study, however, we added additional evidence of CEA on the clinical implications and prognosis in CADM-related RP-ILD. Meanwhile, we provided evidence that CEA was related to different radiological patterns, especially the more severe and poor prognosis patterns such as the OP/OP + NSIP radiological pattern and the lower lung zone consolidation pattern. In our study, serum CEA elevation occurred in 87.5% of CADM patients with RP-ILD. Furthermore, the CEA level was a powerful indicator of RP-ILD and prognosis in CADM patients. These findings indicate that CEA may be a potential marker for predicting ILD severity and CADM prognosis. Additionally, our research was conducted in Chinese CADM patients. Compared with DM, the high incidence of RP-ILD enhanced the predictive value of CEA in CADM. In our study, the CEA levels were significantly increased in CADM patients compared with SLE controls, suggesting that it may be a useful marker for differential CADM from SLE.
In our study, patients with RP-ILD had significantly higher serum ferritin, ALT, AST and LDH levels than patients without RP-ILD. CEA level was associated with the levels of these parameters and CT scores. It was demonstrated that the serum level of ferritin, a key biomarker of macrophage activation syndrome, was a predictive indicator of RP-ILD [20, 21]. Also, liver dysfunction in DM patients was related to anti-melanoma differentiation-associated gene 5, which was significantly associated with RP-ILD [16]. We speculate that macrophages may participate in the pathogenesis of multiple organelle systems in CADM and would result in elevated serum ferritin levels, RP-ILD and liver dysfunction. Macrophages such as Kupffer cell are activated and lead to liver injury and elevated ALT and AST levels, while alveolar macrophages are activated and cause neutrophil activation, leading to lung fibrosis. The association between CEA levels and these parameters added further evidence that CEA level may be related to inflammatory disease severity.
We also analysed the relationship between CT radiological patterns and CEA levels. It has been reported that OP/OP + NSIP radiological pattern and the lower lung zone consolidation on HRCT was strongly correlated with RP-ILD in patients with DM [14, 22]. In our study, RP-ILD was strongly associated with OP/OP + NSIP radiological patterns and the lower lung zone consolidation, which was consistent with previous studies. Our study further confirmed that the OP/OP + NSIP radiological patterns and the lower lung zone consolidation of HRCT related to higher incidence of elevated CEA level and significantly higher mean CEA levels. These results not only added to the evidence that CEA levels are related to the severity of ILD, but more importantly, they elucidated the predictive value of CEA level in different radiological patterns of ILD in CADM.
The mechanism of CEA elevation in CADM patients with RP-ILD remains unclear. Macrophage activation is involved in the pathogenesis of DM. CD163-positive macrophages were found to infiltrate the muscles and lungs of patients with DM-related ILD [23–25]. We speculate that CEA may bind with its receptor on macrophages or Kupffer cells and cause activation and production of pro-inflammatory and anti-inflammatory cytokines including IL-1, IL-10, IL-6 and TNF-α in CADM patients [26]. These inflammatory cytokines stimulate neutrophils to induce the fibrosis process in the lungs of CADM patients with RP-ILD [11, 27].
The present study has several limitations. First, it was small and retrospective. Large prospective cohort studies should be performed to confirm our preliminary results. Second, we provided evidence that baseline CEA level is related to RP-ILD, but further studies are needed to prove the dynamic changes of CEA levels during RP-ILD progression.
In conclusion, we report here that an elevated CEA level was common in Chinese patients with CADM. CEA level is a powerful indicator of RP-ILD and prognosis of in Chinese patients with CADM.
Acknowledgements
D.Z. was responsible for the original draft preparation and methodology, and for reviewing and editing the methodology. S.T. and Y.P. carried out data curation, and were involved in the original draft preparation. S.L. and C.Y. performed validation and formal analysis. H.F. and J.Q. were involved in the study conceptualization and the methodology, and in reviewing and editing.
Funding: This study was supported by The National Natural Science Foundation of China (grant no. 81972931).
Disclosure statement: The authors declare no conflicts of interest.
Data availability statement
The data underlying this article will be shared upon reasonable request to the corresponding author.
Supplementary data
Supplementary data are available at Rheumatology online.
References
American Thoracic Society; European Respiratory Society.

Comments