


Abstract
RA patients often present with low muscle mass and decreased strength. Quantitative MRI offers a non-invasive measurement of muscle status. This study assessed whether MRI-based measurements of T2, fat fraction, diffusion tensor imaging and muscle volume can detect differences between the thigh muscles of RA patients and healthy controls, and assessed the muscle phenotype of different disease stages.
Thirty-nine RA patients (13 ‘new RA’—newly diagnosed, treatment naïve, 13 ‘active RA’—persistent DAS28 >3.2 for >1 year, 13 ‘remission RA’—persistent DAS28 <2.6 for >1 year) and 13 age and gender directly matched healthy controls had an MRI scan of their dominant thigh. All participants had knee extension and flexion torque and grip strength measured.
MRI T2 and fat fraction were higher in the three groups of RA patients compared with healthy controls in the thigh muscles. There were no clinically meaningful differences in the mean diffusivity. The muscle volume, handgrip strength, knee extension and flexion were lower in all three groups of RA patients compared with healthy controls.
Quantitative MRI and muscle strength measurements can potentially detect differences within the muscles between RA patients and healthy controls. These differences may be seen in RA patients who are yet to start treatment, those with persistent active disease, and those who were in clinical remission. This suggests that the muscles in RA patients are affected in the early stages of the disease and that signs of muscle pathology and muscle weakness are still observed in clinical remission.
RA is associated with altered body composition, which can result in rheumatoid cachexia.
Muscle deteriorates in early disease in RA as assessed by quantitative MRI.
Signs of muscle pathology and weakness are still observed in rheumatoid patients in clinical remission.
Introduction
RA is a chronic, progressive, autoimmune, inflammatory disease with a prevalence of 0.8% in the UK [1]. The aim is to diagnose and treat at the earliest opportunity in order to to achieve clinical remission. Remission is associated with improved function and reduced radiographic progression. As well as joint damage, RA is also associated with altered body composition [2]. This could be due to an inactive lifestyle as a result of the disease, drug-induced myopathies [3, 4] and the activation of the nuclear factor kappa-beta pathway, which triggers metabolic alterations leading to the degradation of muscle tissue [5]. Furthermore, the production of TNF-α and other inflammatory cytokines that are critical to the pathogenesis of RA are reported to have catabolic effects on skeletal muscle [6]. These combined factors can result in rheumatoid cachexia (RC) [7–10]. RC is characterized by the loss of muscle mass (muscle atrophy), changes in muscle fibre, increased inflammatory biomarkers in the muscle and decreased strength, with the preservation, or increase, of fat mass [8]. The prevalence of RC is not known as there is no consensus on its definition and assessment. However, ∼40% of patients with active disease suffer from RC [11], making it one of the most common complications of RA. RC has been shown to be associated with increased disease severity, reduced quality of life, increased fatigue and increased morbidity and mortality, and can accelerate age-related sarcopenia [9, 12–14]. Therefore, muscle health is an important aspect of RA that should be considered. It is currently unknown at what stage muscle involvement begins in RA patients, and whether the muscle damage that is caused by the disease is reversed when patients achieve disease remission.
The literature explaining the benefits of exercise in patients with RA has grown in recent years. Evidence suggests exercise has anti-inflammatory effects due to the breakdown of fat, increasing the regulatory properties of the immune system and decreasing systemic markers of inflammation, such as ESR [15, 16].
It has been demonstrated that aerobic and muscle strengthening exercise increases physical function and decreases pain, fatigue, disease activity and disability [15, 17–20]. Therefore, it has been proposed that exercise should be included in the routine management of RA [21–24]. However, the amount of exercise performed among patients with RA is lower than the level recommended by international guidelines [25, 26]. This reduced level of physical activity among RA patients is often due to the misconception that exercise may further damage the joints [18, 27–29].
Imaging techniques such as quantitative MRI can measure non-invasively the biomarkers associated with RC, such as inflammation (oedema), fatty infiltration (myosteatosis), alterations in muscle fibres and muscle atrophy, and may be able to provide further information regarding muscle health in RA patients. This could improve understanding of muscle involvement in RA and aid in the development of preventative and therapeutic strategies, such as exercise, medication and supplements.
Quantitative T2 measurements in MRI can be measured using a spin echo MRI pulse-sequence with multiple echo times. MRI T2 measurements are sensitive to fluid, which can be related to physiological or pathological changes at the macromolecular level [30]. This is regarded as an indirect measure of inflammation and may have a role in the identification of muscle inflammation and oedema [31]. MR-based muscle fat fraction measurements can be made by exploiting the fact that water and fat have different resonance frequencies. They provide a measurement for the proportion of fat in a given voxel and are useful for identifying myosteatosis in the muscle [32]. Diffusion tensor imaging techniques can characterize the degree and direction of water diffusion in the muscle. Diffusion is restricted to a different degree in different fibres, therefore diffusion tensor imaging is sensitive to changes in muscle microstructure. All three measurements have excellent repeatability [33].
The aim of this study was to obtain preliminary data comparing quantitative MRI measurements between RA patients who were newly diagnosed, or with persistent active disease, and in clinical remission with healthy controls. The purpose was to estimate the extent to which muscle state may differ from health in these different stages of RA progression.
Methods
Study design
This study was a cross-sectional pilot study conducted at the Leeds Teaching Hospitals NHS Trust (LTHT). Recruitment began in May 2017 and ended in December 2018. Participants were recruited into the Magnetic resonance imaging and UltraSound CLinical Evaluation of muscle pathology (MUSCLE) study, which was approved by the local research ethics committee (17/EM/0079), and all participants provided written informed consent. Fifty-two participants were recruited into four separate groups of 13 participants each: Group 1—new RA, treatment naïve; Group 2—RA with persistent active disease for at least 1 year; Group 3—RA in sustained remission for at least 1 year; and Group 4—healthy controls.
RA groups were age and gender matched. Healthy controls were recruited to match the RA patients. The sample size was chosen based on guidelines of between 12 and 30 participants per group for pilot studies [34, 35]. RA patients were recruited from clinics at Chapel Allerton Hospital. Clinical parameters collected included: BMI, 28-jont DAS (DAS28), early morning stiffness, medication, disease duration, patient global assessment of disease activity visual analogue scale and inflammatory markers. RA patients had an established diagnosis of RA based on the 2010 ACR/EULAR classification criteria [36]. Patients were classified as (1) ‘new RA’ if they were newly diagnosed with RA and had not previously taken DMARDs or steroids. Patients were classed as (2) ‘active RA’ if they had a diagnosis of RA for >1 year, had DAS28 >3.2 at the time of recruitment and had at least two of the following markers of active disease within the past 12 months: (2.1) raised inflammatory markers; (2.2) requiring steroid therapy; (2.3) DAS >3.2 at a second time point within 12 months; (2.4) escalation to or recent changes in biologic medication. Patients were classed as (3) ‘remission RA’ patients if they had had a diagnosis of RA for >1 year and were in clinical remission for the past 12 months determined by clinical opinion and a DAS28 <2.6 at the time of recruitment and without a DAS28 >2.6 in the past 12 months. Healthy participants were recruited from e-mail and posters advertisements around the hospital. Inclusion criteria for healthy controls were: (i) being asymptomatic of muscle disease; (ii) no previous history of musculoskeletal or rheumatic disorders; (iii) not currently taking or previously taken CS treatment within the past 3 years with doses >5 mg/day; (iv) not currently taking or previously taken HMG-CoA reductase inhibitors for the past 3 years. These criteria were ascertained by self-report or patient health record. Exclusion criteria for participants were age <18 years, contraindications to MRI, previous history of muscle disorder, spinal disease or neuropathy.
Magnetic resonance imaging measurements
MR data were acquired using a MAGNETOM Verio 3 T MR scanner (Siemens Healthcare, Erlangen, Germany). Two small four-channel flex coils were wrapped around the dominant thigh and placed with the distal end of both coils positioned 4 cm from the superior edge of the patella. Participants advised what their dominant leg was. If the participant was uncertain, the right leg was chosen by default. Fat fraction, T2, mean diffusivity and fractional anisotropy were measured in the hamstrings and quadriceps.
As previously published [33], fat quantitation was performed using a 40-slice, volume-interpolated breath-hold examination (VIBE), 2-point Dixon sequence. T2, fat fraction and diffusion measurements used one slice (slice 20) and muscle volume measurements used the 30 central slices. Two-point VIBE Dixon was selected because of its wide availability and well documented recent use in the muscle [37–43]. Diffusion-weighted images were acquired using a STimulated Echo Aquisition Mode (STEAM) prototype sequence with an echo-planar imaging readout [44] with SPAIR (spectral adiabatic inversion recovery) fat suppression [33].
For T2 measurements axial images were obtained using a T2-weighted, multi-echo, spin-echo sequence with SPAIR fat suppression with an echo train length 16, and echo times of 9.6, 19.2, 28.8, 38.4, 48.0, 57.6, 67.2, 76.8, 86.4, 96.0, 105.6, 115.2, 124.8, 134.4, 144.0 and 153.6 ms, repetition time of 1500 ms, slice thickness 5 mm, matrix 256 × 256, number of averages = 1, with a field of view of 300 × 300mm. To calculate T2 values the signal intensity vs echo time decay curves from each region of interest were fitted with a mono-exponential function. To reduce the effect of additional signal from stimulated echoes the signal from the earliest time point was excluded from the fit [45].
Muscle volume estimates were obtained using a semi-automated algorithm that used fat fraction maps generated from the VIBE Dixon volume. The algorithm defined a muscle voxel as any voxel within the thigh with a fat fraction of <50%, excluding bone. To exclude muscle from the contralateral leg, a bounding box was automatically defined around the imaged leg using a threshold derived from a histogram of the image signal intensities. To exclude bone from the image, a seed point was manually placed within the bone on the central slice of the VIBE Dixon volume. A 3D connected components algorithm (bwconncomp, MATLAB, Mathworks, Nattick, MA, USA) was then used to grow a region within the extent of the bone. The in-phase Dixon image was used for this step because of the excellent contrast between the bright bone marrow and the dark, surrounding cortical bone. Finally, a mask defining the muscle was obtained by thresholding, with a fat fraction threshold of 50%, excluding voxels within bone, surrounding air and contralateral leg. The threshold of <50% fat fraction was chosen as it has been previously used in muscle volume measurements in the lumbar multifidus [46, 47] and erector spinae muscles [48, 49], and no previously used threshold values have been used in the muscles of the thigh. Muscle masks were only defined between slice 5–35 of the 40-slice volume to avoid errors due to signal drop-off at the outer extremities of the receive coil. The volume was defined as the number of voxels in the muscle mask multiplied by the voxel size, multiplied by the slice width.
Muscle strength assessments
Knee extension and flexion isokinetic assessment of the dominant thigh were performed following MRI examination at a controlled room temperature of 20°C using an isokinetic biodex system 4-muscle testing and rehabilitation isokinetic dynamometer (IPRS Mediquipe Ltd, Little Blakenham, Suffolk, UK). Participants were instructed to refrain from strenuous physical activity for 24 h prior to the examination. After a standardized warm-up, participants were positioned on the equipment according to the manufacturer’s instructions. Gravitational correction was performed at 180°. Isokinetic knee extension-flexion (concentric-concentric) at 60°/s was used to collect data. Participants performed three maximum effort repetitions for three sets, separated by a 30 s rest interval. Measurements were recorded between 0° and 135° as determined by manufacturer guidelines. Standardized verbal stimuli were provided throughout the evaluation. Strength (Nm) was the assessed variable. Alongside knee flexion and extension, handgrip strength (kg) was measured using a Jamar plus isokinetic dynamometer (Patterson Medical, Cedarburg, Wisconsin). Participants had their grip strength measured in their right hand for three sets and the mean measurement was taken.
Statistical analyses
Offline image analysis was performed using MATLAB software (R2018b, Mathworks, Nattick, MA, USA). Statistical analyses were performed using SPSS (IBM SPSS Statistics for Windows, Version 25.0, IBM Corp., Armonk, NY, USA). One-way analysis of variance with Dunnett’s post hoc analysis was used to test for significant differences in quantitative MR and muscle strength measurements between the disease stages. Spearman’s rank correlation was used to measure correlation. We utilized rs-values ≥0.7 as indicative of a strong correlation and rs ≥ 0.4 as indicative of a weak correlation [50]. Although P-values have been presented as a guideline, primary emphasis has been placed on descriptive data throughout.
Results
There were 75 patients recruited into the MUSCLE study who had RA. No patients declined to take part. The patients were categorized into the three groups of RA. There were 27 newly diagnosed RA, 13 with active disease and 35 patients in clinical remission. To enable age and gender matching, all groups were matched with the 13 RA patients with active disease, to result in 52 participants in total with 13 in each of the three RA groups and 13 in the healthy control group for statistical analysis.
Each group consisted of 10 females and 3 males (Table 1). At the time of the study, the 26 RA patients with active disease and those in remission were on the following therapies: prednisolone 5/26 (19.2%), HCQ 5/26 (19.2%), MTX 16/26 (61.5%), rituximab 4/26 (15.4%), tofacitinib 1/26 (3.8%), etanercept 1/26 (3.8%), infliximab 1/26 (3.8%) and adalimumab 2/26 (7.7%). Eleven of 39 (28%) of the patients were on lipid-lowering therapy (three new RA: one each on simvastatin, atorvastatin and ezetimibe; three active RA: one simvastatin, two atorvastatin; five remission RA: three simvastatin, two atorvastatin). Most of the patients were receiving a combination of some of the above therapies. Patients who were newly diagnosed and healthy controls were on no treatment. Quantitative MRI and muscle strength for the healthy controls and RA groups are presented in Tables 2 and 3. The results of the one-way analysis of variance demonstrated significant differences between the four disease groups in T2, fat fraction and muscle volume, but no significant difference in mean diffusivity or fractional anisotropy. The CIs around the differences between the four disease groups excluded 0 and included clinically meaningful differences [51], providing preliminary proof-of-concept of differences that would merit further investigation.
Participant characteristics [mean (s.d.)]
| Healthy controls | New diagnosis | Active disease | Remission | Difference (P-value) | |
|---|---|---|---|---|---|
| Age (years) | 64 (10) | 63 (15) | 65 (10) | 67 (19) | 0.2 |
| Weight (kg) | 71.4 (35) | 78.6 (26) | 77.5 (25) | 68.3 (26) | 0.06 |
| Height (cm) | 164.5 (20) | 160 (22) | 164 (27) | 166 (14) | 0.2 |
| BMI (kg/m2) | 25 (5) | 29 (10) | 33 (11) | 24 (6) | 0.03 |
| DAS28 | N/A | 5.2 (3) | 4.8 (3) | 1.7 (0.7) | <0.001 |
| Patient visual analogue scale (out of 100) | N/A | 39 (30) | 45.8 (25) | 12 (12) | <0.001 |
| CRP (4 mg/l) | N/A | 17. (11) | 31.5 (59) | 12.1 (7) | 0.1 |
| ESR (mm/h) | N/A | 41.1 (31) | 16 (29) | 10.6 (28) | <0.001 |
| Early morning stiffness (min) | N/A | 63 (58) | 71 (289) | 2 (13) | <0.001 |
| Disease duration (months) | N/A | N/A | 123 (20) | 74 (35) | 0.001 |
N/A: not applicable.
Quantitative MRI measurements with post hoc Dunnets t test to determine significance
| T2 (ms) | Fat fraction (%) | Mean diffusivity (×10–3 mm2s-1) | Fractional anisotropy | |||||
|---|---|---|---|---|---|---|---|---|
| Mean (95% CI) | P- value | Mean (95% CI) | P- value | Mean (95% CI) | P- value | Mean (95% CI) | P- value | |
| Hamstrings | ||||||||
| Healthy control | 39.3 (38.7, 39.9) | 4.7 (2.9, 6.4) | 1.34 (1.28, 1.40) | 0.39 (0.36, 0.44) | ||||
| New RA | 43.8 (42.2, 45.3) | 7.7 (6.3, 9.1) | 1.32 (1.27, 1.37) | 0.37 (0.34, 0.39) | ||||
| Active RA | 42.3 (41.1, 43.5) | 6.8 (6.8, 11.1) | 1.30 (1.27, 1.33) | 0.40 (0.38, 0.42) | ||||
| Remission RA | 44.3 (43.0, 45.5) | 8.9 (7.2, 10.6) | 1.31 (1.27, 1.34) | 0.34 (0.3, 0.38) | ||||
| <0.001 | 0.02 | 0.6 | 0.02 | |||||
| Quadriceps | ||||||||
| Healthy control | 39.1 (38.6, 39.7) | 4.4 (3.7, 5.2) | 1.36 (1.26, 1.44) | 0.33 (0.30, 0.36) | ||||
| New RA | 41.1 (39.6, 42.6) | 9.1 (7.2, 11.0) | 1.29 (1.27, 1.32) | 0.40 (0.36, 0.42) | ||||
| Active RA | 42.8 (41.9, 43.8) | 7.3 (6.4, 8.1) | 1.31 (1.29, 1.34) | 0.35 (0.33, 0.37) | ||||
| Remission RA | 40.6 (39.4, 31.9) | 8.9 (7.4, 10.3) | 1.32 (1.24, 1.40) | 0.39 (0.38, 0.42) | ||||
| 0.02 | <0.001 | 0.5 | <0.001 | |||||
Muscle volume, knee extension and flexion power and handgrip strength measurements with post hoc Dunnets t test
| Muscle volume (cm3) | Flexion strength (Nm) | Extension strength (Nm) | Handgrip strength (kg) | |||||
|---|---|---|---|---|---|---|---|---|
| Mean (95% CI) | P-value | Mean (95% CI) | P-value | Mean (95% CI) | P-value | Mean (95% CI) | P-value | |
| Healthy control | 1453.5 (1258.9, 1648.2) | 51.8 (43,3, 60.1) | 82.1 (66.1, 98.1) | 30.8 (28.9, 32.8) | ||||
| New RA | 936.2 (841.2, 1031.3) | 33.4 (25.9, 40.8) | 71.1 (52.2, 89.9) | 12.8 (11.1, 14.15) | ||||
| Active RA | 1083.0 (984.2, 1181.8) | 41.7 (26.6, 56.9) | 62.5 (38.5, 86.6) | 17.2 (12.5, 21.8) | ||||
| Remission RA | 1141.2 (962.2, 1320.4) | 38.5 (26.8, 50.2) | 76.4 (55.2, 97.5) | 28.9 (23.4, 32.7) | ||||
| <0.001 | 0.03 | 0.5 | <0.001 | |||||
Knee flexion and knee extension correlated with muscle volume (rs = 0.7, P < 0.001; rs = 0.7, P < 0.001), and demonstrated a potential weak correlation with T2 (rs = −0.4, P = 0.05; rs = −0.4, P = 0.04) and fat fraction (rs = −0.4, P = 0.05; rs = −0.4, P = 0.04). There was no evidence for a correlation with mean diffusivity (rs = 0.2, P = 0.1; rs = −0.1, P = 0.4) and fractional anisotropy (rs = −0.3, P = 0.05; rs = −0.3, P = 0.05).
Muscle T2
T2 was higher in all RA groups compared with healthy controls, demonstrating muscle inflammation. Within the hamstrings, differences between healthy controls vs new patients, active patients and remission patients were 4.5 ms (95% CI: 2.5, 6.4; P < 0.001), 3 ms (95% CI: 1.1, 4.9; P = 0.001) and 5.0 ms (95% CI: 3.0, 6.4; P < 0.001), respectively. Within the quadriceps, differences were 2.6 ms (95% CI: 0.2, 3.7; P = 0.02), 3.6 ms (95% CI: 1.9, 5.4; P < 0.001) and 1.5 ms (95% CI: −0.3, 3.3; P = 0.1), respectively (Fig. 1).
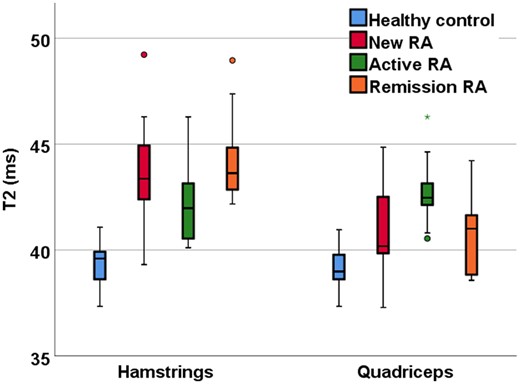
Quantitative T2 MRI measurements of RA patients and healthy controls
Mean diffusivity
For mean diffusivity, CIs around the differences for all RA groups compared with healthy controls included 0 and did not include clinically meaningful differences. Within the hamstrings, differences between healthy controls vs new patients, active patients, and remission patients were 0.02 × 10⁻³ mm2s-1 (95% CI: 0, 0.05; P = 0.9), 0.04 × 10⁻³ mm2s-1 (95% CI: −0.1, 0.07; P = 0.4) and 0.03 × 10⁻³ mm2s-1 (95% CI: 0, 0.04; P = 0.6), respectively. Within the quadriceps, differences were 0.07 × 10⁻³ mm2s-1 (95% CI: −0.16, 0.04; P = 0.3), 0.05 × 10⁻³ mm2s-1 (95% CI: −0.14, 0.06; P = 0.6) and 0.04 × 10⁻³ mm2s-1 (95% CI: −0.1, 0.06; P = 0.7), respectively.
Fractional anisotropy
There were no meaningful differences in fractional anisotropy between RA patients and healthy controls. Within the hamstrings, differences between healthy controls vs new patients, active patients and remission patients were 0.02 (95% CI: −0.08, 0.02; P = 0.4), 0.01 (95% CI: −0.05, 0.06; P = 0.9) and 0.05 (95% CI: −0.1, 0.004; P = 0.03), respectively. Within the quadriceps differences were 0.07 (95% CI: 0.03, 0.1; P = 0.01), 0.02 (95% CI: −0.02, 0.06; P = 0.6) and 0.06 (95% CI: 0.02, 0.1; P = 0.01), respectively.
Muscle fat fraction
Fat fraction was higher in all RA groups compared with healthy controls, demonstrating fatty infiltration due to RA. Within the hamstrings, differences between healthy controls vs new patients, active patients and remission patients were 3.0% (95% CI: 0.2, 5.8; P = 0.03), 4.2% (95% CI: 1.6, 6.8; P = 0.002) and 4.2% (95% CI: 1.4, 7.0; P = 0.002), respectively. Within the quadriceps differences were 4.6% (95% CI: 2.7, 6.5; P < 0.001), 2.7% (95% CI: 1.6, 3.9; P < 0.001) and 4.9% (95% CI: 2.8, 5.9; P < 0.001), respectively (Fig. 2).
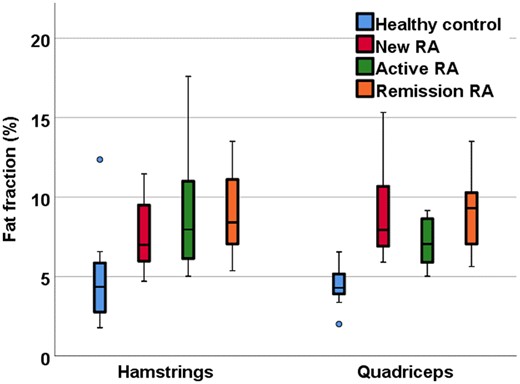
Quantitative fat fraction MRI in RA patients and healthy controls
Muscle volume
Muscle volume was lower in all RA groups compared with healthy controls, demonstrating muscle atrophy in RA. Within the thigh differences between healthy controls vs new patients, active patients and remission patients were −517.3 cm3 (−751, −283; P < 0.001), −370.5 cm3 (95% CI: −605, −136; P = 0.001) and −312.3 cm3 (95% CI: −546. −77; P = 0.006), respectively (Fig. 3).
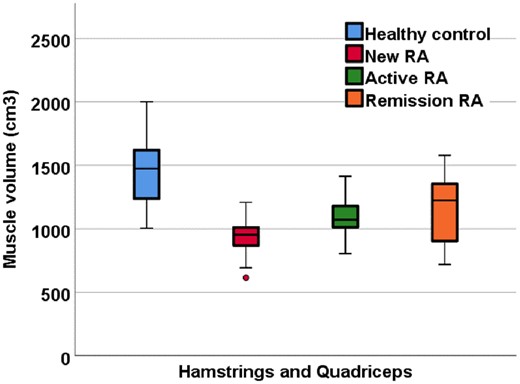
Quantitative muscle volume MRI measurements in RA patients and healthy controls
Muscle strength assessments
Muscle strength was lower in new RA compared with healthy controls, demonstrating a decrease in strength due to RA, however CIs for active and remission patients included 0. Peak flexion (hamstrings) differences between healthy controls vs new patients, active patients and remission patients were 18.4 Nm (95% CI: −35, −1; P = 0.03), 10.1 Nm (95% CI: −27, 7; P = 0.3) and 13.3 Nm (95% CI: −33, 0; P = 0.1), respectively. Peak extension (quadriceps) differences between healthy controls vs new patients, active patients and remission patients were 11 Nm (95% CI: −45, 22; P = 0.7), 19.6 Nm (95% CI: −52.7, 12.5; P = 0.3) and 5.7 Nm (95% CI: −40, 28; P = 0.9), respectively. Grip strength differences between healthy controls vs new patients, active patients and remission patients were 18 kg (95% CI: −26, −10; P < 0.001), 13.6 kg (95% CI; −22, 05; P < 0.001) and 1.9 kg (95% CI: −10, 5; P = 0.8), respectively.
Discussion
This study suggests that muscle health may be affected in RA patients from time of diagnosis compared with age- and gender-matched healthy controls. It provides preliminary evidence that muscle health may not return to normal as determined by quantitative MRI and strength even when patients achieve clinical remission. We have provided proof-of-concept that there may be differences in quantitative MRI measurements of the thigh and muscle strength between RA patients and healthy controls. These differences were detectable in new, active and remission disease states. Our results suggest that muscle changes may occur in the early stages of RA and persist throughout the disease duration, even in long-term clinical remission. This means that current RA treatment may not be influencing the pathology affecting the muscle and it may be important to include muscle strengthening interventions in the treatment pathway for RA. If these preliminary results are confirmed, then MRI has potential as a diagnostic guide and management tool in the assessment of muscles of RA patients.
T2 measurements were raised in RA groups compared with healthy controls, suggesting the identification of increased oedema in RA patients [52]. It must also be considered that T2 measurements will be identifying fat as well as oedema, due to the fat suppression not suppressing olefinic fat, therefore we interpret T2 as muscle oedema and fatty infiltration.
In this pilot sample, fat fraction was increased in RA groups compared with healthy controls consistent with known fatty infiltration in the muscle of RA patients. This supports previous work using CT scans which determined that skeletal muscle fat is higher in individuals with RA compared with healthy controls. They also found that patients with RA present with similar fatty infiltration as older individuals [53]. This suggests that RA may mimic a premature aging process within the muscle. This is important to consider, as muscles that could be perceived as undergoing fat accumulation due to age are in fact undergoing pathological changes due to the disease.
Muscle volume measurements suggested clinically significant differences between all the RA groups compared with healthy controls. This agrees with Baker et al. [54], who showed that RA patients have significant skeletal muscle mass deficit compared with healthy controls, which results in a decrease in strength. However, Helliwell and Jackson [55] demonstrated that the reduction in strength occurs at a faster rate than the loss of muscle mass, demonstrating the importance of assessing not only muscle mass, but also muscle strength. We found that muscle strength was lower in all RA groups compared with healthy controls, even in patients who had achieved long-term remission, while muscle volume was lower in all patients, including newly diagnosed treatment-naïve patients. Our results suggested the difference was smallest for those in clinical remission, but this may still be meaningful compared with healthy controls. In addition, for the first time, this study has shown that muscle volume measured with MRI correlates with muscle strength in RA patients. This suggests that muscle volume is a patient-relevant assessment tool. Mean diffusivity did not show clinically significant differences in RA patients compared with healthy controls. Given that T2 was higher in RA, one might expect to see raised mean diffusivity due to increased fluid. However, the increased fatty infiltration seen could also restrict diffusion. Our results suggest that diffusion measurements should be used with caution in the study of RA as the competing influence of fat and oedema can reduce the overall sensitivity of the measurement. Our results were consistent with reduced fractional anisotropy in the quadriceps in RA patients. This could have been due to the atrophy of type II muscle fibres, which are found in greater quantity in the quadriceps compared with the hamstrings [56], caused by the denervation of motor units, which has been demonstrated to occur in RA patients [57].
Handgrip strength and knee extension and flexion were lower in RA groups compared with healthy controls. This could be due to a sedentary lifestyle, joint deformity, pain and stiffness, which are factors associated with muscle deconditioning, muscle wasting and subsequent weakness in RA.
Although the patients in clinical remission had better clinical outcomes, their muscle strength and quantitative MRI were not markedly better. This suggests that although treatment is effective in improving disease activity (DAS28) and increasing physical function, even those with well controlled disease who are in clinical remission are still significantly weaker than age- and gender-matched healthy controls. Therefore, future RA therapies could trial strategies such as the use of exercise interventions to improve the muscle health of RA patients.
As the diffusion measurements in skeletal muscle did not appear to be altered in RA, future quantitative MRI research should focus on T2, fat fraction and muscle volume measurements in RA patients, as the development of muscle-related interventions for RA patients is an important aspect.
Our study is subject to some limitations. The patients with active drug-resistant RA had a longer disease duration than the patients in clinical remission, which may increase the likelihood of the effect of the disease and medication on the muscles assessed by quantitative MRI measurements; however, there was no correlation between any quantitative MRI parameters and disease duration (T2: rs = 0.04, P = 0.7; fat fraction: rs = 0.01, P = 0.09; mean diffusivity: rs = 0.09, P = 0.5; fractional anisotropy; rs = −0.1, P = 0.1; muscle volume: rs = 0.1, P = 0.4). The 2-point Dixon imaging technique did not correct for T2* effects, eddy currents, noise-related bias or the spectral complexity of fat. However, multiple studies have failed to show that the errors inherent to 2-point Dixon confound fat measurements in muscle in either ex vivo or in vivo analysis [39, 40, 42]. Furthermore, 2-point Dixon correlates strongly with confounder-corrected fat quantitation methods and with spectroscopy [39, 40]. The sample size, despite conforming to guidelines in powering future studies, was small. Our muscle volume estimates were taken over a constant leg length, at a set distance above the patella, and took no account of different heights or femur lengths between patients. Differences in shape and length of thigh muscles between patients will introduce variation in the muscle volume estimates that our study has not accounted towards. We attempted to control for these differences by positioning relative to an anatomical reference marker, with the distal end of both coils positioned 4 cm from the superior edge of the patella.
This study did not account for BMI, dyslipidaemia or physical activity levels of participants. This may have affected results, as it would be expected that overweight individuals, or those with high cholesterol, may have a lower muscle quality compared with individuals of a healthy weight or those who partake in regular physical activity. Of note is, while remission patients showed no difference in BMI compared with healthy controls, the MRI measurements could still detect differences. The duration of prednisolone treatment could additionally cause glucocorticoid-induced myopathy [58], but this study did not control for the duration of prednisolone therapy. Future research should consider controlling for duration of any glucocorticoid therapy, cholesterol, BMI and physical activity levels, such as measuring International Physical Activity Questionnaire scores [59].
In conclusion, this study provides evidence that muscle damage occurs in patients with RA, irrespective of disease phenotype, and that quantitative MRI is sensitive enough to identify these differences. These muscle changes are apparent even in early RA and muscles do not recover, even in sustained clinical remission, suggesting that RA induces long-term muscle damage. This muscle deterioration is measurable by MRI T2, fat fraction, muscle volume and muscle strength. There is evidence that physical activity and exercise helps maintain health and has a role in RA disease management [60]. Therefore, these quantitative MRI measures could be useful in monitoring muscle change in RA and assessing exercise interventions. Following on from the results of this preliminary study, future research should investigate how quantitative MRI can be used to further understand muscle changes in RA in relation to developing exercise interventions to restore muscle quality.
Acknowledgements
We are grateful to radiographer Dominic Bertham for carrying out the MR studies.
Funding: This paper presents independent research funded/supported by the National Institute for Health Research (NIHR) Leeds Biomedical Research Centre (BRC). The views expressed are those of the author(s) and not necessarily those of the NIHR or the Department of Health and Social Care. J.B. is funded by a National Institute for Health Research (NIHR) (and Health Education England) Clinical Lectureship.
Disclosure statement: The authors have declared no conflicts of interest.
References
World Health Organization.

Comments