


Abstract
The aim of this study was to show the usefulness of a mid-infrared fibre evanescent wave spectroscopy point of care device in the identification of septic arthritis patients in a multicentre cohort, and to apply this technology to clinical practice among physicians.
SF samples from 402 patients enrolled in a multicentre cohort were frozen for analysis by mid-infrared fibre evanescent wave spectroscopy. The calibration cohort was divided into two groups of patients (septic arthritis and non-septic arthritis) and relevant spectral variables were used for logistic regression model. Model performances were tested on an independent set of 86 freshly obtained SF samples from patients enrolled in a single-centre acute arthritis cohort and spectroscopic analyses performed at the patient’s bedside.
The model set-up, using frozen–thawed SFs, provided good performances, with area under the curve 0.95, sensitivity 0.90, specificity 0.90, positive predictive value 0.41 and negative predictive value 0.99. Performances obtained in the validation cohort were area under the curve 0.90, sensitivity 0.92, specificity 0.81, positive predictive value 0.46 and negative predictive value 0.98. The septic arthritis probability has been translated into a risk score from 0 to 4 according to septic risk. For a risk score of 0, the probability of identifying a septic patient is very low (negative predictive value of 1), whereas a risk score of 4 indicates very high risk of septic arthritis (positive predictive value of 1).
Mid-infrared fibre evanescent wave spectroscopy could distinguish septic from non-septic synovial arthritis fluids with good performances, and showed particular usefulness in ruling out septic arthritis. Our data supports the possibility of technology transfer.
ClinicalTrials.gov, http://clinicaltrials.gov, NCT02860871.
Septic arthritis diagnosis is a therapeutic emergency implying rapid treatment with antibiotics and hospitalization.
The study performed in a sizeable multicentre cohort showed that mid-infrared spectroscopy was useful.
The SynoFAST test could help to better monitor acute arthritis and permit prompter return home.
Introduction
Septic arthritis is a medical emergency that requires urgent management to avoid functional and even vital complications. Indeed, when the diagnosis is confirmed, patients require hospitalization and i.v. antibiotic therapy. To date, the diagnosis has been based on clinical judgement and cytobacteriological examination of the SF. Direct bacteriological examination after Gram staining of the SF can be obtained within a few hours but has been shown to lack sensitivity. The results of the SF cultures, the gold standard diagnosis tool, are only obtained after several days [1], and several hours for blood cultures [2]. While awaiting the SF and blood cultures, physicians managing patients with arthritis are faced with a dilemma: (i) a patient presenting septic arthritis should be hospitalized immediately and receive probabilistic i.v. antibiotic therapy to avoid any delay that could lead to complications; and (ii) a patient with arthritis not related to sepsis can return home with appropriate anti-inflammatory drugs to relieve the pain. Therefore, in case of acute arthritis, there is a need for a rapid, simple and reliable method enabling a decision to be made regarding the therapeutic option. A method is required to prevent both failure to identify septic arthritis, since it could potentially lead to major functional consequences, and overdiagnosis, which could trigger unnecessary hospitalization and unjustified treatment with consequences in terms of health and social costs.
Due to its abilities to reflect the molecular composition of a sample, the use of vibrational spectroscopy (infrared and Raman spectroscopies) for medical diagnoses has been investigated. However, they are all proof-of-concept, and few studies have validated their findings for use in a clinical environment. Most of them are focused on cancer diagnosis and few studies have been conducted in the field of rheumatology, including those identifying patients with RA from sera [3, 4]. The detection of bacterial infection by vibrational spectroscopy has been investigated in several studies, especially for the identification of bacterial strains after isolation; however, very few studies have investigated its usefulness for the detection of infection directly from biofluids before bacterial cultures and without PCR amplification [5, 6].
Our aim was to evaluate the ability of a new type of chalcogenide glass optical fibre to collect mid-infrared spectra of SFs in order to identify septic arthritis. The use of fibre for spectroscopy is known as fibre evanescent wave spectroscopy (FEWS): The evanescent wave is the part of the electromagnetic field that propagates at the surface of a fibre when the infrared beam is internally reflected at the fibre/air interface; the evanescent wave is absorbed by the chemical groups that are in close contact with the glass fibre. Thus, merely putting a complex biological sample in contact with the fibre enables collection of its absorption spectrum reflecting the chemical bonds present in the fluid, at the fibre output. Our team have previously shown the ability of the FEWS technology to discriminate thawed SFs of patients with septic arthritis from those of non-septic arthritis patients in a single-centre cohort study of 150 patients [7]. Since this first study, technological advances have been made to reduce the size of the spectrometer and to render its use possible as point-of-care device by people who are not specialists in spectroscopy [8].
To reach this objective, on a multicentre 402-patient cohort, the classification algorithm for septic arthritis discrimination from FEWS spectra acquired on SF was improved, and the performance was evaluated on freshly collected SF from another independent cohort of patients.
Methods
Patients
This cross-sectional study was in two parts: first a model calibration step on thawed SFs, second a performance evaluation step on freshly collected SFs.
In the first part, SF samples were collected prospectively from adult patients with joint effusion at the rheumatology departments of six hospitals in Brittany, France. Arthrocentesis was routinely carried out for diagnostic and therapeutic purposes, according to clinical guidelines. The remaining volumes of fluids were stored at –80°C in the Biological Resource Centre of Rennes University Hospital, until mid-infrared FEWS (MIR-FEWS) analysis.
In the second part of the study, SF samples were collected in a prospective manner from adult patients presenting with acute (<30 days) joint effusion at the Rheumatology Department of Rennes University Hospital, France. Arthrocentesis was routinely conducted for biological diagnosis and therapeutic purposes, according to clinical guidelines. The remaining volumes of fluids were used for immediate MIR-FEWS analysis in the Rheumatology Department of Rennes University Hospital.
Usual clinical and biological data were also collected for both cohorts.
The study was approved by the local ethics committee (Rennes University Hospital Ethical Committee, no. 13-38, 25 June 2010, and no. 16.96, 27 September 2016) and all patients gave their informed consent.
SF characterization and case definition
Standardized microscopic and bacteriological examinations of freshly collected SF samples were performed on all samples according to routine diagnostic procedures. A positive culture and/or 16S rRNA PCR was considered as the gold standard for the study [9, 10].
Mechanical, non-inflammatory fluids were defined as containing no more than 2000 leukocytes/mm3.
Inflammatory fluids (>2000 leukocytes/mm3) were classified as septic arthritis when a pathogenic bacterium was isolated from the joint by either culture or molecular biology [11].
SFs were classified as related to crystal-arthropathy when polarized light microscopy showed crystals (sodium urate indicating gout or calcium pyrophosphate indicating articular CPDD) and when microbiological cultures were negative.
SFs were classified as related to chronic joint inflammatory disease when no crystal was found, and microbiological cultures were negative, and the patient had a history of chronic inflammatory joint disease (e.g. RA, SpA, PsA).
MIR-FEWS analysis
Acquisition of mid-infrared spectra
Seven microliters of native SF (no pre-treatment) were deposited on the fibre optic disposable sensor (LS23) and MIR spectra were recorded using a DIAFIR SPID FT-IR spectrometer (Rennes, France). The pre-treatment of spectra has already been detailed in a previous study [12]. Infrared acquisitions on thawed SF were centralized for the calibration group. For the validation group infrared acquisitions were performed on freshly collected SF by physicians at Rennes Hospital.
Spectra analysis: diagnostic model construction
The statistical analyses of spectra aimed to identify patients with septic arthritis (according to the previously described criteria). A model estimation was run on the spectra of thawed SFs (calibration cohort) and validated on the spectra of freshly collected fluids (validation cohort).
The first step of spectra analysis was the selection of the most informative spectral variables for septic arthritis identification. Thus, the reduction of significant variables from the initial set of 615 absorbance measures (3800–950/cm with a 2800–1800/cm gap, a spectral step of 2cm–1) was achieved using variable reduction algorithms [Least absolute shrinkage and selection operator (LASSO), Random forest, factor adjusted discriminant analysis (FADA) and genetic algorithm]. Once the most discriminant set of variables was identified, a logistic regression model was run 100 times with Monte Carlo cross-validation on 30% of the total population and supervised attempts were made to further reduce and optimize this set of variables. Once the optimized variable set was defined, the logistic regression model was allocated and submitted to the validation group.
The result was a score between 0 (non-septic) and 1 (septic) expressing the probability of identifying septic patients. First, to assess the score performance, a threshold was chosen to maximize the sensitivity (>90%) and to have a correctly classified rate >75%.
Then, the probability was translated into a ‘risk score’, from 0 to 4, according to different thresholds, depending on the likelihood of identifying a septic patient. Thresholds were choosen according to negative predictive value (NPV) and positive predictive value (PPV) to define area and attribute point: 0 for ‘very low risk’ of identifying a septic patient (NPV of 100%), 1 for ‘low risk’ of identifying a septic patient (NPV >90%), 2 for an area of uncertainty (PPV between 40 and 65%), 3 for a ‘high risk’ to identify a septic patient (PPV >65%) and 4 for ‘very high risk’ to identify septic patient (PPV >90%).
The association of SF analysis by MIR-FEWS and reporting results as a risk score is named the ‘SynoFAST test’.
Statistical analysis
Continuous variables were summarized using medians and interquartile range. All variables were tested for normal distribution with the Shapiro–Wilk test. Comparisons were made using Student’s t-test for normally distributed data or with Mann–Whitney’s U test. Nominal data was tested using Fisher’s exact test.
Clinical variables associated with septic diagnosis with a P < 0.25 were included in a logistic regression multivariate analysis. Patients with missing values on clinical variables with P < 0.25 were suppressed for analysis.
The accuracy of the model based on spectral analysis was evaluated using the area under the curve and comparisons between the calibration and validation cohorts were made using Delong tests [13]. The stability of the prediction (CIs) for calibration and validation cohort was estimated by 2000 bootstrap repetitions (random sampling with replacement). All statistical analyses were conducted in R [14], and figures were produced with package pROC [15] and ggplot2 [16].
Results
Characteristics of patients
Patient demographic characteristics are reported in Table 1 for the calibration cohort and in the supplementary Table S1, available at Rheumatology online, for the validation cohort. In addition, comparison between the two cohorts is presented in the supplementary Table S2, available at Rheumatology online.
Characteristics of patients in the calibration cohort
| Mechanical disease | Inflammatory disease | Septic arthritis | PM/I | PI/S | PM/S | |
|---|---|---|---|---|---|---|
| (n = 88) | (n = 255) | (n = 30) | ||||
| Gender (M/F), % | 41/59 | 55/45 | 67/33 | * | NS | * |
| Age, years | 63 (51.25–74) | 60 (45.5–72.5) | 68 (64.5–76.5) | NS | ** | * |
| Skin temperature, °C | 37 (36.7–37.15) | 37.1 (36.9–37.6) | 37.6 (37–38) | *** | ** | *** |
| Fevera, % | 7 | 15 | 30 | NS | NS | ** |
| Duration of arthritis, days | 15 (7–60) | 7 (3–20) | 6 (3–8) | *** | NS | *** |
| Gout, % | 9 | 20 | 15 | * | NS | NS |
| PPCD disease, % | 8 | 8 | 5 | NS | NS | NS |
| RA, % | 28 | 20 | 20 | NS | NS | NS |
| SpA, % | 5 | 12 | 0 | NS | NS | NS |
| OA, % | 36 | 6 | 23 | *** | * | NS |
| Other comorbidities, % | 32 | 34 | 60 | NS | ** | ** |
| Diabetes, % | 16 | 15 | 33 | NS | NS | NS |
| Cirrhosis, % | 2 | 4 | 19 | NS | * | * |
| SF | ||||||
| Positive direct examination, n | 0 | 1 | 11 | NA | NA | NA |
| Culture (negative/positive), n | NA | NA | 3/27 | NA | NA | NA |
| Presence of crystals, % | 17 | 34 | 8 | ** | ** | NS |
| Type of crystalsb, % | 67/33/0/0 | 57/41/0/2 | 100/0/0/0 | NS | NS | NS |
| Leucocyte count, n | 350 (150–700) | 13 000 (6835–28 000) | 60 000 (14 400–117 000) | *** | *** | *** |
| Polymorphonuclear leukocytes, % | 22.5 (7.75–63.25) | 83 (69–90) | 94 (90–97) | *** | *** | *** |
Quantitative variables are expressed using median and interquartile range, categorical variables are expressed in %.
Fever = skin temperature ≥38°C.
Type of crystal: PPCa/sodium urate/others/PPCa + sodium urate.
P < 0.05;
P < 0.01;
P < 0.001; NS: P > 0.05. PPCD: pyrophosphate crystal deposition disease; M/I: statistical comparison between mechanical and inflammatory; I/S: statistical comparison between inflammatory and septic; M/S: statistical comparison between mechanical and septic; NA: not applicable; M: male; F: female.
The joint most represented in patient recruitment was knee (76 and 68% for the calibration and validation cohorts, respectively) (Fig. 1).
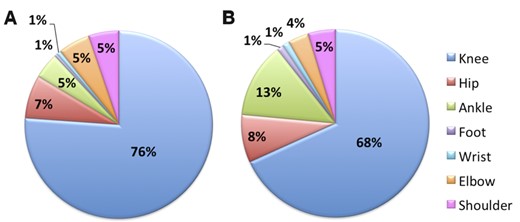
Description of the different joints investigated
Calibration (A) and validation (B) cohorts.
Four hundred and two patients were enrolled in the multicentre cohort (calibration cohort). Septic arthritis was diagnosed in 30 cases (7%). Direct examination was positive in 11 (37%) cases. Gram-positive cocci and Gram-negative bacilli were the most frequently isolated from SF culture. In three cases, bacteria were only identified by 16S rRNA PCR made from SF (Staphylococcus aureus, Gemella spp. and Streptococcus spp.) (Table 2). Crystal arthropathy was diagnosed in 133 cases (33%) and chronic inflammatory joint disease in 150 cases (37%).
Bacteria isolated from septic arthritis joints
| Calibration cohort | Validation cohort | |
|---|---|---|
| (n = 30) | (n = 13) | |
| Gram-positive cocci | ||
| Staphylococcus aureus | 12 | 3 |
| Streptococcusa | 8 | 6 |
| Coagulase-negative Staphylococcusb | 2 | – |
| Gemella spp | 1 | |
| Gram-negative bacilli | ||
| Escherichia coli | 1 | 2 |
| Citrobacter koseri | 1 | – |
| Pseudomonas aeruginosa | 1 | – |
| Haemophilus parainfluenzae | – | 1 |
| Gram-negative cocci | ||
| Neisseria gonorrhoeae | 1 | – |
| Neisseria meningitidis | – | 1 |
| Gram-positive bacillus | ||
| Clostridium paraputrificum | 1 | – |
| Mycobacteria | ||
| Mycobacterium bovis | 1 | – |
| Mycobacterium intracellulare | 1 | – |
Streptococcus dysgalactiae, n = 2; Streptococcus agalactiae, n = 1; Streptococcus gallolyticus, n = 1; Streptococcus gordonii, n = 1; Streptococcus sanguinis, n = 1; Lancefield group A n = 1; spp. n = 1.
Staphylococcus epidermidis and Staphylococcus lugdunensis.
In the validation cohort, 86 patients with acute arthritis (duration <1 month) were recruited. Septic arthritis was diagnosed in 13 cases (15%), with 9 Gram-positive and 4 Gram-negative bacteria. Direct examination was positive in four (31%). Two septic patients were already treated with antibiotics before arthrocentesis and three also had pyrophosphate deposition disease proven by optic microscopy. Crystal arthritis was diagnosed in 37% and inflammatory arthritis in 41% of the patients (diagnoses are detailed in supplementary Table S3, available at Rheumatology online).
Fever, defined as temperature >38°C at the time of arthrocentesis, was observed in 16% of calibration cohort patients and 43% of validation cohort patients (P < 0.001). Fever was significantly less frequent for non-septic patients: in the calibration cohort, fever was observed in 30% of the septic arthritis patients, 15% of inflammatory disease patients and 7% of mechanical disease patients (P < 0.01). In the validation cohort, fever was observed in 85% of the septic arthritis patients and 36% of the non-septic patients (P < 0.01) (Table 1, supplementary Tables S1 and S2, available at Rheumatology online).
Performances of SynoFAST test in identifying patients with septic arthritis
The spectral model was based on four spectral variables producing a probability ranging from 0 (non-septic) to 1 (septic). The area under the curve values were 0.95 and 0.90 in the calibration and validation cohorts, respectively. At a threshold of 0.064, sensitivity for the calibration and validation cohorts was, respectively, 0.90 and 0.92; specificity was 0.90 and 0.81; the PPV values were 0.41 and 0.46; and the NPV values 0.99 and 0.98, respectively. The proportion of correct classifications was 90 and 82% for the calibration and validation cohorts, respectively (Fig. 2). Only specificity was significantly lower in the validation cohort than in the calibration cohort (P = 0.04). The stability of the prediction for the validation cohort was estimated by bootstrap and is presented in the supplementary Fig. S1, available at Rheumatology online.
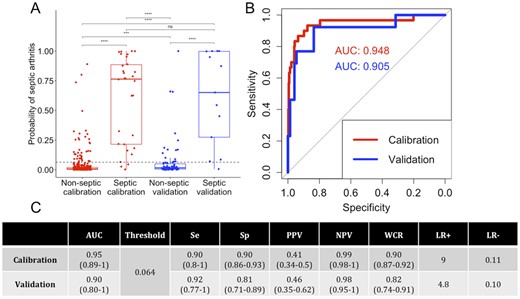
Performances of the spectral model
(A) Boxplot of the septic arthritis probability according to the calibration (red) and validation (blue) cohorts and non-septic and septic patients. (B) AUROC for the spectral model for the calibration (red) and validation (blue) cohorts. (C) Performance table. CIs at 95% are given in brackets. Se: sensitivity; Sp: specificity; PPV: positive predictive value; NPV: negative predictive value; WCR: well classified rate; LR: likelihood ratio; AUROC: area under the receiver operating characteristic curve.
There were three septic patients misclassified in calibration and one patient in validation, but no association has been made with a particular bacterial species (supplementary Table S4, available at Rheumatology online).
The probability was then translated into a ‘risk score’ ranging from 0 to 4 according to PPV and NPV values (Fig. 3). These different points were related to likelihood for the presence of septic arthritis. Three types of areas were identified: 0 and 4 are areas of certainty, 1 and 3 are areas of ‘low probability of error’ and 2 in an area of uncertain test. Patients with a risk score of 4 had a very high risk of septic arthritis: 100% of the patients with a risk score of 4 were septic in the calibration cohort and 83% in the validation cohort; and patients with a risk score of 0 had a very low risk of septic arthritis, with 100% of non-septic patients for the calibration cohort and 98% of non-septic patients for the validation cohort. Patients with a risk score of 2 had an uncertain spectral test with a risk of septic arthritis in the calibration cohort at 21%, and 23% in the validation cohort. Patients with a risk score of 1 had a low risk of septic arthritis, with 99 and 100% of non-septic patients in calibration and validation cohort, respectively. Patients with a risk score of 3 had a high-risk of septic arthritis, with 62 and 57% of septic patients in calibration and validation cohort, respectively.
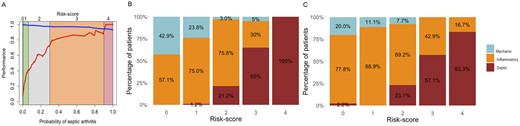
Translation of the probability of septic arthritis into a risk-score
(A) Evolution of PPV (red) and NPV (blue) values according of spectral model probability and ‘risk score’. Percentage of patients according to diagnosis and risk score for calibration (B) and validation (C) cohorts. PPV: positive predictive value; NPV: negative predictive value.
Discussion
Our previous data suggested that the MIR-FEWS method provided good performances in identifying septic arthritis [7]. This new clinical study, performed with a simplified device, has extended and refined this observation to a larger, multicentre study. In addition, the direct application of the SynoFAST test at the patient’s bedside demonstrates its applicability in clinical practice. The results of the SynoFAST test measure can thus be obtained in 15 min from a small volume of SF (7 µl).
A number of methods have been developed to optimize a rapid diagnosis of septic arthritis. They include, for blood tests, the determination of CRP level and/or ESR, and the determination of levels of procalcitonin, TNF-α and cytokines IL-6 and IL-1β [17, 18]. In SFs, studies have shown the usefulness of the determination of glucose and lactate dehydrogenase [19], lactate, glucose and uric acid levels [20], urine strip [21], bacterial PCR and microcalorimetry [22]. None allows to reliably rule out septic arthritis within a few minutes and clinicians must deal with uncertainty while waiting for SF culture. So to date, there is still a need for a rapid, simple and reliable method for the identification of septic arthritis [23, 24], which now seems to be available with the MIR-FEWS method. Indeed, the discriminant model, which is based on four spectral markers, provides good performances, especially in ruling out septic arthritis, with NPVs at 0.99 in the calibration cohort (thawed SFs), confirmed at 0.98 in the independent validation cohort (freshly collected SFs).
Lower performances in the validation cohort could be related either to the fact that the number of patients is small (n = 86 with 13 septic arthritis) or the difference in inclusion criteria between the two groups. Indeed, the effusion duration is under 30 days in the validation group, thus limiting the number of mechanical cases, as shown in the comparison table between the calibration and validation cohorts (supplementary Table S2, available at Rheumatology online). To test the influence of effusion duration, a MIR-FEWS model estimation was performed by selecting patients with effusion lasting <30 days in the calibration cohort. It is worth noting that the performances were the same, and this did not improve the performance observed in the validation cohort. It is also worth noting that comparisons between cohorts highlight spectral differences in some spectral domains between thawed and freshly collected fluids. It is difficult to confidently attribute this difference to frozen or thawed status, but some studies have shown that the freeze–thaw cycle alters the biochemical composition of biofluids [25] and therefore potentially affects mid-infrared spectroscopy results [26].
To try to improve the specificity and NPV values of the spectral score, multivariate analyses were conducted, including bio-clinical parameters such as ‘absence of crystals’ and ‘effusion lasting under 10 days’, and the comparison of the areas under the curve did not show significant improvements. The frequency of fever was significantly different between septic and non-septic patients, but was not relevant in multivariate analyses.
Another way of improving certainty was to implement a ‘risk score’ according to the likelihood of identifying or excluding a septic patient. The results that we obtained support a potential interest of the allocation of points, making it possible to reach over 90% certainty for septic or non-septic spectral identification. These results are to be confirmed in an upcoming study that will be carried out in several centres on freshly collected fluids (SYNOFRESH; ClinicalTrials.gov registration NCT04004962).
Altogether, our data support the usefulness of the SynoFAST test, a simple, fast method, to improve point of care diagnosis of septic arthritis, thus enabling a refinement of the diagnostic procedure, and optimizing and improving patient care by ruling out numerous cases of non-septic arthritis.
Acknowledgements
We would like to thank Drs Antoine Martin, Marine Ferreyra, Sylvie Hoang, Claudie Guedes, Pierre Gazeau and Thierry Marhadour for recruiting and following patients enrolled in this study, and Marie Morvan for her valuable tips for statistical analysis and figures. Part of the results presented in this study were presented at the Annual European Congress of Rheumatology, EULAR 2018, Amsterdam, 13–16 June 2018 (DOI: 10.1136/annrheumdis-2018-eular.6224). J.-D.A., O.L. and H.T. devised the study; J.-D.A., O.B. and M.L.C. obtained the data; J.D.A., O.L. and M.L.C. wrote the paper; M.L.C. performed the statistical analyses; O.S. participated in the spectral data analysis; J.-D.A., O.B., C.D., X.G., E.H., S.J.-J., B.L.G., A.J.-G. and G.C. recruited patients; and all co-authors approved the paper.
Funding: This work was supported by DIAFIR (Rennes, France).
Disclosure statement: M.L.C. is a DIAFIR employee; H.T. is the DIAFIR Chief Executive Officer; O.L. is a DIAFIR co-founder. The other authors have declared no conflicts of interest.
Supplementary data
Supplementary data are available at Rheumatology online.
References
R Development Core Team.

Comments