


Abstract
To date, there is almost no information concerning the sexual health of patients with idiopathic inflammatory myopathies (IIM). This cross-sectional study aimed to compare sexual function in patients with IIM to age-/sex-matched healthy controls (HC) and determine the potential impact of clinical features on sexual function.
In total, 122 women (61 with IIM, 61 age-matched HC) and 22 men (11 with IIM, 11 age-matched HC) aged 18–80 years completed gender-specific selection of 7 well-established and validated questionnaires assessing sexual health and function (Female Sexual Function Index, Brief Index of Sexual Function for Women, Sexual Function Questionnaire, Sexual Quality of Life Questionnaire–Female, International Index of Erectile Function, Male Sexual Health Questionnaire, Sexual Quality of Life Questionnaire–Male). Results were compared between patients and HC and correlated with selected disease-related features.
The prevalence of sexual dysfunction in IIM was 59% in women (vs 40% in HC), and 64% (vs 9% in HC) in men. Men and women with IIM reported significantly impaired sexual function compared with sex-/age-matched HC. Decreased sexual function was associated with muscle weakness, disability, physical inactivity, fatigue, depression and decreased quality of life.
Our results suggest that sexual dysfunction is common among IIM patients and more attention should be paid to this aspect of the disease.
• Patients with IIM report significantly higher prevalence of sexual dysfunction compared with sex-/age-matched healthy individuals.
• Sexual dysfunction is associated with muscle weakness, disability, fatigue, depression and decreased quality of life.
Introduction
Idiopathic inflammatory myopathies (IIM) are a heterogeneous group of rare autoimmune diseases characterized by chronic muscle inflammation associated with muscle weakness and frequently multiple organ involvement. The manifestations of IIM mostly include skin rash, arthritis, interstitial lung disease, gastrointestinal and cardiopulmonary involvement [1]. Based on clinical, immunological, and histopathological features, IIM are divided into several subtypes, including DM, PM, inclusion body myositis (IBM), and immune-mediated necrotizing myopathy (IMNM) [2]. Serious clinical manifestations of myositis are often associated with significant impairment of health-related quality of life (HRQoL) [3]. Despite clinical improvement following pharmacotherapy, most patients develop persistent disability that affects all aspects of HRQoL, including sexual function [4, 5].
The World Health Organization describes sexual health as an integral part of human well-being and an essential part of general health [6]. The impact of rheumatic diseases on sexual health is often multifactorial and includes physical alterations, hormonal imbalance, adverse effects of pharmacotherapy, and psychological responses to chronic illness [7]. Several studies have evaluated sexual function in patients with other systemic rheumatic diseases such as rheumatoid arthritis, systemic sclerosis, or systemic lupus erythematosus, and suggested a high prevalence of sexual dysfunctions in both sexes [8–11]. However, the sexual health of IIM patients has been a poorly examined and generally neglected aspect of HRQoL. In the study of Munters et al. [12], patients with PM/DM identified sexual activity as one of the five most important disabilities to improve. The only study addressing the sexual health in myositis patients assessed sexual function in a small cohort of young adult females and demonstrated that 61% of 23 women with PM/DM have some degree of sexual dysfunction [13].
This cross-sectional study aimed to address several aspects related to sexual health, namely the sexual and pelvic floor function in a fairly large cross-sectional cohort of adult women and men with IIM and compared them to sex-/age-matched healthy controls (HC). We also investigated the potential impact of disease-related features, including disease duration, disease activity, muscle strength, physical activity, functional ability, the extent of fatigue and depression, quality of life and current pharmacotherapy treatment on patients' sexual health. Furthermore, we conducted a subanalysis among sexually active women and women of reproductive age, in order to avoid the bias associated with sexual inactivity and physiological post-menopausal changes.
Methods
Patients and healthy controls
In total, 61 female patients [26 PM, 29 DM, 5 IMNM, 1 IBM; mean (s.d.) age 53.1 (13.5) years] and 11 men [6 PM, 2 DM, 2 IMNM, 1 IBM; mean (s.d.) age 48.4 (9.0) years] were consecutively recruited between January 2018 and December 2019 at the Institute of Rheumatology in Prague. Inclusion criteria included fulfillment of Bohan and Peter 1975 criteria for DM/PM [14], ENMC criteria for IMNM [15] or IBM [16], and age 18–80 years. Exclusion criteria comprised active neoplasia (recently diagnosed cancer currently undergoing treatment) and the presence of another systemic rheumatic disease. All patients were regularly followed by a rheumatologist and signed written informed consent prior to inclusion to the study. Seventy-two healthy individuals without rheumatic diseases or active neoplasia, matched for sex and age, were recruited from the Healthy Control Register of the Institute of Rheumatology, consisting mainly of employees and relatives, using the snowball method. This cross-sectional study was approved by the Ethics Committee of the Institute of Rheumatology in Prague. All methods were performed in accordance with the relevant guidelines and regulations.
Assessment methods
All patients were clinically evaluated by a board-certified rheumatologist experienced in diagnosing and treating IIM (JV, HM), filled in 11 well-established and validated questionnaires, and underwent routine laboratory tests. The following data were collected:
Female Sexual Function Index (FSFI) [19] is a 19-item screening tool assessing the sexual function in six separate domains, namely sexual desire, arousal, lubrication, orgasm, satisfaction, and pain. The total score ranges from 2 to 36, where a higher score indicates better sexual function. FSFI meets the psychometric criteria [20], and a diagnostic cut-off score of 26.55 has been established to differentiate between women with and without sexual dysfunction [21]. FSFI was translated into Czech and has been validated [22].
Brief Index of Sexual Function for Women (BISF-W) is a 22-item instrument evaluating female sexual function [23] that is divided into seven domains: thoughts/desire (D1), arousal (D2), frequency of sexual activity (D3), receptivity/initiation (D4), pleasure/orgasm (D5), relationship satisfaction (D6), and problems affecting sexual function (D7). The possible range of composite score is -16 to 75, where a higher score represents better sexual function [24]. BISF-W was translated into Czech and has been validated [22].
Sexual Function Questionnaire (SFQ-28) a multidimensional measure of female sexual function [25] that includes eight domains of sexual function: sexual desire, physical arousal-sensation, physical arousal-lubrication, arousal-cognitive, enjoyment, orgasm, pain, and partner relationship [26]. It has no composite score; nevertheless, each domain's cut-off score has been determined, indicating low probability, possibility, or high probability of dysfunction. A higher score represents better sexual function [27]. It was translated into Czech and has been validated [22].
Sexual Quality of Life Questionnaire–Female (SQoL-F) is a self-reported outcome measure to assess the impact of sexual dysfunction on women’s quality of life [28]. It consists of 18 items, and each item is rated on a six-point scale ranging from ‘completely agree’ to ‘completely disagree’. Responses could be scored either 1 to 6 or 0 to 5, giving a total score of 18–108 or 0–90. Both total scores need to be standardized to a 0–100 scale. A higher score indicates better female sexual quality of life [28]. SQoL-F was translated into Czech and has been validated [22].
Evaluation of male sexual function (PROs).
International Index of Erectile Function (IIEF) is a 15-item patient-reported outcome measure to address the relevant domains of male sexual function: erectile function, orgasmic function, sexual desire, intercourse satisfaction, and overall satisfaction. Each item is scored on a five or six-point Likert scale from 0 to 5. Domain scores are computed by summing the scores for individual items in each domain. A higher score indicates better erectile function [29]. IIEF was translated into Czech and has been validated [30].
Male Sexual Health Questionnaire (MSHQ) is a 25-item questionnaire to assess relevant domains of sexual function in older men. It encompasses three scales (erection scale, ejaculation scale, satisfaction scale) scored on a five or six-point Likert scale. A higher score on each scale represents a higher level of sexual function [31]. MSHQ was translated into Czech and has been validated [30].
Sexual Quality of Life Questionnaire–Male (SQoL-M) is a modified version of the SQoL-F. Eleven items are scored with a six-point Likert-like response scale ranging from ‘completely agree’ to ‘completely disagree’. Raw scores are transformed onto a standardized scale of 0 to 100, where a higher score means better sexual quality of life [32]. SQoL-M was translated into Czech and has been validated [30].
Evaluation of pelvic floor function (PROs).
Pelvic organ prolapse/urinary Incontinence Sexual Questionnaire short form (PISQ-12) is an instrument to evaluate sexual function in women with pelvic organ prolapse or urinary incontinence [33]. The total score is calculated by summing each question’s scores with 0 for ‘never’ and 4 for ‘always’. A higher total score reflects worse sexual function in women with pelvic floor dysfunction [34]. PISQ-12 was translated into Czech and has been validated [22].
Pelvic Floor Impact Questionnaire–Short Form 7 (PFIQ-7) is a condition-specific quality of life questionnaire for women with all forms of pelvic floor disorders. It consists of seven items for each of the three scales (bladder/urine, bowel/rectum, and pelvis/vagina) that can be scored from 0 for ‘not at all’ to 3 for ‘quite a bit’. All scales are scored from 0 (least impact) to 100 (greatest adverse impact), and by adding up these three scores, we obtain the overall summary score (0 to 300). A higher total score indicates greater impact of pelvic floor disorder on the quality of life [35]. We used a modified version of this questionnaire for men, which is available but has not yet been psychometrically verified [36]. PFIQ-7 was translated into Czech and has been validated [22, 30].
Statistical analysis
Data are expressed as median [interquartile range (IQR)] or mean (s.d.) according to data distribution (normal or non-normal). The normal distribution was assessed by Shapiro–Wilk and Kolmogorov–Smirnov normality tests. Differences between two groups (IIM patients and healthy controls) were determined by the independent-sample t test or Mann–Whitney U test, and by the Chi-squared test for categorical variables. The bivariate relationships between sexual function variables and clinical features variables were assessed using the Spearman correlation coefficient. Multiple linear regression analysis was used to predict patients’ scores in PROs assessing sexual function and pelvic floor function by a set of predictors. Predictors for each dependent variable were selected based on significant bivariate associations. In the case of multicollinearity between the selected predictors, only one predictor with the strongest relationship with the particular dependent variable was included in the regression model. Sexual function and pelvic floor function in two groups of IIM patients stratified according to an induction of remission or maintenance therapy, separately for males and females, were compared using a general linear model with one fixed factor (the type of therapy) while controlling for significantly different covariates (age and disease duration). P-values <0.05 were considered statistically significant. All analyses were conducted using SPSS version 25 (SPSS, Inc., Chicago, IL, USA) and GraphPad Prism 5 (version 5.02; GraphPad Software, La Jolla, CA, USA).
Results
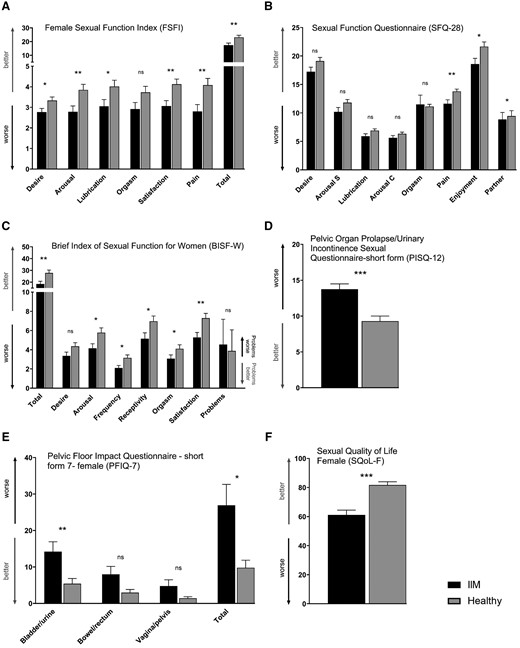
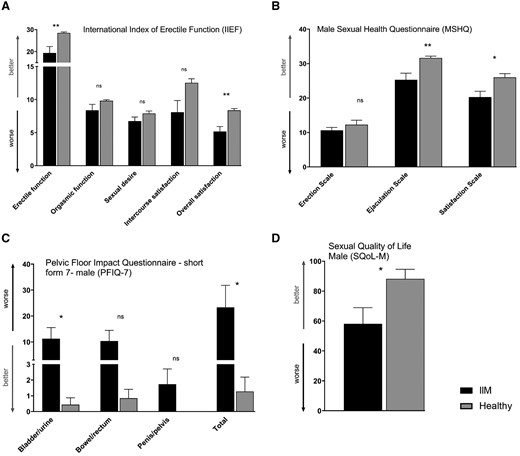
Out of the 120 eligible IIM women and 15 IIM men, 61 women and 11 men filled in the questionnaires. The reasons for refusal were collected. A total of 9 (17%) out of 53 IIM women and 2 (50%) out of the 4 IIM men responded ‘I do not want to be involved in any research’, 23 (44%) women and 2 (50%) men stated ‘I do not want to answer sensitive questions’, and 21 (39%) IIM women replied ‘I am not interested in this topic, or I am not concerned’. Six female patients returned questionnaires with missing data and had to be excluded from the study. The IIM women who refused to participate in the study were significantly older compared with the study group [59.3 (11.1) vs 53.1 (13.5) years, P = 0.047] and had a decreased muscle strength according to MMT-8 [56.7 (17.0) vs 64.1 (11.2), P = 0.040]. No other differences in demographic or disease-related variables were observed between these groups. The baseline demographic, clinical and laboratory data, and pharmacological treatment of the study group are listed in Tables 1 and 2. The results of questionnaires assessing female sexual function and pelvic floor function are presented in Fig. 1 and Supplementary Table S1, available at Rheumatology online, and the results of questionnaires assessing male sexual function and pelvic floor function are presented in Fig. 2 and Supplementary Table S1, available at Rheumatology online.
Sexual function and pelvic floor function in female patients with idiopathic inflammatory myopathies and healthy controls
(A) According to FSFI, sexual function (including desire, arousal, lubrication, satisfaction, pain, and the total score) was decreased in female patients with idiopathic inflammatory myopathies (IIM) compared with healthy controls (HC). (B) SFQ-28 showed worse scores in the subscales of sexual pain, enjoyment and partner in female IIM patients. (C) BISF-W demonstrated worse total score and its subscales of arousal, frequency of sexual activity, receptivity, orgasm, and satisfaction in female IIM patients. Pelvic floor function was decreased in female patients with IIM according to both PISQ-12 (D) and PFIQ-7 questionnaires (E). Sexual quality of life (SQoL-F) was worse in female IIM patients (F). The full names of the questionnaires are listed in the heading of each graph. Data are presented as mean (columns) and standard error of the mean (whiskers). * P < 0.05; ** P < 0.01; *** P < 0.001; ns, not significant.
Sexual function and pelvic floor function in male patients with idiopathic inflammatory myopathies and healthy controls
(A) According to IIEF, erectile function and overall sexual satisfaction were decreased in male IIM patients compared with HC. (B) Male IIM patients had worse ejaculatory function and reduced sexual satisfaction based on MSHQ. (C) PFIQ-7 demonstrated worse total score of pelvic floor function and the bladder/urinary function subscale in male IIM patients. (D) Sexual quality of life (SQoL-M) was decreased in male IIM patients. The full names of the questionnaires are listed in the heading of each graph. Data are presented as mean (columns) and standard error of the mean (whiskers). * P < 0.05; ** P < 0.01; *** P < 0.001; ns, not significant.
Sociodemographic variables, disease-related clinical features and laboratory features of female patients with IIM and healthy controls
| Parameters | Female IIM | Female controls | P-value |
|---|---|---|---|
| (n = 61) | (n = 61) | ||
| Sociodemographic variables | |||
| Age, years | 55.0 (40.0–63.3) | 55.0 (40.0–63.3) | P > 0.9999 |
| Having a partner, n (%) | 44 (72) | 51 (82) | P = 0.1975 |
| Education level (primary/secondary/tertiary), n (%) | 6 (10)/36 (59)/19 (31) | 1 (2)/41 (67)/19 (31) | P = 0.1431 |
| Sexual health features | |||
| Menopause, n (%) | 35 (57) | 36 (59) | P = 0.8560 |
| Pelvic surgery, n (%) | 15 (24) | 8 (13) | P = 0.1058 |
| Sexual activity, n (%) | 34 (56) | 43 (70) | P = 0.0630 |
| VAS: sexual life importance | 6.0 (4.5–8.5) | 7.0 (4.8–8.0) | P = 0.7905 |
| Clinical features | |||
| Disease duration, years | 5.2 (2.3–10.3) | – | |
| IIM subtype: PM/DM/IMNM/IBM, n (%) | 26 (43)/29 (47)/5 (8)/1 (2) | – | |
| MMT-8 score | 67.0 (57.0–72.0) | – | |
| IIM-associated symptoms: MW/SR/MH/RP | 40 (65)/14 (23)/13 (21)/16 (26) | – | |
| A/ILD/CI/D, n (%) | 4 (7)/24 (39)/2 (3)/11 (18) | – | |
| Patient-reported outcomes | |||
| (score range worst–best) | |||
| FIS—fatigue (range160–0) | 49.5 (30.5–72.8) | 29.0 (11.8–43.0) | P< 0.0001 |
| MAF—fatigue (range 50–1) | 25.8 (15.7–34.7) | 15.0 (9.3–22.5) | P < 0.0001 |
| BDI-II—depression (range 63–0) | 10.0 (5.0–17.0) | 5.0 (2.0–9.3) | P = 0.0005 |
| HAP AAS—physical activity (range 0–94) | 57.0 (38.5–74.0) | 80.0 (74.0–89.0) | P < 0.0001 |
| HAQ—functional status (range 3–0) | 0.8 (0.1–1.5) | 0.0 (0.0–0.0) | P < 0.0001 |
SF-36 PCS—the quality of life (range 16.6–57.9) | 30.1 (24.1–42.7) | 52.9 (40.9–57.3) | P < 0.0001 |
| SF-36 MCS—the quality of life (range 5.5–63.6) | 45.7 (34.6–54.5) | 49.8 (43.4–55.7) | P = 0.0473 |
| Laboratory features | |||
| Creatine phosphokinase, μkat/l | 2.4 (1.0–7.9) | – | |
| Lactate dehydrogenase, μkat/l | 4.0 (3.4–5.8) | – | |
| CRP, mg/l | 3.03 (1.25–6.30) | – | |
| Autoantibodies: seronegative, n (%) | 7 (11) | ||
| ANA/Mi-2/TIF1/MDA5 | 31 (50)/2 (3)/3 (5)/1 (2) | – | |
| SAE/NXP2/SRP/Jo-1/PM-Scl | 1 (2)/1 (2)/2 (3)/21 (34)/7 (11) | – | |
| snRNP/Ku/Ro/OJ/EJ/anti-HMGCR, n (%) | 2 (3)/3 (5)/16 (26)/1 (2)/1 (2)/2 (3) | – | |
| Current treatment | |||
| Prednisone equivalent dose, mg/day | 5.0 (2.1–11.3) | – | |
| GC/MTX/CPA/AZA | 50 (81)/22 (36)/4 (7)/6 (10) | – | |
| CSA/LEF/MMF/SAS | 11 (18)/0 0/2 (3)/0 0 | – | |
| HQ/TAC/RTX/IVIg, n (%) | 3 (5)/2 (3)/3 (5)/2 (3) | – |
Data are presented as median (IQR), if not stated otherwise. Statistically significant differences (P < 0.05) are marked in bold. IQR: interquartile range; IIM: idiopathic inflammatory myopathies; IMNM: immune-mediated necrotizing myopathy; IBM: inclusion body myositis; MMT-8: manual muscle testing of eight muscles; MW: muscle weakness; SR: skin rash; MH: mechanic’s hands; RP: Raynaud’s phenomenon; A: arthritis; ILD: interstitial lung disease; CI: cardiac involvement; D: dysphagia; FIS: Fatigue Impact Scale; MAF: Multidimensional Assessment of Fatigue; BDI II: Beck's Depression Inventory-II; HAP AAS: Human Activity Profile Adjusted Activity Score; SF-36 PCS: Medical Outcomes Study Short Form 36—Physical Component Summary; SF-36 MCS: Medical Outcomes Study Short Form 36—Mental Component Summary; ANA: antinuclear antibodies; Mi-2: antinuclear helicase 218/240 kDa; TIF1: anti-TIF1 (transcriptional intermediary factor-1); MDA5: anti-CADM-140/melanoma differentiation-associated gene 5 autoantibody; SAE: anti-SUMO1 (small ubiquitin-like modifier 1) activating enzyme; NXP2: anti-NXP2 (nuclear matrix protein); SRP: anti-signal recognition particles; Jo-1: anti-histidyl-tRNA synthetase; PM-Scl: anti-Pm-Scl (anti-core complex 11–16 proteins); snRNP: small nuclear ribonucleoprotein; Ku: anti-Ku (against the nuclear DNA-dependent protein kinase subunit); Ro: anti-Ro (52/60 kDa, against cytoplasmic RNA and associated peptides); OJ: anti-OJ (anti-isoleucyl-tRNA synthetase); EJ: anti-EJ (anti-glycyl-tRNA synthetase); HMGCR: anti3-hydroxy-3-methylglutaryl-coenzyme A reductase; GC: glucocorticoids; CPA: cyclophosphamide; CSA: ciclosporin A; SAS: sulphasalazine; HQ: hydroxychloroquine; TAC: tacrolimus; RTX: rituximab; IVIg: intravenous immunoglobulins. P-values are less than 0.05.
Sociodemographic variables, disease-related clinical features and laboratory features of male patients with IIM and healthy controls
| Parameters | Male IIM | Male controls | P-value |
|---|---|---|---|
| (n = 11) | (n = 11) | ||
| Sociodemographic variables | |||
| Age, years | 47.0 (41.8–54.8) | 47.0 (41.8–54.8) | P > 0.9999 |
| Having a partner, n (%) | 9 (82) | 10 (91) | P = 0.5344 |
| Education level (primary/secondary/tertiary), n (%) | 1 (9)/8 (73)/2 (18) | 0 0/7 (64)/4 (34) | P = 0.4204 |
| Sexual health features | |||
| Sexual activity, n (%) | 9 (82) | 11 (100) | P = 0.1380 |
| ED treatment, n (%) | 2 (18) | 1 (9) | P = 0.5344 |
| VAS: sexual life importance | 6.0 (1.0–8.0) | 7.5 (5.0–9.0) | P = 0.3748 |
| Clinical features | |||
| Disease duration, years | 3.8 (1.1–4.8) | – | |
| IIM subtype: PM/DM/IMNM/IBM, n (%) | 6 (55)/2 (18)/2 (18)/1 (9) | – | |
| MMT-8 score | 77.0 (57.0–79.5) | – | |
| IIM-associated symptoms: MW/SR/MH/RP | 8 (73)/0 0/3 (27)/5 (46) | – | |
| A/ILD/CI/D, n (%) | 1 (9)/6 (55)/0 0/4 (36) | – | |
| Patient-reported outcomes | |||
| (score range worst–best) | |||
| FIS—fatigue (range 160–0) | 55.0 (30.0–78.0) | 14.0 (5.0–33.0) | P = 0.0150 |
| MAF—fatigue (range 50–1) | 28.0 (20.3–37.1) | 16.8 (8.7–17.3) | P = 0.0071 |
| BDI-II—depression (range 63–0) | 14.0 (7.0–17.0) | 1.0 (0.0–3.0) | P = 0.0020 |
| HAP AAS—physical activity (range 0–94) | 61.0 (51.0–80.0) | 84.0 (79.0–94.0) | P = 0.0012 |
| HAQ—functional status (range 3–0) | 1.0 (0.1–1.6) | 0.0 (0.0–0.0) | P = 0.0164 |
| SF-36 PCS—the quality of life (range 16.6–57.9) | 30.6 (22.2–45.2) | 49.3 (40.0–53.2) | P = 0.0071 |
| SF-36 MCS—the quality of life (range 5.5–63.6) | 46.6 (37.5–51.8) | 56.6 (54.1–60.4) | P = 0.0256 |
| Laboratory features | |||
| Creatine phosphokinase, μkat/l | 3.8 (1.9–7.2) | – | |
| Lactate dehydrogenase, μkat/l | 3.8 (2.9–5.3) | – | |
| CRP, mg/l | 4.1 (0.9–6.7) | – | |
| Autoantibodies: seronegative, n (%) | 3 (27) | – | |
| ANA/Mi-2/TIF1/MDA5 | 5 (46)/1 (9)/0 0/0 0 | – | |
| SAE/NXP2/SRP/Jo-1/PM-Scl | 0 0/0 0/1 (9)/2 (18)/1 (9) | – | |
| snRNP/Ku/Ro/OJ/EJ/anti-HMGCR, n (%) | 0 0/0 0/4 (36)/0 0/0 0/0 0 | – | |
| Current treatment | |||
| Prednisone equivalent dose, mg/day | 10.0 (5.0–20.0) | – | |
| GC/MTX/CPA/AZA | 9 (82)/1 (9)/3 (27)/2 (18) | – | |
| CSA/LEF/MMF/SAS | 2 (18)/0 0/0 0/0 0 | – | |
| HQ/TAC/RTX/IVIg, n (%) | 0 0/0 0/0 0/0 0 | – |
Data are presented as median (IQR), if not stated otherwise. Statistically significant differences (P < 0.05) are marked in bold; IQR: interquartile range; IIM: idiopathic inflammatory myopathies; ED: erectile dysfunction; IMNM: immune-mediated necrotizing myopathy; IBM: inclusion body myositis; MMT-8: manual muscle testing of eight muscles; MW: muscle weakness; SR: skin rash; MH: mechanic’s hands; RP: Raynaud’s phenomenon; A: arthritis; ILD: interstitial lung disease; CI: cardiac involvement; D: dysphagia; FIS: Fatigue Impact Scale; MAF: Multidimensional Assessment of Fatigue; BDI II: Beck's Depression Inventory-II; HAP AAS: Human Activity Profile Adjusted Activity Score; SF-36 PCS: Medical Outcomes Study Short Form 36—Physical Component Summary; SF-36 MCS: Medical Outcomes Study Short Form 36—Mental Component Summary; ANA: antinuclear antibodies; Mi-2: antinuclear helicase 218/240 kDa; TIF1: anti-TIF1 (transcriptional intermediary factor-1); MDA5: anti-CADM-140/melanoma differentiation-associated gene 5 autoantibody; SAE: anti-SUMO1 (small ubiquitin-like modifier 1) activating enzyme; NXP2: anti-NXP2 (nuclear matrix protein); SRP: anti-signal recognition particles; Jo-1: anti-histidyl-tRNA synthetase; PM-Scl: anti-Pm-Scl (anti-core complex 11–16 proteins); snRNP: small nuclear ribonucleoprotein; Ku: anti-Ku (against the nuclear DNA-dependent protein kinase subunit); Ro: anti-Ro (52/60 kDa, against cytoplasmic RNA and associated peptides); OJ: anti-OJ (anti-isoleucyl-tRNA synthetase); EJ: anti-EJ (anti-glycyl-tRNA synthetase); HMGCR: anti3-hydroxy-3-methylglutaryl-coenzyme A reductase; GC: glucocorticoids; CPA: cyclophosphamide; CSA: ciclosporin A; SAS: sulphasalazine; HQ: hydroxychloroquine; TAC: tacrolimus; RTX: rituximab; IVIg: intravenous immunoglobulins.
Results in women with IIM
The total score of the FSFI and the BISF-W were significantly lower in the IIM group than in controls. The most affected domains of sexual function were sexual arousal, lubrication, frequency of sexual activity, receptivity to sexual activity, sexual/relationship satisfaction, and sexual pain. The quality of sexual life assessed by SQoL-Q was significantly lower in patients with IIM compared with healthy women. The prevalence of sexual dysfunction in IIM women was 59% (vs 40% in HC) according to the FSFI cut-off score. The PFIQ-7 and PISQ-12 results in IIM suggest a reduced function of the pelvic floor compared with HC. The function of the bladder was significantly affected in the assessment of pelvic floor function (Fig. 1).
In bivariate analysis, worse sexual performance and pelvic floor dysfunction were significantly correlated with more severe muscle weakness, worse functional disability, reduced physical activity, more pronounced fatigue, more severe depression, and decreased overall quality of life (Supplementary Table S2, available at Rheumatology online). Multivariate regression analysis showed that physical and mental conditions might be good predictors for sexual dysfunction and pelvic floor dysfunction in women with IIM (Supplementary Table S3, available at Rheumatology online). Considering the possible effect of the pharmacotherapy, no differences were observed between female IIM patients on maintenance therapy and those on induction of remission therapy when adjusted for age or for age and disease duration (Supplementary Table S4, available at Rheumatology online). Moreover, no associations were found between the sexual function and the current PED.
In total, 33 of 61 female patients [mean age (s.d.): 47.6 (14.1) years] were currently sexually active, whereas 43 out of 61 healthy women [mean age (s.d.): 49.2 (13.0) years] reported current sexual activity. When comparing these two groups, a total score of FSFI, BISF-W, SQoL-F, and PISQ-12 was significantly lower in the IIM group than in healthy controls. Sexual arousal, frequency of sexual activity, sexual/relationship satisfaction, and sexual pain remained the most affected domains. In addition, sexually active IIM patients also reported more severe problems affecting sexual function compared with sexually active healthy controls (Table 3).
Sexual function and pelvic floor function in sexually active women with IIM and healthy controls
| Parameters (score range worst–best) | SA IIM | SA HC | P-value |
|---|---|---|---|
| (n = 33) | (n = 43) | ||
| FSFI total (range 2–36) | 24.4 (19.7–32.5) | 31.3 (27.4–32.6) | P = 0.028 |
| FSFI desire (range 1.2–6) | 3.6 (2.7–4.2) | 3.6 (3.6–4.8) | P = 0.062 |
| FSFI arousal (range 0–6) | 4.2 (3.6–5.6) | 5.1 (4.5–5.7) | P = 0.025 |
| FSFI lubrication (range 0–6) | 5.7 (3.9–6.0) | 5.7 (5.1–6.0) | P = 0.312 |
| FSFI orgasm (range 0–6) | 5.2 (3.4–6.0) | 5.7 (5.1–6.0) | P = 0.763 |
| FSFI satisfaction (range 0.8–6) | 4.4 (3.6–6.0) | 5.6 (4.4–6.0) | P = 0.038 |
| FSFI pain (range 0–6) | 5.2 (3.2–6.0) | 6.0 (5.2–6.0) | P = 0.002 |
| BISF-W total (range −16–75) | 29.8 (20.5–37.5) | 39.5 (33.3–46.2) | P = 0.001 |
| BISF-W thoughts/desire (range 0–12) | 3.8 (2.9–6.2) | 5.9 (3.7–7.0) | P = 0.088 |
| BISF-W arousal (range 0–12) | 6.1 (5.1–7.8) | 8.3 (6.3–9.8) | P = 0.005 |
| BISF-W frequency of sexual activity (range 0–12) | 3.0 (1.5–5.0) | 4.5 (3.0–5.6) | P = 0.022 |
| BISF-W receptivity/initiation (range 0–15) | 9.0 (0.0–9.0) | 10.0 (8.5–11.0) | P = 0.125 |
| BISF-W pleasure/orgasm (range 0–12) | 5.0 (3.0–5.5) | 5.8 (4.6–7.0) | P = 0.075 |
| BISF-W relationship satisfaction (range 0–12) | 8.0 (6.0–9.0) | 9.0 (8.0–11.0) | P = 0.011 |
| BISF-W problems affecting sexual function (range 16–0) | 5.3 (4.0–6.9) | 3.6 (2.5–6.0) | P = 0.011 |
| SFQ28 desire (range 5–31) | 18.0 (13.3–20.0) | 19.0 (17.0–22.0) | P = 0.042 |
| SFQ28 arousal sensation (range 4–20) | 9.5 (7.0–11.0) | 12.0 (9.0–14.3) | P = 0.082 |
| SFQ28 arousal lubrication (range 2–10) | 6.0 (4.0–8.0) | 7.0 (5.0–9.0) | P = 0.112 |
| SFQ28 arousal cognitive (range 2–10) | 6.0 (4.3–7.0) | 6.0 (5.0–7.3) | P = 0.235 |
| SFQ28 orgasm (range 1–15) | 11.0 (8.0–13.0) | 12.0 (9.8–13.0) | P = 0.279 |
| SFQ28 pain (range 2–15) | 12.0 (10.0–15.0) | 15.0 (13.0–15.0) | P = 0.004 |
| SFQ28 enjoyment (range 6–30) | 19.0 (14.3–24.3) | 23.0 (19.0–25.0) | P = 0.027 |
| SFQ28 partner (range 2–10) | 9.0 (8.0–10.0) | 10.0 (9.0–10.0) | P = 0.012 |
| SQoL-F (range 0–100) | 78.3 (47.2–89.4) | 93.3 (81.1–96.7) | P = 0.001 |
| PISQ-12 (range 48–0) | 11.0 (8.0–14.8) | 7.0 (5.0–12.0) | P < 0.0001 |
| PFIQ-7 total (range 300–0), mean (s.d.) | 23.5 (48.5) | 7.9 (13.3) | P = 0.471 |
| PFIQ-7 bladder/urine (range 100–0) | 11.0 (19.2) | 3.8 (7.4) | P = 0.128 |
| PFIQ-7 bowel/rectum (range 100–0) | 7.4 (18.8) | 2.9 (7.1) | P = 0.831 |
| PFIQ-7 vagina/pelvis (range 100–0) | 5.2 (14.7) | 1.2 (3.3) | P = 0.749 |
Data are presented as median (IQR), if not stated otherwise. Statistically significant differences (P < 0.05) are marked in bold. The number of respondents to the SFQ-28 questionnaire was 21 for IIM women and 27 for healthy women; IQR: interquartile range; IIM: idiopathic inflammatory myopathies; HC: healthy controls; FSFI: female Sexual Function Index; BISF-W: Brief Index of Sexual Function for Women; SFQ-28; Sexual Function Questionnaire; SQoL-F: Sexual Quality of Life–Female; PISQ-12: Pelvic organ prolapse/urinary Incontinence Sexual Questionnaire short form; PFIQ-7: Pelvic Floor Impact Questionnaire–Short Form 7.
In our cohort, 35 myositis patients and 36 healthy individuals were post-menopausal. Therefore, we also analysed women of reproductive age only. In this subanalysis, we included 26 women with IIM [mean age (s.d.) 42.2 (12.2) years] and 25 healthy controls [mean age (s.d.) 46.4 (15.8) years]. Significantly worse scores were observed in pre-menopausal women with IIM in the FSFI, BISF-W, SQoL-F, and PISQ-12 total score (Table 4). No significant differences have been detected between patients with PM and DM and between early and established patients.
Sexual function and pelvic floor function in women of reproductive age with IIM and healthy controls
| Parameters (score range worst–best) | IIM in reproductive age | HC in reproductive age | P-value |
|---|---|---|---|
| (n = 26) | (n = 25) | ||
| FSFI total (range 2–36) | 10.0 (2.9−19.5) | 31.3 (26.5−32.8) | P < 0.0001 |
| FSFI desire (range 1.2−6) | 3.6 (2.4−4.4) | 3.6 (3.0−4.8) | P = 0.296 |
| FSFI arousal (range 0−6) | 3.9 (1.9−5.5) | 5.2 (4.2−5.7) | P = 0.082 |
| FSFI lubrication (range 0−6) | 5.7 (2.4−6.0) | 6.0 (5.3−6.0) | P = 0.339 |
| FSFI orgasm (range 0−6) | 4.4 (2.2−6.0) | 4.8 (3.9−6.0) | P = 0.335 |
| FSFI satisfaction (range 0.8−6) | 4.0 (1.5−5.7) | 5.2 (3.5−6.0) | P = 0.070 |
| FSFI pain (range 0−6) | 5.4 (2.1−6.0) | 6.0 (4.8−6.0) | P = 0.161 |
| BISF-W total (range −16–75) | 29.9 (11.8–39.1) | 41.3 (28.3–47.3) | P = 0.047 |
| BISF-W thoughts/desire (range 0–12) | 5.2 (2.8–7.1) | 6.0 (2.9–7.2) | P = 0.474 |
| BISF-W arousal (range 0–12) | 6.4 (1.7–8.3) | 8.3 (5.9–10.0) | P = 0.114 |
| BISF-W frequency of sexual activity (range 0–12) | 2.8 (1.1–5.2) | 4.5 (2.1–5.5) | P = 0.371 |
| BISF-W receptivity/initiation (range 0–15) | 8.0 (4.0–10.8) | 10.0 (6.0–11.0) | P = 0.202 |
| BISF-W pleasure/orgasm (range 0–12) | 4.3 (2.1–6.5) | 6.0 (3.6–7.7) | P = 0.185 |
| BISF-W relationship satisfaction (range 0–12) | 7.5 (4.0–9.0) | 10.0 (8.0–11.0) | P = 0.021 |
| BISF-W problems affecting sexual function (range 16–0) | 4.5 (2.0–6.5) | 2.5 (1.8–4.3) | P = 0.081 |
| SFQ28 desire (range 5–31) | 20.0 (13.5–21.5) | 19.0 (17.0–22.0) | P = 0.610 |
| SFQ28 arousal sensation (range 4–20) | 10.0 (8.0–14.5) | 14.0 (9.0–15.0) | P = 0.312 |
| SFQ28 arousal lubrication (range 2–10) | 7.0 (5.0–9.0) | 8.0 (5.0–9.0) | P = 0.643 |
| SFQ28 arousal cognitive (range 2–10) | 6.0 (4.5–7.5) | 7.0 (5.0–8.0) | P = 0.544 |
| SFQ28 orgasm (range 1–15) | 11.0 (8.5–13.5) | 12.0 (9.0–13.0) | P = 0.798 |
| SFQ28 pain (range 2–15) | 15.0 (12.0–15.0) | 15.0 (13.0–15.0) | P = 0.394 |
| SFQ28 enjoyment (range 6–30) | 20.0 (14.5–26.0) | 23.0 (17.0–26.0) | P = 0.405 |
| SFQ28 partner (range 2–10) | 9.0 (8.0–10.0) | 10.0 (10.0–10.0) | P = 0.047 |
| SQoL-F (range 0–100) | 73.3 (40.0–85.6) | 93.3 (80.0–97.8) | P = 0.0006 |
| PISQ-12 (range 48–0) | 11.0 (7.0–15.0) | 6.0 (4.5–11.5) | P = 0.013 |
| PFIQ-7 total (range 300-0), mean (s.d.) | 13.2 (28.7) | 8.9 (15.4) | P = 0.955 |
| PFIQ-7 bladder/urine (range 100–0) | 6.8 (13.7) | 3.3 (7.1) | P = 0.292 |
| PFIQ-7 bowel/rectum (range 100–0) | 4.4 (12.3) | 1.4 (3.5) | P = 0.666 |
| PFIQ-7 vagina/pelvis (range 100–0) | 2.0 (6.6) | 8.9 (15.4) | P = 0.955 |
Data are presented as median (IQR), if not stated otherwise. Statistically significant differences (P < 0.05) are marked in bold. The number of respondents to the SFQ-28 questionnaire was 21 for IIM women and 27 for healthy women. IQR: interquartile range; IIM: idiopathic inflammatory myopathies; HC: healthy controls; FSFI: female Sexual Function Index; BISF-W: Brief Index of Sexual Function for Women; SFQ-28; Sexual Function Questionnaire; SQoL-F: Sexual Quality of Life–Female; PISQ-12: Pelvic organ prolapse/urinary Incontinence Sexual Questionnaire short form; PFIQ-7: Pelvic Floor Impact Questionnaire–Short Form 7.
Results in men with IIM
The International Index of Erectile Function (IIEF) and Male Sexual Health Questionnaire (MSHQ) revealed significantly worse scores in sexual satisfaction, erectile, and ejaculatory function compared with HC. The prevalence of erectile dysfunction (ED) in IIM males was 64% (vs 9% in HC). Pelvic floor function seems to be impaired in IIM in view of PFIQ-7, where the urinary function and the total score are significantly higher than in HC (Fig. 1). In bivariate analysis, worse sexual performance and pelvic floor dysfunction were significantly correlated with more pronounced fatigue, reduced physical activity, more severe depression, and decreased overall quality of life (Supplementary Table S5, available at Rheumatology online). Based on multivariate regression analysis, physical and mental conditions might be good predictors for sexual dysfunction in men with IIM (Supplementary Table S6, available at Rheumatology online). In an unadjusted analysis, we did not observe any significant effect of induction of remission or maintenance therapy on sexual function of men with IIM. However, after adjusting for disease duration, significantly worse scores for SQoL-M and the PFIQ-7 subscale were observed in male IIM patients on maintenance therapy (Supplementary Table S7, available at Rheumatology online).
Discussion
Herein, both women and men with IIM reported significantly impaired sexual function compared with sex-/age-matched HC. Furthermore, worse scores in IIM patients were associated with more severe muscle weakness, worse disability, physical inactivity, more severe fatigue, depression and decreased quality of life. Multivariate regression analysis revealed that physical and mental conditions might be good predictors of sexual dysfunction in both men and women with IIM.
In this study, we used multiple questionnaires to assess sexual function in order to provide the basis for replication, to verify the validity of the observed differences, and to impart additional pieces of valuable information in the non-overlapping domains. However, to avoid spurious conclusions from p-hacking, we recommend interpreting the results of particular domains with caution if the significance was observed only in one questionnaire. For instance, the domain of sexual desire was significantly decreased in female IIM patients only in FSFI, but not in BISF-W and SFQ-28.
Considering the wide variety of IIM-related impairments and their chronic nature, the lack of studies on this subject is remarkable. To date, only one study has been previously published, which evaluated sexual function in only 23 women with PM/DM within a narrow age range [13]. Souza et al. [13] found sexual impairment in 61% of female patients according to the FSFI cut-off score and significantly decreased function in almost all domains of FSFI. Similarly, we identified 59% of female patients with sexual dysfunction and significantly decreased scores in most domains of FSFI. Unfortunately, the exact average scores of FSFI total score and its subscales are not available in the aforementioned study; therefore, a more detailed comparison with our results is not possible.
Compared with the study by Souza et al. the mean age (s.d.) of our patients was higher [53.1 (13.5) vs 32.7 (5.3)] [13]. Our cohort represents probably more realistically the average population of myositis patients since the disease usually manifests between 45 and 60 years of age [37]. Since those women with IIM who refused to participate in our study were even older and had worse MMT-8 scores compared with the participants in the female IIM cohort, and given the association of worse sexual function with increasing age (data not shown) and decreasing muscle strength of some proximal muscles, our results can be generalizable to an average female myositis population. Given the older age, 57% women in our IIM cohort were post-menopausal. Loss of oestrogen after menopause results in physiological changes that influence women’s sexuality due to atrophy of the vaginal walls, reduced lubrication, loss of sexual interest, and consequently vaginal discomfort during intercourse [38]. Thus, we conducted a subanalysis on women of reproductive age only. The differences between these patients and controls remained significant in total scores of FSFI, BISF-W, SQoL-F and PISQ-12. However, compared with the analysis of the whole cohort (n = 61), no significant differences were observed in the individual domains of the questionnaires except for the relationship satisfaction domain of BISF-W and the partner domain of SFQ-28. Significance in particular domains may have been lost due to a relatively small sample of pre-menopausal women.
Although measurement properties of the FSFI questionnaire were found to be sufficient [20], researchers have noted that FSFI may render biased results for women who have not been sexually active in the past month [39]. Given that, we also analysed solely sexually active patients compared with sexually active healthy women. Although the strength of significance slightly decreased, the differences between patients and controls remained significant in total scores as well as most of the domains.
To our knowledge, there are no data available on sexual dysfunction in men with IIM. In our study, we demonstrated that 64% of IIM males suffer from mild to severe ED according to the IIEF cut-off scores. These results are comparable to systemic lupus erythematosus, where the prevalence of ED was determined to be 69% in 174 males [10]. However, our results on IIM males need to be interpreted with caution due to low numbers and require further validation in larger cohorts of patients.
In our study, the presence of sexual dysfunction was observed in 40% of healthy women, according to the FSFI cut-off score. The prevalence of sexual dysfunction in our HC cohort did not differ from worldwide data estimating the prevalence of sexual dysfunction in the healthy female population at ∼40–50%, irrespective of age [40]. The prevalence of ED was observed in 9% of healthy men. Similarly, the prevalence of ED in the general population worldwide ranged from 2% to 15% [40].
Since sexual dysfunctions in rheumatic diseases are often multifactorial, integrating biopsychological and socio-environmental components is of vital importance [41]. Therefore, we performed bivariant and multivariant analyses with several variables of interest that could potentially be associated with the presence of sexual dysfunctions. These analyses shed some light on the potential influence of muscle weakness, fatigue, depression and disability on the level of sexual dysfunction/pelvic floor dysfunction.
Our study has several limitations. First, a small number of men with IIM were enrolled in the study, and further research is certainly needed. Second, we realize that sexual dysfunction assessment can be challenging and is fraught with reporting bias due to its complex nature. Hence, we investigated a large number of factors that could potentially affect sexual function. However, there are many others that we did not cover in this study, including the exact reasons for sexual inactivity, the duration of the relationship, marriage status, partner’s sexual function, or economic status. Moreover, the Healthy Worker Effect phenomenon [42] could occur herein since the control group included mainly health-care employees and their relatives. Furthermore, we enrolled subjects only from a single centre; therefore, international multicentric research is required to validate our findings.
In conclusion, we demonstrated impaired sexual function in men and women with IIM compared with sex-/age-matched HC. Decreased sexual function was associated with muscle weakness, worse disability, physical inactivity, more severe fatigue, depression and decreased quality of life. No significant difference between induction of remission and maintenance therapy, or effect of disease duration on sexual function has been observed. To increase the body of knowledge on this underestimated and neglected aspect of IIM patients’ quality of life, international collaboration following a global consensus on a limited number of patient-reported outcomes is advocated.
Acknowledgements
The authors would like to thank all patients and healthy controls who participated in the study and Xiao Fu for language editing. M.T., B.H. and M.Š. designed the study. S.O., M.Š., H.Š., B.H., M.T., M.Kl., H.M., L.Š., K.P. and J.V. collected patients’ data. M.Ko., M.T. and B.H. performed the statistical analysis. B.H. and M.T. prepared the original draft of the manuscript. All authors critically interpreted the results, reviewed the draft version and approved the final manuscript.
Funding: This work was supported by the Ministry of Health of the Czech Republic [023728, 16–33574 A, 16–33542 A, NV18-01-00161A]; Ministry of Education Youth and Sports of the Czech Republic [SVV 260373] and Charles University Grant Agency [GAUK 1578119].
Disclosure statement: None declared.
Patient consent for publication
Not required.
Ethics approval
All relevant study documentation and amendments were approved by the independent Ethics Committee of the Institute of Rheumatology Prague with reference number: 10458/2017. The study was conducted following the principles outlined in the Declaration of Helsinki, the Guidelines of the International Council for Harmonisation (ICH) on Good Clinical Practice (GCP) Guideline E6 (R2) (EMA/CPMP/ICH/135/95) European Union (EU) Directive 95/46/EC, and other applicable regulatory requirements. Patients provided informed written consent before enrolment to the study.
Provenance and peer review
Not commissioned, externally peer reviewed.
Data availability statement
Individual anonymized participant data will not be shared. Pooled study data, protocol, or statistical analysis plan can be shared upon request at [email protected].
Supplementary data
Supplementary data are available at Rheumatology online.
References
World Health Organization. Defining sexual health: report of a technical consultation on sexual health, 28–31 January 2002. Geneva: World Health Organization,
Physical Therapy & Beyond. Pelvic Floor Impact Questionnaire – Short Form 7 - Male.

Comments