


Abstract
Apolipoprotein A-1 (ApoA-1) is a protein fraction of the high-density lipoproteins with anti-inflammatory and antioxidant properties that play a major role in reverse cholesterol transport. The presence of anti-ApoA-1 IgG has been reported in SLE to be variably associated with disease activity or cardiovascular events (CVEs). We assessed the clinical performance of anti-ApoA-1 IgG and of antibodies directed against its immunodominant F3L1 peptide (F3L1 IgG) in a well-characterized Swiss SLE cohort study.
A total of 354 biological samples and interviews from 176 individuals were studied. SLEDAI, clinical characteristics, anamnestic CVEs and therapy details were recorded. Sera were tested for the presence of anti-ApoA-1 IgG, anti-F3L1 IgG, anti-dsDNA IgG and aPL.
Anti-ApoA-1 and anti-F3L1 IgG positivity was associated with higher SLEDAI, mostly due to concomitant positivity of dsDNA IgG and low complement. Variations in time of anti-ApoA-1 IgG correlated positively with variations of anti-dsDNA IgG and inversely to variations of C3 levels. No cross-reactivity was found between anti-ApoA-1 and anti-dsDNA IgG. Positivity for anti-Apo-A1 IgG was more frequent in individuals receiving 10 mg/day or more of prednisone. We did not find any significant association between anti-ApoA-1 IgG positivity and CVEs.
Anti-ApoA-1 and anti-F3L1 IgG in SLE correlate strongly with laboratory markers of activity, particularly with the presence and titre of dsDNA IgG. These results confirm and extend previous findings and support the use of anti-ApoA1 IgG in the clinical setting. Their role in CVEs deserves further investigation.
Anti-ApoA-1 and anti-F3L1 IgG are frequently present in SLE.
Anti-ApoA-1 and anti-F3L1 IgG correlate with SLEDAI and anti-dsDNA antibodies in SLE.
Anti-ApoA-1 and anti-F3L1 IgG antibodies are not associated with cardiovascular events in the Swiss SLE cohort study.
Introduction
SLE is an autoimmune disease characterized by loss of tolerance towards self-components and the generation of a wide variety of autoantibodies (Abs) directed against ubiquitous as well as organ-specific auto-antigens [1]. However, the extent to which Abs are involved in disease progression and organ damage remains subject to debate [1]. Significantly, SLE clinically progresses through flares and remissions, and biomarkers associated with disease activity may be clinically useful in identifying patients at risk of disease exacerbations [2]. Furthermore, in SLE, morbidity and mortality are not only associated with organ involvement, but also with cardiovascular events (CVEs), particularly in young individuals [3]. Apolipoproteins are the most important protein components of amphipathic lipoproteins transporting lipids in the blood. Among them, apolipoprotein A-1 (ApoA-1) is the major protein fraction of high-density lipoproteins, which play a key role in reverse cholesterol transport and are endowed with substantial anti-inflammatory and antioxidant properties, thereby exercising a protective role in the cardiovascular system [4, 5]. Notably, Abs directed against ApoA-1 were initially described in patients with SLE and the aPL syndrome [6–8]. The literature has since expanded, illustrating their potential role as risk factors in the development of CVEs, both in diseases with an auto-immune background (such as RA [9]) and in other pathological contexts, particularly coronary heart disease [10–13]. They have also been found in the general population, where these antibodies have been reported to represent an independent CVE risk factor [14] associated with increased mortality, susceptibility polymorphisms and incident coronary events [15, 16], although this has recently been disputed [17].
Moreover, two immunodominant epitopes were identified in ApoA-1, and a synthetic, stable peptide, named F3L1, which mimics a portion of the C-terminal alpha-helix, is preferentially recognized by Abs in individuals with CVEs [18, 19].
When studied in SLE, anti-ApoA-1 Abs (anti-ApoA-1 IgG) have been variably associated with disease activity. It is still debated whether or not their presence is associated with CVEs [20–24], and no data are available on anti-F3L1 antibodies in SLE. We revisited these issues through the lens of the well-characterized, nationwide, multicentric, transdisciplinary Swiss SLE Cohort Study [25].
Methods
Patient cohort
Serum samples were obtained from 176 individuals satisfying at least four ACR SLE criteria and consecutively enrolled in the prospective Swiss SLE Cohort Study from April 2007 to January 2015 [25]. Follow-up samples were collected yearly (a total of 354 distinct samples), and these were processed in a single laboratory in Geneva. Disease activity was captured by Safety of Estrogens in Lupus Erythematosus National Assessment (SELENA)-SLEDAI [26], with organ involvement and medication recorded at each study visit [25]. The controls were age- and sex-matched healthy individuals donating blood at the Transfusion Centre of the University Hospital in Geneva. Ethical clearance was granted in all participating Swiss SLE Cohort Study centres. Informed, written consent was obtained from all participants in accordance with the Declaration of Helsinki.
Determination of human antibodies to ApoA-1/F3L1 by ELISA
Anti-ApoA-1 and anti-F3L1 IgG serum levels were assessed as previously described [10, 11, 27]. All samples were tested in duplicates. An index consisting of the ratio between sample absorbance and a standard positive control absorbance ×100 was calculated. Sera from 48 healthy donors served to define the threshold for positivity of anti-ApoA-1 IgG and for anti-F3L1 IgG. The value corresponding to the 97.5th percentile of the normal distribution gave an IgG index of 42 for anti-ApoA-1 and 37 for anti-F3L1. Accordingly, samples tested for anti-ApoA-1 were considered positive when their index was ⩾42, and samples tested for anti-F3L1 were considered positive when ≥37.
Determination of antibodies to dsDNA by ELISA
Anti-dsDNA serum levels were measured by ELISA using a commercially available method (QUANTA Lite dsDNA, Inova Diagnotics, San Diego, CA), according to the supplier’s instructions, in a single laboratory in Geneva (Laboratory of Immunology and Allergy, University Hospital, Switzerland). The threshold of positivity was 200 U.
Determination of aPL
Lupus anticoagulant was detected using ACL TOP (IL, France), which detected the ability to prolong the phospholipid-dependent DRVVT test. The presence and titre of aCL, anti-β2 glycoprotein 1 (anti-β2GP1) IgG and aPS-PT IgG was assessed using the HemosIL AcuStar Coagulation Analyzer (Instrumentation Laboratory, Bedford, MA) [28]. The cut-off values for these tests were based on the 99th percentile and the corresponding 95% confidence interval for each antibody of 626 healthy Blood Bank donors. All the assays were performed in a single laboratory in Geneva (Hemostasis Unit, University Hospital, Switzerland).
Competition ELISA to test the cross-reactivity of anti-ApoA-1 Ab
Sera of patients known to be highly positive for anti-ApoA-1 IgG, anti-β2GP1 IgG and anti-dsDNA IgG were pre-incubated for 2 h at room temperature with or without different competitors: F3L1 (Geneva University, Switzerland), β2GP1 (Haematologic Technologies Inc., USA) and dsDNA (Inova Diagnostics, USA) at three concentrations prior to addition to wells coated with ApoA-1. Anti-Apo-A1 IgG were then assessed according to standard protocol. Tests were performed in triplicate. Percentage maximal ELISA signals were calculated as 100 × {[signal in well]−[mean background signal (uncoated well)]}/{[mean maximal signal (no competing peptide)]−[mean background signal]}.
Statistical analysis
To compare groups according to anti-ApoA-1 IgG status, we used the Fisher’s exact, χ2 tests for categorical variables, the Mann–Whitney test for continuous variables. To compare groups’ characteristics at baseline and at the 1 year assessment, we used McNemar’s test and the dependent t test. Spearman correlations were used for bivariable association. For multivariable association, we used multilevel regression with random intercept to account for the repeated measures per individual. Statistical analysis was performed by using SPSS Statistics® version 25 from IBM Corp. Armonk, NY USA, and Prism® version 7 from Graphpad Software Inc, San Diego, California.
Results
Clinical characteristics of anti-ApoA-1 IgG+ and anti-F3L1 IgG+ SLE patients
This cohort was composed of 176 SLE individuals. Their mean age at inclusion was 44 years (15) [range 17–85], 85% were women, and 78% were of Caucasian origin. The mean age at SLE diagnosis was 35 years (15) [range 12–73]. Of the 176 included SLE patients, 104 individuals contributed an additional sample after 1 year; 47 after 2 years; 20 after 3 years; 6 after 4 years and 1 after 5 years. Anti-ApoA-1 IgG Abs were detected in 76 (43%) initial samples of the 176 patients. The main clinical characteristics, distribution of ACR criteria, as well as treatment at inclusion are reported in Table 1. In general, no major clinical differences were observed when anti-ApoA-1 IgG+ and anti-ApoA-1 IgG– individuals were compared, with the exception of younger age at first assessment [42 (15) years in anti-ApoA-1 IgG+, vs 46 (14) years in anti-ApoA-1 IgG–, P=0.048] and lower frequency of seizures in anti-ApoA-1 IgG+ (12% in anti-ApoA-1 IgG– and 3% in anti-ApoA-1 IgG+, P=0.025). Notably, however, the frequency of individuals historically positive for aPL, and the frequency of individuals under anti-platelet agents, were both statistically higher in anti-ApoA-1 IgG+ compared with anti-ApoA-1 IgG– individuals. Thus, 62% vs 37% (P < 0.001) were positive for aPL and 29% vs 13% (P < 0.001) were under anti-platelets agents in anti-ApoA-1 IgG+ and anti-ApoA-1 IgG–, respectively. All sera were also tested for anti-F3L1 antibodies, and 39 patients (22%) were positive at first assessment, with a moderate agreement with anti-ApoA-1 IgG positivity (kappa coefficient=0.348; P < 0.05). However, anti-ApoA-1 and anti-F3L1 antibodies titres were highly correlated (Spearman coefficient=0.66, P < 0.001). At inclusion, in accordance with associations found with anti-ApoA-1 IgG+, the anti-F3L1 IgG positive compared with negative individuals were more likely to be positive for aPL (74% vs 40%, P < 0.001). Other items at inclusion did not differ significantly according to the anti-F3L1 IgG status (Table 1). ‘Total cholesterol and triglycerides levels were available in 123 individuals, of which 18 were under statin treatment. Total cholesterol and triglyceride levels were not different in anti-ApoA-1 IgG positive vs negative patients, regardless of whether they were receiving lipid-lowering drugs or antimalarials.’
Characteristics at inclusion into the SLE cohort with respect to anti-ApoA-1/anti-F3L1 IgG status
| Clinical/biological features | All (n = 176) | Anti-ApoA1 IgG – (n = 100) | Anti-ApoA1 IgG + (n = 76) | P-value | Anti-F3L1 IgG – (n = 137) | Anti-F3L1 IgG + (n = 39) | P-value |
|---|---|---|---|---|---|---|---|
| Baseline characteristics: | |||||||
| Sex, women/men (%) | 149/27 (85/15) | 86/14 (86/14) | 63/13 (83/17) | 0.571 | 114/23 (83/17) | 35/4 (90/10) | 0.318 |
| Caucasian, no. (%) | 138 (78) | 82 (82) | 56 (74) | 0.442 | 110/136 (81) | 28 (72) | 0.362 |
| Age at SLE diagnosis, mean (s.d.) [range], years | 35 (15) [12–73] | 36 (16) [12–73] | 33 (15) [12–72] | 0.257 | 35 (16) [14–62] | 34 (14) [16–60] | 0.728 |
| Age at first assessment, mean (s.d.) [range], years | 44 (15) [17–85] | 46 (14) [19–85] | 42 (15) [17–81] | 0.048 | 45 (15) [24–73] | 41 (14) [18–71] | 0.139 |
| BMI, mean (s.d.) [range], kg/m2 | 24 (5) [15–40] | 25 (6) [16–40] | 24 (4) [15–38] | 0.747 | 24 (5) [18–33] | 24 (4) [19–32] | 0.402 |
| Active smoking, no. (%) | 44/155 (28) | 23/88 (26) | 21/67 (31) | 0.476 | 35/121 (29) | 9/34 (27) | 0.833 |
| Smoking in pack-years units, mean (s.d.) [range] | 11 (18) [0–91] | 13 (20) [0–91] | 10 (16) [0–75] | 0.960 | 13 (20) [0–60] | 9 (13) [0–40] | 0.792 |
| ACR criteria at inclusion: | |||||||
| Arthritis, no. (%) | 144 (82) | 84 (84) | 60 (79) | 0.389 | 116 (85) | 28 (72) | 0.097 |
| Discoid rash, no. (%) | 33 (19) | 21/99 (21) | 12 (16) | 0.363 | 28/136 (21) | 5 (13) | 0.356 |
| Malar rash, no. (%) | 74 (42) | 44 (44) | 30 (39) | 0.547 | 54 (39) | 20 (51) | 0.185 |
| Nasopharyngeal ulcers, no. (%) | 41 (23) | 23 (23) | 18 (24) | 0.915 | 30 (22) | 11 (28) | 0.411 |
| Pericarditis, no. (%) | 40 (23) | 22 (22) | 18 (24) | 0.792 | 35 (26) | 5 (13) | 0.129 |
| Photosensitivity, no. (%) | 83 (47) | 49 (49) | 34 (45) | 0.575 | 65 (47) | 18 (46) | 0.887 |
| Pleuritis, no. (%) | 42 (24) | 25 (25) | 17 (22) | 0.685 | 34 (25) | 8 (21) | 0.673 |
| Psychosis, no. (%) | 10 (6) | 8 (8) | 2 (3) | 0.191 | 10 (7) | 0 | 0.120 |
| Renal disorder, no. (%) | 80 (46) | 43 (43) | 37 (49) | 0.541 | 62 (45) | 18 (46) | 0.921 |
| Seizures, no. (%) | 14 (8) | 12 (12) | 2 (3) | 0.025 | 13 (10) | 1 (3) | 0.310 |
| Anti-dsDNA antibodies positive, no. (%) | 119 (68) | 62/99 (63) | 57 (75) | 0.082 | 91/136 (67) | 28 (71) | 0.564 |
| Anti-Sm antibody positive, no. (%) | 39 (22) | 18/98 (18) | 21 (28) | 0.146 | 26/135 (19) | 13 (33) | 0.063 |
| Anti-phospholipid antibodies positivea no. (%) | 83 (48) | 36/98 (37) | 47 (62) | 0.001 | 54/135 (40) | 29 (74) | <0.001 |
| Anti-nuclear antibodies positive, no. (%) | 172 (98) | 98/99 (99) | 74 (97) | 0.413 | 134/136 (99) | 38 (97) | 0.643 |
| Hematologic disorder, no. (%) | 110 (63) | 60 (60) | 50 (66) | 0.432 | 82 (60) | 28 (72) | 0.174 |
| Treatments: | |||||||
| Systemic corticosteroids, no. (%) | 54 (31) | 36 (36) | 18 (24) | 0.079 | 76 (56) | 17 (44) | 0.190 |
| Antimalarial agents, no. (%) | 102 (58) | 56 (56) | 46 (61) | 0.547 | 79 (58) | 23/39 (59) | 0.884 |
| Immunosuppressant agents, no. (%) | 64 (36) | 39 (39) | 25 (33) | 0.404 | 53 (39) | 11 (28) | 0.230 |
| NSAID on a daily basis, no. (%) | 24/167 (14) | 10/92 (11) | 14/75 (19) | 0.153 | 16/128 (13) | 8 (21) | 0.295 |
| Anticoagulants, no. (%) | 23/170 (14) | 11/97 (11) | 12/73 (16) | 0.336 | 40/132 (30) | 17/38 (45) | 0.097 |
| Antiaggregants, no. (%) | 34/170 (20) | 13/97 (13) | 21/73 (29) | 0.013 | 26/132 (20) | 8/38 (21) | 0.822 |
| Lipid-lowering drugs, no. (%) | 21/173 (12) | 15/99 (15) | 6/74 (8) | 0.239 | 15/135 (11) | 6/38 (16) | 0.412 |
Include lupus anticoagulant, anti-cardiolipin IgG and IgM; the anti-beta2-glycoprotein-1 IgG and IgMχ2 test (n > 10) or Fisher test (n < 10) were used to compare groups with categorical variables; the Mann–Whitney test was used to compare groups with continuous data; significant P values are shown in bold text.
ApoA-1: apolipoprotein A-1.
Intergroup difference in SLE treatments
Anti-ApoA-1 IgG+ showed a trend for higher frequency of use of CSs at inclusion, although this was not significant (Table 1). However, we demonstrated a significantly higher frequency of anti-ApoA-1 among patients grouped by CSs treatment categories <10 mg/day or >10 mg/day (P=0.04), in accordance with previous data [24]. No significant difference was found when comparing anti-ApoA-1 IgG+ and anti-ApoA-1 IgG– groups for antimalarial agents, immunosuppressant agents, NSAIDs, lipid-lowering drugs or anti-coagulant use (Table 1).
Association between anti-ApoA-1 IgG/anti-F3L1 IgG and parameters of disease activity in SLE
SLEDAI was slightly but statistically significantly higher in anti-ApoA-1 IgG+, with a median of 6 points (interquartile range 2–10) compared with 4 points (interquartile range 0–8) in anti-ApoA-1 IgG– individuals, P=0.028. This was also observed when comparing anti-F3L1 IgG+ and anti-F3L1 IgG– individuals, P=0.025 (Table 2). While there was a trend for an association between anti-ApoA-1 IgG+ and arthritis (26% vs 16%, P=0.093), no other clinical items captured by SLEDAI were associated with anti-ApoA-1 IgG positivity. However, a number of laboratory items were more frequently abnormal in anti-ApoA-1 IgG+ compared with in anti-ApoA-1 IgG– individuals. These included the presence of haematuria, proteinuria, leukopoenia and anti-dsDNA Abs, and lower levels of complement C3 and C4. Similarly, anti-F3L1 IgG+ compared with anti-F3L1 IgG– individuals had significantly higher anti-dsDNA IgG titres, and lower complement levels for both C3 and C4 (Table 2). To foster these observations, we then assessed whether there was a correlation between the titre of anti-ApoA-1 IgG and the titre of anti-dsDNA Abs, and with the C3 and C4 serum levels, in all longitudinal samples that were available (n = 354). A positive correlation was observed with anti-dsDNA Abs, and a negative correlation with C3 and C4 serum levels (Fig. 1A). Notably, the correlation was lower when the contribution of complement consumption was excluded from the SLEDAI, and was not any more significant when both the contribution of anti-dsDNA antibodies’ positivity and complement consumption were excluded (Fig. 1B). Similar results were found for anti-F3L1 IgG, which showed a positive correlation with anti-dsDNA (n = 348, Spearman rho = 0.412, P < 0.001) and a negative correlation with C3 (rho=−0.299, P < 0.001) and C4 (rho=−0.252, P < 0.001) (Fig. 1C). There was a correlation with SLEDAI (rho = 0.174, P=0.001), which was still significant when complement consumption was removed from the SLEDAI (P=0.014), but which lost significance when both anti-dsDNA and complement consumption were removed from the score (P=0.352) (Fig. 1D).
Disease activity at inclusion with respect to the anti-ApoA1/anti-F3L1 IgG status
| Disease activity: | All (n = 176) | Anti ApoA1-IgG – (n = 100) | Anti ApoA-1 IgG+ (n = 76) | P-value | Anti-F3L1 IgG – (n = 137) | Anti-F3L1 IgG + (n = 39) | P-value | |
|---|---|---|---|---|---|---|---|---|
| SELENA-SLEDAI, median (IQR) | 4 (2–9) | 4 (0–8) | 6 (2–10) | 0.028 | 4 (0–8) | 7 (2–11) | 0.025 | |
| SLEDAI items: | ||||||||
| Alopecia, no. (%) | 15/175 (9) | 6 (6) | 9/75 (12) | 0.181 | 12/136 (9) | 3 (8) | 1 | |
| Arthritis, no. (%) | 36 (21) | 16 (16) | 20 (26) | 0.093 | 27 (20) | 9 (23) | 0.645 | |
| Cerebrovascular accident, no. (%) | 0 | |||||||
| Cranial nerve disorder, no. (%) | 2 (1) | 1 (1) | 1 (1) | 1 | 2 (2) | 0 | 1 | |
| Fever, no. (%) | 8/175 (5) | 3/99 (3) | 5 (7) | 0.296 | 5/136 (4) | 3 (8) | 0.379 | |
| Lupus headache, no. (%) | 15 (9) | 10 (10) | 5 (7) | 0.587 | 11 (8) | 4 (10) | 0.745 | |
| Mucosal ulcers, no. (%) | 16 (9) | 7 (7) | 9 (12) | 0.299 | 11 (8) | 5 (13) | 0.354 | |
| Myositis, no. (%) | 7/175 (4) | 3 (3) | 4/75 (5) | 0.464 | 4 (3) | 3/38 (8) | 0.175 | |
| Organic brain syndrome, no. (%) | 0 | |||||||
| Pericarditis, no. (%) | 6/175 (3) | 2/99 (2) | 4 (5) | 0.405 | 6/136 (4) | 0 | 0.340 | |
| Pleuritis, no. (%) | 6 (3) | 2 (2) | 4 (5) | 0.405 | 4 (3) | 2 (5) | 0.615 | |
| Psychosis, no. (%) | 2 (1) | 2 (2) | 0 | 0.506 | 2 (2) | 0 | 1 | |
| Rash, no. (%) | 34 (19) | 20 (20) | 14 (18) | 0.793 | 24 (18) | 10 (26) | 0.257 | |
| Seizure, no. (%) | 1 (1) | 1 (1) | 0 | 1 | 1 (1) | 0 | 1 | |
| Vasculitis, no. (%) | 2/175 (1) | 1 (1) | 1/75 (1) | 1 | 2/136 (2) | 0 | 1 | |
| Visual disturbance, no. (%) | 7/175 (4) | 4 (4) | 3/75 (4) | 1 | 4/136 (3) | 3 (8) | 0.186 | |
| Anti-dsDNA, no. (%) | 68/146 (47) | 27/73 (37) | 41/73 (56) | 0.020 | 45/109 (41) | 23 (62) | 0.028 | |
| Hematuria, no. (%) | 26/154 (17) | 10/88 (11) | 16/66 (24) | 0.035 | 19/120 (16) | 7/34 (21) | 0.604 | |
| Leukopenia, no. (%) | 21/169 (12) | 7/95 (7) | 14/74 (19) | 0.033 | 13/131 (10) | 8/38 (21) | 0.091 | |
| Low complement, no. (%) | 47/148 (32) | 19/80 (24) | 28/68 (41) | 0.023 | 30/113 (27) | 17/35 (49) | 0.014 | |
| C3, mean (s.d.) [range], mg/l | 0.87 (0.28) [0.27–1.95] | 0.94 (0.3) [0.42–1.95] | 0.8 (0.24) [0.27–1.4] | 0.007 | 0.91 (0.29) [0.37–1.95] | 0.76 (0.23) [0.27–1.36] | 0.009 | |
| C4, mean (s.d.) [range], mg/l | 0.16 (0.08) [0.02–0.47] | 0.17 (0.09) [0.02–0.47] | 0.14 (0.07) [0.02–0.4] | 0.025 | 0.17 (0.09) [0.02–0.47] | 0.12 (0.06) [0.02–0.27] | 0.006 | |
| Proteinuria (>0.5 g/24 h), no. (%) | 21/132(16) | 7/73 (10) | 14/59 (24) | 0.033 | 15/105 (14) | 6/27 (22) | 0.376 | |
| Pyuria, no. (%) | 26/157 (17) | 14/90 (16) | 12/67 (18) | 0.695 | 18/121 (15) | 8/36 (22) | 0.313 | |
| Thrombocytopenia, no. (%) | 10/172 (6) | 3/96 (3) | 7/76 (9) | 0.109 | 6/133 (5) | 4 (10) | 0.237 | |
| Urinary casts, no. (%) | 9/152 (6) | 4/87 (46) | 5/65 (8) | 0.498 | 7/117 (6) | 2/35 (6) | 1 | |
| PGA | Inactive (0 pts), no. (%) | 96/175 (55) | 57/99 (58) | 39 (51) | 0.409 | 17 (44) | 22 (56) | 0.109 |
| Active (1–3 pts), no. (%) | 79/175 (45) | 42/99 (42) | 37 (49) | 79 (58) | 57 (42) | |||
| SLE Damage Index (SLICC/ACR), median (IQR) | 0 (0–2) | 0 (0–2) | 0 (0–2) | 0.830 | 0 (0–2) | 0 (0–2) | 0.456 |
χ2 test (n > 10) or Fisher test (n < 10) were used to compare groups with categorical variables; Mann–Whitney test was used to compare groups with continuous data, significant P values are shown in bold text.
IQR: interquartile range; SELENA: Safety of Estrogens in Lupus Erythematosus National Assessment; ApoA-1: apolipoprotein A-1; PGA: Physician Global Assessment.
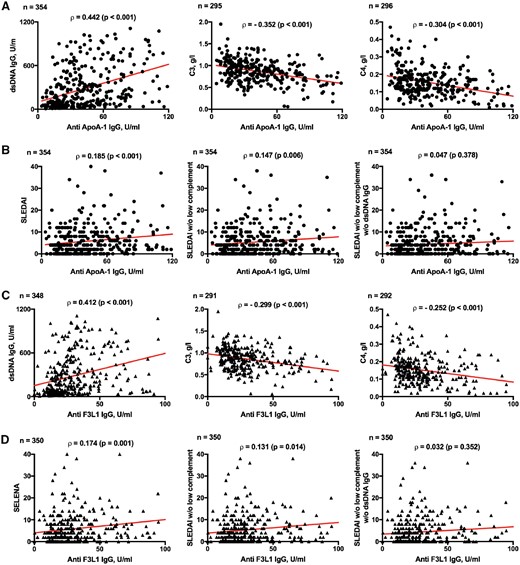
Correlation between anti-ApoA-1 IgG/anti-F3L1 IgG and parameters of SLE disease activity
Correlation between anti-ApoA-1 IgG levels and biological parameters of SLE disease activity (A) or SELENA-SLEDAI (B) as well between anti-F3L1 IgG levels and biological parameters of SLE disease activity (C) or SELENA-SLEDAI (D) were calculated. DsDNA IgG was determined by ELISA, C3 and C4 determined by nephelometry, all assessed at the time of sample. Rho was computed according to the Spearman test; the red line shows bivariate linear regression. ApoA-1: apolipoprotein A-1; SELENA: Safety of Estrogens in Lupus Erythematosus National Assessment.
Multiple regression analysis
When using multiple regression analysis, both the contribution of anti-ApoA-1 and anti-F3L1 antibodies to SLEDAI lost significance when adjusted for anti-dsDNA (P=0.85 for anti-ApoA-1 IgG and P=0.26 for anti-F3L1 IgG), which may be explained by the strong correlation between anti-dsDNA and anti-ApoA-1 or anti-F3L1 titres.
Covariation over time of anti-ApoA-1/F3L1 IgG titres with anti-dsDNA IgG titres
Given the positive correlation between anti-ApoA-1/anti-F3L1 IgG and anti-dsDNA IgG observed in the 354 samples available, we then assessed whether variations in time in the titre of anti-ApoA-1 IgG were associated with similar changes in the titre of anti-dsDNA Abs, taking into account the cohort samples obtained at inclusion and 1 year apart (n = 104). The clinical characteristics of the individuals studied 1 year apart were similar to data at inclusion (not shown). Interestingly, the variations in time in the titre of anti-ApoA-1 IgG+ were statistically associated with variations in the titre of anti-dsDNA IgG (Table 3). Similar analyses conducted with complement C3 and C4 levels indicated significant negative association of anti-ApoA-1 IgG with C3, albeit to a lower level of statistical significance, and a trend for negative association, not statistically significant, for C4. Very similar data were observed for anti-F3L1 IgG (Table 3). Thus, the titre of anti-ApoA-1/F3L1 IgG appears to be exquisitely correlated with the titre of anti-dsDNA IgG and its variation over time.
Covariation in time of anti-ApoA-1/anti-F3L1 IgG and anti-dsDNA IgG titres, complement C3 and C4
| Δ SLEDAI | Δ anti-dsDNA IgG | Δ C3 | Δ C4 | ||
|---|---|---|---|---|---|
| Δ anti-ApoA-1 IgG | n | 104 | 104 | 77 | 77 |
| Spearman rho | 0.114 | 0.341 | −0.228 | −0.188 | |
| P value | 0.248 | <0.001 | 0.046 | 0.101 | |
| Δ anti-F3L1 IgG | n | 101 | 100 | 74 | 74 |
| Spearman rho | 0.169 | 0.459 | −0.213 | −0.173 | |
| P value | 0.091 | <0.001 | 0.068 | 0.141 | |
Δ=difference in the titre of the parameter in two samples of the same individual taken 1 year apart.
Significant P values are shown in bold text.
ApoA-1: apolipoprotein A-1.
Association of anti-ApoA-1/F3L1 IgG with aPL
As reported in Table 1, the historic frequency of aPL Abs (ACR criteria) was higher in anti-ApoA-1 IgG+ than in anti-ApoA-1 IgG–. To better characterize this association, we tested the very same inclusion serum samples for which anti-ApoA-1 IgG were assessed for the presence of aCL IgG, anti-β2GP1 IgG, aPS-PT IgG and DRVVT [28]. The frequency of aCL IgG+ (32% vs 12%, P=0.001), anti-β2GP1 IgG+ (33% vs 14%, P=0.003), aPS-PT IgG (22% vs 12%, P=0.066) and the positivity of DRVVT (36% vs 13%, P < 0.001) were higher in anti-ApoA-1 IgG+ than in anti-ApoA-1 IgG– sera. When such associations were searched for anti-F3L1 reactivity, only aPS-PT IgG was significantly more frequent in anti-F3L1 IgG–positive than anti-F3L1 IgG–negative samples (28% vs 13%, P=0.025) (not shown).
No cross-reactivity between anti-ApoA-1 and anti-dsDNA IgG revealed by competition ELISA
Given the correlations observed between anti-ApoA-1, anti-dsDNA and anti-β2GP1 IgG, we tested whether cross-reactivity could explain, at least in part, our findings by performing competition assays. Using a triple positive serum for anti-ApoA-1, anti-β2GP1 and anti-dsDNA IgG, we observed that F3L1 did inhibit dose-dependently the anti-ApoA-1 reactivity. In the same assay, dsDNA did not inhibit, while β2GP1 was partially inhibitory (Fig. 2). Conversely, dsDNA, but not F3L1, inhibited anti-dsDNA reactivity, and β2GP1, but not F3L1, inhibited anti-β2GP1 reactivity (Supplementary Fig. S1, available at Rheumatology online). Thus, the correlation that we observed between anti-ApoA-1 and anti-dsDNA IgG titres was not due to cross-reactivity of the sera.
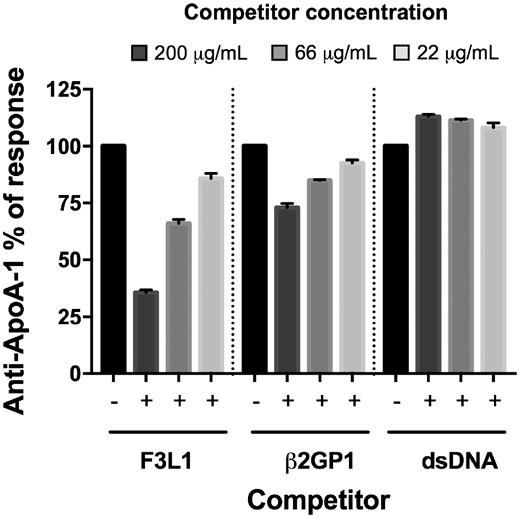
Cross-reactivity between anti-ApoA-1 and other auto-antibodies
The serum of a representative patient of four tested, known to be positive for anti-ApoA-1 IgG, anti-β2GP1 IgG and anti-dsDNA IgG, was pre-incubated with or without the various competitors (F3L1, β2GP1 and dsDNA) at the indicated concentrations prior to addition to assay wells for anti-ApoA1 IgG measurement. Percentage maximal ELISA signals were calculated as 100×{[signal in well]−[mean background signal (uncoated well)]}/{[mean maximal signal (no peptide)]−[mean background signal]}. Results are expressed as mean (s.d.) (n =3). ApoA-1: apolipoprotein A-1.
Anti-ApoA-1 IgG, anti-F3L1 IgG positivity and arterio-venous thrombo-embolic vascular events
Previous reports in pathological conditions other than SLE, as well as in the general population, have documented an association between the presence of anti-ApoA-1 IgG and CVEs. Therefore, we assessed whether this was the case in our cohort. Arterial and venous vascular events were frequent in our study population, with an overall prevalence of 21%, of which 20 were venous, 22 arterial, and 37 either venous or arterial. There was no statistically significant difference in the frequency of CVEs between anti-ApoA-1 IgG+ and IgG– groups, or between anti-F3L1 IgG+ and IgG– groups (Table 4).
Presence of anti-ApoA-1 and anti-F3L1 IgG is not associated with arterial or venous vascular events
| All (N = 176) | Anti-ApoA-1 IgG – (N = 100) | Anti-ApoA-1 IgG + (N = 76) | P-value | Anti-F3L1 IgG – (N = 137) | Anti-F3L1 IgG + (N = 39) | P-value | |
|---|---|---|---|---|---|---|---|
| Arterial events, no. (%) | 20 (11) | 12 (12) | 8 (11) | 0.760 | 28 (20) | 9 (23) | 0.824 |
| Venous events, no. (%) | 22 (13) | 11 (11) | 11 (14) | 0.490 | 18 (13) | 2 (5) | 0.252 |
| Arterial or venous events, no. (%) | 37 (21) | 20 (20) | 17 (22) | 0.702 | 15 (11) | 7 (18) | 0.274 |
χ2 test (n > 10) or Fisher test (n < 10) were used to compare groups.
ApoA-1: apolipoprotein A-1.
Discussion
The results here reported confirm and extend previous findings, by highlighting a striking association of anti-ApoA-1 IgG with anti-dsDNA antibody levels, with other laboratory parameters of disease activity and with steroid dose as shown previously [24], supporting a role for anti-ApoA-1 IgG as a laboratory marker of SLE activity, and suggesting that anti-ApoA-1 IgG may participate in SLE pathogenesis. In addition, we show for the first time that anti-F3L1 Abs correlate with disease activity and anti-dsDNA Abs in SLE patients. Remarkably, we found an association of anti-ApoA-1 IgG with aPL antibodies but not with CVEs.
Previous publications highlighted the link between anti-ApoA-1 IgG and SLE activity when assessed by SLEDAI, ECLAM and BILAG scores [20, 22–24, 29]. We confirm here that anti-ApoA-1 IgG correlates with SELENA-SLEDAI. However, we found that the laboratory items of SELENA-SLEDAI, in particular the presence of anti-dsDNA IgG and lower levels of complement C3 and C4, were more frequent in anti-ApoA-1 IgG+ and anti-F3L1 IgG+ compared with anti-ApoA-1/F3L1 IgG negative. Our data highlight in particular the relationship between the presence and titre of anti-ApoA-1 IgG and anti-dsDNA IgG at inclusion, and the correlation between their titre variations over time. The multiple regression analysis showed that anti-dsDNA IgG rather than anti-ApoA-1 IgG explained the association with disease activity. However, we could not find cross-reactivity in a competition ELISA, which supports a biologically independent role of anti-ApoA-1 IgG. Consistently, a correlation of anti-ApoA-1 IgG with anti-dsDNA IgG was reported in patients with active lupus nephritis [22], not observed by others [8, 23, 24]. The discrepancies may be explained by technical differences characterizing the assays used to detect anti-dsDNA IgG and anti-ApoA-1 IgG. In particular, the ELISA we used to assess the presence of anti-dsDNA IgG may be more sensitive than the Farr assay used by others [22, 24].
Along the same lines, it is noteworthy that in our cohort the titre of anti-ApoA-1 IgG was in inverse correlation with complement C3 and C4 levels, as already reported [23]. Similar trends were observed for anti-F3L1 IgG. Furthermore, we show an inverse covariance with time in C3 and C4 titres that reinforces the contention that anti-ApoA-1 IgG may take part in important immunologic events in SLE pathogenesis. In this respect, it is important to stress that ApoA-1 is known to potentially interact with several self-components, some of which are decorated with danger-associated molecular patterns. Thus, we could speculate that some of these interactions would favour anti-ApoA-1 autoimmune responses fluctuating consensually with dsDNA antibody titres and inversely with C3 and C4 and accompanying SLE disease activity. The full range of known ApoA-1 interactions with other self-components can be found in BioGRID3.5. [30].
An interesting finding in our study was the association between anti-ApoA-1 IgG and aPL Abs. In addition, the use of anti-platelet agents was significantly more frequent in our anti-ApoA-1 IgG+ population, possibly in relation to the frequent use of low-dose aspirin in individuals positive for aPL but not having experienced thrombotic events [31, 32]. Although some of the previous studies on anti-ApoA-1 IgG in SLE have not found an association with aPL Abs [22, 23], the potential interaction between aCL IgG and anti-ApoA-1 IgG was suggested by studies showing decreased levels of apolipoprotein A1 in individuals positive for aCL Abs [33]. However, our findings indicate a slight inhibition of anti-ApoA-1 IgG reactivity when competed with β2GP1 protein, suggesting potential cross-reactivity with aPL Abs, in agreement with Delgado et al. [34].
In various pathological conditions [10, 11, 35], as well as in the general population [15, 16], the presence of anti-ApoA-1 IgG has been associated with an increased risk of CVEs. This association has recently been questioned [17]. In agreement with three previous reports on SLE patients [22, 24], our results did not reveal an association between the presence of anti-ApoA-1 IgG and arterial or venous vascular events in SLE. This lack of an association is even more surprising given the correlation in the titres of aPL Abs with anti-ApoA-1 IgG, and the frequent association of aPL Abs with CVEs [36]. However, the overall low number of CVEs in our cohort (n = 37) may represent a serious limitation for the interpretation of these data. Furthermore, the high frequency of patients in our cohort simultaneously taking low-dose aspirin and HCQ may have had an impact on CVE risk. Indeed, it has been recently observed that this therapeutic combination has additive effects in the primary prevention of CVEs in SLE [37, 38]. It is important to stress that, in the very same Swiss SLE cohort, we found that CVEs were associated with the presence of lupus anticoagulant and anti-phosphatidylserine/prothrombin complex IgG [28].
In our study, the frequency of anti-F3L1 IgG positive sera were about half of our ApoA1 IgG samples, in accordance with previous studies [18, 19]. While precise immunomapping of ApoA-1 was not performed with SLE sera, in our study anti-F3L1 IgG, similarly to anti-ApoA-1 IgG, were associated with SLE activity markers: SELENA-SLEDAI, dsDNA antibodies, and low complement. Furthermore, anti-F3L1 IgG have been reported to be associated with CVEs in individuals without autoimmune diseases [18], a finding that we could not replicate in our SLE cohort. Anti-ApoA-1 IgG in SLE may trigger biological responses qualitatively different from those observed in other conditions. Indeed, anti-ApoA-1 IgG have been shown to interact with TLR2 and 4 and recruit CD14 in the context of atherothrombosis [39–41]. Whether this is the case in SLE requires experimental enquiry. Thus, anti-ApoA-1 and anti-F3L1 IgG do not appear to be associated with CVEs in a cohort in which classical and novel aPL were studied.
There are several limitations in our study. First, the number of individuals included in the cohort at study initiation decreased during follow-up, leading to a risk of selection bias. However, the frequency of positive samples for anti-ApoA-1 IgG as well as disease activity were not different when compared at inclusion and 1 year later (Supplementary Tables S1 and S2 and Supplementary Fig. S2, available at Rheumatology online). Second, this is not an inception cohort, and most thrombotic events were recorded by review of the clinical charts. Others have found that thrombotic events accumulate over time [42]. It is possible that the prospective follow-up of our cohort would reveal an association with anti-ApoA-1 IgG. Third, within the anti-ApoA-1 antibody repertoire, we did not test for isotypes other than IgG, thus limiting the potential for detecting important clinical associations.
In conclusion, anti-ApoA-1 IgG are present in a sizable proportion of SLE individuals, and their presence correlates strongly with the presence of anti-dsDNA IgG, with other SLE biomarkers associated with disease activity and with high steroid use. In contrast with the analysis in other populations, but consistent with previous reports in SLE, our data do not indicate that anti-apoA-1 IgG nor anti-F3L1 IgG are associated with CVEs in SLE. Therefore, the possible clinical relevance of anti-apoA-1 IgG in SLE may be of greater interest in better capturing patients at risk of more active SLE disease, than in identifying SLE patients at higher CVE risk. These data suggest that the routine identification of anti-ApoA-1 IgG may be a useful adjunct for monitoring SLE.
Acknowledgements
This work was supported in part by Grant 310030–159999 from the Swiss National Science Foundation to C.C., in part by a Gebert Ruf grant to M.T., and in part by a Geneva University Hospital Research grant to P.R.L. H.N., P.R.L. and C.C. were responsible for the study conception. C.R., M.T., U.H.-D. and C.C. acquired the clinical data and collected samples. S.P., M.A. and P.R.L. acquired the laboratory data. H.N., P.R.L., C.C. and C.R. analysed the data and drafted the manuscript. H.N., D.S.C. and C.C. performed the statistical analysis. N.V. provided critical reading. All authors approved the final manuscript.
Funding: No specific funding was received from any funding bodies in the public, commercial or not-for-profit sectors to carry out the work described in this manuscript.
Disclosure statement: N.V. and S.P. are named as co-inventors on the patent PCT/IB2013/059948 related to the use of F3L1 to detect cognate antibodies.
References
Author notes
Carlo Chizzolini and Pascale Roux-Lombard contributed equally to this study.

Comments