


Abstract
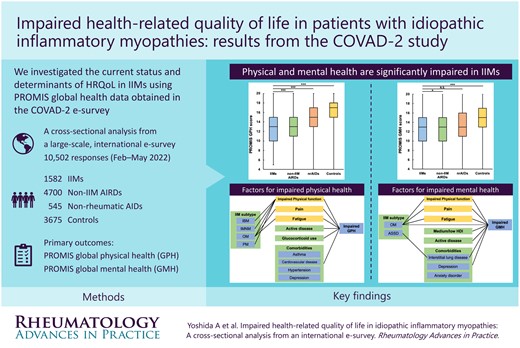
To investigate health-related quality of life in patients with idiopathic inflammatory myopathies (IIMs) compared with those with non-IIM autoimmune rheumatic diseases (AIRDs), non-rheumatic autoimmune diseases (nrAIDs) and without autoimmune diseases (controls) using Patient-Reported Outcome Measurement Information System (PROMIS) instrument data obtained from the second COVID-19 vaccination in autoimmune disease (COVAD-2) e-survey database.
Demographics, diagnosis, comorbidities, disease activity, treatments and PROMIS instrument data were analysed. Primary outcomes were PROMIS Global Physical Health (GPH) and Global Mental Health (GMH) scores. Factors affecting GPH and GMH scores in IIMs were identified using multivariable regression analysis.
We analysed responses from 1582 IIM, 4700 non-IIM AIRD and 545 nrAID patients and 3675 controls gathered through 23 May 2022. The median GPH scores were the lowest in IIM and non-IIM AIRD patients {13 [interquartile range (IQR) 10–15] IIMs vs 13 [11–15] non-IIM AIRDs vs 15 [13–17] nrAIDs vs 17 [15–18] controls, P < 0.001}. The median GMH scores in IIM patients were also significantly lower compared with those without autoimmune diseases [13 (IQR 10–15) IIMs vs 15 (13–17) controls, P < 0.001]. Inclusion body myositis, comorbidities, active disease and glucocorticoid use were the determinants of lower GPH scores, whereas overlap myositis, interstitial lung disease, depression, active disease, lower PROMIS Physical Function 10a and higher PROMIS Fatigue 4a scores were associated with lower GMH scores in IIM patients.
Both physical and mental health are significantly impaired in IIM patients, particularly in those with comorbidities and increased fatigue, emphasizing the importance of patient-reported experiences and optimized multidisciplinary care to enhance well-being in people with IIMs.
Lay Summary
What does this mean for patients?
The COVAD-2 e-survey of >10 000 responses sheds light on the health-related quality of life (HRQoL) of individuals living with idiopathic inflammatory myopathies (IIMs) and other systemic autoimmune conditions. Our results highlight significant impairment in both physical and mental HRQoL among those with IIMs. Specific disease factors (subtypes, disease activity), comorbidities (lung disease, depression), symptoms (fatigue) and treatments (steroids) were associated with poorer HRQoL. This study demonstrates the need to address patient-reported experiences like fatigue and mental health to enhance the well-being of those with IIMs. Our findings stress the importance of developing personalized healthcare approaches targeting the distinct challenges faced by individuals with autoimmune conditions, ultimately striving for better outcomes and improved quality of life.
Both physical and mental health are significantly impaired in patients with IIMs.
IBM subtype, comorbidities and glucocorticoid use were associated with impaired global physical health in IIMs.
OM subtype, ILD, depression, impaired physical function and fatigue were associated with reduced mental health.
Introduction
Idiopathic inflammatory myopathies (IIMs) are a group of systemic autoimmune rheumatic diseases (AIRDs) that can involve several organs [1, 2] and are remarkably heterogeneous in presentation and outcome. The subtypes of IIMs include dermatomyositis (DM), juvenile DM (JDM), amyopathic DM, polymyositis (PM), overlap myositis (OM), immune-mediated necrotizing myopathies (IMNMs), anti-synthetase syndrome (ASyS) and inclusion body myositis (IBM) [3].
While the International Myositis Assessment and Clinical Studies Group core set measures are used to objectively measure disease activity in IIM patients [4], they fall short of providing a holistic viewpoint on the patients’ lived experiences. Patient-reported outcome measures (PROMs), including health-related quality of life (HRQoL), evaluate the impact of disease on physical and mental health as well as on emotional and social factors that may adversely influence the well-being of individuals living with IIMs [5]. HRQoL may be negatively impacted in IIMs by disease activity and damage, functional disability, multimorbidity and social and environmental factors [6]. Pain and fatigue are other important yet understudied contributors to HRQoL in IIMs [7–9]. A substantial proportion of patients with IIMs experience a chronic disease course and are prone to relapses, necessitating glucocorticoids [10, 11]. Adverse effects resulting from chronic glucocorticoid exposure can negatively impact patients’ body image and lead to comorbidities, including glucocorticoid-induced myopathy, osteoporosis with fractures and avascular necrosis, which may influence HRQoL [12, 13]. Despite the importance of assessing HRQoL in IIMs, current studies are often limited geographically, by sample size or restricted to specific subtypes of IIMs. Therefore, a comprehensive assessment of HRQoL in patients with IIMs worldwide to elucidate the determinants of poor HRQoL is warranted.
Several tools have been used to measure HRQoL in individuals living with AIRDs. The Patient-Reported Outcomes Measurement Information System (PROMIS) is a National Institutes of Health–funded initiative to develop and validate PROMs for clinical trials and practice [14]. PROMIS is based on the item response theory, and its item bank includes various measures to assess a patient’s physical, social and emotional functioning. For the assessment of HRQoL, PROMIS Global Physical Health (GPH) and Global Mental Health (GMH) summary scores, each consisting of four PROMIS global health items, were confirmed to be useful in efficiently summarizing physical and mental health in patient-reported outcome studies [15].
The COVID-19 Vaccination in Autoimmune Disease (COVAD) study is an ongoing, international, multicentre, self-reported e-survey assessing the safety of COVID-19 vaccination as well as validated PROMs, including PROMIS instruments, to outline patient experiences in various AIRDs, with a particular focus on IIMs. A comprehensive second survey (COVAD-2) was launched in February 2022 [16]. In the present study, global data from COVAD-2 were extracted cross-sectionally to explore the HRQoL in IIMs compared with control groups using validated PROMIS instruments adjusted for confounders.
Methods
COVAD-2 e-survey
Participants were eligible if they were >18 years old, regardless of whether they were diagnosed with autoimmune diseases or not. The questionnaire comprised multiple questions on demographics, previous COVID-19 infection and vaccination, diagnoses of autoimmune diseases, current treatments, disease activity, comorbidities and PROMs covering pain, fatigue, physical function and HRQoL. The survey form was extensively pilot tested and validated by international experts, followed by translation into 18 languages by the international COVAD study group, consisting of 156 physicians in healthcare centres located in at least 109 countries. The survey form was then disseminated on Surveymonkey.com on 1 February 2022. A total of 10 502 responses accrued as of 23 May 2022 were analysed in the present study. Informed consent was obtained from all respondents electronically via a cover letter on the survey form before proceeding with the questions. The COVAD study was approved by the Institutional Ethics Committee of the Sanjay Gandhi Postgraduate Institute of Medical Sciences (IEC code: 2021-143-IP-EXP-39) and performed according to the Declaration of Helsinki. The detailed design of the COVAD-2 e-survey has been published elsewhere [16].
Data extraction
Survey data regarding demographics, diagnoses of autoimmune diseases including IIM subgroups, disease duration, comorbidities, disease activity, current glucocorticoid or immunomodulatory agent use and PROMs including fatigue, pain, physical function and HRQoL were extracted from the COVAD-2 database. The questions incorporated into the survey form corresponding to each domain are presented in Supplementary Table S1, available at Rheumatology Advances in Practice online.
The respondents were categorized into four disease groups: IIMs, non-IIM autoimmune rheumatic diseases (non-IIM AIRDs) and non-rheumatic autoimmune diseases (nrAIDs) and those without any autoimmune diseases (controls). The countries of residence were classified into four categories: very high-, high-, medium- or low-income countries according to the Human Development Index (HDI) scored in 2021 [17]. The HDI is a summary measure of three key dimensions of human development: a long and healthy life, knowledge and a decent standard of living, assessed by life expectancy at birth, mean or expected years of schooling and gross national income per capita, respectively. Disease activity was assessed using a 4-point scale (inactive, active but stable, active and improving, active and worsening).
PROMIS GPH and GMH scores were calculated using PROMIS global health items as previously described [15]. The PROMIS GPH score (range: 4–20) is the sum of global03 (physical health), global06 (physical function), global07 (pain) and global08 (fatigue), whereas the PROMIS GMH score (range: 0–20) is the sum of global02 (quality of life), global04 (mental health), global05 (satisfaction with discretionary social activities) and global10r (emotional problems).
A 10-cm visual analogue scale (VAS) was used to quantify pain. Fatigue was assessed using the PROMIS Short Form version 1.0 Fatigue 4a (PROMIS Fatigue 4a). PROMIS Fatigue 4a is a four-item questionnaire with a 5-point scale for each item. A sum of individual scores was used to produce the final score (range: 4–20), with higher scores indicating greater fatigue. Physical function was evaluated using the PROMIS Short Form version 2.0 Physical Function 10a (PROMIS PF-10a). The PROMIS PF-10a questionnaire consists of 10 items, with each item rated on a 5-point scale. The final score (range: 10–50) was calculated as the sum of the individual scores, with higher scores indicating better physical function.
Statistical analysis
Means with s.d.s and medians with interquartile ranges (IQRs) were used as appropriate to present continuous variables. One-way analysis of variance or the Kruskal–Wallis test and the chi-squared test or Fisher’s exact test were used for continuous and categorical variables, respectively. Dunn’s test with Bonferroni correction was used for multiple comparisons. The primary outcomes were PROMIS GPH and GMH scores. The secondary outcomes included PROMIS PF-10a, pain VAS and PROMIS Fatigue 4a scores. Each outcome was compared between IIMs, non-IIM AIRDs, nrAIDs and controls, followed by multivariable analysis to assess whether each disease group is associated with lower PROMIS GPH or GMH scores when adjusted for demographics and comorbidities. Next, each PROM was stratified by IIM subgroups. Here, we combined JDM and DM into one category because the number of patients with JDM included in the present study was very small (n = 5).
Independent factors affecting PROMIS GPH scores in patients with IIMs were identified using multivariable analysis. We incorporated all variables of interest available in the COVAD-2 dataset into the multivariable model: age, gender, ethnicity, HDI, disease duration, IIM subtype, comorbidities, disease activity and glucocorticoid use. Here, we excluded PROMIS PF-10a, pain VAS and PROMIS Fatigue 4a from the covariates because PROMIS GPH scores comprise questions on physical function, pain and fatigue. In contrast, multivariable analysis to identify independent factors for PROMIS GMH scores was performed using age, gender, ethnicity, HDI, disease duration, IIM subtype, comorbidities, disease activity, glucocorticoid use, PROMIS PF-10a, pain VAS and PROMIS Fatigue 4a scores as covariates. A linear regression model was used to perform multivariate analyses.
We applied complete case analysis in the multivariable processes. When there was more than 10% missing data in a variable, sensitivity analysis excluding the variable from covariates was performed. We also performed sensitivity analyses excluding patients with IBM in all multivariable processes, considering the substantial differences in outcomes between those with IBM and non-IBM IIMs. A two-sided P-value <0.05 was considered statistically significant. All statistical analyses were conducted using R (version 4.2.1; R Foundation for Statistical Computing, Vienna, Austria).
Results
Demographics and clinical characteristics
A total of 10 502 responses accrued as of 23 May 2022 from 1582 IIM, 4700 non-IIM AIRD and 545 nrAID patients and 3675 controls were analysed (Fig. 1). The mean age of all respondents was 47 years (s.d. 15) and 7694 (73.8%) were women. Caucasians accounted for 52.2%, and 54.8% were living in countries with a very high HDI. RA (39.0%) was the most common type of non-IIM AIRD, followed by SLE (23.5%) and AS (7.9%), while in nrAID patients, autoimmune thyroid disease (64.6%) was the most common, followed by inflammatory bowel disease (15.0%) and type 1 diabetes (6.1%).
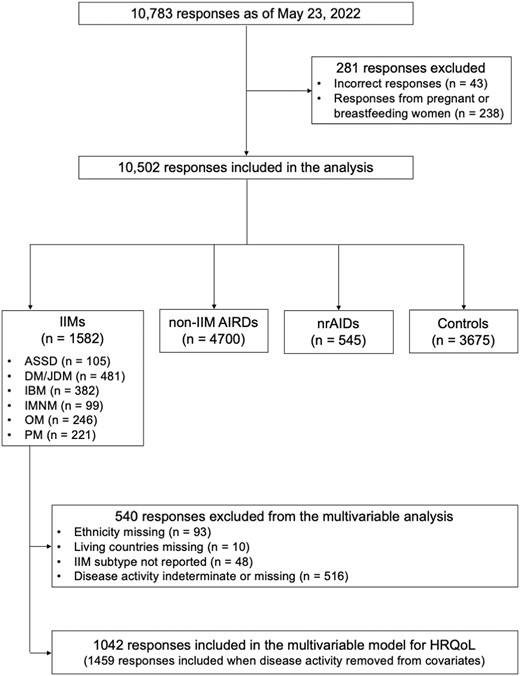
Flow diagram of participant selection
The demographics and clinical characteristics of the participants in each disease group are summarised in Table 1. Compared with other disease groups, patients with IIMs were older, more likely to be Caucasian and living in countries with a very high HDI (all P < 0.001). The median disease duration was shorter in patients with IIMs than in those with non-IIM AIRDs or nrAIDs (P < 0.001). Patients with IIMs were more likely to have comorbidities, including mental disorders, than controls (P < 0.001). The proportion of patients with active disease (active but stable, active and improving, active and getting worse) was higher in IIMs than in non-IIM AIRDs or nrAIDs (P < 0.001). Patients with IIMs or non-IIM AIRDs received treatment with glucocorticoids or immunomodulatory agents more frequently than those with nrAIDs (P < 0.001).
Demographics and clinical characteristics of participants in the COVAD-2 e-survey
| Variables | IIMs (n = 1582) | AIRDs (n = 4700) | nrAIDs (n = 545) | Controls (n = 3675) | P-value |
|---|---|---|---|---|---|
| Age, years, mean (s.d.) | 59 (14) | 48 (14) | 45 (14) | 40 (14) | <0.001 |
| Female, n/N (%) | 1126/1573 (71.6) | 3943/4667 (84.5) | 435/540 (80.6) | 2190/3646 (60.1) | <0.001 |
| Ethnicity, n (%) | <0.001 | ||||
| Caucasian | 1232/1489 (82.7) | 2159/4060 (53.2) | 301/482 (62.4) | 1063/3085 (34.5) | |
| Asian | 127/1489 (8.5) | 1080/4060 (26.6) | 69/482 (14.3) | 908/3085 (29.4) | |
| Hispanic | 67/1489 (4.5) | 478/4060 (11.8) | 93/482 (19.3) | 892/3085 (28.9) | |
| African American or of African origin | 59/1489 (4.0) | 302/4060 (7.4) | 16/482 (3.3) | 193/3085 (6.3) | |
| Native American, Indigenous, Pacific Islander | 4/1489 (0.3) | 41/4060 (1.0) | 3/482 (0.6) | 29/3085 (0.9) | |
| HDI, n/N (%) | <0.001 | ||||
| Very high | 1474/1572 (93.8) | 2865/4671 (61.3) | 268/541 (49.5) | 1101/3638 (30.3) | |
| High | 68/1572 (4.3) | 1064/4671 (22.8) | 208/541 (38.4) | 1362/3638 (37.4) | |
| Medium | 24/1572 (1.5) | 612/4671 (13.1) | 54/541 (10.0) | 959/3638 (26.4) | |
| Low | 6/1572 (0.4) | 130/4671 (2.8) | 11/541 (2.0) | 216/3638 (5.9) | |
| Disease duration, years, median (IQR) | 7 (3–14) | 9 (4–18) | 10 (4–17) | NA | <0.001 |
| Comorbidity, n (%) | |||||
| Asthma | 225 (14.2) | 500 (10.6) | 50 (9.2) | 246 (6.7) | <0.001 |
| Chronic kidney disease | 51 (3.2) | 239 (5.1) | 18 (3.3) | 20 (0.5) | <0.001 |
| Chronic liver disease | 28 (1.8) | 62 (1.3) | 8 (1.5) | 20 (0.5) | <0.001 |
| COPD | 60 (3.8) | 131 (2.8) | 5 (0.9) | 32 (0.9) | <0.001 |
| ILD | 264 (16.7) | 152 (3.2) | 8 (1.5) | 9 (0.2) | <0.001 |
| Cardiovascular disease | 122 (7.7) | 115 (2.4) | 4 (0.7) | 33 (0.9) | <0.001 |
| Diabetes | 207 (13.1) | 255 (5.4) | 73 (13.4) | 147 (4.0) | <0.001 |
| Dyslipidaemia | 382 (24.1) | 583 (12.4) | 71 (13.0) | 261 (7.1) | <0.001 |
| Hypertension | 500 (31.6) | 893 (19.0) | 83 (15.2) | 367 (10.0) | <0.001 |
| Stroke | 26 (1.6) | 45 (1.0) | 4 (0.7) | 9 (0.2) | <0.001 |
| Epilepsy | 9 (0.6) | 60 (1.3) | 4 (0.7) | 10 (0.3) | <0.001 |
| Tuberculosis | 7 (0.4) | 54 (1.1) | 6 (1.1) | 15 (0.4) | <0.001 |
| HIV/AIDS | 7 (0.4) | 7 (0.1) | 1 (0.2) | 10 (0.3) | 0.203 |
| Anxiety disorder | 327 (20.7) | 809 (17.2) | 95 (17.4) | 426 (11.6) | <0.001 |
| Depression | 308 (19.5) | 713 (15.2) | 84 (15.4) | 291 (7.9) | <0.001 |
| Insomnia | 140 (8.8) | 379 (8.1) | 39 (7.2) | 120 (3.3) | <0.001 |
| Eating disorder | 23 (1.5) | 99 (2.1) | 18 (3.3) | 53 (1.4) | 0.005 |
| Disease activity, n/N (%) | <0.001 | ||||
| Inactive | 158/1066 (14.8) | 707/2796 (25.3) | 91/297 (30.6) | NA | |
| Active but stable | 555/1066 (52.1) | 1374/2796 (49.1) | 159/297 (53.5) | NA | |
| Active and improving | 73/1066 (6.8) | 228/2796 (8.2) | 21/297 (7.1) | NA | |
| Active and getting worse | 280/1066 (26.3) | 487/2796 (17.4) | 26/297 (8.8) | NA | |
| Glucocorticoid use (mg/daya), n (%) | <0.001 | ||||
| No glucocorticoids | 972 (61.4) | 3118 (66.3) | 494 (90.6) | 3621 (98.5) | |
| <10 | 398 (25.2) | 1189 (25.3) | 30 (5.5) | 38 (1.0) | |
| 10–20 | 123 (7.8) | 293 (6.2) | 14 (2.6) | 11 (0.3) | |
| >20 | 89 (5.6) | 100 (2.1) | 7 (1.3) | 5 (0.1) | |
| Immunomodulatory agent use, n (%) | |||||
| Methotrexate | 326 (20.6) | 1272 (27.1) | 11 (2.0) | 0 | <0.001 |
| Mycophenolate mofetil | 269 (17.0) | 376 (8.0) | 6 (1.1) | 0 | <0.001 |
| Azathioprine | 140 (8.8) | 341 (7.3) | 23 (4.2) | 0 | <0.001 |
| Hydroxychloroquine | 228 (14.4) | 1407 (29.9) | 20 (3.7) | 0 | <0.001 |
| Sulfasalazine | 15 (0.9) | 328 (7.0) | 13 (2.4) | 0 | <0.001 |
| Leflunomide | 13 (0.8) | 229 (4.9) | 1 (0.2) | 0 | <0.001 |
| Tacrolimus | 28 (1.8) | 31 (0.7) | 3 (0.6) | 0 | <0.001 |
| Ciclosporin | 29 (1.8) | 53 (1.1) | 4 (0.7) | 0 | <0.001 |
| Cyclophosphamide | 14 (0.9) | 54 (1.1) | 1 (0.2) | 0 | <0.001 |
| IVIG or SQIG | 213 (13.5) | 30 (0.6) | 4 (0.7) | 0 | <0.001 |
| Rituximab | 156 (9.9) | 188 (4.0) | 10 (1.8) | 0 | <0.001 |
| Janus kinase inhibitors | 18 (1.1) | 93 (2.0) | 2 (0.4) | 0 | <0.001 |
Prednisolone/prednisone-equivalent dose.
COPD: chronic obstructive pulmonary disease; NA: not applicable; SQIG: subcutaneous immunoglobulin.
Among the IIMs, DM/JDM was the most common (31.4%), followed by IBM (24.9%) and OM (16.0%) (Supplementary Table S2, available at Rheumatology Advances in Practice online). Patients with IBM were older and more likely to be men than those with other subtypes (P < 0.001). Except for those with OM, >75% of patients with IIMs were Caucasian and living in countries with a very high HDI. The median disease duration was longer in patients with IBM, OM and PM than in those with ASyS, DM/JDM and IMNM.
The proportion of patients with active disease was higher in the IBM group than in the other subtypes (P < 0.001). The prevalence of interstitial lung disease (ILD) was highest in ASyS (P < 0.001), while atherosclerotic diseases, including cardiovascular disease, diabetes, dyslipidaemia and hypertension, were more common in those with IBM, IMNM and PM. As for mental disorders, patients with OM most frequently experienced insomnia (P = 0.002). Patients with IBM were rarely treated with glucocorticoids or immunomodulators. Mycophenolate mofetil and rituximab were frequently used in patients with ASyS, while the use of intravenous or subcutaneous human immunoglobulin was most common in patients with IMNM.
HRQoL, physical function, pain and fatigue
PROMIS GPH and GMH, PROMIS PF-10a, pain VAS and PROMIS Fatigue 4a scores in each disease group are presented in Fig. 2. PROMIS GPH median scores were lowest in patients with IIMs and non-IIM AIRDs [IIMs: 13 (IQR 10–15) vs non-IIM AIRDs: 13 (11–15) vs nrAIDs: 15 (13–17) vs controls: 17 (15–18), P < 0.001]. PROMIS GMH median scores in IIM patients were significantly lower than the scores in controls (P < 0.001), but were marginally lower or comparable to the scores in non-IIM AIRD (P = 0.048) or nrAID (P = 0.560) patients [IIMs: 13 (IQR 10–15) vs non-IIM AIRDs: 13 (10–15) vs nrAIDs: 13 (11–16) vs controls: 15 (13–17)].
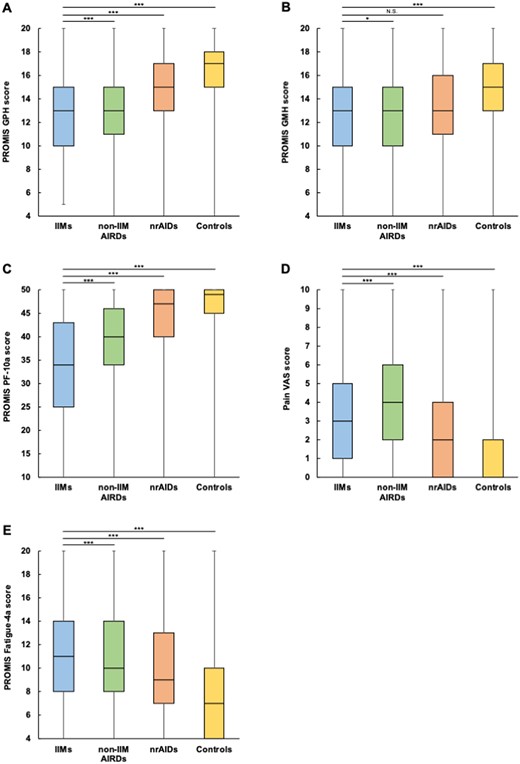
Patient-reported outcomes in each disease group. The (A) PROMIS GPH score, (B) PROMIS GMH score, (C) PROMIS PF-10a score, (D) Pain VAS score and (E) PROMIS Fatigue 4a score were compared between disease groups. *P < 0.05, ***P < 0.001. N.S.: not significant; PF: physical function
It should be noted that PROMIS PF-10a median scores were the lowest in IIM patients [IIMs: 34 (IQR 25–43) vs non-IIM AIRDs: 40 (34–46) vs nrAIDs: 47 (40–50) vs controls: 49 (45–50), P < 0.001], suggesting significantly impaired physical function in patients with IIMs. Meanwhile, pain VAS median scores were the highest in patients with non-IIM AIRDs [IIMs: 3 (IQR 1–5) vs non-IIM AIRDs: 4 (2–6) vs nrAIDs: 2 (0–4) vs controls: 0 (0–2), P < 0.001]. Notably, PROMIS Fatigue 4a median scores were highest in IIM patients [IIMs: 11 (8–14) vs non-IIM AIRDs: 10 (8–14) vs nrAIDs: 9 (7–13) vs controls: 7 (4–10), P < 0.001], indicating increased fatigue in patients with IIMs.
Multivariate analysis in the overall population revealed that the diagnosis of IIMs (reference: controls) was independently associated with lower PROMIS GPH scores (Supplementary Table S3A, available at Rheumatology Advances in Practice online) and PROMIS GMH scores (Supplementary Table S3B, available at Rheumatology Advances in Practice online) when adjusted for age, gender, ethnicity, HDI and comorbidities. Sensitivity analyses excluding IBM also showed that the diagnosis of non-IBM IIMs was an independent factor for lower PROMIS GPH (Supplementary Table S3C, available at Rheumatology Advances in Practice online) and GMH scores (Supplementary Table S3D, available at Rheumatology Advances in Practice online). These results suggest that both physical and mental QoL are significantly impaired in patients with IIMs compared with controls, independent of demographics and comorbidities.
Stratification by IIM subtypes
To further explore HRQoL and other PROMs in patients with IIMs, each outcome was stratified by IIM subtype (Fig. 3). PROMIS GPH median scores were lowest in patients with IBM (P < 0.001) (Fig. 3A). A similar trend was observed in PROMIS PF-10a median scores, which were also lowest in those with IBM (P < 0.001) (Fig. 3C). In contrast, PROMIS GMH median scores were lower in patients with ASyS or OM than in those with the other subtypes (P < 0.001) (Fig.3B). Pain VAS (Fig. 3D) and PROMIS Fatigue 4a median scores (Fig. 3E) were highest in patients with OM (P < 0.001).
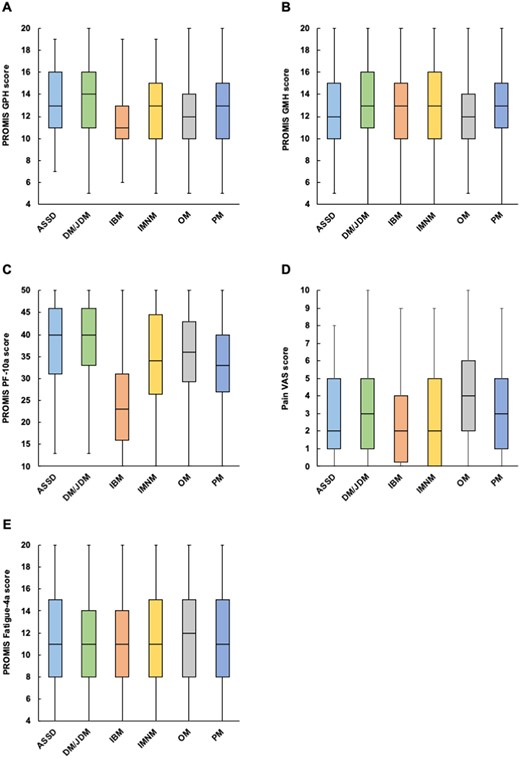
Patient-reported outcomes stratified by IIM subtypes. (A) PROMIS GPH score, (B) PROMIS GMH score, (C) PROMIS PF-10a score, (D) Pain VAS score and (E) PROMIS Fatigue 4a score were stratified by IIM subtypes. PF: physical function
Factors affecting HRQoL in patients with IIMs
Multivariable regression analyses were performed to identify factors affecting PROMIS GPH or GMH scores in patients with IIMs (Table 2). IBM (P = 0.002 vs ASyS; P < 0.001 vs DM/JDM; P = 0.022 vs PM); comorbidities including asthma (P = 0.021), cardiovascular disease (P = 0.006), hypertension (P < 0.001) and depression (P < 0.001); disease activity (active and getting worse: P < 0.001; active and improving: P = 0.047; active but stable: P = 0.001); and glucocorticoid use (prednisolone/prednisone-equivalent dose of <10 mg/day: P = 0.006; 10–20 mg/day: P = 0.005; >20 mg/day: P = 0.010) were identified as factors independently associated with lower PROMIS GMH scores (Table 2A). In contrast, living in countries with medium/low HDI (P = 0.039), OM (P = 0.003), ILD (P = 0.006), mental disorders including anxiety disorder (P = 0.021) and depression (p < 0.001), disease activity (active and improving: P = 0.004), lower PROMIS PF-10a (P < 0.001), higher pain VAS (P = 0.011) and higher PROMIS Fatigue 4a scores (P < 0.001) were identified as independent factors associated with lower PROMIS GMH scores (Table 2B).
Multivariable regression analysis to identify factors affecting PROMIS GPH or GMH scores in patients with IIMs
| (A) Population: all IIMs; outcome: PROMIS GPH scores | |||
|---|---|---|---|
| Covariates | Coefficient | 95% CI | P-value |
| Age | 0.004 | −0.011, 0.019 | 0.636 |
| Male (reference: female) | −0.109 | −0.503, 0.286 | 0.588 |
| Ethnicity (reference: Caucasian) | |||
| Asian | 1.523 | 0.776, 2.271 | <0.001 |
| Hispanic | −0.003 | −0.921, 0.914 | 0.994 |
| African American or African origin | −0.141 | −1.163, 0.881 | 0.787 |
| Native American, Indigenous, Pacific Islander | 2.753 | −0.969, 6.475 | 0.147 |
| HDI (reference: very high) | |||
| High | 0.968 | −0.178, 2.114 | 0.098 |
| Low/medium | −0.467 | −2.126, 1.193 | 0.581 |
| Disease duration | −0.006 | −0.014, 0.002 | 0.119 |
| IIM subtype (reference: IBM) | |||
| ASyS | 1.354 | 0.489, 2.218 | 0.002 |
| DM/JDM | 1.306 | 0.755, 1.857 | <0.001 |
| IMNM | 0.291 | −0.509, 1.091 | 0.475 |
| OM | −0.107 | −0.809, 0.594 | 0.764 |
| PM | 0.723 | 0.104, 1.341 | 0.022 |
| Asthma | −0.570 | −1.054, −0.086 | 0.021 |
| Chronic kidney disease | 0.452 | −0.543, 1.447 | 0.373 |
| Chronic liver disease | −1.227 | −2.687, 0.233 | 0.099 |
| COPD | −0.684 | −1.634, 0.266 | 0.158 |
| ILD | −0.292 | −0.775, 0.190 | 0.235 |
| Cardiovascular disease | −0.880 | −1.503, −0.258 | 0.006 |
| Diabetes | −0.273 | −0.763, 0.216 | 0.273 |
| Dyslipidaemia | 0.256 | −0.137, 0.649 | 0.202 |
| Hypertension | −0.981 | −1.354, −0.607 | <0.001 |
| Stroke | −1.097 | −2.406, 0.212 | 0.100 |
| Anxiety disorder | −0.186 | −0.656, 0.283 | 0.436 |
| Depression | −1.182 | −1.650, −0.713 | <0.001 |
| Eating disorder | −0.427 | −2.075, 1.222 | 0.612 |
| Insomnia | −0.534 | −1.197, 0.128 | 0.114 |
| Disease activity (reference: inactive) | |||
| Active and getting worse | −2.317 | −2.904, −1.729 | <0.001 |
| Active and improving | −0.775 | −1.539, −0.010 | 0.047 |
| Active but stable | −0.822 | −1.321, −0.323 | 0.001 |
| Glucocorticoid use (mg/daya) (reference: no glucocorticoids) | |||
| <10 | −0.574 | −0.979, −0.169 | 0.006 |
| 10–20 | −0.895 | −1.523, −0.266 | 0.005 |
| >20 | −0.949 | −1.675, −0.223 | 0.010 |
| (B) Population: all IIMs; outcome: PROMIS GMH scores | |||
|---|---|---|---|
| Covariates | Coefficient | 95% CI | P-value |
| Age | 0.012 | −0.003, 0.028 | 0.107 |
| Male (reference: female) | −0.033 | −0.419, 0.353 | 0.867 |
| Ethnicity (reference: Caucasian) | |||
| Asian | −0.412 | −1.151, 0.327 | 0.274 |
| Hispanic | 0.214 | −0.684, 1.111 | 0.641 |
| African American or African origin | 0.309 | −0.691, 1.310 | 0.544 |
| Native American, Indigenous, Pacific Islander | −0.978 | −4.620, 2.665 | 0.598 |
| HDI (reference: very high) | |||
| High | 0.844 | −0.275, 1.963 | 0.139 |
| Medium/low | −1.717 | −3.344, −0.090 | 0.039 |
| Disease duration | −0.002 | −0.010, 0.006 | 0.585 |
| IIM subtype (reference: IBM) | |||
| ASyS | −0.706 | −1.587, 0.174 | 0.116 |
| DM/JDM | −0.408 | −1.001, 0.186 | 0.178 |
| IMNM | −0.546 | −1.349, 0.256 | 0.182 |
| OM | −1.092 | −1.807, −0.378 | 0.003 |
| PM | −0.384 | −1.017, 0.249 | 0.234 |
| Asthma | 0.252 | −0.223, 0.727 | 0.297 |
| Chronic kidney disease | 0.536 | −0.439, 1.512 | 0.281 |
| Chronic liver disease | 0.241 | −1.187, 1.669 | 0.741 |
| COPD | −0.228 | −1.158, 0.702 | 0.631 |
| ILD | −0.667 | −1.139, −0.195 | 0.006 |
| Cardiovascular disease | −0.240 | −0.849, 0.369 | 0.439 |
| Diabetes | −0.066 | −0.545, 0.418 | 0.788 |
| Dyslipidaemia | 0.185 | −0.200, 0.570 | 0.347 |
| Hypertension | 0.106 | −0.262, 0.474 | 0.572 |
| Stroke | 0.575 | −0.706, 1.855 | 0.379 |
| Anxiety disorder | −0.539 | −0.997, −0.080 | 0.021 |
| Depression | −1.218 | −1.684, −0.751 | <0.001 |
| Eating disorder | 1.273 | −0.338, 2.885 | 0.121 |
| Insomnia | −0.435 | −1.084, 0.215 | 0.190 |
| Disease activity (reference: inactive) | |||
| Active and getting worse | −0.502 | −1.095, 0.091 | 0.097 |
| Active and improving | −1.092 | −1.840, −0.344 | 0.004 |
| Active but stable | −0.160 | −0.652, 0.331 | 0.522 |
| Glucocorticoid use (mg/daya) (reference: no glucocorticoids) | |||
| <10 | 0.229 | −0.168, 0.626 | 0.258 |
| 10–20 | −0.069 | −0.688, 0.549 | 0.826 |
| >20 | 0.545 | −0.209, 1.218 | 0.165 |
| PROMIS PF-10a scores | 0.061 | 0.039, 0.084 | <0.001 |
| Pain VAS | −0.109 | −0.192, −0.025 | 0.011 |
| PROMIS Fatigue 4a scores | −0.323 | −0.376, −0.270 | <0.001 |
Prednisolone/prednisone-equivalent dose.
COPD: chronic obstructive pulmonary disease; PF: physical function.
In the sensitivity analyses excluding IBM, the diagnosis of IMNM, OM or PM (reference: DM/JDM) was identified as a further factor for lower PROMIS GPH scores, as well as comorbidities including asthma, cardiovascular disease, hypertension, and depression, active disease and glucocorticoid use (Supplementary Table S4A, available at Rheumatology Advances in Practice online). In contrast, OM, ILD, depression, active disease, lower PROMIS PF-10a scores and higher PROMIS Fatigue 4a scores were independent factors for lower PROMIS GMH scores in non-IBM IIM patients, while higher pain VAS did not have a significant association (Supplementary Table S4B, available at Rheumatology Advances in Practice online).
Considering that 540 responses were excluded from the multivariable models mainly due to indeterminate disease activity status (Fig. 1), we also performed sensitivity analyses excluding disease activity from the covariates. This increased the number of responses included in the multivariable models from 1042 to 1459. Factors independently associated with lower PROMIS GPH or GMH scores identified in these sensitivity analyses were generally consistent with the primary analyses that included disease activity as a covariate (Supplementary Table S5, available at Rheumatology Advances in Practice online).
Discussion
Using cross-sectional data obtained from a large global dataset, our study establishes that both physical and mental health are significantly impaired in patients with IIMs. PROMIS GPH and GMH scores were lower in patients with IIMs than in controls, independent of demographics and comorbidities. Among IIM patients, PROMIS GPH and PROMIS PF-10a scores were lowest in patients with IBM, suggesting significantly impaired physical function and QoL in this subtype. IBM, comorbidities including asthma, cardiovascular disease, hypertension and depression, active disease, and glucocorticoid use were the independent factors for lower PROMIS GPH scores. On the other hand, PROMIS GMH scores were adversely affected by the coexistence of ILD, depression, active disease, increased fatigue and impaired physical function. To the best of our knowledge, this is the first study to investigate HRQoL using PROMIS instruments in a global cohort of patients with AIRDs including IIMs.
PROMIS GPH scores, which were lowest in IIMs among disease groups, were calculated as the sum of four items: overall physical health, physical function, pain and fatigue [15]. PROMIS PF-10a scores were lowest and PROMIS Fatigue 4a scores were highest in IIMs, while pain VAS scores in IIMs were lower than the scores in non-IIM AIRDs, suggesting that impaired physical function and increased fatigue are major determinants of reduced physical QoL in patients with IIMs. Fatigue is currently an understudied phenomenon in IIMs. Our analysis from the initial COVAD e-survey revealed that patients with IIMs experience increased fatigue compared with healthy controls, regardless of disease activity, and the determinants of fatigue included being female and Caucasian [9]. Recent studies from clinical trials in patients with RA demonstrated that most patients did not achieve sustained fatigue improvement despite intensive treatment with DMARDs [18], and the importance of non-pharmacological interventions, including exercise programs and behavioural therapy, has been emphasized in patients with risk factors for sustained fatigue [19, 20]. Our results warrant future studies to investigate the determinants and trajectory of fatigue and non-pharmacological strategies to address fatigue in patients with IIMs.
Among IIM patients, physical function and QoL were most significantly affected in IBM, which is also consistent with previous studies [21, 22]. The significantly impaired physical health of IBM patients likely reflects the treatment-refractory nature of the disease and the accumulation of muscle damage [23, 24]. Comorbidities including asthma, cardiovascular disease, hypertension and depression were also identified as factors associated with lower PROMIS GPH scores. While the mechanisms by which these comorbidities affect physical health in patients with IIMs remain to be elucidated, our results call for greater attention to patients with IIMs with certain comorbidities as a vulnerable population.
PROMIS GMH scores were significantly lower in IIM patients than in controls. While the multivariable analysis in IIM patients identified mental disorders as independent factors associated with lower PROMIS GMH scores, as expected, it is intriguing to note that ILD was another factor independently associated with impaired mental health in IIM patients. The hallmark symptoms of ILD are cough and dyspnoea, which are associated with frustration, shame, anger and isolation and negatively impact the mental health of affected patients as identified in another study [25]. Since our investigation is limited due to the lack of ILD-related PROMs in the survey form, future studies assessing the detailed effect of ILD on patients’ lives in IIMs are warranted. PROMIS GMH scores were lower in patients with ASyS or OM in the univariable analysis; however, ASyS was not found to be an independent factor for lower PROMIS GMH scores in the multivariable analysis. The high prevalence of ILD in patients with ASyS could explain the lower PROMIS GMH scores in these subtypes.
The strength of our study is that we were able to include a large number of patients with IIMs, encompassing all subtypes, by utilizing the large-scale, international COVAD-2 database. In contrast, as limitations, we acknowledge the presence of selection bias arising from convenience sampling as well as reporting bias inherent to the e-survey. The COVAD-2 study successfully involved participants from previously overlooked regions, such as Africa and South America; however, this inclusivity was unfortunately not the case for the IIM group. A total of 82.7% were Caucasian and 93.8% were living in countries with a very high HDI, limiting the generalizability of our results. Also, due to the nature of the self-reported e-survey, diagnoses of autoimmune diseases, including IIM subtypes and disease activity, were patient-reported and not verified objectively. Furthermore, the nrAID group was overrepresented by autoimmune thyroid disease (64.6%). Our results should be confirmed in an international cohort study involving patients with IIMs as well as various rheumatic and non-rheumatic autoimmune conditions from diverse ethnic and socio-economic backgrounds. The COVAD-2 e-survey was circulated in early 2022, when the COVID-19 pandemic still had a substantial impact on patients’ physical and mental health. Further studies are warranted to elucidate the trajectory of global health status in people living with IIMs from the early pandemic to the post-pandemic period. Finally, PROMIS GPH, GMH, PF-10a and Fatigue 4a scores have not been validated in an academic cohort of patients with IIMs, whereas PROMIS PF-20, PF-8b, Fatigue 7a and Pain interference 6a scores demonstrated favourable test–retest reliability and construct validity in a cohort of adult patients with IIMs [26, 27]. In addition, a minimal clinically important difference (MCID) in each PROM has not been assessed in a cohort of patients with IIMs. Understanding the psychometric properties of PROMIS instruments and their MCIDs may provide further insights into their use in clinical practice and trials.
In conclusion, both physical and mental health were significantly impaired in patients with IIMs compared with those with non-IIM AIRDs, nrAIDs or controls. Our results call for greater attention to patient-reported experiences and comorbidities, including mental disorders, to provide targeted approaches and optimize global well-being in people with IIMs.
Supplementary material
Supplementary material is available at Rheumatology Advances in Practice online.
Data availability
The datasets generated and/or analysed during the current study are available from the corresponding author upon reasonable request.
Contribution statement
L.G., A.Y., Y.L., V.M. and M.K. were responsible for the conceptualization. Y.L. and V.M. were responsible for the formal analysis. L.G., V.A. and P.S. were responsible for the investigation. L.G., V.A., A.Y. and M.K. were responsible for the methodology. L.G. was responsible for the software. V.A., R.A. and H.C. were responsible for validation. R.A., V.A. and L.G. were responsible for visualization. L.A., A.Y., Y.L., V.M. and M.K. were responsible for writing the original draft. All authors were responsible for data curation and reviewing and editing the manuscript.
Funding
No specific funding was received from any bodies in the public, commercial or not-for-profit sectors to carry out the work described in this article. H.C. is supported by the National Institution for Health Research Manchester Biomedical Research Centre (NIHR203308). The views expressed in this publication are those of the authors and not necessarily those of the National Health Service, National Institute for Health Research or Department of Health and Social Care.
Disclosure statement: A.L.T. has received honoraria for advisory boards and speaking from AbbVie, Gilead, Janssen, Eli Lilly, Novartis, Pfizer and UCB. E.N. has received speaker honoraria or participated in advisory boards for Celltrion, Pfizer, Sanofi, Gilead, Galapagos, AbbVie and Eli Lilly and holds research grants from Pfizer and Eli Lilly. H.C. has received grant support from Eli Lilly and UCB; consulting fees from Novartis, Eli Lilly, Orphazyme and AstraZeneca and speaker fees from UCB and Biogen. I.P. has received research funding and/or honoraria from Amgen, AstraZeneca, Aurinia Pharmaceuticals, Eli Lilly, Gilead Sciences, GSK, Janssen Pharmaceuticals, Novartis and F. Hoffmann-La Roche. J.B.L. has received speaker honoraria or participated in advisory boards for Sanofi Genzyme, Roche and Biogen; none related to this manuscript. J.D. has received research funding from CSL. M.K. has received speaker honoraria or participated in advisory boards for AbbVie, Asahi-Kasei, Astellas, AstraZeneca, Boehringer Ingelheim, Chugai, Corbus, Eisai, GSK, Horizon, Kissei, BML Health, Mochida, Nippon Shinyaku, Ono Pharmaceuticals and Tanabe-Mitsubishi. N.Z. has received speaker fees, advisory board fees or research grants from Pfizer, Roche, AbbVie, Eli Lilly, NewBridge, Sanofi-Aventis, Boehringer Ingelheim, Janssen and Pierre Fabre; none related to this manuscript. O.D. has/had a consultancy relationship with and/or has received research funding from and/or has served as a speaker for the following companies in the area of potential treatments for systemic sclerosis and its complications in the last three calendar years: 4P-Pharma, AbbVie, Acceleron, Alcimed, Altavant, Amgen, AnaMar, Arxx, AstraZeneca, Baecon, Blade, Bayer, Boehringer Ingelheim, Corbus, CSL Behring, Galderma, Galapagos, Glenmark, Gossamer, iQvia, Horizon, Inventiva, Janssen, Kymera, Lupin, Medscape, Merck, Miltenyi Biotec, Mitsubishi Tanabe, Novartis, Prometheus, Redxpharma, Roivant, Sanofi and Topadur and has a patent issued: ‘mir-29 for the treatment of systemic sclerosis’ (US8247389, EP2331143). R.A. has a consultancy relationship with and/or has received research funding from Bristol-Myers Squibb, Pfizer, Genentech, Octapharma, CSL Behring, Mallinckrodt, AstraZeneca, Corbus, Kezar, AbbVie, Janssen, Kyverna Alexion, Argenx, Q32, EMD-Serono, Boehringer Ingelheim, Roivant, Merck, Galapagos, Actigraph, Scipher, Horizon Therepeutics, Teva, Beigene, ANI Pharmaceuticals, Biogen, Nuvig, Capella Bioscience and CabalettaBio. T.V. has received speaker honoraria from Pfizer and AstraZeneca; none related to this manuscript. The rest of the authors have no conflicts of interest relevant to this manuscript.
Acknowledgements
The authors are grateful to all respondents for completing the questionnaire. The authors also thank the Myositis Association, Myositis India, Myositis UK, Myositis Support and Understanding, the Myositis Global Network, Deutsche Gesellschaft für Muskelkranke e. V. (DGM), Dutch and Swedish myositis patient support groups, Cure JM, Cure IBM, Sjögren’s India Foundation, Patients Engage, Scleroderma India, Lupus UK, Lupus Sweden, Emirates Arthritis Foundation, EULAR PARE, ArLAR research group, AAAA patient group, Myositis Association of Australia, APLAR myositis special interest group, Thai Rheumatism Association, PANLAR, AFLAR NRAS, Anti-Synthetase Syndrome support group and various other patient support groups and organizations for their contribution to the dissemination of this survey. Finally, the authors wish to thank all members of the COVAD study group for their invaluable role in the data collection.
COVAD Study Group: Zoltán Griger, Sinan Kardes, Melinda Nagy Vince, Yogesh Preet Singh, Rajiv Ranjan, Avinash Jain, Sapan C. Pandya, Rakesh Kumar Pilania, Aman Sharma, Manesh Manoj M, Vikas Gupta, Chengappa G. Kavadichanda, Pradeepta Sekhar Patro, Sajal Ajmani, Sanat Phatak, Rudra Prosad Goswami, Abhra Chandra Chowdhury, Ashish Jacob Mathew, Padnamabha Shenoy, Ajay Asranna, Keerthi Talari Bommakanti, Anuj Shukla, Arunkumar R. Pande, Kunal Chandwar, Akanksha Ghodke, Hiya Boro, Zoha Zahid Fazal, Binit Vaidya, Döndü Üsküdar Cansu, Reşit Yıldırım, Armen Yuri Gasparyan, Nicoletta Del Papa, Gianluca Sambataro, Atzeni Fabiola, Marcello Govoni, Simone Parisi, Elena Bartoloni Bocci, Gian Domenico Sebastiani, Enrico Fusaro, Marco Sebastiani, Luca Quartuccio, Franco Franceschini, Pier Paolo Sainaghi, Giovanni Orsolini, Rossella De Angelis, Maria Giovanna Danieli, Vincenzo Venerito, Silvia Grignaschi, Alessandro Giollo, Alessia Alunno, Florenzo Iannone, Marco Fornaro, Lisa S. Traboco, Suryo Anggoro Kusumo Wibowo, Jesús Loarce-Martos, Sergio Prieto-González, Raquel Aranega Gonzalez, Ran Nakashima, Shinji Sato, Naoki Kimura, Yuko Kaneko, Takahisa Gono, Stylianos Tomaras, Fabian Nikolai Proft, Marie-Therese Holzer, Margarita Aleksandrovna Gromova, Or Aharonov, Zoltán Griger, Ihsane Hmamouchi, Imane El Bouchti, Zineb Baba, Margherita Giannini, François Maurier, Julien Campagne, Alain Meyer, Daman Langguth, Vidya Limaye, Merrilee Needham, Nilesh Srivastav, Marie Hudson, Océane Landon-Cardinal, Wilmer Gerardo Rojas Zuleta, Álvaro Arbeláez, Javier Cajas, José António Pereira Silva, João Eurico Fonseca, Olena Zimba, Doskaliuk Bohdana, Uyi Ima-Edomwonyi, Ibukunoluwa Dedeke, Emorinken Airenakho, Nwankwo Henry Madu, Abubakar Yerima, Hakeem Olaosebikan, Becky Adugna, Oruma Devi Koussougbo, Elisa Palalane, Ho So, Manuel Francisco Ugarte-Gil, Lyn Chinchay, José Proaño Bernaola, Victorio Pimentel, Hanan Mohammed Fathi, Reem Hamdy A. Mohammed, Ghita Harifi, Yurilís Fuentes-Silva, Karoll Cabriza, Jonathan Losanto, Nelly Colaman, Antonio Cachafeiro-Vilar, Generoso Guerra Bautista, Enrique Julio Giraldo Ho, Lilith Stange Nunez, Cristian Vergara, Jossiell Then Báez, Hugo Alonzo, Carlos Benito Santiago Pastelin, Rodrigo García Salinas, Alejandro Quiñónez Obiols, Nilmo Chávez, Andrea Bran Ordóñez, Gil Alberto Reyes Llerena, Radames Sierra-Zorita, Dina Arrieta, Eduardo Romero Hidalgo, Ricardo Saenz, Idania Escalante Mendoza, Wendy Calapaqui, Ivonne Quezada, Gabriela Arredondo, Laura Andreoli, Daniele Lini, Karen Schreiber, Aarat Patel, John D. Pauling, Chris Wincup, Bhupen Barman, Erick Adrian Zamora Tehozol, Jorge Rojas Serrano, Ignacio García-De La Torre, Iris J. Colunga-Pedraza, Javier Merayo Chalico, Okwara Celestine Chibuzo, Wanruchada Katchamart, Russka Shumnalieva, Leonardo Santos Hoff, Hussein Halabi, Binit Vaidya, A. T. M. Tanveer Hasan, Babur Salim, Tamer Gheita and Tulika Chatterjee.
References
Author notes
R.A. and L.G. contributed equally.
The complete list of authors of the COVAD Study Group, as well as their affiliations, are provided in Supplementary Data S1, available at Rheumatology Advances in Practice online.

Comments