


Abstract
Homophily—individuals’ affinity for others like them—is a powerful principle that governs whose opinions people attend to. Using nearly 2,400 advisory meetings, we find that homophily has a significant positive impact on the likelihood of following financial advice. The increased likelihood of following stems from homophily on gender and age for male clients and from sameness on marital and parental status for female advisees. Moreover, the homophily effect is mitigated by reduced information asymmetry between client and advisor and a long-term relationship with the bank. Our results suggest that client-advisor matching increases individuals’ propensity to follow financial advice.
Received June 21, 2017; editorial decision June 7, 2018 by Editor Philip Strahan.
What makes people follow financial advice once they have sought it? Consumers all over the world rely on the services of financial advisors, but their recommendations—however beneficial they might be—do not translate into informed financial decisions if advisees do not act on them. Thus, finding answers to this question has recently received increasing attention among policy makers and practitioners alike.1
In this study, we propose and test a novel determinant of clients’ likelihood of following financial advice: homophily, that is, the sociological principle that individuals feel more comfortable with people like them (Lazarsfeld and Merton 1954). Peoples’ affinity for similar others provides an environment conducive to mutual understanding in all kinds of personal relationships ranging from marriage and friendship to professional interactions like advice taking.2 Moreover, homophily implies that when a client detects elements of similarity in her advisor, a shift in normative expectations leads to the development of a benevolent attitude toward the advisor such that her intentions and actions are interpreted favorably (Mills and Clark 1982, Silver 1990, Uzzi 1999). Hence, all else equal, we expect clients who share more homophilous ties with their advisors to display a higher propensity to follow the advice they receive.
In the vein of related studies applying the concept of homophily to research in business economics, we capture potential homophilous ties by means of demographic similarities between clients and advisors which are unambiguously observable and systematically available. Our empirical strategy of capturing clients’ propensity to follow advice is also intuitive and straightforward: our data allow us to perform a security-by-security comparison of the recommendations they receive in each advisory meeting with their actual account activity afterward. Moreover, clients in our sample are randomly assigned to their personal advisors and each advisor manages multiple clients. This allows us to analyze whether the recommendations given by one and the same advisor are more likely to be heeded if she shares more similarities with her client across the four demographic characteristics gender, age, marital status, and parental status.
Supporting a homophily effect, we document a positive relationship between the number of demographic commonalities between client and advisor and the propensity to follow advice. Controlling for several previously identified determinants of advice taking, we observe an economically significant difference of 8.8 percentage points (pp) in clients’ likelihood of following when we compare interactions between clients and advisors exhibiting the highest versus lowest number of demographic similarities.
We observe significant gender differences in the relative importance of the different homophily dimensions for clients’ propensity to follow advice. For male clients, the increased likelihood of following the recommendations of advisors with which they share more demographic characteristics stems from homophily on gender and age. By contrast, the positive impact of homophily on the propensity to follow advice seems to be induced by similarities regarding the marital and parental status for the group of female advisees. Moreover, we find that the likelihood of following advice among clients who themselves are employed in the finance sector is not affected by homophilous ties with the clients’ advisors. This result suggests that the homophily effect in financial advice is limited to settings in which there is a considerable knowledge gap between client and advisor when it comes to assessing the content of the advice. Finally, the homophily effect is mitigated for the long-standing customers of the bank. This finding implies that homophilous behavior in the client-advisor relationship may be, at least partly, offset by familiarity and long-term experience gained with the bank with which the advisor is employed.
We discuss our findings in light of current developments in the financial services industry. In recent years, regulatory authorities all over the world have implemented measures to ban conflicted advice and investment guidance in the retail segment has become highly standardized, with very limited potential for detrimental advisor catering.3 Coupled with the advent of digital wealth management (“robo-advice”), the value proposition of human financial advice has seen a shift from product selection toward communicating the benefits of the recommendations. Against this background, targeted client-advisor matching based on homophily can harness the effect that demographically closer individuals benefit from easier mutual understanding—a feature which cannot be easily incorporated into robo-advice. On the flip side, however, the fact that homophily fosters interpersonal trust formation independent of fundamentals could aggravate the advisor misconduct documented in recent studies (e.g., Egan, Matvos, and Seru, forthcoming). Thus, despite regulatory efforts to curb conflicted advice, we conclude that the implications of homophily greatly depend on whether or not advisors act in the interests of their clients.
Our study contributes to several strands of literature. First, we add to recent research which has focused on the client-advisor interaction during personal meetings in order to explain the propensity to follow financial advice. A substantial knowledge asymmetry typically prevents advisees from assessing the quality of the advice they receive (e.g., Chater, Huck, and Inderst 2010). Thus, regardless of the features of the recommended products, investment decisions of advised individuals can be explained in large part by simple heuristics based on how they perceive the interaction with their financial advisors (Agnew et al. 2018; Anagol, Sarkar, and Cole 2017; Monti et al. 2014; Mullainathan, Noeth, and Schoar 2012). At this, demographic characteristics appear to be particularly strong signals. Consistent with popular stereotypes of advisors as middle-aged men, general evidence on advice taking suggests that both men and women tend to rely on men when connecting to information in remote domains (Aldrich 1989; Bernard et al. 1988) and are more inclined to heed advice from older people who they perceive as more competent and experienced (Feng and MacGeorge 2006; Harvey and Fischer 1997; Nadler, Ellis, and Bar 2003). For financial advice, however, results are mixed. While Söderberg (2013) reports that consumers perceive male advisors as more credible and rate the financial risk inherent in the advice higher when it is given by a female advisor, the evidence in Agnew et al. (2018) suggests the opposite: controlling for advice quality, customers prefer female advisors more strongly and tend to discount recommendations given by older advisors. We extend this body of literature by documenting that demographic similarities between client and advisor, via homophily, positively affect the likelihood of clients following the financial advice they receive whenever the counseling setting involves information asymmetry.
In doing so, we also contribute to the inconclusive evidence on how the matching of customers and employees according to their demographic characteristics influences business performance.4 While this question has received considerable attention in the marketing literature, Hoechle et al. (2018) is the only study we are aware of which analyzes the impact of client-advisor matching in the context of financial advice. Specifically, they analyze the impact of gender and age matching on the profitability of advised trades and find that there is weak evidence that age matching matters for bank profits.
More broadly, we provide novel evidence on the economic implications of homophily beyond the customer-employee relationship. Hwang and Kim (2009), for example, find that, owing to homophilous behavior, a considerable percentage of the conventionally independent boards are not, in fact, socially independent. Similarly, Berger et al. (2013) document that homophily based on age and gender increases the probability that the appointee to an executive board is an outsider without previous employment at the bank. More recently, Hegde and Tumlinson (2014) show that U.S. venture capitalists are more likely to invest in start-ups with coethnic executives.
1. Data
1.1 Sample selection
We are able to draw on a unique data set provided by a German savings bank. Savings banks are locally owned and run and concentrate on universal banking targeting individuals as well as small and medium-sized enterprises. Together with cooperative and private banks, they represent the three tiers of banking in Germany and, by the end of 2015, accounted for 37.4% in aggregate German retail deposit business which totaled just over 1.8 trillion EUR (DSGV 2015). Generally, savings banks tend to attract traditional bank customers with a preference for a strong and long-lasting relationship with their house bank. Our bank offers a broad range of financial services, such as checking accounts, savings accounts, securities accounts, loans, and mortgages, to its retail customers.
For our analysis, we focus on those retail clients who consult with one of the banks’ financial advisors in order to receive investment advice pertaining to risky securities.5 Each client who opens an account at the bank is assigned an advisor who henceforth is her main contact person.6 Assignment happens quasi randomly and involves two steps. First, based on her total investable assets, the client is matched with one of the three investment advisory services which the bank offers (basic and advanced investment advice as well as private banking) and which determine the possible range of advisors she can be assigned to. Within either client segment, clients are then randomly matched with advisors.7 Clients can either place their investment orders independently or they can make use of optional financial advice provided free of charge.8|$^{,}$|9 In the latter case, they receive investment advice in the form of security-specific recommendations during personal meetings with their financial advisor. Like most investment advice in the retail segment—and unlike the recommendations of nonbank financial advisors as studied, for example, in Linnainmaa, Melzer, and Previtero (2016) and Foerster et al. (2017)—our bank’s advice is largely standardized (cf., e.g., Hackethal et al., 2016). Advisors draw on sample portfolios which an internal team of market experts has customized based on investable assets and risk capacity, and possess little discretion regarding the menu of recommendations. Moreover, clients in our setting do not grant discretionary portfolio mandates and authorize every order. Finally, advisors at our bank do not receive any compensation components based on their sales performance or commissions paid by product providers.10
Our data set covers the time period from October 2013 to March 2016 and the advisory meeting, that is, the personal interaction between clients and advisors, represents our main object of study. Our sample includes all client-advisor meetings in which specific investment recommendations were made.11
We merge four data sources to investigate our research questions. Our first database supplies detailed demographic characteristics of advised bank clients including age, gender, income, household size, nationality, marital status, and professional status. Moreover, we have information about clients’ financial wealth and total assets as well as the length of their relationship with our bank and their individual risk capacity, which the advisor elicits as part of the “Know Your Customer” (KYC) survey she conducts with each client at account origination and annually thereafter.
As a unique feature of our data set, we also have demographic information about advisors in our sample. Specifically, our second database contains advisor characteristics, including age, gender, marital status, nationality, and household size, which allow us to measure the effect of homophily between client and advisor.
Third, we have detailed records of each client-advisor meeting during our period under review including date and all security-specific recommendations along with the corresponding euro amount required to implement the investment advice.12
Finally, the bank provided us with detailed transaction records of all advised clients. Again, account activity is available at the level of the individual security including the respective investment amounts.13
Our final sample consists of 1,431 clients who consult with their advisor at least once during our investigation period. These clients are assigned to 167 different advisors, and we analyze a total of 2,378 personal client-advisor contacts via personal meetings.
1.2 Summary statistics
1.2.1 Clients
Panel A of Table 1 reports summary statistics for the sampled clients and compares them to national averages for the representative savings bank advisee in Germany based on survey data on the financial situation of German households provided by the Deutsche Bundesbank in the Panel on Household Finances (PHF).14 Specifically, 47.7% of clients in our sample are male, 53.0% are married, 10.5% have at least one child living in the household during the investigation period, and, at 98.6%, virtually all of them hold a German citizenship. On average, clients are roughly 57 years old, have been with the bank for more than nine years and have total assets of 152,538 EUR as well as a monthly net income of 2,116 EUR.
Summary statistics
| Sample | PHF | Diff. | |$t$|-stat. | |||||||||
|---|---|---|---|---|---|---|---|---|---|---|---|---|
| Measurement unit | N | Mean | SD | Min. | 25th | Median | 75th | Max. | Mean | |||
| A. Clients | ||||||||||||
| Client male | Dummy = 1 if client male | 1,431 | 0.4766 | 0.4996 | 0 | 0 | 0 | 1 | 1 | 0.5453 | −0.0687** | −2.38 |
| Client age | Client age (years) | 1,431 | 57.09 | 16.56 | 19 | 48 | 58 | 69 | 99 | 49.44 | 7.646*** | 7.80 |
| Client married | Dummy = 1 if client married | 1,410 | 0.5298 | 0.4993 | 0 | 0 | 1 | 1 | 1 | 0.5193 | 0.0105 | 0.36 |
| Client parent | Dummy = 1 if at least one child in client household | 1,431 | 0.1048 | 0.3064 | 0 | 0 | 0 | 0 | 1 | n.a. | ||
| Client German | Dummy = 1 if client German | 1,431 | 0.9860 | 0.1177 | 0 | 1 | 1 | 1 | 1 | 0.9585 | 0.0275*** | 3.42 |
| Client income | Client monthly net income (EUR) | 1,431 | 2,116 | 2,426 | 0 | 753 | 1,820 | 2,927 | 46,022 | 2,584 | |$-468^{***}$| | −3.57 |
| Client financial wealth | Client financial assets(EUR) | 1,431 | 70,461 | 124,815 | 0 | 9,753 | 28,964 | 77,053 | 1,705,193 | 57,651 | 12,810 | 1.59 |
| Client wealth | Client total assets (EUR) | 1,431 | 152,537 | 181,736 | 4,361 | 47,113 | 94,837 | 188,439 | 2,088,064 | 171,123 | |$-$|18,585 | −1.10 |
| Client financial literacy | Client financial literacy (0–3) | 1,431 | 2.413 | 0.7244 | 1.259 | 1.735 | 2.260 | 2.498 | 2.921 | 2.562 | −0.1485*** | −3.60 |
| Client risk capacity | Client risk capacity (1–5) | 1,431 | 2.642 | 0.8533 | 1 | 2 | 3 | 3 | 5 | n.a. | ||
| Finance-sector job | Dummy = 1 if client works in finance sector | 1,431 | 0.0273 | 0.1629 | 0 | 0 | 0 | 0 | 1 | 0.0330 | −0.0057 | −0.59 |
| Length of bank relationship | Length of relationship with bank (years) | 1,301 | 9.411 | 9.307 | 0 | 0.0767 | 7.633 | 15.46 | 34.35 | n.a. | ||
| B. Advisors | ||||||||||||
| Advisor male | Dummy = 1 if advisor male | 167 | 0.5775 | 0.4957 | 0 | 0 | 1 | 1 | 1 | |||
| Advisor age | Advisor age (years) | 167 | 40.55 | 10.64 | 24 | 30 | 41 | 50 | 63 | |||
| Advisor married | Dummy = 1 if advisor married | 167 | 0.6826 | 0.4669 | 0 | 0 | 1 | 1 | 1 | |||
| Advisor parent | Dummy = 1 if at least one child in advisor household | 167 | 0.3413 | 0.4756 | 0 | 0 | 0 | 1 | 1 | |||
| Advisor German | Dummy = 1 if advisor German | 167 | 0.9940 | 0.0774 | 0 | 1 | 1 | 1 | 1 | |||
| Number of clients | Number of different clients per advisor | 167 | 9.373 | 13.25 | 2 | 2 | 4 | 11 | 99 | |||
| Number of meetings | Number of different meetings per advisor | 167 | 14.98 | 31.42 | 2 | 2 | 4 | 13 | 255 | |||
| C. Meetings | ||||||||||||
| Sum of recommendations | Total amount of recommendations per meeting (EUR) | 2,378 | 25,225 | 28,392 | 800 | 9,000 | 15,000 | 30,000 | 309,742 | |||
| Percentage of buy recommendations | Fraction of buy recommendations per meeting | 2,378 | 0.9594 | 0.1689 | 0 | 1 | 1 | 1 | 1 | |||
| Duration of meeting | Length of meeting (minutes) | 2,378 | 42.82 | 16.09 | 15 | 30 | 45 | 60 | 60 | |||
| D. Post-advice account activity | ||||||||||||
| Sum of investments | Total amount of security investments related to meeting (EUR) | 2,378 | 21,721 | 29,538 | 0 | 5,000 | 11,621 | 28,694 | 314,446 | |||
| ROF | Ratio of following; fraction of recommendations implemented | 2,378 | 0.7410 | 0.4271 | 0 | 0.4118 | 1 | 1 | 1 | |||
| DOF | Degree of following; penalizes misallocation of funds | 2,378 | 0.6683 | 0.4264 | 0 | 0.1922 | 1 | 1 | 1 | |||
| LOF | Likelihood of following; excludes partial following of advice | 2,218 | 0.7268 | 0.4308 | 0 | 0 | 1 | 1 | 1 | |||
This table reports descriptive statistics of our sample. See Sections 1.2 and 2.2 for detailed variable descriptions. The rightmost columns compare our sample of clients to the representative German savings bank client (obtained from PHF data). ***, **, and * indicate statistical significance at the 1%, 5%, and 10% levels, respectively.
Moreover, because pensions granted by the state and the employer are typically accumulated in separate accounts in Germany, a concentration of all private investments in one account is common practice for individuals (e.g., Bhattacharya et al. 2012). The sampled clients’ large mean (median) portfolio value of 70,461 EUR (28,964 EUR) suggests that we look at their main accounts and not at “play money” portfolios primarily intended to take small gambles. Thus, it is rather unlikely that the bulk of investors’ privately accumulated financial wealth is held in other accounts we cannot observe.
Unfortunately, we lack data on client financial literacy in our primary data set, which has been shown an important determinant of individuals’ likelihood of following financial advice in a number of recent contributions (Bucher-Koenen and Koenen 2015; Calcagno and Monticone 2015; Hackethal, Haliassos, and Jappelli 2012; Stolper 2018). To overcome this data limitation, we follow Stolper (2018) and construct a demographics-based financial literacy variable. To this end, we use the PHF, which provides us with a test-based measure of financial literacy designed by Lusardi and Mitchell (2008). In brief, we take the coefficient estimates obtained from an empirical model of financial literacy based on the PHF data to predict the financial knowledge of clients in our main data set.15 On a scale ranging from zero to three, clients in our sample feature a mean (median) imputed financial literacy score of 2.41 (2.26).
Likewise, we obtain a mean (median) client risk capacity of 2.64 (3.00) from the KYC form (based on a 1–5 scale).
Following Calcagno and Monticone (2015), who show that individuals working in the financial sector are significantly more likely to invest autonomously, we use the clients’ job data to flag individuals employed in the financial sector and construct the binary control variable Finance-sector job, which takes a value of 1 for 2.7% of clients under review.
Finally, the data record 1.66 advisory meetings during the 30-month period under review for the average advisee. This corresponds to clients consulting with their advisor less than once a year and confirms similar numbers in Hackethal et al. (2016), who report an average 2.73 meetings over a 48-month sample period.
How do the sampled clients compare to the average German bank advisee? Based on the PHF data, our retail clients are representative of savings banks clients in terms of financial wealth and total assets. Moreover, while most demographics are broadly comparable to the corresponding national averages, our sample features a higher proportion of elder and female advisees and we look at individuals with less-than-average income. These three deviations taken together imply that widows, who often earn no income (anymore) but nevertheless own substantial investable assets, are somewhat oversampled. By and large, however, we note that clients in our sample resemble the representative advised client at savings banks in Germany. Additionally, Table A.1 provides a comparison of advisees at savings banks—who account for roughly half of all advised bank clients in Germany—versus cooperative and private bank advisees and reports that they are on average slightly younger and hold less total assets.
1.2.2 Advisors
Panel B of Table 1 reports summary statistics for the advisors. 57.8% of advisors in our sample are male, 68.3% are married and again, an overwhelming majority of 99.4% of them are German citizens. The average advisor is about 41 years old, which points to an age gap of roughly 16 years between advisors and clients in our sample. Consistent with the discrepancy in average age, 34.1% of advisors raise children during our period under review, that is, more than 3 times the respective percentage among clients.
The average advisor manages nine different clients and, in line with retail customers’ generally infrequent use of personal financial advice, schedules only roughly 15 meetings (each taking an average of 43 minutes) with her clients during the sample period. Panel C of Table 1 shows that the mean (median) amount of security investments recommended in a personal consultation sum to as much as 25,225 EUR (15,000 EUR) and almost exclusively comprises buy recommendations.16|$^{,}$|17
2. Hypotheses and Key Variables
2.1 Homophily and clients’ propensity to follow financial advice
Homophily creates a strong link between similarity and connection. On the one hand, it explains why people’s personal networks are largely homogeneous across sociodemographic characteristics and behavioral traits. On the other hand, homophily limits people’s social worlds in a way that has powerful implications for the information they receive, the attitudes they from, and, importantly, the way they experience interactions with others. Thus, homophily effectively governs who individuals consider to be their relevant others and those whose opinions they attend to (Burt 1982; Friedkin 1993; Lawrence 2006).
Specifically, peoples’ affinity for similar others provides an environment conducive to mutual understanding in all kinds of personal relationships ranging from marriage and friendship to professional interactions like advice taking. Moreover, homophily implies that when a client detects elements of similarity in her advisor, a shift in normative expectations leads to the development of a benevolent attitude toward the advisor such that her intentions and actions are interpreted favorably (Mills and Clark 1982; Silver 1990; Uzzi 1999). Thus, other things equal, we expect clients who share more homophilous ties with their advisors to display a higher propensity to follow the advice they receive.
2.2 Measuring clients’ propensity to follow advice
Our comprehensive data allows for a simple and intuitive empirical strategy of capturing clients’ propensity to follow advice. Specifically, we perform a security-by-security comparison of the recommendations they receive in each advisory meeting with their actual account activity during the 30 days after the meeting. Panel D of Table 1 reports that, in sum, the mean (median) post-advice account activity amounts to 21,721 EUR (11,621 EUR) per client under review.
To begin with, we take the euro amounts of securities recommended and purchased to compute a ratio of following (ROF). The ROF is a simple percentage of implemented recommendations; that is, it is not reduced if—at a time when all or part of the advice has not yet been followed—the client allocates funds to investments unrelated to the recommendations she has received. As can be seen in Panel D, the average client in our sample implements as much as 74.1% of all recommendations, that is, transacts a mean amount of 18,692 EUR in securities directly related to the investment recommendations after a personal meeting with the advisor. In a similar setting, Hackethal et al. (2016) document an even higher acceptance rate: in their study, where clients of a German retail bank receive standardized financial advice, as much as 90% of advisor recommendations are implemented within 30 days of the advisory meeting.
In line with this reasoning, our data reveal that only 160 (6.7%) of the meetings under review do not result in either a ROF of 0 or a ROF of 100%, that is, the vast majority of clients either completely disregard the advice or fully heed it. Hence, we exclude meetings resulting in partial implementation of advice from our baseline sample of meetings and use the indicator variable likelihood of following (LOF) instead of the ROF as the dependent variable in our main analyses, which averages 72.7% across all advisees under review.
Finally, we also calculate the degree of following (DOF) as introduced in Bhattacharya et al. (2012). This measure sanctions clients’ misallocation of funds and thus should be smaller than the ROF if their post-advice investment activity deviates from advisor recommendations. Indeed, at 66.8%, the average DOF is slightly lower than the mean ROF. The minor difference, however, suggests that most of the clients who do not follow the advice stay idle rather than buying assets which deviate from their advisors’ recommendations.18
2.3 Measuring the effect of homophily
2.3.1 General approach
Following existing studies applying the concept of homophily to research in business economics (e.g., Berger et al. 2013; Hegde and Tumlinson 2014; Hwang and Kim 2009), we straightforwardly capture potential homophilous traits using sociodemographic similarities between clients and advisors. Demographic characteristics play a crucial role for the occurrence of homophily—that is, an affinity for others who are similar—because they provide people with more or less salient attributes facilitating the identification of similar others. Specifically, (1) race and ethnicity, (2) gender, (3) age, (4) religion, and (5) education, occupation and social status have been identified as the most important dimensions of homophily in the sociology literature (McPherson, Smith-Lovin, and Cook 2001).
2.3.2 Homophily dimensions
We choose gender, age, and—to proxy for social status—the two characteristics marital and parental status to capture homophilous traits in the interaction between client and advisor. In what follows, we discuss our choice of homophily dimensions.
The sociology literature points to an important role of gender and age similarity in breeding homophily. On the one hand, while men and women form almost equal-sized groups in the general population, workplaces (e.g., Bielby and Baron 1986; Kalleberg et al. 1999) as well as clubs and societies (McPherson and Smith-Lovin 1987; Popielarz 1999) are often highly sex segregated, thereby laying the ground for homophily on gender. On the other hand, the fact that schools group age cohorts together into classrooms causes strong age-induced homophily early on (Shrum, Cheek, and Hunter 1988) and age homogeneity, for example, at work and in voluntary organizations generates substantial age homophily in later stages of life (Feld 1982; Sampson 1984). Moreover, Marsden (1988) finds that individuals have a higher tendency to place confidence in someone of their own age. By contrast, the further away someone is in age, the less likely this person is perceived as someone with whom to discuss important matters. Only recently, Brashears (2015) finds that age homophily among Americans has increased over time. We specify the dummy variable Same gender equal to 1 if both client and advisor are female or male, respectively. In our sample, the fraction of meetings in which advisee and advisor have the same sex amounts to 54.6%. Likewise, we capture age similarity by means of the indicator variable Same age, which assumes a value of 1 if the absolute age difference between client and advisor does not exceed 5 years. Owing to the substantial age gap between advisors and clients under review, Same age equals 1 for only 20.0% of the sampled meetings.
By contrast, while “race and ethnicity are clearly the biggest divide in social networks today in the U.S. (…), they play a minor part in structuring the networks in other ethnically diverse societies (…)” (McPherson, Smith-Lovin, and Cook 2001, p.420). In fact, however, Germany, where our bank is headquartered, is among the most ethnically homogeneous countries in the world (Alesina et al. 2002).19 Thus, we refrain from including ethnicity in our measure of homophily. Similarly, while early evidence suggests evidence for religious homophily in all societies with religious diversity (e.g., Fischer, Stueve, and Jones 1977; Marsden 1988), this pattern (1) has been shown to decrease in relevance (Kalmijn 1998) and (2) Germany ranks among the countries with only moderate religious diversity (Pew Research Center 2014).20
Additionally, researchers have documented homophily on education, occupation, and social status in a large number of societies. Yet there is again some indication that education and occupation are less likely to create links between confidants than most other characteristics (Louch 2000). Moreover, owing to our setting, we do not observe any variation in training or occupation on the part of the advisors, which prevents us from incorporating the two dimensions into our measure of homophily. We do, however, include a dummy indicating whether the client works in the finance sector (Finance-sector job) to identify clients who likely share similarities with their advisors in terms of education and occupation.
Finally, we choose marital and parental status to proxy for homophilous traits induced by commonalities in social status. Controlling for gender and age, Kalmijn and Vermunt (2007), and, more recently, Andreotti and Le Galès (2016) find strong homophily by marital status.21 Likewise, Munch, McPherson, and Smith-Lovin (1997) show that the onset of parenthood induces considerable similarity in the networks of men and women and recently, Meissner (2016) confirms the role of parental homophily in a Germany-based field study. He observes that being a parent is one of the most pronounced sociality-structuring characteristics. Because of this, we include parenthood as an additional proxy for social status. Specifically, we construct the binary variables Same marital status and Same parental status. Same marital status assumes a value of 1 if clients and advisors match with respect to their marital status, that is, are either both single or both married, which holds true for 46.2% of meetings in our sample. Analogously, Same parental status equals 1 for 50.2% of all meetings under review in which either both client and advisor have underage children in their households or neither one.
2.3.3 Number of homophilous ties
To measure the intensity of homophilous traits between client and advisor, we merge all four sociodemographic dimensions in a single metric. Following Girard, Hett, and Schunk (2015), we construct the variable Number of homophilous ties counting the number of commonalities which client and advisor share in terms of gender, age bracket, marital status and whether or not children are being brought up in the client’s as well as advisor’s household at the time of the personal meeting. Number of homophilous ties assumes values in [0;4]. Straightforwardly, a value of 0 indicates nonexistent homophilous ties, whereas the values of 1–4 describe the intensity of homophilous ties between client and advisor, where a higher value corresponds to a stronger link.
Figure 1 plots the distribution of our key explanatory variable Number of homophilous ties and shows that in nearly 90% of meetings under review, clients interact with advisors with whom they share at least one commonality. Moreover, at 37.1%, meetings in which advisees and advisors feature similarities in two of the four sociodemographic dimensions represent the largest subgroup in our sample.
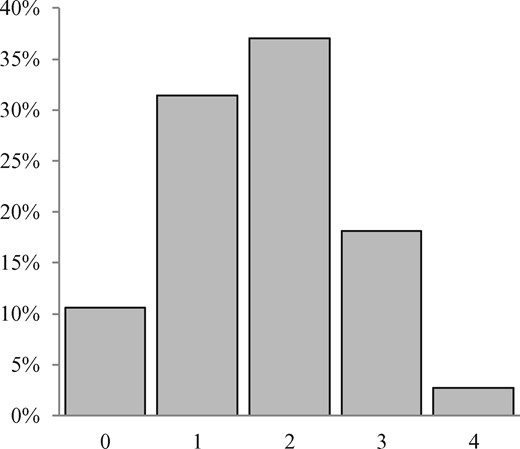
Distribution of Number of homophilous ties
This figure plots the distribution of the count variable capturing similarities between client and advisor along the four homophily dimensions: gender, age, marital status, and parental status (Number of homophilous ties). See Section 2.3.3 for a description of the variable.
2.4 Descriptive evidence
Do homophilous ties among client and advisor associate with the propensity to follow investment advice, and if so, how?
Table 2 reports descriptive evidence. The first five columns of Panel A show the different sociodemographics used to measure homophily as well as the sixteen different combinations of homophilous ties between client and advisor. Thus, combination 5, for instance, captures the subgroup of clients who consult with an advisor of their own gender but are dissimilar with respect to the remaining three homophily dimensions. Similarly, combination 11 characterizes meetings in which client and advisor are within the same age bracket and match in terms of gender, whereas they differ regarding their marital status as well as regarding the fact that one of them currently raises children while the other does not. The right hand side of Panel A reports the corresponding number of homophilous ties as well as their absolute and relative frequency, and, in the rightmost column, mean LOF levels computed for each of the 16 combinations of commonalities and dissimilarities along the four homophily dimensions.
Descriptive evidence
| A. Mean LOF by combination of homophily dimensions | ||||||||
|---|---|---|---|---|---|---|---|---|
| Same | Same | Same | Same | Number of | Mean | |||
| Combination | gender | age | marital status | parental status | homophilous ties | N | % | LOF (%) |
| 1 | 0 | 0 | 0 | 0 | 0 | 235 | 10.6 | 66.2 |
| 2 | 0 | 0 | 0 | 1 | 1 | 190 | 8.6 | 67.3 |
| 3 | 0 | 0 | 1 | 0 | 1 | 191 | 8.6 | 72.6 |
| 4 | 0 | 1 | 0 | 0 | 1 | 48 | 2.2 | 59.1 |
| 5 | 1 | 0 | 0 | 0 | 1 | 270 | 12.2 | 69.7 |
| 6 | 0 | 0 | 1 | 1 | 2 | 199 | 9.0 | 72.7 |
| 7 | 0 | 1 | 0 | 1 | 2 | 67 | 3.0 | 71.4 |
| 8 | 0 | 1 | 1 | 0 | 2 | 32 | 1.4 | 52.0 |
| 9 | 1 | 0 | 0 | 1 | 2 | 223 | 10.1 | 76.8 |
| 10 | 1 | 0 | 1 | 0 | 2 | 241 | 10.9 | 77.9 |
| 11 | 1 | 1 | 0 | 0 | 2 | 59 | 2.7 | 56.8 |
| 12 | 0 | 1 | 1 | 1 | 3 | 46 | 2.1 | 74.1 |
| 13 | 1 | 0 | 1 | 1 | 3 | 226 | 10.2 | 77.1 |
| 14 | 1 | 1 | 0 | 1 | 3 | 102 | 4.6 | 76.8 |
| 15 | 1 | 1 | 1 | 0 | 3 | 28 | 1.3 | 82.0 |
| 16 | 1 | 1 | 1 | 1 | 4 | 61 | 2.8 | 79.4 |
| 2,218 | 100.0 | 72.7 | ||||||
| B. Mean LOF by value of Number of homophilous ties | ||||||||
| Number of | Mean | |||||||
| homophilous ties | N | % | LOF (%) | |||||
| 0 | 235 | 10.6 | 66.2 | |||||
| 1 | 699 | 31.5 | 69.1 | |||||
| 2 | 821 | 37.0 | 73.3 | |||||
| 3 | 402 | 18.1 | 77.0 | |||||
| 4 | 61 | 2.8 | 79.4 | |||||
| 2,218 | 100.0 | 72.7 | ||||||
This table reports descriptive evidence on clients’ average likelihood of following (LOF) by combination of the four homophily dimensions gender, age, marital status, and parental status (Panel A) and values of Number of homophilous ties (Panel B), that is, the count variable capturing the number of similarities between client and advisor along the four homophily dimensions. See Section 2 for detailed variable descriptions.
While the 235 meetings in which client and advisor do not feature a single commonality (i.e., combination 1) on average yield a LOF of 66.2%, the mean LOF climbs to 79.4% in the subgroup of meetings in which client and advisor share the highest possible number of sociodemographic similarities (i.e., combination 16). This implies an unconditional difference in LOF levels of as much as 13.2 pp for interactions of clients and advisors displaying the most versus least intense homophilous ties. Moreover, we find that, unconditionally, the propensity to follow advice increases monotonically with every additional demographic similarity. Specifically, Panel B of Table 2 shows that the mean LOF level for the 699 meetings in which client and advisor share one sociodemographic commonality amounts to 69.1%, while it comes to 73.3% (77.0%) for the 821 (402) meetings with similarities along two (three) of the four homophily dimensions gender, age, marital status, and parental status.
Taken together, the results presented in Table 2 provide preliminary evidence in support of the hypothesis that the number of homophilous ties between client and advisor positively associates with the propensity to heed financial advice. In what follows, we examine whether this positive relationship persists once we control for advisor heterogeneity as well as a battery of additional variables which have been shown to explain people’s likelihood of following financial advice in prior research.
3. Regression Results
3.1 Model
We choose the linear over the logistic model because, for the logistic model to fit better than the linear model, the log odds must be a linear function of the regressors, while the probability must not. This condition is satisfied if the relationship between the probability and the log odds is nonlinear. In case the probability is between .20 and .80, however, the log odds are almost a linear function of the probability (e.g., Long and Freese, 2014) and out-of-bounds predicted probabilities therefore do not present a major concern. The mean of our dependent variable LOF is 0.7268 (cf. Table 1) and thus lies within the above range. This implies that the linear and logistic models fit about equally well, and the linear model should be favored for its ease of interpretation (e.g., Hellevik, 2009, Wooldridge, 2010).
Fortunately, our data structure allows us to follow Foerster et al. (2017) and Linnainmaa, Melzer, and Previtero (2016) and estimate our regression model using advisor fixed effects |$\alpha_k$| to control for any advisor heterogeneity potentially driving the likelihood of following. Besides capturing unobserved variation in advisor attributes, advisor fixed effects also ensure that estimated effects of the client characteristics which we include in our model reflect the true impact ascribable to them and are not confounded by advisor effects we cannot capture.
The sociodemographics we use to capture homophily enter our regression model once again as client characteristics in order to single out the effect of homophily by controlling for variation in the input parameters of our similarity measures on the part of the clients. Also, this specification allows us to account for previous findings indicating a baseline effect of the respective client demographics on individuals’ propensity to heed financial advice. Similarly, we include a number of additional client attributes which have been found to determine their decision to heed financial advice, that is, financial literacy (Bucher-Koenen and Koenen 2015; Stolper 2018), working in the finance sector (Calcagno and Monticone 2015), income (Lachance and Tang 2012), and financial wealth (Bhattacharya et al. 2012).22 Moreover, we control for clients’ risk capacity and the length of their relationship with the bank as additional attributes capable of driving their inclination to follow the advice they receive. All client characteristics alongside our key explanatory variable are captured by the vector c|$_{\!\!j}$| in the model.
Finally, we account for variation in the meetings, that is, the sum of all recommendations received as well as proportion of buy recommendations and length of meeting, which enter the equation via the vector m|$_{i}$|. All regressions are estimated using robust standard errors clustered at the advisor level and feature month fixed effects over the period under review.
3.2 Main results
Table 3 reports coefficient estimates obtained from various specifications of the generic linear probability model formalized in Equation (1). Unconditionally, we estimate a statistically significant positive effect of the number of homophilous ties between client and advisor on the likelihood of following investment advice, that is, corroborating the descriptive evidence in Section 2.4. More importantly, however, when we control for the impact of advisor heterogeneity as well as a host of client characteristics captured in c|$_{\!\!j}$| and meeting controls included via m|$_{i}$|, the average effect of an additional demographic similarity of client and advisor on the likelihood of following continues to be highly statistically significant and amounts to 2.2 pp (|$t = 2.90$|) as shown in specification (2), which marks our baseline model. To spell this out, we observe a mean difference in LOF levels in the order of 8.8 pp when we compare interactions between clients and advisors exhibiting the highest versus lowest number of similarities across the different homophily dimensions. While this is less than the total unconditional effect of 13.2 pp, the results of the multiple linear regression also provide strong evidence in support of an economically meaningful influence of homophily on individuals’ propensity to follow financial advice.
Main results
| Dependent variable LOF | |||
|---|---|---|---|
| (1) | (2) | (3) | |
| Number of homophilous ties | 0.0330*** | 0.0223*** | |
| (0.0085) | (0.0077) | ||
| Number of homophilous ties = 1 | 0.0241*** | ||
| (0.0083) | |||
| Number of homophilous ties = 2 | 0.0459** | ||
| (0.0209) | |||
| Number of homophilous ties = 3 | 0.0684*** | ||
| (0.0216) | |||
| Number of homophilous ties = 4 | 0.0893* | ||
| (0.0479) | |||
| Client male | 0.0373* | 0.0380* | |
| (0.0201) | (0.0201) | ||
| Client age | 0.0027*** | 0.0027*** | |
| (0.0007) | (0.0007) | ||
| Client married | −0.0021 | −0.0021 | |
| (0.0202) | (0.0203) | ||
| Client parent | 0.0190 | 0.0168 | |
| (0.0319) | (0.0321) | ||
| Client German | 0.0680 | 0.0631 | |
| (0.0793) | (0.0844) | ||
| Client income (ln) | −0.0085 | −0.0084 | |
| (0.0057) | (0.0057) | ||
| Client financial wealth (ln) | 0.0243* | 0.0230* | |
| (0.0129) | (0.0123) | ||
| Client financial literacy | −0.0161*** | −0.0159*** | |
| (0.0051) | (0.0051) | ||
| Client risk capacity | 0.0071 | 0.0072 | |
| (0.0118) | (0.0119) | ||
| Finance-sector job | −0.1885** | −0.1936** | |
| (0.0769) | (0.0759) | ||
| Length of bank relationship | −0.0011 | −0.0011 | |
| (0.0009) | (0.0009) | ||
| Sum of recommendations (ln) | −0.0470*** | −0.0468*** | |
| (0.0119) | (0.0119) | ||
| Pecentage of buy recommendations | −0.0139*** | −0.0136*** | |
| (0.0051) | (0.0051) | ||
| Duration of meeting | −0.0003*** | −0.0003*** | |
| (0.0001) | (0.0001) | ||
| Advisor FEs | No | Yes | Yes |
| Time FEs | No | Yes | Yes |
| N | 2,209 | 2,209 | 2,209 |
| R|$^{2}$| | 0.0508 | 0.2434 | 0.2487 |
Specification (1) shows the unconditional effect of Number of homophilous ties on client |$j$|’s likelihood of following advisor |$k$|’s recommendations (LOF) in meeting |$i$|, i.e. excluding client characteristics c|$_{\!\!j}$|, meeting controls m|$_{i}$| as well as advisor and time fixed effects. Specification 2 shows the conditional effect of Number of homophilous ties on clients’ LOF levels including client characteristics, meeting controls as well as advisor and time fixed effects. Specification 3 reports coefficient estimates of a linear probability model with four distinct indicators for the number of similarities (with Number of homophilous ties = 0 being the reference group). All specifications are estimated with robust standard errors. ***, **, and * indicate statistical significance at the 1%, 5%, and 10% levels, respectively.
Turning to the remaining regressors, we find that older clients, male clients, and clients who hold more financial assets are somewhat more likely to follow the investment advice they receive, albeit, in case of gender and financial wealth, this is only borderline significantly so. At this, the results contribute to mixed evidence as to the role of client gender for the receptiveness to financial advice. While Bluethgen et al. (2008), Collins (2012), and Hackethal, Haliassos, and Jappelli (2012) report female advisees to be more likely to accept advice, Bhattacharya et al. (2012), Bucher-Koenen and Koenen (2015), and Stolper (2018) find that client gender is insignificant in explaining advisees’ likelihood of following. Likewise, Bhattacharya et al. (2012) find age is insignificant in explaining advisees’ propensity to follow investment advice.
Moreover, we support evidence in Bucher-Koenen and Koenen (2015), who find that clients’ marital status has no measureable effect on their likelihood of following advice. Finally, we note that client parental status—which, to the best of our knowledge, has not yet been analyzed as a determinant of individuals’ propensity to follow advice—is also insignificant in explaining LOF levels.
Interestingly, our results confirm the puzzling role of financial literacy documented in Bucher-Koenen and Koenen (2015) and Stolper (2018): the higher the client’s financial literacy levels, the less likely she is to heed the recommendations of her advisor, thus supporting the notion of a complementarity between financial literacy and financial advice. Moreover, we document that the few clients who work in the financial sector are significantly less inclined to follow the investment advice they obtain. While this is consistent with the evidence provided in Calcagno and Monticone (2015) and Stolper (2018), we are careful not to overstate the explanatory power of Finance-sector job, because values of this variable are very unevenly distributed across advisees in our sample.
In addition, all meeting controls prove statistically significant. Specifically, the longer the personal meeting, the higher the total amount of recommendations received, and the more buy recommendations included, the less likely advisees are to implement the advice.
Finally, specification 3 reports coefficient estimates obtained when including four distinct indicators for the number of homophilous ties (with Number of homophilous ties = 0 being the reference group). The results of this estimation document that clients’ likelihood of following increases monotonically with every additional sociodemographic similarity and also show that the positive impact of homophily is almost linear in the multivariate setting.
3.3 Heterogeneous treatment effects
Next, we investigate whether and how the effect of homophily on the likelihood of following advice varies across subgroups of clients and for subsamples of meetings previously unaccounted for by the baseline model specified in Equation (1). While prior research on the determinants of individuals’ propensity to follow financial advice has not examined treatment-effect heterogeneity, the literature on trust and financial advice suggests potential interaction effects. In an early study, Johnson and Grayson (2005) distinguish cognitive and affective dimensions of trust formation. While cognitive trust is based on knowledge and expertise, affective trust stems from client confidence based on a sense of security with the advisor. Thus, absent a means to build cognitive trust, the effect of homophily could be, for example, stronger for new clients or clients with lower levels of financial knowledge, who might (unconsciously) rely more heavily on salient factors when forming their impressions about the advisor.
Table 4 reports the relevant coefficient estimates row-wise by indicator variable. Thus, for the dummy Client male, for example, |$\beta _{1}$| reports the effect of Number of homophilous ties on the likelihood of following for the subgroup of female clients (i.e., Client male|$= 0), \beta _{1}+\beta _{3}$| denotes the effect of Number of homophilous ties for the subsample of male clients, and |$\beta _{3}$| shows the difference in the reported effects for male and female clients, respectively.23 Analogously, the second row reports betas for the 50% younger clients (|$\beta _{1})$|, the 50% elder clients (|$\beta _{1}+\beta _{3})$|, and the difference between the two cohorts (|$\beta _{3})$|, and so on.
Heterogeneous treatment effects
| Dependent variable LOF | |||||
|---|---|---|---|---|---|
| Indicator variable | |$\beta_{1}$| | |$\beta _{1} + \beta_{3}$| | |$\beta _{3}$| | N | R|$^{2}$| |
| Client male | 0.0234*** | 0.0191** | −0.0043 | 2,209 | 0.2434 |
| (0.0088) | (0.0079) | (0.0159) | |||
| Client age_high | 0.0273*** | 0.0168** | −0.0105** | 2,209 | 0.2414 |
| (0.0088) | (0.0072) | (0.0051) | |||
| Client married | 0.0208** | 0.0232** | 0.0024 | 2,209 | 0.2441 |
| (0.0091) | (0.0092) | (0.0203) | |||
| Client parent | 0.0225*** | 0.0207*** | −0.0018 | 2,209 | 0.2445 |
| (0.0073) | (0.0072) | (0.0164) | |||
| Client German | 0.0793 | 0.0221*** | −0.0572 | 2,209 | 0.2378 |
| (0.6096) | (0.0078) | (0.0355) | |||
| Client income_high | 0.0240*** | 0.0211*** | −0.0029 | 2,209 | 0.2456 |
| (0.0087) | (0.0084) | (0.0031) | |||
| Client financial wealth_high | 0.0277*** | 0.0173* | −0.0104* | 2,209 | 0.2438 |
| (0.0065) | (0.0098) | (0.0059) | |||
| Client financial literacy_high | 0.0245*** | 0.0199** | −0.0046 | 2,209 | 0.2513 |
| (0.0073) | (0.0083) | (0.0092) | |||
| Client risk capacity_high | 0.0194** | 0.0219*** | 0.0025 | 2,209 | 0.2432 |
| (0.0092) | (0.0075) | (0.0072) | |||
| Finance-sector job | 0.0170*** | −0.0394 | −0.0564 | 2,209 | 0.2473 |
| (0.0066) | (0.0382) | (0.0366) | |||
| Length of bank relationship_high | 0.0343*** | 0.0102 | −0.0241** | 2,209 | 0.2476 |
| (0.0101) | (0.0141) | (0.0105) | |||
| Sum of recommendations_high | 0.0222*** | 0.0218*** | −0.0004 | 2,209 | 0.2407 |
| (0.0085) | (0.0096) | (0.0135) | |||
| Percentage of buy recommendations_high | 0.0241*** | 0.0202** | −0.0039 | 2,209 | 0.2476 |
| (0.0085) | (0.0102) | (0.0089) | |||
| Duration of meeting_high | 0.0189** | 0.0258*** | 0.0069 | 2,209 | 0.2393 |
| (0.0091) | (0.0088) | (0.0073) | |||
Thus, for the first indicator variable Client male, for example, |$\beta _{1}$| reports the effect of an additional similarity between client |$j$| and advisor |$k$| along the four homophily dimensions, as measured by Number of homophilous ties, on her likelihood of following her advisors’ recommendations in meeting |$i$| (LOF) for the group of female clients (i.e., Client male|$= 0), \beta _{1}+\beta _{3}$| reports the effect of Number of homophilous ties for the subsample of male clients, and |$\beta _{3}$| shows the difference in the reported effects for male and female clients, respectively. All metric variables are dichotomized via median splits. The variable suffix _high denotes above-median values of observations for a given variable. To gauge the statistical significance of the estimated coefficients pertaining to (|$\beta _{1} +\beta _{3})$|, each regression is rerun with rescaled values. All specifications are estimated with robust standard errors and include client characteristics and meeting controls as well as advisor and time fixed effects. ***, **, and * indicate statistical significance at the 1%, 5%, and 10% levels, respectively.
The analysis produces four major results. First, we find that the positive impact of homophily on advisees’ likelihood of following continues to be statistically and economically important for virtually all subgroups. This can be inferred from the magnitude and significance of |$\beta _{1}$| and |$\beta _{1}+\beta _{3}$|, respectively, which remain largely unchanged as compared to the coefficient of Number of homophilous ties in the baseline model in Table 3 (i.e., 2.2 pp, |$t = 2.90$|). Second, while the effect of homophilous ties somewhat decreases in magnitude and significance for the elder as well as for the group of financially wealthy clients, differences in effect size of homophily, as captured by |$\beta _{3}$|, are otherwise largely insignificant. Third, while financial literacy does not materially moderate the impact of homophily, the small group of clients who themselves work in the finance sector is not affected by homophilous ties. In fact, at |$-$|3.9 pp, the coefficient estimate of Number of homophilous ties is even negative for this subsample, though not statistically significantly so (|$t = -1.03$|). Fourth and finally, we find that homophily no longer influences the likelihood of following among the long-standing bank customers in any significant wa (1.0 pp, |$t = 0.72$|).
3.4 Initial versus follow-up meetings
Following up on the finding that the effect of our key explanatory variable washes out with increasing length of relationship with the bank, we investigate the role of interaction experience between client and advisor more thoroughly in this section. Specifically, we distinguish between initial and follow-up meetings and test for differences in the effect of Number of homophilous ties on clients’ likelihood of following advisor recommendations. To this end, we focus on the subgroup of new clients, that is, those clients for whom the first meeting recorded in our sample marks the initial personal contact with their advisor, and we track the impact of homophily for their initial versus follow-up meetings during our period under review.
Table 5 reports the corresponding results. Panel A provides descriptive evidence organized by number of meetings per client over the sample period. The 281 new clients schedule a total of 388 meetings, that is, similar to existing advisees, the majority of new clients also consults with their advisor only once during the sample period.
New clients: Initial versus follow-up meetings
| A. Descriptive evidence | |||||
|---|---|---|---|---|---|
| Meetings per client | 1 | 2 | 3 | 4 and more | All |
| N clients | 225 | 32 | 17 | 7 | 281 |
| N meetings | 225 | 64 | 51 | 48 | 388 |
| Number of homophilous ties | 1.7311 | 1.6848 | 1.8107 | 1.7012 | 1.7302 |
| LOF | |||||
| 1st meeting | 0.6578 | 0.7500 | 0.7647 | 0.8333 | 0.7088 |
| 2nd meeting | 0.7188 | 0.7059 | 0.9167 | 0.7730 | |
| 3rd meeting | 0.5294 | 0.9167 | 0.7172 | ||
| 4th meeting and rest | 1.0000 | 1.0000 | |||
| All | 0.6578 | 0.7344 | 0.6667 | 0.9167 | 0.7036 |
| B. Regression results | |||||
| Dependent variable | Dependent variable | ||||
| LOF | Follow-up meeting | ||||
| (1) | (2) | ||||
| Meetings of clients with | All meetings | ||||
| |$>1$| meeting (N=163) | (N=388) | ||||
| Number of homophilous ties | |$0.0189^{*}$| | |$-$|0.0052 | |||
| (0.0097) | (0.0166) | ||||
| Follow-up meeting | |$-$|0.0366 | ||||
| (0.0694) | |||||
| Number of homophilous ties | |$-$|0.0029 | ||||
| |$\times $| Follow-up meeting | (0.0053) | ||||
| Client characteristics | Yes | Yes | |||
| Meeting controls | Yes | Yes | |||
| Advisor FEs | Yes | Yes | |||
| Time FEs | Yes | Yes | |||
| N | 152 | 367 | |||
| R|$^{2}$| | 0.1466 | 0.1136 | |||
This table reports results of tests for differences in the effect of Number of homophilous ties on clients’ likelihood of following their advisors’ recommendations (LOF) in initial versus follow-up meetings for the subsample of new clients. Panel A provides averages of Number of homophilous ties and LOF organized by the number of meetings per client. Panel B reports coefficient estimates obtained from linear probability models as specified in Section 3.3. All specifications are estimated with robust standard errors and include client characteristics and meeting controls as well as advisor and time fixed effects. * indicates statistical significance at the 10% level.
First, we show that clients’ inclination to schedule (or give their consent to) follow-up meetings does not appear to be induced by a homophily effect. In fact, regardless of the number of advisory meetings, clients are largely indistinguishable as to their average number of homophilous ties with the advisor. Second, no clear pattern emerges for clients’ likelihood of following advice in follow-up meetings as compared to the initial meeting. While we observe a decline in LOF levels in repeat meetings of clients who consult their advisor twice (decrease in LOF from 0.7500 to 0.7188) and 3 times over the sample period (0.7647 to 0.7059 and further down to 0.5294), the respective numbers point to an opposite trend for clients who meet their advisors four or more times (increase in LOF to 0.9167 and further up to 1.000). Third, we document an increase in the likelihood of following from 65.8% for new clients for whom we record only one meeting to as much as 91.7% for new clients who consult with their advisor four or more times during the period under review. Again, however, this is not a monotonic trend because LOF levels of new clients with three meetings are virtually indistinguishable from those with only one meeting (0.6667 vs. 0.6578).
Panel B presents the corresponding regression results. Model specification 1 extends our baseline model by a binary variable indicating whether or not the respective observation constitutes a follow-up meeting and captures potential variation in the homophily effect for initial versus follow-up meetings via the interaction term Number of homophilous ties |$\times$| Follow-up meeting. To ensure that the indicator variable Follow-up meeting is not biased toward zero by the large fraction of clients without repeat meetings, we only include new clients with more than one meeting over the period under review. On the one hand, the results show that the number of homophilous ties remains statistically and economically significant (1.9 pp, |$t = 1.95$|) in explaining LOF levels once we distinguish between initial and follow-up meetings. On the other hand, neither of the two additional regressors features explanatory power. Specifically, clients do not display a different propensity to follow advisors’ recommendations in follow-up meetings as opposed to the initial meeting. Moreover, while the negative sign of the coefficient pertaining to the interaction term points to a slight decline in the effect size of homophily in follow-up meetings, the difference is insignificant too. Yet, because the subsample of new clients—which permits a distinction between initial and follow-up meetings—represents only 6.9% of all sampled meetings, we are careful not to overstate the insights provided by this additional analysis.
Finally, specification 2 reports coefficient estimates from a regression with Follow-up meeting as the dependent variable to test whether homophily predicts a higher chance of repeat meetings. However, confirming the descriptive evidence reported in Panel A, we reject this notion in the multivariate setting too.
3.5 Client-specific differences in advisor recommendations?
Next, we discuss the possibility that the advice under review varies across clients even within an advisor and that this variation in advice—rather than homophily between client and advisor—in fact represents the determining factor in client decisions as to whether or not to follow the advice. Prior research suggests that advisors treat clients differently based on their demographics. Bucher-Koenen and Koenen (2015) provide evidence that advisors perceive female clients to be less capable in financial matters. Likewise, Roszkowski, Davey, and Grable (2005) document that advisors overestimate the risk tolerance of male customers and underestimate the risk tolerance of female customers. Moreover, Söderberg (2012) finds that advisors assess their customers differently depending on their own gender. Finally, Foerster et al. (2017) and Linnainmaa, Melzer, and Previtero (2016) recently observe that advisors’ own asset allocation strongly predicts the allocations chosen on clients’ behalf. Thus, while the standardized financial advice of the bank exclusively focuses on client risk capacity, liquid assets, and investment horizon, we nevertheless address the conjecture that advisors give poor advice to clients who are dissimilar with regard to the homophily dimensions. Clearly, clients might then have good reason to ignore the corresponding recommendations. By the same token, individuals with similar demographics are generally more likely to interact. Being in the same age bracket, for instance, increases the likelihood of raising children and meeting in kindergarten or at school, while the same gender increases the likelihood of having the same workplace and being a member of the same club or society (see Section 2.3.2). Thus, demographic similarity increases the possibility of acquaintance and—assuming that advisors have a benevolent attitude toward clients they have known before and, for example, guide them toward low-fee products—similar clients might on average receive better advice and therefore have good reason to heed it. If so, our results might simply reflect the fact that advice varies from client to client as a function of the variables which go into constructing our homophily measure.
To this end, we inspect the security-specific recommendations given in the sampled advisory meetings and dissect them by the number of homophilous ties between client and advisor. Table 6 reports the corresponding results. In the vein of Hackethal et al. (2016), we first characterize advisor recommendations based on recommended asset allocation and, in case of mutual fund recommendations, fees. Moreover, we consider the fund’s rating and the appropriateness of its risk category as additional dimensions to qualify the mutual fund recommendations under review. Note that, unlike Hackethal et al. (2016), we lack information on clients’ portfolio structure prior to receiving advice. Because advisor recommendations naturally take into account clients’ existing investments, we focus on the subgroup of new clients, that is, advisees without a securities portfolio at the bank on the day of their first advisory meeting during our period under review.24 In doing so, we ensure that the comparability of the reported figures is not confounded by, for example, advisor efforts to correct major discrepancies between clients’ holdings and their risk capacity.
Recommendation properties by values of Number of homophilous ties
| All | Values of Number of homophilous ties | A: | B: | Diff. | ||||||
|---|---|---|---|---|---|---|---|---|---|---|
| 0 | 1 | 2 | 3 | 4 | Mean(0 + 1) | Mean(3 + 4) | B - A | |$t$|-stat. | ||
| N | 388 | 35 | 117 | 156 | 67 | 13 | ||||
| Total recommendations (EUR) | 22,331 | 20,656 | 21,181 | 24,843 | 19,197 | 23,586 | 21,060 | 19,910 | |$-$|1,150 | −0.64 |
| A: Asset allocation | ||||||||||
| % Mutual funds | 71.89 | 74.24 | 71.32 | 71.08 | 73.50 | 72.35 | 71.99 | 73.31 | 1.32 | 0.30 |
| Equity | 7.63 | 6.72 | 8.11 | 7.58 | 7.38 | 7.70 | 7.79 | 7.44 | −0.35 | −0.44 |
| Domestic | 0.99 | 1.00 | 0.80 | 1.15 | 0.93 | 1.07 | 0.85 | 0.95 | 0.11 | 0.18 |
| Europe | 1.12 | 1.43 | 1.16 | 0.97 | 1.11 | 1.84 | 1.22 | 1.23 | 0.01 | 0.03 |
| World | 5.14 | 3.98 | 5.45 | 5.27 | 4.92 | 4.79 | 5.72 | 5.25 | −0.47 | −0.56 |
| Other | 0.39 | 0.31 | 0.70 | 0.19 | 0.42 | 0.00 | 0.61 | 0.36 | 0.25 | 1.44 |
| Balanced | 44.43 | 44.02 | 45.83 | 42.48 | 46.64 | 44.82 | 45.41 | 46.34 | 0.93 | 0.20 |
| Bond | 0.66 | 2.33 | 0.54 | 0.60 | 0.25 | 0.00 | 0.95 | 0.21 | −0.74* | −1.70 |
| Money market | 2.86 | 2.99 | 2.15 | 3.45 | 2.74 | 2.53 | 2.34 | 2.71 | 0.37 | 0.29 |
| Real estate | 16.31 | 18.19 | 14.70 | 16.97 | 16.48 | 17.30 | 15.50 | 16.61 | 1.11 | 0.88 |
| % Corporate bonds | 24.90 | 23.23 | 23.68 | 26.54 | 24.64 | 21.41 | 23.58 | 24.12 | 0.54 | 0.17 |
| % Reverse convertible bonds | 1.16 | 0.77 | 1.50 | 1.11 | 0.77 | 1.96 | 1.33 | 0.97 | −0.36 | 0.92 |
| % Stocks | 0.19 | 0.00 | 0.00 | 0.00 | 1.10 | 0.00 | 0.00 | 0.92 | 0.92 | 0.57 |
| % Other | 1.86 | 1.76 | 3.50 | 1.27 | 0.00 | 4.28 | 3.10 | 0.70 | −2.40 | 1.53 |
| B: Mutual fund recommendations | ||||||||||
| Fees (TER in %) | ||||||||||
| Equity | 1.360 | 1.403 | 1.358 | 1.339 | 1.345 | 1.338 | 1.368 | 1.345 | −0.023 | −0.35 |
| Balanced | 1.098 | 1.063 | 1.084 | 1.112 | 1.117 | 1.178 | 1.079 | 1.125 | 0.046* | −1.84 |
| Bond | 1.203 | 1.235 | 1.212 | 1.086 | 1.080 | n.a. | 1.214 | 1.080 | −0.134 | 1.01 |
| Money market | 0.403 | 0.308 | 0.415 | 0.418 | 0.440 | 0.406 | 0.372 | 0.427 | 0.055* | −1.86 |
| Real estate | 0.727 | 0.729 | 0.733 | 0.730 | 0.712 | 0.737 | 0.732 | 0.713 | −0.019 | 1.26 |
| Risk | ||||||||||
| KIID fund risk category (1-7) | 3.361 | 3.158 | 3.481 | 3.463 | 3.106 | 3.000 | 3.407 | 3.089 | −0.318 | 1.63 |
| KIID fund risk category (1-5) | 2.443 | 2.308 | 2.490 | 2.525 | 2.250 | 2.550 | 2.448 | 2.299 | −0.149 | 0.95 |
| Client risk capacity (1-5) | 2.634 | 2.615 | 2.583 | 2.637 | 2.638 | 3.100 | 2.591 | 2.713 | 0.122 | −1.07 |
| Diff. (1-5) | −0.190 | −0.308 | −0.094 | −0.112 | −0.388 | −0.550 | −0.143 | −0.414 | −0.271 | 1.50 |
| Rating | ||||||||||
| Morningstar | 3.233 | 3.206 | 3.190 | 3.228 | 3.325 | 3.308 | 3.193 | 3.322 | −0.129 | −1.458 |
This table reports various properties of advisor recommendations for the subsample of new clients and organized by values of Number of homophilous ties. Panel A shows an asset classification of all recommendations; Panel B focuses on recommendations pertaining to mutual fund investments. Fees documents averages of funds’ total expense ratios (TERs). Risk reports funds’ KIID-based risk category as compared to clients’ risk capacity as elicited in the KYC process. Rating reports averages of funds’ ratings issued by Morningstar. * indicates statistical significance at the 10% level.
We find no significant differences in recommended asset classes. Moreover, the recommendations pertaining to mutual fund investments, which make up as much as 71.9% of the average 22,331 EUR in total recommendations per meeting, are also largely invariant in terms of (a) fees as captured by TERs, (b) rating, and (c) risk adequacy as measured by the difference between the fund’s KIID-based risk category and the client’s risk capacity elicited in the KYC process.25 We conclude that, regardless of the number of homophilous ties between client and advisor, advisor recommendations in our sample are remarkably similar and thus rule out the notion that variation in advice explains clients’ LOF levels.
3.6 Individual homophily dimensions and client gender
Evidence from the organizational behavior literature indicates that both men and women prefer to consult with men when acquiring information related to more distant domains (Aldrich 1989, Bernard et al. 1988). Given that financial advisory services typically involve substantial information asymmetry between client and advisor, this implies that gender homophily may be limited to male clients. Likewise, Brashears (2008) finds that women regard fellows at the highest and lowest end of the age distribution as less dissimilar than men of the same age. This would suggest a higher perceived social distance of male clients toward advisors outside their age brackets and thus a greater relative importance of age homophily for them.
We address these conjectures by testing for gender differences in the impact of homophily on gender and age. To this end, we interact each of the four homophily dimensions with client gender.
Table 7 reports the results. The corresponding estimation is specified analogously to the generic linear probability model formalized in Equation (2) and results are laid out following Table 4. Thus, in the first line, for example, |$\beta _{1}$| denotes the effect of Same gender on LOF for the group of female clients (i.e., Client male|$= 0), \beta _{1}+\beta _{3}$| shows the respective impact for male clients, and |$\beta _{3}$| provides the difference in reported effects for male and female clients.26
Homophily dimensions by client gender
| Dependent variable LOF | ||||||
|---|---|---|---|---|---|---|
| Female clients | Male clients | Diff. in client | Advisor | |||
| Homophily dimension | (|$\beta_{1})$| | (|$\beta _{1} +\beta _{3})$| | gender (|$\beta _{3})$| | FEs | N | R|$^{2}$| |
| Same gender | −0.0108 | 0.0388*** | 0.0496*** | No | 2,209 | 0.1819 |
| (0.0193) | (0.0105) | (0.0121) | ||||
| Same age | 0.0035 | 0.0160*** | 0.0125*** | Yes | 2,209 | 0.2503 |
| (0.0192) | (0.0049) | (0.0035) | ||||
| Same marital status | 0.0627** | 0.0311 | −0.0316* | Yes | 2,209 | 0.2433 |
| (0.0299) | (0.0391) | (0.0175) | ||||
| Same parental status | 0.0182* | 0.0021 | −0.0161 | Yes | 2,209 | 0.2175 |
| (0.0096) | (0.0146) | (0.0184) | ||||
In the first row, for example, |$\beta _{1}$| reports the effect of the homophily dimension Same gender on client |$j$|’s likelihood of following advisor |$k$|’s recommendations in meeting |$i$| (LOF) for the group of female clients (i.e. Client male = 0), |$\beta _{1}+\beta _{3}$| reports the effect of Same gender for the subsample of male clients, and |$\beta _{3}$| shows the difference in the reported effects for male and female clients, respectively. To gauge the statistical significance of the estimated coefficients pertaining to (|$\beta _{1} $|+ |$\beta _{3})$|, each regression is rerun with rescaled values. All specifications are estimated with robust standard errors and include client characteristics and meeting controls as well as time fixed effects. ***, **, and * indicate statistical significance at the 1%, 5%, and 10% levels, respectively.
Recall from Section 3.3 that we did not observe any material gender differences when it comes to the impact of the number of homophilous ties on male versus female advisees’ likelihood to follow the investment advice they receive. Once we consider the different homophily dimensions independently, however, we indeed document strong evidence in support of gender differences. First, while the effect of gender homophily continues to be highly significant for male clients in our sample, it disappears for the group of female advisees. On average, LOF levels for male clients who consult with a male advisor are as much as 5.0 pp (|$t = 4.10$|) higher than for the complementary group of cross-sex advisory meetings. On the contrary, the effect of gender homophily on LOF levels is negative for the group of female advisees (though not statistically significantly so). This pattern is consistent with the notion that gender homophily plays a role for male clients while it is immaterial for interactions among women in our sample.
Second, we test for gender differences with respect to the impact of age homophily on clients’ propensity to follow investment advice. Again, supporting the conjecture that male clients perceive the social distance toward advisors outside their age brackets as higher, the effect of age homophily reported in fact more than doubles in magnitude and proves statistically significant for male advisees (1.6 pp; |$t = 3.27$|). At the same time, however, Same age loses its explanatory power among the group of female clients under review, suggesting that age homophily has no significant impact on women’s propensity to follow advice.
Third and finally, we estimate gender-specific regressions for the two remaining homophily dimensions Same marital status and Same parental status, which we use to capture social status, and uncover another interesting pattern of gender differences regarding the role of homophily for clients’ likelihood of following investment advice. Female advisees appear to exhibit homophilous behavior on marital status (6.3 pp; |$t = 2.10$|) and, to a lesser extent, on sameness in terms of whether or not children are currently living in the household (1.8 pp; |$t = 1.90$|), while we do not find any measurable impact of these two demographic dimensions among male clients.
Thus, for male clients, the increased propensity to follow the investment advice received from advisors with which they share more similarities appears to stem from homophily on gender and age. For the group of female advisees, by contrast, the positive impact of homophilous ties on the likelihood of following seems to be induced by sameness in marital and parental status.
3.7 Further analyses
3.7.1 Client-advisor assignment revisited
Next, we look into whether our findings are driven by pooling different types of meetings. As described in Section 1.1, each client is grouped into one of the three investment advisory offers of the bank (basic investment advice, advanced investment advice, private banking) which determine the possible range of advisors she can be assigned to. Within either of the advisory segments, clients are then randomly matched with advisors. To investigate whether our results may be distorted by imperfect random assignment, we compare the actual percentage of same-status client-advisor pairs with the predicted probabilities we obtain when constructing random client-advisor pairings. Specifically, we take the observed percentages of the respective client and advisor characteristics to calculate the theoretical probabilities for the characteristics gender as well as marital and parental status. To obtain a benchmark probability for Same age, we simulate 100,000 random pairings, record the age bracket of client and advisor, respectively, and calculate the percentage of matchings with client and advisor in the same age bracket. We run this simulation a total of 50 times and infer the predicted probability of same-age client-advisor pairings as the average percentage of same-age matchings across all replications.
Table A.3 reports the corresponding results organized by homophily dimension and advisory segment. First, we document that across all advisory segments (‘All’), the difference between predicted and actual probability of same-status client-advisor pairings is immaterial for all homophily dimensions except parental status, for which it is weakly significant. Yet, at 2.4 percentage points, the difference here is rather small too. Second, we do not find significant differences between actual and predicted probabilities of same-status matchings within any of the three advisory segments, either. A higher percentage of same-gender pairings in private banking and a smaller proportion of clients and advisors sharing the same parental status in basic investment advice—albeit both are only borderline statistically significant—mark the two minor exceptions to this pattern. Thus, we corroborate related evidence provided in (Hackethal et al., 2016, p. 3), who state that “[r]egarding the impact of the match between clients and advisors, we do not find much evidence that the bank systematically assigns clients to advisors based on demographic characteristics,” and conclude that the client-advisor matching process may be regarded as random in our setting.
3.7.2 Alternative measurement of key explanatory variable
Moreover, we examine whether our main results are robust to altering the specification of our key explanatory variable Number of homophilous ties. In fact, one of the four homophily dimensions, Same parental status, is different from the other demographics in that it cannot be readily observed during the interaction.27 While we can reasonably assume that the advisor knows about the client’s parental status, it is at the advisor’s discretion to disclose her own status to the client. Because she may choose not to do so, we cannot differentiate between the information set with respect to advisor characteristics of (a) clients similar to their advisor along the three dimensions age, gender, and marital status and (b) clients with commonalities across all four demographics but managed by an advisor who would not share her parental status in the course of, for example, schmoozing during the in-person meeting (cf. Gennaioli, Shleifer, and Vishny, 2015). Thus, we rerun our baseline regression model using an alternative measure of social proximity, Number of homophilous ties_3 constructed from the three mutually observable demographics, that is, omitting Same parental status.
Panel A of Table A.4 reports the coefficient estimate assigned to our modified key explanatory variable and documents that, after including all regressors entering the baseline model, the effect of Number of homophilous ties_3 on clients’ likelihood to heed advisors’ recommendations slightly increases to 2.5 pp (|$t = 3.33$|). Put differently, we still show an economically meaningful difference in LOF levels attributable to homophily of as much as 7.6 pp once we compare interactions between clients and advisors exhibiting the highest versus lowest number of mutually observable similarities.
3.7.3 Alternative measurement concepts of dependent variable
Finally, we test whether our findings are robust to choosing alternative measures of the dependent variable, that is, clients’ propensity to follow the investment advice. Panel B of Table A.4 reports the relevant coefficients using the ROF and the DOF, as defined in Section 2.2, and corroborates the positive and significant effect of social proximity between client and advisor on clients’ likelihood of following. Specifically, while the magnitude of Number of homophilous ties slightly decreases when applying the two alternative measurement concepts, the overall effect still proves (highly) statistically significant and economically relevant.
4. Discussion and Concluding Remarks
4.1 Discussion of key results
In this study, we document a positive relationship between the number of demographic similarities between client and advisor and the propensity to follow advice. Controlling for a number of previously identified determinants of advice taking, we observe an economically significant difference of 8.8 pp in clients’ LOF when we compare interactions between clients and advisors exhibiting the highest versus lowest number of similarities across the four demographic characteristics: age, gender, marital status, and parental status. We test several possible explanations for the observed link between demographic commonalities and LOF levels and find it difficult to square with plausible scenarios, such as clients and advisors who are also acquaintances or the conjecture that advisors give poor advice to clients who are demographically dissimilar.28 Instead, our results point to an impact of homophily—a powerful principle that governs who individuals regard to be their relevant others and those whose opinions they attend to—on clients’ decision as to whether or not to follow advisors’ recommendations.
While LOF levels increase in the number of homophilous ties for male and female advisees alike, we observe substantial gender differences in the relative importance of the different homophily dimensions for clients’ propensity to follow advice. Specifically, for male clients, the increased likelihood of following the recommendations of advisors with whom they share more demographic characteristics appears to stem from salient similarities, that is, homophily on gender and age. These results confirm the significance of two homophilous patterns documented in the general literature on advice taking in the context of financial advice. Regarding gender homophily, Aldrich (1989) and Bernard et al. (1988) show that both men and women prefer to consult with men when acquiring complex information. Similarly, Brashears (2008) observes a higher perceived social distance of male clients toward advisors outside their age brackets and thus a greater relative importance of age homophily for them. By contrast, the positive impact of homophily on the propensity to follow advice seems to be induced by non-salient similarities regarding the marital and parental status for the group of female advisees. By differentiating between status homophily (similarity based on ascribed status) and value homophily (based on values, attitudes, beliefs), Lazarsfeld and Merton (1954) provide a possible interpretation of the observed gender differences. Specifically, to the extent that commonalities in terms of marital status and whether or not children are being raised in the household may be interpreted as proxies to pin down value homophily as opposed to status homophily (captured by the demographics gender and age), our results point to status homophily being the driver behind homophilous behavior among male clients, whereas value homophily seems to be the determining factor among female clients.
Moreover, we find that the likelihood of following advice among clients who themselves are employed in the finance sector is not affected by homophilous ties with the clients’ advisors. This result suggests that the homophily effect in financial advice is limited to settings in which there is a considerable knowledge gap between client and advisor when it comes to assessing the content of the advice. Hence, our findings contribute to recent evidence suggesting that advisees resort to decision heuristics based on how they perceive the communication style of their financial advisors (rather than considering the features of the recommended products) whenever the counseling setting involves substantial information asymmetry (Agnew et al. 2018; Anagol, Sarkar, and Cole 2017; Monti et al. 2014; Mullainathan, Noeth, and Schoar 2012).
Finally, the homophily effect is mitigated for the long-standing customers of the bank. This result suggests that homophilous behavior in the client-advisor relationship may at least partly be offset by familiarity and long-term experience gained with the bank with which the advisor is employed. While we do not find that interaction experience between client and advisor has a material impact on the effect size of homophily, we are careful not to overstate this result given the small size of the subsample of clients under review which permits a distinction between initial and follow-up meetings.
4.2 Implications
The market for financial advice and the job profiles of retail financial advisors have seen major changes in recent years. The most widespread form of investment guidance in the retail segment—bank advice—has become a highly standardized service, where product recommendations are generated automatically rather than hand-picked by the advisor (cf. Section 1.1). Coupled with the advent of digital wealth management (“robo-advice”), much of the value proposition of human advice now lies in communicating the individual benefit of a given product selection to the client. In doing so, targeted client-advisor pairings could help facilitating the transmission of information by harnessing the effect that individuals matched on homophilous ties benefit from better mutual understanding. By the same token, individuals might perceive robo-advice as impersonal or inadequately customized to their preferences, because they do not share any common characteristics with the computer algorithm. As a consequence, they could be less likely to follow the recommendations of robo-advisors as compared to those of human advisors.29 Supporting this conjecture, Deutsche Bank’s decision to call its robo-advisor “Robin”—thereby following previous examples of naming technology to humanize it (e.g., Apple’s “Siri” and Amazon’s “Alexa”)—may be regarded as an attempt to at least partially overcome this drawback of robo-advice as opposed to human financial advice.
On the other hand, however, the fact that homophily helps fostering interpersonal trust formation independent of fundamentals may be exploited by opportunistic advisors. Gennaioli, Shleifer, and Vishny (2015) present a model in which trusted advisors do not correct investors’ errors but instead have a strong incentive to cater to their biased beliefs. This prediction is supported in Mullainathan, Noeth, and Schoar (2012) and Anagol, Sarkar, and Cole (2017) and by the experimental results of Agnew et al. (2018), who demonstrate that a client’s perception of her advisor’s ability can be manipulated by using a simple strategy in which confirming the client’s preexisting view on an easy topic builds trust in the advisor that subsequently persists regardless of the quality of future advice. Moreover, instances of negligent investment advice are frequent: Egan, Matvos, and Seru (forthcoming) only recently document that over 7% of financial advisors in the United States have misconduct records.
Thus, despite regulatory efforts to fix supply-side issues in the market for financial advice, we conclude that the implications of homophily greatly depend on whether or not advisors act in the interests of their clients. While client-advisor matching on homophilous dimensions can help increase the effectiveness of actions taken to implement good financial advice, it also carries the risk of being abused by opportunistic advisors as a means to exploit vulnerable clients to an even greater extent.
We would like to thank an anonymous bank and all its employees for providing the data. We are grateful to Philip Strahan (the editor), two anonymous referees, Florian Hett, Peter Limbach, Peter Winker, and participants at the International Finance and Banking Society (IFABS) 2017 Oxford Conference and the European Financial Management Association (EFMA) 2017 Meetings for their helpful comments. Finally, we thank Thomas Pauls for his research assistance with the PHF data.
Footnotes
Empirical evidence suggests that most individuals lack the knowledge to make informed financial decisions (see Lusardi and Mitchell (2014) and Stolper and Walter (2017) for recent surveys of the literature). Besides, efforts to educate inexperienced individuals have proven largely ineffective (cf., e.g., Fernandes, Lynch, Jr, and Netemeyer 2014 for a review). Hence, advice taking is pervasive: 81% of all German households report the financial advisor at their house bank is the single source of information when they seek consultation on financial matters (DSGV 2014). Likewise, 80% of consumers in the European Union (Chater, Huck, and Inderst 2010) and 75% of individuals in the United States (Hung and Yoong 2013) turn to a personal advisor for their investment decisions.
See McPherson, Smith-Lovin, and Cook (2001) for a review of the voluminous literature on homophily.
For instance, the Markets in Financial Instruments Directive (MiFID II) now requires banks in the European Union to ask their clients for their prior investment experience and risk capacity before advising them on risky financial products. Additionally, banks are obliged to provide advisees with product information sheets disclosing arguably decision-relevant characteristics of financial products. Finally, advisors must prepare a detailed transcript of each meeting that includes the key outcomes and has been authorized by the advisee. Similarly, regulatory authorities in the Netherlands and in the United Kingdom have recently enforced a new legislation prohibiting commissions for brokers and advisors altogether.
Although some studies document a positive impact of customer-employee matching on sales performance (e.g., Richard et al. 2017), others find no effect (e.g., Ayres and Siegelman 1995; Leonard, Levine, and Joshi 2004) or even show that it negatively influences profitability (e.g., Dwyer, Richard, and Shepherd 1998).
For a recent review of the institutional and regulatory background with respect to bank financial advice in Germany, see Hackethal et al. (2016, section I.A).
17 clients in our original data changed advisors during the period under review. Upon request, the bank gave several reasons for advisor changes: advisor retirement or posting, client relocation, and substantial inheritances. We exclude clients who change advisors from our final sample.
See Section 3.7.1 for randomization tests regarding the client-advisor matching process.
The majority of self-directed retail investors executes their trades via the bank’s online brokerage platform. In 2016, online transactions without prior investment advice accounted for 29% to the bank’s overall retail trade volume.
Note, however, that the bank charges an annual account fee and transaction costs.
Remuneration at savings banks is governed by the German collective labor agreement for public service (TVöD), which only allows for bonus payments if a given institute has exceeded their aggregate targets at the bank level. If bank-level bonuses are distributed, each employee receives the same amount of money, regardless of their position within the organization.
Note that our data set does not include (a) clients without advisor interaction during the investigation period and (b) advisory meetings without corresponding investment recommendations.
Note that, for measurement reasons, we focus on those investment recommendations that clients are able to implement entirely during our period under review. Thus, from our sample, we omit all advisory meetings that include recommendations to periodically invest a fixed amount of money in savings schemes.
We apply several filters to the raw transaction data provided by the bank. Specifically, we merge split orders and drop order cancellations as well as all remaining transactions that do not result in a change in account balance.
See Pauls, Stolper, and Walter (2016) for a detailed description of the PHF data.
Several demographic characteristics have been shown to explain a significant proportion of the cross-sectional variation in people’s financial literacy levels. Our choice of explanatory demographics draws on robust findings in the literature. Specifically, we include age, gender, professional status, income, and wealth, all of which have been confirmed to be relevant predictors of individuals’ financial literacy levels (Bucher-Koenen and Lusardi 2011; Lusardi and Mitchell 2008). See Stolper (2018) for methodological details regarding the imputation approach, which follows Browning and Leth-Petersen (2003).
The disproportionately high fraction of buy recommendations can be explained by the fact that many customers of our bank consult with their advisor for investment advice, while they place their sell orders independently, that is, without involving their advisors.
Pairwise correlations of all client, advisor, and meeting characteristics are reported in Table A.2.
For a formal definition of the DOF, see the appendix. In Section 3.7.3, we analyze whether our choice of the dependent variable (i.e., LOF instead of ROF or DOF) affects our main results.
Alesina et al. (2002) provide comprehensive evidence of ethnic diversity for 180 countries of the world. Their “index of ethnic fractionalization” is computed as 1 minus a Herfindahl-Hirschman index of ethnolinguistic group shares and reflects the probability that two randomly selected individuals from a population belong to different groups. At 0.4901, the U.S. range just above the international mean of ethnic diversity (0.435), whereas Germany is among the least ethnically diverse countries (0.1682).
The Pew Research Center publishes an index of global religious diversity including more than 200 countries. Again, the 10-point index is a version of the Herfindahl-Hirschman Index and assigns countries to four ranks of religious diversity (“very high,” “high,” “moderate,” and “low”). Like the United States, Germany is among “(…) the countries with moderate religious diversity, where the largest religion usually accounts for 70-85% of the population, while the remainder of the population tends to belong to one other religion” (Pew Research Center 2014, p. 11). Note that the “other religion” represents the group of unaffiliated citizens in both the United States and Germany.
Note that homophily by marital status is different from homogamy, that is, the marriage between culturally and sociodemographically similar individuals (e.g., Kalmijn 1998).
Note that several client characteristics enter our baseline regression specification as input to the demographics-based financial literacy variable Client financial literacy and as input to Number of homophilous ties, which might lead to multicollinearity issues. Thus, we rerun all regressions but exclude Client financial literacy and find that our main results are virtually unaltered if we do not control for clients’ financial literacy levels. The corresponding analyses are available on request.
To gauge the statistical significance of coefiicients pertaining to |$\beta _{1}+\beta _{3}$|, we rerun each regression with rescaled values of the respective indicator variable.
We replicate the analysis reported in Table 6 for the full sample of clients and find our results largely unchanged. The corresponding tables are available on request.
German financial advisors are required by law to provide their clients with Key Investor Information Documents (KIIDs) issued by investment companies on the mutual funds they distribute. KIIDs feature a standardized classification of the fund’s risk profile on a scale from 1 to 7. To match the KIID risk categories with the scale used to elicit clients’ risk capacity during the KYC process (1 to 5), we rescale them accordingly.
Again, each regression is replicated with rescaled values of the respective indicator variable to gauge the statistical significance of coefficients pertaining to |$\beta _{1}+\beta _{3}$|.
While age and gender are salient personal attributes, wedding rings generally allow for the observability of an individual’s marital status. According to a representative survey, 70% of married individuals (women: 76%; men: 64%) wear their wedding ring at all times in West Germany, where our bank is headquartered (IfD 2007).
Yet another alternative explanation for our main result could be endogenous matching, that is, the notion that if clients are similar to their advisors, they will make decisions that resemble their advisors’ recommendations even if they do not communicate. If so, investment decisions of demographically similar clients might not reflect the following of advice, because they would have traded the recommended securities either way. However, given the large universe of investment opportunities, it is highly unlikely that the clients under review purchase the recommended securities just by luck. We thank an anonymous referee for bringing this alternative explanation to our attention.
We thank an anonymous referee for drawing our attention to this implication of homophily in the context of financial advice.
References
Appendix
Demographic characteristics of advised clients by bank type
| Bank type | Diff. | |||||||||||
|---|---|---|---|---|---|---|---|---|---|---|---|---|
| (1) | (2) | (2a) | (2b) | (2c) | (1)-(2) | (1)-(2a) | (1)-(2b) | (1)-(2c) | ||||
| Savings | Cooperative | Private | ||||||||||
| All | banks | Rest | banks | banks | Other | |||||||
| N | 968 | 475 | 493 | 267 | 187 | 39 | ||||||
| Variable | Measurement unit | % | 100 | 49.1 | 50.9 | 27.6 | 19.3 | 4.0 | ||||
| Client male | Dummy = 1 if client male | 0.5772 | 0.5453 | 0.5979 | 0.6159 | 0.5862 | 0.3882 | −0.0526 | −0.0706 | −0.0409 | 0.1571 | |
| Client age | Client age (years) | 51.89 | 49.44 | 53.73 | 54.39 | 52.18 | 62.32 | −4.281** | −4.950** | −2.739 | −12.88*** | |
| Client married | Dummy = 1 if client married | 0.5343 | 0.5193 | 0.5559 | 0.6169 | 0.4672 | 0.5727 | −0.0367 | −0.0977* | 0.0520 | −0.0534 | |
| Client German | Dummy = 1 if client German | 0.9602 | 0.9585 | 0.9604 | 0.9939 | 0.9114 | 0.9756 | −0.0019 | −0.0353* | 0.0472 | −0.0171 | |
| Client income | Client monthly net income(EUR) | 2,729 | 2,584 | 2,848 | 2,874 | 2,817 | 2,753 | |$-264^{*}$| | |$-290^{*}$| | |$-$|233 | |$-$|169 | |
| Client financial | Client financial assets(EUR) | 67,390 | 57,651 | 74,826 | 63,048 | 92,349 | 59,920 | |$-17,175^{*}$| | |$-$|5,397 | |$-34,698^{**}$| | −2,269 | |
| Client wealth | Client total assets(EUR) | 241,591 | 171,123 | 295,392 | 328,052 | 263,161 | 142,555 | |$-124,269^{***}$| | |$-156,929^{**}$| | |$-92,038^{**}$| | 28,568 | |
| Client financial literacy | Client financial literacy (0–3) | 2.548 | 2.562 | 2.532 | 2.495 | 2.556 | 2.576 | 0.029 | 0.067 | 0.006 | −0.014 | |
| Finance-sector job | Dummy = 1 if client works in finance sector | 0.0336 | 0.0330 | 0.0349 | 0.0362 | 0.0341 | 0.0186 | −0.0019 | −0.0032 | −0.0011 | 0.0145*** | |
This table uses data obtained from the first wave of the Panel on Household Finances (PHF) survey to compare average demographic characteristics of German bank advisees organized by bank type (N = 968 advised clients of savings banks, cooperative banks, private banks, and other banks, respectively). ***, **, and * indicate statistical significance at the 1%, 5%, and 10% levels, respectively.
Correlation matrix
| Number of | Client | Client | Finance- | ||||||||
|---|---|---|---|---|---|---|---|---|---|---|---|
| homophi- | Client | Client | Client | Client | Client | Client | financial | Client | risk | sector | |
| lous ties | male | age | married | parent | German | income | wealth | wealth | propensity | job | |
| Number of homophilous ties | 1.0000 | ||||||||||
| A. Clients | |||||||||||
| Client male | 0.2135* | 1.0000 | |||||||||
| Client age | −0.0326 | −0.1729* | 1.0000 | ||||||||
| Client married | 0.1487* | −0.0733 | 0.4301* | 1.0000 | |||||||
| Client parent | 0.1232* | 0.0790 | −0.1879* | 0.1548* | 1.0000 | ||||||
| Client German | −0.0017 | −0.0294 | −0.0130 | −0.0523 | −0.0086 | 1.0000 | |||||
| Client income | 0.0211 | 0.0235 | 0.1160* | 0.0725 | 0.0290 | 0.0276 | 1.0000 | ||||
| Client financial wealth | −0.0325 | −0.0033 | 0.2802* | 0.0971* | −0.0196 | −0.0200 | 0.0882* | 1.0000 | |||
| Client wealth | −0.0140 | 0.1617* | −0.2148* | −0.0447 | 0.1714* | 0.0434 | 0.2641* | 0.2447* | 1.0000 | ||
| Client risk propensity | 0.0226 | 0.2289* | −0.1322* | −0.0605 | 0.0209 | −0.0383 | 0.0690 | 0.2360* | 0.2081* | 1.0000 | |
| Finance-sector job | 0.0461 | 0.0090 | −0.0735 | −0.0373 | 0.0417 | 0.0178 | 0.0660 | −0.0326 | 0.0079 | 0.0599 | 1.0000 |
| Length of bank relationship | −0.0289 | −0.0420 | 0.2350* | 0.0711 | −0.0207 | 0.0470 | 0.0497 | 0.3479* | 0.1359* | 0.0976* | −0.0330 |
| B. Advisors | |||||||||||
| Advisor male | −0.0925* | 0.0798 | −0.0241 | 0.0367 | 0.0128 | 0.0135 | 0.0291 | 0.1191* | 0.1143* | 0.1562* | −0.0259 |
| Advisor age | 0.1645* | −0.1040* | 0.1692* | 0.0570 | 0.0021 | 0.0443 | 0.0159 | 0.0906* | −0.0841 | 0.0097 | −0.0244 |
| Advisor married | 0.1364* | 0.0180 | 0.0099 | −0.0004 | −0.0419 | −0.0258 | −0.0336 | −0.0564 | −0.0737 | 0.0153 | −0.0291 |
| Advisor parent | −0.4991* | 0.0268 | −0.0260 | −0.0102 | 0.0161 | −0.0063 | 0.0002 | 0.1000* | 0.1692* | 0.0791 | −0.0109 |
| Advisor German | 0.0514 | 0.0276 | 0.0227 | 0.0323 | 0.0093 | −0.0035 | 0.0030 | 0.0165 | 0.0004 | −0.0091 | −0.1960* |
| Number of clients | −0.1204* | 0.0636 | 0.0397 | 0.0815 | 0.0073 | 0.0472 | 0.0775 | 0.2391* | 0.2041* | 0.1221* | −0.0413 |
| Number of meetings | −0.1597* | 0.0390 | 0.0439 | 0.0843* | 0.0099 | 0.0344 | 0.0913* | 0.2819* | 0.2081* | 0.1287* | −0.0249 |
| C. Meetings | |||||||||||
| Sum of recommendations | 0.0173 | −0.0373 | 0.2264* | 0.0714 | −0.0232 | 0.0546 | 0.0685 | 0.2341* | 0.0607 | −0.0472 | −0.0589 |
| Percentage of buy recommendations | 0.0208 | −0.0387 | 0.0372 | 0.0031 | 0.0032 | −0.0018 | 0.0139 | 0.0219 | 0.0092 | −0.0781 | −0.0016 |
| Duration of meeting | 0.0430 | −0.0462 | −0.0149 | −0.0474 | −0.0370 | 0.0288 | −0.0147 | −0.1158* | −0.0352 | −0.0723 | 0.0235 |
| Percentage | ||||||||||||
|---|---|---|---|---|---|---|---|---|---|---|---|---|
| Length of | Sum of | of buy | Duration | |||||||||
| bank rela- | Advisor | Advisor | Advisor | Advisor | Advisor | Number of | Number of | recommen- | recommen- | of | ||
| tionship | male | age | married | parent | German | clients | meetings | dations | dations | meeting | ||
| Number of homophilous ties | ||||||||||||
| A. Clients | ||||||||||||
| Client male | ||||||||||||
| Client age | ||||||||||||
| Client married | ||||||||||||
| Client parent | ||||||||||||
| Client German | ||||||||||||
| Client income | ||||||||||||
| Client financial wealth | ||||||||||||
| Client wealth | ||||||||||||
| Client risk propensity | ||||||||||||
| Finance-sector job | ||||||||||||
| Length of bank relationship | 1.0000 | |||||||||||
| B. Advisors | ||||||||||||
| Advisor male | 0.0155 | 1.0000 | ||||||||||
| Advisor age | 0.0841 | −0.1650* | 1.0000 | |||||||||
| Advisor married | −0.0093 | 0.1153* | 0.0184 | 1.0000 | ||||||||
| Advisor parent | 0.0397 | 0.1663* | −0.2008* | −0.0800 | 1.0000 | |||||||
| Advisor German | 0.0219 | −0.0185 | 0.0242 | −0.0173 | −0.0295 | 1.0000 | ||||||
| Number of clients | 0.1688* | 0.3453* | −0.3802* | 0.0130 | 0.3005* | 0.0334 | 1.0000 | |||||
| Number of meetings | 0.1640* | 0.3574* | −0.3293* | −0.1066* | 0.3235* | 0.0264 | 0.9602* | 1.0000 | ||||
| C. Meetings | ||||||||||||
| Sum of recommendations | 0.1140* | 0.0590 | 0.0232 | 0.0883* | −0.0255 | 0.0221 | 0.1294* | 0.0789 | 1.0000 | |||
| Percentage of buy recommendations | −0.0345 | −0.0683 | 0.1318* | −0.0879* | −0.0247 | −0.0069 | −0.1498* | −0.1167* | −0.0842* | 1.0000 | ||
| Duration of meeting | −0.0923* | −0.1366* | 0.1770* | −0.0711 | −0.1473* | −0.0308 | −0.3461* | −0.3310* | 0.0758 | 0.0549 | 1.0000 | |
This table reports pairwise correlations between the key explanatory variable Number of homophilous ties and client, advisor, as well as meeting-specific variables included in the analysis. * indicates Bonferroni-adjusted statistical significance at the 1% level.
Client-advisor pairings
| Investment advisory service | Homophily dimension | Probability of same-status client-advisor pairings | |||||
|---|---|---|---|---|---|---|---|
| 5-8 | Variable | Share of value (%) | Predicted | Actual | Diff. | ||
| name | 0 | 1 | (%) | (%) | (pp.) | |$p$|-value | |
| A. Gender | |||||||
| All | Client male | 52.34 | 47.66 | 49.64 | 51.84 | −2.21 | 0.1120 |
| Advisor male | 42.25 | 57.75 | |||||
| Basic investment advice | Client male | 55.19 | 44.81 | 49.08 | 49.50 | −0.42 | 0.8228 |
| Advisor male | 41.18 | 58.82 | |||||
| Advanced investment advice | Client male | 47.07 | 52.93 | 50.86 | 54.01 | −3.15 | 0.1757 |
| Advisor male | 35.29 | 64.71 | |||||
| Private banking | Client male | 53.88 | 46.12 | 48.66 | 53.71 | −5.05* | 0.0869 |
| Advisor male | 32.73 | 67.27 | |||||
| B. Age | |||||||
| All | 19.44 | 20.03 | −0.59 | 0.5558 | |||
| Basic investment advice | 19.18 | 21.96 | −2.78 | 0.1181 | |||
| Advanced investment advice | 20.29 | 18.73 | 1.56 | 0.4824 | |||
| Private banking | 18.88 | 17.05 | 1.83 | 0.5859 | |||
| C. Marital status | |||||||
| All | Client married | 47.02 | 52.98 | 51.09 | 52.86 | −1.77 | 0.1889 |
| Advisor married | 31.74 | 68.26 | |||||
| Basic investment advice | Client married | 52.20 | 47.80 | 49.07 | 50.07 | −1.00 | 0.6487 |
| Advisor married | 28.76 | 71.24 | |||||
| Advanced investment advice | Client married | 42.73 | 57.27 | 53.85 | 56.18 | −2.33 | 0.3151 |
| Advisor married | 23.53 | 76.47 | |||||
| Private banking | Client married | 33.79 | 66.21 | 56.19 | 56.62 | −0.43 | 0.8977 |
| Advisor married | 30.91 | 69.09 | |||||
| D. Parental status | |||||||
| All | Client parent | 89.52 | 10.48 | 62.54 | 60.09 | 2.45* | 0.0594 |
| Advisor parent | 65.87 | 34.13 | |||||
| Basic investment advice | Client parent | 90.90 | 9.10 | 63.64 | 60.17 | 3.47* | 0.0558 |
| Advisor parent | 66.67 | 33.33 | |||||
| Advanced investment advice | Client parent | 87.20 | 12.80 | 61.81 | 58.57 | 3.24 | 0.1520 |
| Advisor parent | 65.88 | 34.12 | |||||
| Private banking | Client parent | 90.87 | 9.13 | 62.63 | 58.90 | 3.73 | 0.2544 |
| Advisor parent | 65.45 | 34.55 | |||||
This table reports results from tests on the randomness of the client-advisor matching process presented in Section 3.7.1. The table is organized by the three investment advisory services the bank under review offers (basic and advanced investment advice as well as private banking). Predicted probabilities of same-status client-advisor pairings are either construct directly from observed percentages of the respective client and advisor characteristics (gender, marital status, parental status) or by a simulation of the matching process using observed values of the respective client and advisor characteristics (age). * indicates statistical significance at the 10% level.
Further analysis
| Dependent | Dependent | Dependent | |||
|---|---|---|---|---|---|
| variable | variable | variable | |||
| LOF | ROF | DOF | |||
| A. Alternative measurement of homophily | |||||
| Number of homophilous ties_3 | 0.0253*** | 2,209 | 0.2333 | ||
| (0.0076) | |||||
| B. Alternative measurement of propensity to follow | |||||
| Number of homophilous ties | 0.0179** | 2,354 | 0.2408 | ||
| (0.0073) | |||||
| Number of homophilous ties | 0.0207*** | 2,354 | 0.2361 | ||
| (0.0069) | |||||
This table shows results of several additional analyses presented in Sections 3.7.2 and 3.7.3. Panel A (Panel B) shows results for alternative concepts of measuring homophily (clients’ propensity to follow). All specifications are estimated with robust standard errors and include client characteristics and meeting controls as well as advisor and time fixed effects. ***, **, and * indicate statistical significance at the 1%, 5%, and 10% levels, respectively.
