


Abstract
In recent years, research policy has increasingly prioritized the societal impact of academic work, emphasizing external relevance, public value, and collective benefit. In many countries, a wealth of data has been generated by national assessments that require universities to submit narratives on their contributions outside the academy. Despite this, limited attention has been paid to variation in the expression of research value between countries with similar policy frameworks. This article draws on a mixed method analysis, integrating a quantitative embeddings approach and qualitative content analysis, to analyse a dataset of 7,275 impact case studies from the United Kingdom, Hong Kong and Australia. By examining ‘cultural repertoires’—the knowledge, skills, and symbols that inform action—the study reveals that, despite convergence in research policy and assessment, the expression of research value diverges significantly across countries. The findings highlight the nuanced connection between global policy trends and local cultural contexts, offering new insights into how research value is performed in diverse national settings.
1. Introduction
Research policy around the world has seen a substantial shift towards the principles of formal accountability, marketization, and competition (Oancea 2019). The rise of university managerialism and the concomitant expansion of performance-based assessment tools have created tension with strong traditions of academic and disciplinary autonomy (Oancea 2019; Capano and Jarvis 2020; Bandola-Gill, Flinders and Brans 2021). A key global policy change has been a focus on ensuring publicly funded research ostensibly aligns with the needs of society. Many countries have rushed to emulate policy pioneers in the adoption of research policies around societal ‘impact’ (hereafter, the ‘impact agenda’). Following the early decisions of the United Kingdom (UK) and Australia (AU) (Williams and Grant 2018), several countries now have national ex-post assessments of impact, including Poland, the Netherlands, Sweden, Italy, Spain, Norway, Finland, Hong Kong (HK), and New Zealand (Bandola-Gill, Flinders and Brans 2021). While there is substantial variation in design (e.g. importance of impact to the evaluation, method of assessment, and incentive structure), evaluating the wider benefit of research is now prominent around the world (Oancea 2019).
The effects of global pressures on research systems have been studied at international, national and institutional levels, with many noting the extension of research policy principles into organizational governance (Marginson 2008; Hazelkorn 2015; Espeland and Sauder 2016). Erkkilä and Piironen (2018, p. 37) describe a ‘global policy script on knowledge governance that is greatly linked to economic competitiveness and innovation’, which reshapes academic autonomy in ways that prioritize managerial and economic concerns. Much has been written about performance-based research assessment within national contexts, particularly in the UK (Watermeyer and Chubb 2018), and work has sought to theorize the characteristics that underpin the rise of the impact agenda (Oancea, Florez-Petour and Atkinson 2018; Bandola-Gill 2019). Despite this, theoretical work on transnational policy convergence around impact and in-depth comparative analyses are lacking. In addition, although the wealth of narrative data provided by the UK’s large-scale national assessment, the Research Excellence Framework (REF), has been enthusiastically analysed, there are very few empirical studies that analyse assessment data from multiple countries.
There are two notable exceptions. Zheng, Pee and Zhang (2021) undertook a topic modelling study of case studies from the UK’s REF2014 and high scoring case studies from AU’s Engagement and Impact (EI) 2018 across all units of assessment. The authors identified aspects of research impact (effort; attention; depth, length and breadth of use; improvement in efficiency, effectiveness and experience; recognition of new opportunities), although they did not focus on cross-national differences. Wroblewska (2019) conducted a comparative linguistic analysis of REF2014 and Norway’s 2017 Humeval evaluation in modern and classical languages, literatures and area studies. The author found differences in approaches to impact assessment as well as differences in the genre of narrative case studies, despite convergence in the definition of impact and case study template. This article seeks to build on these examples with a comparative analysis of the AU, HK and UK, using data from each country’s most recent impact assessment.
This study examines written impact submissions from three national contexts with similar research assessment models, as shown in Table 1. After various developments and pilots in the UK and internationally, the REF included a formal requirement around impact in 2014 and 2021 (Williams and Grant 2018).1 The most recent, REF2021, was a single assessment with three criteria, where impact accounted for 25% of the total score, with substantial funding flowing from the overall results. HK has modelled its research assessment on the UK’s for many years. Its 2020 Research Assessment Exercise (RAE) was a close copy of the REF2014, but with different weightings, where impact accounted for 15%. By contrast, AU’s similar model began as a precursor to the UK’s REF. Its initial assessment, developed in 2007 but abandoned with a change of government, later informed the UK’s approach (Williams and Grant 2018). In 2018, AU ran its inaugural Engagement and Impact Assessment (EI) as a standalone assessment (i.e. distinct from research output quality) that involved separate impact and engagement narratives. These three countries illustrate distinct patterns of international policy transfer. Scholars have noted the global influence of the UK’s assessment, which has shaped the development of similar systems worldwide (Sivertsen 2017). AU’s EI assessment and the UK’s REF exemplify a form of synergistic policy transfer, characterized by mutual learning and adaptation. In contrast, HK’s replication of the REF represents a more direct transfer, privileging Western traditions and norms over the development of a locally grounded assessment framework (Li and Li 2022). While the UK and HK continue to refine their assessment systems, AU has paused its assessment, although it is unlikely to abandon its focus on aligning research with societal needs (Williams and Grant 2018).
Research impact assessment across three countries.
| Australia | Hong Kong | United Kingdom | |
|---|---|---|---|
| Name | Engagement and Impact (EI) Assessment | Research Assessment Exercise (RAE) | Research Excellence Framework (REF) |
| Year | 2018 | 2020 | 2021 (+ earlier version in 2014) |
| Definition of impact | ‘The contribution that research has made to the economy, society, environment or culture, beyond the contribution to academic research’. | ‘The demonstrable contributions, beneficial effects, valuable changes or advantages that research qualitatively brings to the economy, society, culture, public policy or services, health, the environment or quality of life; and that are beyond academia’. | ‘An effect on, change or benefit to the economy, society, culture, public policy or services, health, the environment or quality of life, beyond academia’. |
| Purpose |
|
|
|
| Criteria |
|
|
|
| Submissions |
|
|
|
| Procedures | Assessments of submissions by committees of experts, who assign a score to each submission (using a scale of ‘high’, ‘medium’ or ‘low’). | Assessment of the submissions by expert panels, who assign a score to each submission (using a scale ranging from 4* to unclassified). | Assessment of the submissions by panels of experts, who assign a score to each submission (using a scale ranging from 4* to unclassified) |
| Mechanism | Reputation | Funding + reputation | Funding + reputation |
While the rapid spread of the impact agenda seemingly suggests a uniformity in national research policy, Capano and Jarvis (2020) caution against assuming similarities in trajectories or outcomes even where policy instruments appear analogous. Indeed, Pollitt (2001) sets out a range of areas where policies may converge or diverge, including rhetoric, reform decisions, actual practices, and results. Even where international pressures foster similarities in policy rhetoric, there can be important contradictions between countries in reform decisions and actual practices (King 2010), which both reflect and shape overarching cultural contexts. Indeed, as shown in Table 1, there are similarities in the rhetoric (and formal definitions) around impact as well as in the structure of the assessment models. Despite this, key areas of difference relate to stated purpose, which range from more strongly related to performance management in the UK and HK to less so in AU, and consequences of the evaluation, with financial and reputational implications in the UK and HK but solely reputational consequences in AU. Thus, it is useful to think about the three countries representing similar research impact policies that operate within different overarching cultural contexts.
This article addresses the central question: how is research value expressed in three countries with similar societal impact assessment policies? It does this by examining the underlying logics in narrative case studies submitted to the national research impact assessment in each country. The article makes three contributions to the literature. First, it highlights key differences in how societal impact is articulated and valued between countries. Second, it demonstrates a mixed method empirical approach to examining research value using publicly available data (UK, HK) as well as previously unavailable data (low scoring cases in AU) across three countries. Third, informed by cultural sociology and field theory, it offers a new perspective on research impact as a negotiated site of individual and organizational agency in the context of larger structural contexts. This paper argues that despite global convergence in research impact policies, national cultural contexts contain distinct repertoires of research value, which manifest in how impact is narrated and evaluated.
2. Cultural repertoires of research value
Despite convergence in research policy across countries, interpretations and outcomes of policy decisions are not uniform across contexts. Although intuitively understood as being measured against a priori standards, value is conferred rather than assessed (Bourdieu 1993). This is a social process influenced by cultural surroundings (Wright, Liebes and Katz 1992). Cultural repertoires are the sets of ‘knowledge, skills, and symbols’ that make up the collection of resources from which social actors can draw from in informing their actions (Swidler 1986). Actors here include individuals and organizations, referring to both researchers and universities. Applied to an evaluation context, these repertoires take the form of collections of pre-existing ‘valuating schemas applied in a variety of situations and ordering assessments on all kinds of matters’ that can be taken up in different ways for different purposes (Lamont and Thévenot 2000). While the rapid spread of the impact agenda seemingly suggests a uniformity in the available schemas, various environmental factors lead these to be interpreted and given meaning in a range of different ways by culturally diverse actors (Lamont 1992; Wright, Liebes and Katz 1992). Lamont and Thévenot (2000) give the example of ‘market’ versus ‘civil’ schemas the USA and France to illustrate the influence of national contexts on the narratives that are more or less readily available to individuals. The former involves forms of evaluation around market performance and industrial efficiency, while the latter involves civic equity and collectivism. This framing illuminates the extent to which the resources for acting and thinking are unevenly distributed across national contexts. Rather than implying cultural homogeneity, the focus on repertoires highlights the differential availability of these tools between intersecting categories (e.g. gender, race, class or age), which support and restrict patterns of thinking and action rather than prescribing them (Lamont et al. 2017). In the case of research assessment, there may be observable variations not only between nations but also between researchers operating within different disciplines or university contexts.
Cultural repertoires are woven into institutional environments where they come to set dominant principles and goals that guide behaviour (Tavory and Eliasoph 2013). For instance, institutions like national research assessments set the standard of the ideal researcher as one who strives to pursue strategic research directions important to the organization as well as to satisfy their own intrinsic motivation for research (Lewis 2014). Sub-national institutional logics also influence the salience of cultural schemas across relevant organizations and professions (Thornton, Ocasio and Lounsbury 2012). Social actors draw on the cultural toolkits made available at the national and sub-national levels to define their priorities and foresee the outcome of working towards them. In this way, they become an essential component in the dominant definition of success (Hall and Lamont 2009). At all levels, there has been a widespread shift from measuring research inputs (i.e. human, physical, and financial capital) to understanding research success by way of outputs, outcomes and impacts that benefit society (Keevers et al. 2012). For example, Reale et al. (2018) emphasize a focus on public research investment for improving measurable forms of ‘scientific competitiveness and excellence of the country, wealth creation, productivity, and social well-being’. As such, we expect to see coherence in the expressions of criteria around societal benefit contained in narrative case studies submitted to national assessments.
Yet, while national contexts are growing more in alignment around research impact, the susceptibility to global influence differs across countries. Zilberstein, Lamont and Sanchez (2023) draw attention to a lack of theoretical clarity around the extent to which actors take up diverse cultural elements from the broader cultural schema rather than creatively adopting whole repertoires. The authors argue that actors ‘participate in bottom-up processes of arranging and devising cultural repertoires that help them redefine success, make sense of their environment, and determine how to act’ (Zilberstein, Lamont and Sanchez 2023, p. 351). This article picks up this thread in considering how actors adopt or reject particular components made available by repertoires, thereby allowing for contradictions and inconsistencies within a looser collection of frames, narratives, and schemas. It examines the reproduction or rejection of cultural tools related to notions of success around the wider societal value of research, which are enabled and constrained to lesser and greater extent. While globalization tends to homogenize cultural repertoires (Hesmondhalgh and Pratt 2005), the degree of influence varies by factors such as openness to foreign ideas, national size, social fabric, policy framework, and cultural position (Janssen, Kuipers and Verboord 2008). There is thus considerable scope for a country to permit or reject particular evaluative principles from becoming dominant features of overall cultural repertoires.
3. Converging notions of success around valuable research
This paper is concerned with the cultural tools that are available around notions of research value, as elicited by research impact policies. It builds on the Bourdieusian notion of fields—as sites of struggle over symbolic resources—involved in the production of ‘valuable’ research. Williams (2020) argues that achieving ‘impact’ involves negotiating specific symbolic resources—‘capital’—from the scholarly field, the field of policy, the field of application, the media field, the economic field and potentially others. These fields each have an underlying logic and grant specific types of affordances. The scholarly field contains much of what is thought of when considering research practices, where doing good research relates to symbolic capital based on knowledge and recognition (Bourdieu 2004). Within the scholarly system, success is defined by internal rules set by other scholars. Judgements around achievement include using the correct methods and processes to produce knowledge (Bourdieu 2004). However, increasingly, researchers also operate in broader fields where more generic forms of capital dominate. This results in tensions between internal standards of scientific or scholarly quality and universities’ entrepreneurial drive to publicize and profit off research activities.
The scholarly system has thus now expanded to include other areas with distinct logics. These include the logic of the field of application, in which academic ideas, language and skills are translated into ways of doing things (i.e. improving processes and practices) in the real world; the logic of the field of policy and politics, in which ideas move from the academic realm to influence policymaking networks and actors to shift the policy agenda or political outcomes; the logic of the economic field, where academic ideas are commercialized or applied in ways that contribute to economic systems; and the logic of the media field, where scholarly outputs are made widely accessible towards public adoption of new knowledge and practices (Williams 2020). Each of these fields, and potentially others, make available specific types of power, which open forms of status and reputation that increasingly matter in university and research contexts. Previous work has explored these new forms of hybridity, where researchers work across multiple sectors and increasingly become invested in the logics of different sectors (Williams, Berman and Michalska 2023; Berman, Williams and Cohen 2025).
Importantly, the relationship between spheres is not uniform, much depends on the position within the academic field. In particular, disciplines vary in their autonomy from different fields. For example, the discipline of economics is much more engaged with the field of politics than linguistics. Similarly, universities vary in their appetite and ability to engage with different fields. For example, elite universities can potentially mobilize relevant policy or industry networks more easily. Indeed, while wider fields influence and interact with the academic sphere, academics are not fully beholden to them. For instance, media and politics are distinct fields with actors struggling with each other in a competitive space (Medvetz 2012). Within the media field, although academics may seek to generate public interest, they do not necessarily compete directly with journalists. Yet, to draw symbolic resources from the field, academics must adopt underlying field logics and participate in the stakes of ‘the game’ (Bourdieu 1993). In addition, the level of investment can vary, for example, academics can participate in multiple specific fields (e.g. domains of industry or levels of politics) or adopt a generic form of field logic by coopting the style or practices of other fields without meaningfully competing in them. For instance, an academic who seeks to influence applications in clinical practice is not in engaged in struggle with those trying to influence applications in an unrelated, non-clinical area, but does compete with other actors seeking to do the same within the same domain. Thus, this paper is interested in the broader logics provided by these five spheres, even where the field structures themselves may be distinct from one another. The notion that there are several key field logics of impact is also supported by empirical work. For example, Jensen, Wong and Reed (2022) found that 89% of research data-driven impact from a selection of high scoring REF2014 case studies of impact fell into the categories: practice impact (45%), government/policy impact/government spending or efficiency (21%), general public awareness impact (10%) and economic impact (13%).
This article explores how the descriptions of societal impact provided by narrative impact case studies differ across countries. It understands the narratives as performances framed by the structures and processes of the national assessment systems. By incorporating a quantitative word embedding approach and qualitative content analysis of impact case studies from the AU, HK and UK, the article considers convergence and divergence in the field logics underlying the ‘successful’ expression of research impact. In doing so, it aims to offer insights into distinct cultural repertoires. Thus, this article examines whether and how different social structures make some cultural patterns around research value more readily accessible than others (Lamont et al. 2017).
4. Method
This study uses a mixed method design. The quantitative component considers the vocabulary that is utilized to discuss certain field logics (e.g. ‘commercial’ or ‘commercialisation’ to indicate an orientation to economic activity), while the qualitative component considers the narrative description of the logics or mechanisms that underpin an impact claim (e.g. summaries of commercial licence agreements or generation of profits that indicate the occurrence of economic activity). It seeks to harness qualitative research strategies that highlight the interpretative nature of cultural patterns, while capitalizing on the comprehensiveness of quantitative research.
4.1 Data
This study analysed a total of 7,275 narrative impact submissions from three national research assessments. 6,361 REF2021 impact submissions were downloaded from the REF website.2 Each included five sections: summary of the impact; underpinning research; references to the research; details of the impact (indicative maximum 750 words); and sources to corroborate the impact. Universities were required to submit a minimum of two case studies for the smallest disciplinary areas, scaled by the number of full-time equivalent staff. 342 RAE2020 impact submissions were downloaded from the University Grants Committee website.3 Each included the same five sections as in the REF. Universities submitted a case study for each disciplinary area with at least three eligible academic staff, increasing if eligible academic staff exceeded 15. Data from 246 high scoring impact submissions were downloaded from the EI2018 website,4 while 326 medium and low scoring case studies were provided directly to the authors by the Australian Research Council. Each contained four primary elements: classification details (e.g. title, field of study, relevance to specified national priorities); description of impact (6,000 characters–∼900 words), institutional approach to impact; and optional additional impact indicator information. The engagement submission included an engagement narrative and engagement indicator data, which were not included for analysis.
4.2 Quantitative analysis
The quantitative component focused on measuring the salience of field logics (academic, policy, media, application, and economic; Williams 2020; Jensen, Wong and Reed 2022) in case studies across the three countries. We used a word embedding approach, a machine learning technique commonly applied in natural language processing tasks, which involves training on a corpus from a specific field to enhance text classification and extract deeper insights relevant to that domain.5 This approach can capture the meaning of a word by using its context, although care needs to be taken to ensure that outputs ‘correspond to the phenomena of interest’ (Isoaho, Gritsenko and Mäkelä 2021).
The summary and details of impact sections of all case studies were pre-processed to standardize text for analysis. Steps included removing stopwords, lowercasing, and stemming. Common terms across fields (e.g. ‘policy’ or ‘research’) were excluded. Each case study was also categorically labelled as either high or low scoring based on the scores provided by panels of experts. For UK and HK, assessment results were published as percentages indicating the distribution of a university’s submission across disciplinary groups into 4*, 3* (high-scoring), 2*, 1*, or ‘unclassified’ (low-scoring) categories. However, impact scores for individual case studies were not made publicly available. To identify high-scoring case studies, we categorized submissions as high-scoring if all a university’s submissions within a given disciplinary area received either 3* or 4* ratings. For AU, the complete database of individual case studies and their scores was available. Case studies rated as ‘high’ were categorized as high-scoring, while those rated as ‘medium’ or ‘low’ were categorized as low-scoring.
A Word2Vec Skip-Gram model (Mikolov et al. 2013) was trained on the combined dataset to identify vocabulary associated with each field logic (the embeddings projection is shown in Supplementary Fig. S1). This method captured contextual relationships between words, allowing for identification of terms indicative of specific field logics. Initial seed words for each field logic were provided by the lead author and used to generate expanded lists of related terms shown in Table 2.6
Initiating keywords.
| Field name | Logic | Keywords | N |
|---|---|---|---|
| Scholarly | scholarly & creative | academic, scholarly, creative, exhibition, art | 250 |
| Policy | policy, politics & law | policy*, policymaking, political, legal | 150 |
| Media | media & culture | media, news*, public, cultural | 150 |
| Application | processes & practices | application, application, practices | 150 |
| Economic | products & enterprise | economic, spinout, investment, revenue | 200 |
Not found in the embedding matrix due to removal of 10% most frequent words as part of pre-processing.
Subject-area experts (four members of the research team) reviewed the machine-generated word lists to refine lexicons for each field. Words were included if at least 75% of team members agreed they were relevant to a specific field logic. The final lexicons ranged from 40 to 50 terms per field, ensuring a balance between coverage and specificity. Inter-rater reliability scores exceeded 75% for all fields, with significant agreement (P < 0.01).7 The refined lexicons (provided in Supplementary Table S1) were then used to scan the narrative sections to calculate the proportion of field-related vocabulary in each case study.8 This provided a measure of the salience of each field logic in the narrative text. However, each list cannot perfectly capture the logic of the field, especially given the removal of common words such as ‘policy’ and ‘news’, which means some fields are likely to be substantially underrepresented. As such, this approach to analysis is better suited to highlighting differences between countries in the salience of logics (e.g. whether there is a stronger economic orientation in one country compared to another), rather than in highlighting differences between field logics within countries (e.g. whether there is a stronger economic or media orientation within one country).
4.3 Qualitative analysis
To complement the machine learning approach, a qualitative content analysis was conducted on a subset of 631 high-scoring case studies to examine how field logics were narrated in cases judged to be most ‘successful’ by evaluators. This number comprised the full set of 246 high scoring submissions from AU. From HK, the subset of 132 case studies identified as high scoring were included. For the UK, given the large number (3,139) of 3* and 4* case studies, the sample was stratified by university and disciplinary area leaving a subset of 253.
Content analysis involves the manual identification and categorization of meaning within a dataset (Boyatzis 1998). We used an abductive approach to coding, which balances a predetermined coding framework with the development of codes derived directly from the text (Linneberg and Korsgaard 2019). This allowed us to incorporate theoretical elements from earlier work as well as emergent themes arizing from the coding process (Graebner, Martin and Roundy 2012). Using the qualitative analysis software, Dedoose,9 the case study narratives were read closely by the primary coder, who assigned codes and subcodes to relevant excerpts. Following the work of Williams (2020), the deductive component of the coding process began with the following categories, as set out in Table 3. The scholarly field was excluded given the time-intensive nature of qualitative analysis and focus on extra-academic impacts. These were supplemented by a broader set of potential codes that described varying aspects of enacting societal benefit, which were added to and adjusted in response to the emerging themes. The primary coder and the project leader met for initial training and then regularly to discuss the features of the case studies and to modify the coding document accordingly.
Coding document representing four field logics.
| Policy | Media | Application | Economic |
|---|---|---|---|
| Advance policy debate | Advance media debate | Inform procedure, practice, or protocol | Commercial licences, new technology |
| Inform government policy | Change public attitudes, behaviours, or knowledge | Improve workflow | Generate profit/revenue or cost savings |
| Change policymakers’ attitudes, behaviours, or knowledge | Inform guidelines or strategy | Investment received from industry | |
| End to policy | Change practitioner’s attitudes, behaviours, or knowledge | Job generation | |
| End to procedure, practice, or protocol | Patent | ||
| Service or product in regular use | Spin out company/joint venture | ||
| Enabling innovation in Sector |
Given that each case study in the sub-sample was coded by the same person, the qualitative analysis provides insights into differences between field logics within countries (e.g. whether there is a stronger economic or media orientation within one country), not only differences between countries.
5. Results
5.1 Quantitative analysis
The results of the quantitative study show key differences between countries in the salience of field logics. Table 4 shows the percentage of words from each lexicon in the case studies from each country (e.g. an average case study from AU had 1.1% of words related to economic impact). Supplementary Table S2 provides the results of a multinomial logistic regression. Given the difficulties of comparing lexicons, these tables should be read down the columns (i.e. comparing countries), not across the columns (i.e. not comparing field logics).
Differences between countries in vocabulary related to each field logic.
| Country | Academic | Policy | Media | Application | Economic |
|---|---|---|---|---|---|
| AU (n = 572) | 0.72% | 0.50% | 0.55% | 0.95% | 1.10% |
| HK (n = 342) | 0.77% | 0.56% | 0.70% | 0.67% | 1.30% |
| UK (n = 6361) | 0.86% | 0.50% | 0.70% | 0.94% | 0.90% |
| Country | Academic | Policy | Media | Application | Economic |
|---|---|---|---|---|---|
| AU (n = 572) | 0.72% | 0.50% | 0.55% | 0.95% | 1.10% |
| HK (n = 342) | 0.77% | 0.56% | 0.70% | 0.67% | 1.30% |
| UK (n = 6361) | 0.86% | 0.50% | 0.70% | 0.94% | 0.90% |
There is no significant difference between the countries in terms of vocabulary relating to the academic field. While the prevalence of the policy field is consistent across the UK and AU, HK shows a statistically significant higher percentage of vocabulary related to this logic. The prevalence of the media field is consistent between the UK and HK, with a lower proportion in AU, although this is not significant. For the application field logic, AU and the UK are similar, while HK shows a significantly lower proportion of associated vocabulary. Interestingly, economic impact is more differentiated than the other fields, with the lowest prevalence in the UK, followed by AU, and the highest prevalence in HK, all statistically significant.
Further insight can be gained by investigating the differences between high and low scoring case studies, as shown in Table 5. This provides an understanding of not only how researchers articulate the value of their work, but what is judged to be worthwhile by expert evaluators. However, assessors’ ratings may also at least partially reflect broader institutional contexts or stylistic elements of the narratives (Williams et al. 2023). In AU, high scoring case studies tend to display stronger orientation to each field logic than low scoring case studies, except for the media field where there is a small difference in the opposite direction. This suggests that each field logic is a viable way to demonstrate impact, and potentially that including a greater number of instances of impact within a narrative is associated with ‘success’. HK displays the same pattern—high scoring cases displaying stronger field logic—for the academic, policy and media fields, while the reverse is true for application and economic fields. This might suggest that economic and practical usefulness are seen as safe or ‘close at hand’ for demonstrating impact, where the related vocabulary appears in case studies even where the narrative argument is not as compelling. Interestingly, in the UK, low scoring case studies are associated with slightly greater use of each field logic vocabulary, except for the field of application where there is a small difference in the opposite direction. This shows that in the UK there are a range of viable options for demonstrating impact. It may suggest that high scoring cases tend to ‘speak for themselves’, potentially opting for vocabulary that provides greater depth of examples rather than descriptions of impact mechanisms.
Differences between high and low scoring case studies in vocabulary related to each field logic.
| Score | Academic | Policy | Media | Application | Economic | |
|---|---|---|---|---|---|---|
| AU | High | 0.76% | 0.56% | 0.52% | 0.97% | 1.14% |
| Low | 0.69% | 0.47% | 0.57% | 0.94% | 1.06% | |
| HK | High | 0.86% | 0.60% | 0.78% | 0.61% | 1.24% |
| Low | 0.71% | 0.53% | 0.65% | 0.70% | 1.34% | |
| UK | High | 0.82% | 0.49% | 0.67% | 0.95% | 0.87% |
| Low | 0.90% | 0.51% | 0.72% | 0.92% | 0.94% |
The quantitative results suggest that there is national divergence in the salience of field logics despite convergence in research impact policy contexts. HK appears to value economic and policy influence to a greater extent than AU and the UK, and appears to value practical applications to a lesser extent. AU also displays a greater orientation to economic value than the UK. These national patterns also reflect subtle differences between those case studies that have been deemed successful in achieving research impact and those that were not. Together, this suggests that there are similarities in the availability of cultural repertories, but differences in how these are adopted and mobilized across countries.
5.2 Qualitative analysis
5.2.1 Cultural repertoires by country
A key finding from the qualitative analysis is that the logics of different fields are at play to varying degrees within case studies deemed to be valuable by evaluators in each country. Table 6 shows the percentage of high scoring case studies that were coded with at least one code relating to each field logic. Supplementary Table S3 provides the results of a logistic regression. For the policy field, AU and the UK are relatively even, with HK at a statistically significant distance. The media field is remarkably uniform across the three countries, with a slightly higher prevalence in the UK, but not significantly so. The field of application is strongest in the UK, weaker in AU, and significantly less so in Hong Kong. For the economic field, AU displays a significantly higher proportion than the UK and HK. This approach also illuminates within-country insights. In AU, nearly all high scoring impact cases studies were oriented to the application field and a majority were oriented to the economic field. Just over half were oriented to some kind of policy mechanism, and around a third related to the media. In HK, a majority of all case studies were oriented to the application field, over half were oriented to the economic field, and policy and media impacts were very similar, at around a third of cases. In the UK, the application field also dominates, and the remaining field logics are more evenly split, with economic and policy logics at around half of all cases and media at a third.
Proportion of high scoring case studies that contain at least one code in each of the fields.
| Country (high scoring) | Policy | Media | Application | Economic |
|---|---|---|---|---|
| AU (n = 246) | 55% | 35% | 96% | 65% |
| HK (n = 132) | 39% | 38% | 92% | 57% |
| UK (n = 253) | 51% | 37% | 98% | 53% |
| Country (high scoring) | Policy | Media | Application | Economic |
|---|---|---|---|---|
| AU (n = 246) | 55% | 35% | 96% | 65% |
| HK (n = 132) | 39% | 38% | 92% | 57% |
| UK (n = 253) | 51% | 37% | 98% | 53% |
Table 7 shows how often each code was applied to fragments of the narratives. In AU, application was coded over twice as often as policy and economic changes, which were relatively even, and nearly seven times as often as media. This picture looks very similar in the UK, but with application coded over four times more often than policy and economic avenues, which were also relatively even, and around eight times as often as media. In HK, application was most frequently coded, but only occurring less than one and a half times as often as economic changes. Here, policy is similarly represented to media, both around four times less often than application. This gives an indication of what kinds of field logics make up the narrative text and the extent to which particular discourses are utilized to make an argument about research value in the context of societal impact.
Characteristics of code applications to high scoring case studies.
| Policy | Media | Application | Economic | |||||||||
|---|---|---|---|---|---|---|---|---|---|---|---|---|
| Sum | Mean | Range | Sum | Mean | Range | Sum | Mean | Range | Sum | Mean | Range | |
| AU (n = 246) | 465 | 1.89 | 0–12 | 176 | 0.72 | 0–6 | 1210 | 4.94 | 0–14 | 477 | 1.94 | 0–12 |
| HK (n = 132) | 152 | 1.15 | 0–9 | 109 | 0.83 | 0–6 | 504 | 3.82 | 0–12 | 305 | 2.31 | 0–19 |
| UK (n = 253) | 542 | 2.14 | 0–16 | 275 | 1.09 | 0–11 | 2250 | 8.90 | 0–24 | 491 | 1.94 | 0–17 |
The qualitative analysis of high scoring case studies thus reveals distinct cultures of evaluation across countries. AU displays a strong orientation to the application and economic fields. This aligns with AU’s policy focus on commercialization (Gao and Haworth 2016), which encourages an emphasis on practical and market utility. The policy field also appears important in AU, occurring nearly as often per case study as the economic field. HK follows a similar pattern. Consistent with the quantitative results, while most case studies involve the application field, this is less pronounced than in the other two countries. Also consistent is HK’s strong economic logic, which appears more often per case study than in the other two countries. Interestingly, the qualitative analysis suggests that the policy field is less of a feature in HK than the quantitative results. This may be because the qualitative coding framework more narrowly emphasizes government policy, whereas the quantitative embeddings approach also includes terms related to legal frameworks. In the UK, apart from the highly dominant field of application, high scoring case studies display a relatively even profile of field logics. This perhaps reflects the maturity of their research assessment, where a greater depth and diversity of impacts are seen as valid. Across countries, the media field appears to be more weakly represented as contributing to impact. This suggests that media may not be seen as a meaningful contribution to society on its own and instead viewed as engagement or a precursor to impact.
Together, the results show the cultural salience of multiple fields, with coherent but differing emphases on each logic by country. It also suggests there is overlap between logics, whereby a single case study is usually oriented towards more than one type. This is to be expected given that there are a limited number of case studies that can be submitted per university. It indicates that universities are motivated to select exemplars that display breadth of societal value in building a persuasive case for world leading impact, rather than a narrower or deeper focus on particular types of value. The analysis thus demonstrates that hybridity between fields is a feature. Researchers and institutions are invested in claiming as many instances of impact as they can in case studies. There are a range of different combinations, which suggests that impactful research is characterized by porous boundaries between field logics.
5.2.2 Cultural repertoires by disciplines
While analysing field structures at the national level can illuminate the overall orientation to different logics, the approach risks flattening the contribution of disciplinary areas. Disciplines are captured in the three national evaluations via varying numbers of subject-based ‘units of assessment’ (UoA), of which there are 24 in AU, 41 in HK and 34 in the UK. By manually assigning these UoAs to the five categories developed by the University of Leiden’s Centre for Science and Technology Studies (CWTS),10 disciplinary groupings can be broadly compared despite variation in UoAs. Supplementary Table S4 gives the breakdown of UoAs per category by country. This shows that while some disciplines feature more prominently in each of the fields, differences across countries are not simply a function of disciplinary orientation to specific logics.
A notable feature across countries is that the application field logic is strongly invoked by all disciplines, as shown in Table 8, with most case studies describing practical applications (across a range of sectors or application areas). This is most prominent in the UK, where the minimum percentage of case studies highlighting this type of impact is 92% (physical sciences and engineering). HK presents a similar pattern, but with lower percentages, with a minimum of 50% of case studies (physical sciences and engineering) invoking this logic, albeit with only a very small number (n = 2). AU falls between these two, ranging from 100% for math and computer science to 92% for physical sciences and engineering. By contrast, the media field is the least salient across disciplines. In AU, media logic is strongest in the country-specific indigenous and interdisciplinary category, followed by social science and humanities. The UK displays the highest rates of media logic in social sciences and humanities, followed by life and earth sciences, while for HK the pattern is reversed.
Proportion of high scoring case studies per disciplinary grouping that contain at least one code in each of the fields.
| CWTS disciplinary grouping | Policy % | Media % | Application % | Economic % | |
|---|---|---|---|---|---|
| AU | Biomedical & health sciences (n = 46) | 59% | 28% | 93% | 72% |
| Life & earth sciences (n = 34) | 35% | 24% | 97% | 79% | |
| Math & computer science (n = 7) | 43% | 0% | 100% | 86% | |
| Physical sciences & engineering (n = 24) | 4% | 29% | 92% | 92% | |
| Social sciences & humanities (n = 114) | 72% | 40% | 98% | 48% | |
| Other (Indigenous & interdisc.) (n = 21) | 52% | 57% | 95% | 76% | |
| HK | Biomedical & health sciences (n = 8) | 13% | 38% | 88% | 63% |
| Life & earth sciences (n = 2) | 0% | 100% | 50% | 100% | |
| Math & computer science (n = 8) | 25% | 13% | 100% | 75% | |
| Physical sciences & engineering (n = 25) | 16% | 4% | 92% | 92% | |
| Social sciences & humanities (n = 89) | 49% | 49% | 97% | 47% | |
| UK | Biomedical & health sciences (n = 73) | 45% | 27% | 100% | 63% |
| Life & earth sciences (n = 14) | 50% | 43% | 100% | 50% | |
| Math & computer science (n = 20) | 40% | 20% | 100% | 70% | |
| Physical sciences & engineering (n = 26) | 23% | 23% | 92% | 77% | |
| Social sciences & humanities (n = 120) | 63% | 48% | 98% | 39% |
Across countries, policy logic features most prominently in the social sciences and humanities than in the other disciplinary groupings. In the UK, social sciences and humanities are followed by life and earth sciences whereas in AU, they are followed by biomedical and health sciences. HK follows AU’s pattern, albeit with smaller percentages, with social sciences and humanities followed by biomedical and health sciences. The range of policy impact varies most within AU, with a 68% gap between the highest (social sciences) and lowest (physical sciences), while the UK and HK display smaller variation. The economic field, by contrast, is represented most prominently by physical sciences and engineering, followed by math and computer science, in all countries. The social sciences and humanities case studies are least focused on translation into the economic field, representing less than half of social sciences and humanities case studies in each country. Thus, while disciplines undoubtedly shape conceptions of research value, overarching field logics appear to be available to all disciplines and can be taken up in different combinations.
5.2.3 Cultural repertoires by university grouping
Another element that risks being overlooked when considering national patterns is the material and symbolic resources of the submitting universities. Higher education institutions (HEIs) are the key organizing principle in each national assessment. There are 42 eligible HEIs in AU, 8 in HK (limited to UGC-funded universities) and 157 in the UK. By manually assigning these HEIs to five quintiles based on CWTS Leiden Ranking 2023 of scientific performance of over 1,400 major universities worldwide11, university groupings can be broadly compared. The CWTS p value is a simple indicator of scientific impact that gives the total number of publications of a university, indicating capacity for research intensive activities. This was used to generate five quintiles for comparison, as shown in Table 9. Supplementary Table S5 gives the breakdown of HEIs per category by country. This analysis shows that while some university groups feature more prominently in each of the fields, differences across countries do not appear to be simply a function of university status or strategy.
Proportion of high scoring case studies per university grouping (by academic productivity) that contain at least one code in each of the fields.
| CWTS global rank (P) | Policy % | Media % | Application % | Economic % | |
|---|---|---|---|---|---|
| AU | Fifth quintile (n = 88) | 55% | 30% | 94% | 59% |
| Fourth quintile (n = 86) | 59% | 35% | 97% | 64% | |
| Third quintile (n = 35) | 57% | 51% | 97% | 69% | |
| Second quintile (n = 9) | 56% | 22% | 100% | 78% | |
| First quintile (n = 18) | 39% | 33% | 100% | 78% | |
| Unranked (n = 7) | 50% | 40% | 100% | 70% | |
| HK | Fifth quintile (n = 29) | 34% | 33% | 93% | 60% |
| Fourth quintile (n = 28) | 64% | 27% | 73% | 55% | |
| Third quintile (n = 11) | 35% | 41% | 94% | 53% | |
| Second quintile (n = 17) | 70% | 70% | 100% | 30% | |
| First quintile (n = 10) | 6% | 25% | 44% | 31% | |
| Unranked (n = 16) | 34% | 33% | 93% | 60% | |
| UK | Fifth quintile (n = 129) | 54% | 38% | 98% | 53% |
| Fourth quintile (n = 41) | 50% | 39% | 95% | 54% | |
| Third quintile (n = 31) | 35% | 39% | 100% | 48% | |
| Second quintile (n = 27) | 67% | 33% | 100% | 52% | |
| First quintile (n = 10) | 20% | 30% | 100% | 60% | |
| Unranked (n = 15) | 47% | 33% | 100% | 60% |
Given its near universal presence across case studies, the application field logic is also strongly invoked by all university groupings. All countries follow the same pattern with the most academically productive universities (fifth and fourth quintiles) showing slightly lower proportions of the logic of application. The media field is the least salient across groupings. In the UK, media logic is slightly stronger in the most productive universities (fifth, fourth, third), while HK and AU show less consistent patterns. In AU media logic is highest in the third quintile and unranked groupings and in HK it is strongest in second and third quintiles. Across countries, there is no clear pattern across groupings in terms of policy logic. In the UK and AU, around half of all case studies submitted by the most productive universities (fifth and fourth quintiles) display policy logic, with a lower proportion in HK. The economic field is represented most prominently by less productive universities in the UK and AU, with the strongest pattern displayed by AU. In the UK, an orientation to the economic field is fairly consistent across university groupings, while in HK it features more prominently in the upper quintiles (fourth, fifth) than in the lower quintiles (first, second).
In general, AU and HK’s slight tendency for stronger field logics in less academically productive universities might show that non-research-intensive universities conceive of their mission as more entwined with communities (e.g. generating benefits for local populations) than those more strongly focused on academic outputs. It may also show that extra-academic resources, such as community partnerships, are important in being able to achieve (and describe) diverse external markers of success around research impact. The UK’s less discernible pattern seems to suggest that there are multiple avenues for demonstrating research value that are achievable by a broad range of university types.
5.2.4 Cultural repertoires around the field of application
One finding that comes through strongly in the above analysis is the dominance of the field logic of application. This suggests that the logic of this field is more generic, where instances of application relate to multiple specific applied fields or domains. Table 10 provides insight into the types of actions and mechanisms that occur. This shows that informing procedures and changing attitudes are key mechanisms for all countries, with differences in the extent of breadth across different sub-categories. For example, the UK tends to include a greater number of sub-categories in case studies, while HK displays narrower use.
Sub-categories within the field logic of application.
| Inform procedure, practice or protocol | Improve workflows | Inform guidelines or strategy | Change practitioner's attitudes, behaviours, knowledge | End to procedure, practice or protocol | Service or product in regular use | |
|---|---|---|---|---|---|---|
| AU (n = 246) | 78% | 27% | 54% | 68% | 7% | 46% |
| HK (n = 132) | 58% | 22% | 32% | 56% | 2% | 48% |
| UK (n = 253) | 81% | 22% | 77% | 84% | 6% | 57% |
Figures 1–3 provide insight into the sectors that are described in the case studies with at least one code in the field of application (AU = 237, HK = 122, UK = 248).12 These figures exclude the small number of case studies that are not coded against the field. This reflects that while the logic of the application field coheres across research areas (e.g. by informing procedure, practice, or protocol; improving workflow, guidelines, or strategy; changing practitioner’s attitudes, behaviours, or knowledge; or beginning or ending a particular procedure, practice, or protocol), the area of application varies widely.
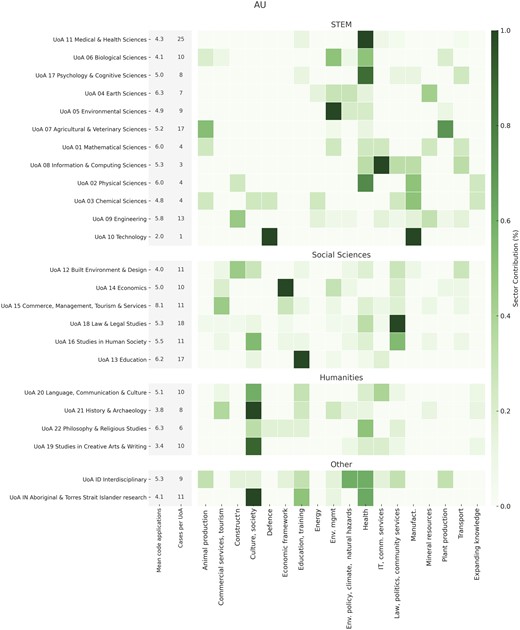
Heat map of AU case studies showing UoA, sector of influence, and average number of codes to the field of application.
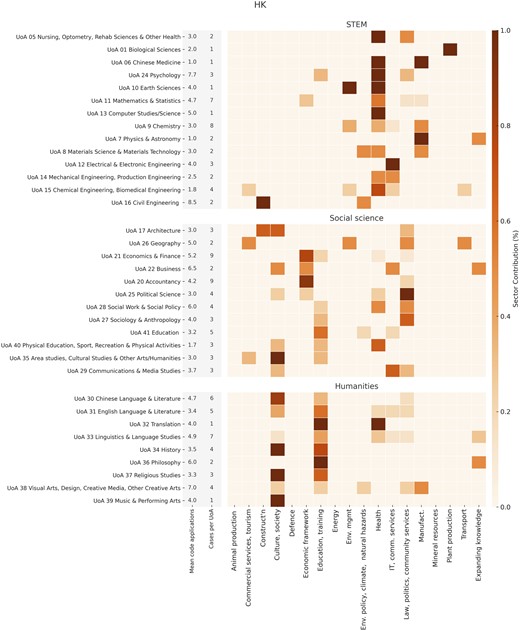
Heat map of HK case studies showing UoA, sector of influence, and average number of codes to the field of application.
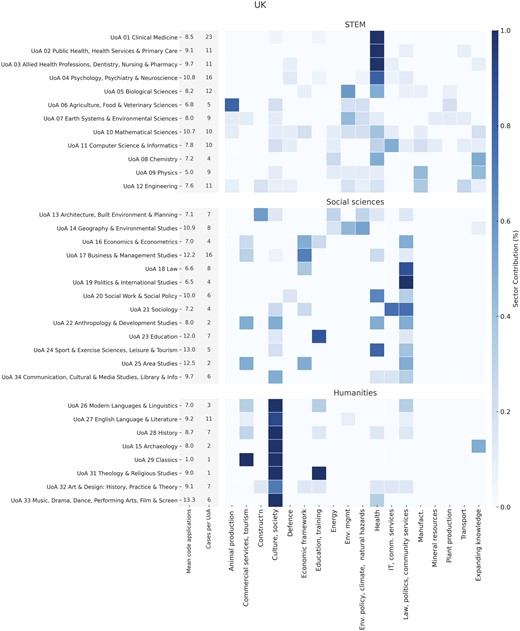
Heat map of UK case studies showing UoA, sector of influence, and average number of codes to the field of application.
Figure 1 shows that AU STEM disciplines tend to relate to a broad range of sectors, albeit with fewer instances in each, suggesting that AU case studies seek to demonstrate breadth over depth. Similarly, AU social sciences and humanities are spread very widely, with concentrations around culture, education, health, and community services. Figure 2 shows that STEM disciplines in HK are less diffuse, with concentrations around health, information and communication services and manufacturing, while the social sciences and humanities tend to cluster around culture, education, and economy. By contrast, as shown in Figure 3, UK case studies tend to be spread widely across sectors, with some key areas of impact. UK examples of application logic tend to be more concentrated in each case study (i.e. with higher mean application codes per case study) but covering a broad range of domains. In particular, the UK STEM disciplines tend to be spread across a wide range of sectors (although concentrating on health, environment, manufacturing, and animal production), while the social sciences and humanities are more concentrated (around community services, health, economy, and culture). These results suggest that the field logic of application is more generic, where mechanisms of change (e.g. improving workflows) relate to multiple types of specific applied fields. Indeed, it is likely that the conceptual necessity and utility of this field is due to impact assessment policies and their implementation, which have set this kind of impact as a criterion and expectation of academic work.
6. Discussion
The assessment of societal impact is an increasingly prominent feature of academic life, shaping how knowledge is valued, incentivized, and rewarded. Research impact assessments thus influence how research value is conceived and performed. Much has been written on the rise of a global impact agenda, with recent theoretical contributions adding to the vast literature on the pragmatic aspects of evaluation. Examining how field logics are embedded in narrative submissions reveals cultural patterns in the expression and valuation of societal benefit. Impact narratives represent choices made by individual researchers (and in many cases, by internal or external writers and editors) in response to the larger structural and environment cues provided by policy design and implementation around impact. The case studies are substantially constrained due to the requirements of the assessment (i.e. critical views of the impact agenda would not be selected), and thus can never provide a full range of responses or resistance (Chubb and Watermeyer 2017). Nevertheless, the narratives offer insights into what is considered important for scoring well on the assessment, demonstrating how performativity and accountability around impact works in practice. Thus, this article documents the relative salience of cultural patterns around the performance of societal impact.
This article emphasizes the importance of cultural repertories—sets of knowledge, skills and symbols—that actors draw on to articulate research value. It builds on previous work showing that ‘success’ in impact involves negotiated capital from a range of fields (Williams 2020; Jensen, Wong and Reed 2022). The study demonstrates that policy, application, media and economic logics are key elements of these repertoires, but their mobilization differs significantly across countries. Table 11 summarizes the results across different settings, highlighting national, disciplinary and institutional contexts. Table 12 distils the variation in the mobilization of field logics across countries. For example, AU demonstrates a pragmatic and action-oriented approach, HK is efficient and competitive, and the UK is comprehensive and strategic. These variations underscore the culturally contingent nature of what counts, and what is rewarded, as meaningful societal impact.
Summary of findings by countries, disciplines and universities.
| Australia | Hong Kong | United Kingdom | |
|---|---|---|---|
| Country profiles | Strong orientation to application and economic fields. Policy and media logics are balanced. High-scoring cases use more field logic vocabulary (except media). | Dominance of economic and policy logics. Application is less prominent. High-scoring cases focus more on policy and media, with reduced emphasis on application and economic.a | Balanced use of field logics; application dominates, with even representation of policy, economic, and media. Low-scoring cases use more field logic vocabulary. |
| Discipline profiles | Application is dominant across all disciplines. Economic logic is strongest in STEM fields (e.g. physical sciences and engineering). Policy is prominent in social sciences and humanities. | Application is strong but less dominant than in AU and UK. Economic logic is highly emphasized across STEM fields. Social sciences favour policy and economic logics. | Application logic is universal across disciplines. Social sciences favour policy and media, while STEM disciplines focus on economic and application logics. |
| University profiles | Less academically productive universities emphasize economic and policy logics. High-scoring cases show stronger application impacts across all university groups. | Stronger emphasis on economic logic among more productive universities. High-scoring cases in less productive universities display more diversity in policy and application logics. | Application logic is consistently emphasized across all university groupings. Less productive universities rely on broader and more generic field logic vocabulary. |
Despite inconsistency in the prevalence of policy logic between the quantitative and qualitative analysis, in this summary we have worked from the quantitative results given the broader scope of the policy field given by the embeddings approach.
Key narrative framings, evaluation principles and prevailing cultural repertoires by country.
| Australia | Hong Kong | United Kingdom | |
|---|---|---|---|
| Key narrative framings | A focus on commercialization makes economic and application logics readily available. | A focus on a range of contributions makes available a broad set of logics. | A focus on breadth and depth of contributions makes multiple logics readily available. |
| Core evaluation principles | Emphasis on economic and practical outcomes as measures of success. | Emphasis on economic impact and policy influence, but with room for success via other areas. | Multiple principles of evaluation, with emphasis on translation into applied outcomes. |
| Prevailing cultural repertoires | Pragmatic and action-oriented: Emphasis on usefulness and impact on local communities. | Efficient and competitive: Focus on economic outcomes and alignment with policy goals. | Comprehensive and strategic: Showcases research that spans multiple impacts. |
While university research environments increasingly involve negotiation of capital from extra-academic fields, this analysis suggests that these dynamics play out both subtly and overtly. The objective structures of the fields and the way actors are socialized into them are mutually constituent; thus, the ‘the game itself’ and ‘the feel for the game’ exist in balance (Bourdieu 2000). Field logics come into being through their integration into mostly unconscious inclinations. Different fields follow their own specific logics (Bourdieu 1986) and are defined through the struggle over meaning and the stakes that are involved. That is, they make sense in the context of contests and interests within the field and in relation to other fields. For example, industry researchers who strive to sell commercial research products are often not motivated by the questions that drive critical scholars, but commercially focused university researchers are often motivated by both the demands of the scholarly and economic fields.
Actors within a field share an understanding of the stakes involved and underlying rules that govern how the field operates. They are involved in strategic action to maximize their share of capital in a field. For example, an actor in the media field may seek to harness narratives and practices that influence journalists or the public to gain a recognized form of status around ‘visibility’ (Williams 2020). However, while some field logics are more conceptually straightforward, such as media or economic, the logic of application is less clear. This field logic encompasses a broad range of applied contexts and practices. While academics may seek to influence practitioners or redefine procedures to gain status around ‘usefulness’, contests over capital likely relate to the specific domain area itself. To some extent, this category may arise because impact policy constructs a generic concept of ‘application’, which becomes a kind of field in its own right (even where it may not exist as a coherent ‘field’ beyond the world of impact assessment). It may be that research narratives capture something of a range of specific applied fields that do not represent a coherent space of struggle as a whole, but that can be grouped together as offering similar affordances around ‘utility’ (i.e. allowing actors to position their research as useful in the real world). In increasingly complex university environments, a key skill is managing entrepreneurial practices to capitalize on the tensions between multiple structures of evaluation (Rushforth, Franssen and de Rijcke 2019) and the attendant range of symbolic resources on offer.
This article diverges from previous research in several ways. First, it combines the broad theoretical work on cultural repertoires with conceptual understandings of the underlying field structures in play in research evaluation contexts. Second, it compares the operationalization of the global impact agenda across three countries with similar policy frameworks, including previously unavailable AU data. Third, it uses a mixed method analytical approach that responds to increased interest in using machine learning techniques in conjunction with theory-informed qualitative methods. The embeddings approach allowed for automation of the labour-intensive process that would be required to code thousands of impact case studies, which was validated and enriched by manual qualitative coding of case studies judged to be examples of successful research impact by evaluators. Together, these contributions offer a nuanced perspective on how the global impact agenda is localized.
There are some limitations to the mixed method approach employed in this study. These include the difficulty of drawing quantitative conclusions about how prevalent each field logic is. Some fields are likely to be underrepresented because of differing sizes of lexicons and the removal of common words. This method therefore cannot easily be used in isolation to compare across the mechanisms, requiring further qualitative examination. However, the method of identifying high scoring case studies for the UK and HK is imperfect, given it restricts the available case studies on the basis of UoA, meaning that some UoAs have very few cases. Conceptual issues relate to the somewhat arbitrary nature of field structures themselves, being better suited to operationalizing a theoretical framework rather than for identifying emerging or overlooked fields. In addition, field logics represent one aspect of impact, but there are many elements at play. For example, there is a similar proportion of vocabulary related to the policy field logic in UK and AU, but which do not provide insight into how policy change was delivered for different community groups or in different domains. Further research is required to illuminate how field structures relate to the topics, domains or beneficiaries involved in the realization of research impact.
7. Conclusion
This study sheds light on how field logics play out in the context of national research impact assessments. These field logics—expressed in narratives written for evaluation purposes—reflect a mutually constitutive relationship between individual agency and structural constraints. That is, the fields themselves are created and reproduced by the actions of those who operate within them, who are also shaped by the structure of the fields in which they are embedded (Bourdieu 1986). Importantly, those who operate in the fields are aware of and can reflect on the structures that shape their behaviour. Researchers and institutions make choices in response to the requirements of assessments, but these choices are shaped by the cultural and institutional frameworks within which they operate. Importantly, their agency is not limitless, due to the requirements of the assessment that are shaped by broader political and policy forces. Nevertheless, the narratives offer insight into how performativity and accountability play out in national assessments.
By examining cultural repertoires across three national contexts, this study offers a novel understanding of the heterogeneity of cultural tools available to researchers for demonstrating societal value. The repertoires are non-deterministic, serving to make certain actions and orientations more or less likely, rather than prescribing patterns of thought and behaviour. This paper shows that the availability of these repertoires varies across national, disciplinary and institutional settings. It offers a new perspective on the criteria that are used to distinguish what is considered more and less valuable research. The findings have implications for the design of context-sensitive research policies and assessments. As the global impact agenda continues to advance, recognizing the cultural specificities of research value is essential. Further research is needed to understand how these repertoires are taken up by diverse groups within universities, considering factors such as gender, academic role and institutional status. This study gives some indication of the implicit and explicit expectations contained in the increasingly globalized impact agenda, where dominant principles of performance measurement, accountability, and value for money require culturally specific negotiation.
Acknowledgements
We are grateful to William Healy for his assistance with coding, and to Jonathan Grant, Eliel Cohen and two anonymous reviewers for their thoughtful comments and suggestions.
Supplementary data
Supplementary data are available at Research Evaluation Journal online.
Funding
This work was supported by the Economic and Social Research Council grant ES/V004123/1.
Notes
Williams and Grant (2018) provide a comprehensive review of how the policy and procedures to assess research impact evolved symbiotically in Australia and the UK.
https://results2021.ref.ac.uk/. The website contains publicly available case studies; some were kept back due to commercial or national security issues.
https://www.ugc.edu.hk/eng/ugc/activity/research/rae/rae2020.html. The website contains publicly available case studies; some were kept back due to commercial or national security issues.
This builds on work such as that of Chen et al. (2018), who looked at how different kinds of semantic relations (e.g. synonyms, hypernyms, hyponyms) are represented by word embeddings. The approach has been applied to various domains including bio & health informatics (Si et al. 2019; Jha 2021), software engineering (Efstathiou, Chatzilenas and Spinellis 2018), biomedicine (Sheikhshabbafghi, Birol and Sarkar 2018) and patents classification (Risch and Krestel 2018).
Top 50 words for each keyword were pulled from the embedding matrix based on their distance to those keywords in the projected vector space. For duplicate words within the lexicon the average distance value was taken (i.e. creative could show up as word similar to both art and exhibition keywords within the scholarly & creative category, each within a different distance to the parent word). The words have been further lemmatized to reduce the variety in the vocabulary (e.g. plural to singular, past tense to present tense).
The average of the words selected within each category of a mechanism type was 52 (sd = 27) for academic, 42 (sd = 24) for policy, 44 for (sd = 17) media, 52 (sd = 33) for application and 51 (sd = 26) for economic. Given there were more than two evaluators, we used percentage agreement: academic 80.4%, policy 97.6%, media 95.0%, application 75.0%, and economic 91.6%.
As embeddings were trained only on the data from case studies, the vocabulary captured is directly related to research impact described in ICS. This means that not only the specifics of each type of impact (what) were captured but also the vocabulary used to describe them (how).
The CWTS categories are (1) biomedical & health sciences; (2) life & earth sciences; (3) math & computer science; (4) physical sciences & engineering; (5) social sciences & humanities; plus (6) an ‘other’ category to account for AU’s Indigenous and interdisciplinary UoAs.
These sectors were drawn from the 19 Socio-Economic Objectives (SEO) divisions as set out in the Australian and New Zealand Standard Research Classification 2020 available at https://www.abs.gov.au/statistics/classifications/australian-and-new-zealand-standard-research-classification-anzsrc/latest-release. Here, the UoAs have been manually grouped into STEM, social sciences, humanities and other.
References
Efstathiou, V., Chatzilenas, C., and Spinellis, D. (
