


Abstract
Smart weeding technologies (SWT) enable substantial herbicide savings via precise sensor-based application. This can enhance agrobiodiversity and make modern agriculture more sustainable. Currently, our knowledge about what will determine SWT adoption at the farm level is limited because few mature and economically viable prototype systems are available. We conduct a pre-registered and incentive-compatible online lab-in-the-field experiment with a convenience sample of 334 active German crop farmers to assess whether pro-environmental attitude, innovativeness, and trust in farming data privacy explain hypothetical SWT adoption. We further test if an environmentally motivated subsidy, a green nudge, and a combination thereof affect adoption intentions. While attitudinal measures clearly modulate hypothetical adoption decisions in our sample, we detect no effect for the nudge and subsidy. Our findings have implications for policy and future research. Substantial policy support may be needed as long as environmentally beneficial smart farming technology remains privately less competitive than conventional alternatives. Moreover, targeting criteria for early adopters include pro-environmental attitudes and innovativeness.
1. Introduction
In light of a growing global population and rising demand for bio-based food, energy, feed, and fibers, modern agriculture must boost eco-efficiency in order to sustainably ensure food security at global scale (von Braun et al. 2021). To intensify global food production sustainably, i.e. enhanced agricultural productivity with reduced environmental impacts thereof, no universal solution exists. Instead, a multitude of context-specific approaches must be pursued, often contingent on a wider systemic transformation process (Garnett et al. 2013). In particular, technological and management-related food system innovations bear considerable potential to counteract climate change and environmental degradation, for example, linked to farm input overuse (Springmann et al. 2018).
Smart farming technologies (SFT) are heralded as particularly promising innovations to reconcile environmental and productivity goals (e.g. Finger et al. 2019; Rübcke von Veltheim and Heise 2021) and may trigger the ‘fourth revolution’ in agriculture (Walter et al. 2017). SFT are knowledge-intensive innovations based on agricultural machines that record and process data to make decisions in real time. By acting autonomously, SFT may gradually shift the operator's role away from active managerial tasks, such as steering machinery, toward supervising, adjusting, and intervening to resolve technical failures (Bovensiepen et al. 2016). Examples are robots for field operations like mechanical and chemical weeding, fertilization, pest detection (Rübcke von Veltheim and Heise 2021), aerial inspection of crop nutritional status via hyperspectral cameras (Li et al. 2014), and drone-based pest scouting (Bovensiepen et al. 2016). The value proposition of SFT is to enhance the economic and environmental performance of agricultural production (Weersink et al. 2018). Specifically, SFT tailor field operations to the temporal and spatial field heterogeneity (Aubert et al. 2012; Wolfert et al. 2017), enabling substantial reductions in the use of chemical and other inputs (Sørensen et al. 2005; Finger et al. 2019), agricultural greenhouse gas emissions, and environmental pollution (Balafoutis et al. 2017). As such, SFT may appeal to farmers who are under pressure to balance trade-offs between profitability and environmental impacts in a range of agricultural production systems (Walter et al. 2017).
Lowenberg-DeBoer et al. (2020) demonstrated that automated and fully autonomous field robots can economically outperform conventional machinery for certain field operations. Nevertheless, on-farm experimental evidence is scant. Furthermore, while SFT may reduce negative environmental impacts, they also increase the complexity of agricultural systems (Scholz et al. 2021; Sparrow and Howard 2021) and potentially pose data protection and sovereignty issues (Fleming et al. 2018; Jakku et al. 2019). The viability and speed of diffusion of specific novel technologies thus clearly vary depending on technology attributes, biophysical context and farmers’ competences, and preferences (Khanna et al. 2022; Finger 2023). Moreover, ethical and legislative concerns about unsupervised operations, automated agronomic data collection, and other genuinely novel characteristics inherent to SFT are likely to affect technology diffusion (Sparrow and Howard 2021).
Past research on agricultural technology adoption has often focused on observable individual, farm, and contextual adoption determinants (Tey and Brindal 2012; Ruzzante et al. 2021; Shang et al. 2021). This has greatly facilitated the identification of so-called ‘early adopters’ (Rogers 2003), i.e. farm types among which innovation processes are likely to begin. However, given the novel SFT features discussed above, specific individual attitudes of farmers are likely to play a more important role in forming future adoption intentions and corresponding decisions than in the past. Yet, according to recent reviews, the available literature on sustainable farming innovations has so far paid only limited attention to behavioral factors (e.g. Dessart et al. 2019; Thompson et al. 2023). Exceptions include relatively recent studies that provide incipient evidence on how norms and attitudes toward the environment, innovations, and data privacy may interact with specific technology attributes (e.g. Blasch et al. 2020; Michels et al. 2020a; Mohr and Kühl 2021; Hüttel et al. 2022). For example, in a choice experiment regarding Italian farmers willingness to adopt precision farming technologies, Blasch et al. (2020) interacted, inter alia, the degree of automation and chemical savings with farmers’ innovativeness and environmental preferences to find higher innovation willingness among farmers with higher attitude levels. Furthermore, Mohr and Kühl (2021) conducted a survey on behavioral determinants of the acceptance of agricultural artificial intelligence systems. While innovativeness was not a significant determinant in this study, a higher level of trust in property rights of farming data had a statistically significant positive effect on acceptance. To this point, however, no study has looked at the farmers’ attitudes pertaining to their adoption intentions of data-intensive and (partly) autonomous SFT in a rigorous experimental setting. Additionally, a systematic analysis of the relationship between farmers’ attitudes and policy scenarios to enhance SFT adoption is currently missing.
Thus, at this early stage, no general conclusions can be drawn on these interactions, and further case-specific evidence is needed to improve our understanding of the conditions under which farmers are willing to adopt SFT at relevant scales. In sum, expanding our knowledge base about how novel technology attributes align with farmers’ sociodemographic and behavioral characteristics is essential to design effective enabling and regulatory frameworks for sustainable agriculture (Thomas et al. 2019; Sparrow and Howard 2021; Mizik 2022).
We address these knowledge gaps by focusing on smart weeding technologies (SWT), a branch of SFT with a relatively advanced level of technological development and high potential to increase herbicide use efficiency (King 2017). The centerpiece of our online lab-in-the-field experiment with German arable farmers is an incentive-compatible two-period business simulation game in which we elicit innovation adoption intentions, i.e. the number of hectares allocated to SWT, from two perspectives. First, we analyze the relevance of attitudinal measures, based on prior literature, as additional covariates in order to address novel attributes inherent to SWT. Second, we test the effectiveness of hypothetical policy scenarios to positively influence adoption behavior. Specifically, we look at a subsidy and a green nudge, separately and in combination, as experimental treatments in a within- and between-subjects design.
Our contributions to the agricultural technology adoption literature are twofold. First, we move beyond economic feasibility assessment and shed light on attitudinal measures likely to bear additional explanatory value for the extent to which farmers do intend to adopt. We show that German farmers’ pro-environmental attitude (AttEnv) and innovativeness are likely to matter for the technology diffusion process in the real world, whereas data concerns seem to be less of an adoption barrier. Our second original contribution lies in testing whether innovative policy instruments, namely, a conditional subsidy and a green nudge, can, separately and in combination, enhance adoption intentions. None of the policies investigated had a statistically significant effect on SFT adoption.
The following Section 2 details the conceptual background and research hypotheses after which Section 3 describes the empirical and analytical approach and gives an overview of the collected data set. Section 4 depicts the results of the analysis, and in Section 5, we discuss the results and conclude the paper in Section 6.
2. Conceptual background
Farmers’ adoption decisions of sustainable innovations are known to be driven by monetary and non-monetary motives (Chouinard et al. 2008). Personal preferences and attitudes toward (sustainable) innovations can lead to managerial decisions that deviate from profit maximizing behavior (Sattler and Nagel 2010; Musshoff and Hirschauer 2014). SWT are associated with environmental benefits due to herbicide savings but are also less profitable than conventional weeding technology at current stages of development. Motivated by Annosi et al. (2019) and Aubert et al. (2012), we add to the set of sociodemographic adoption determinants three attitudinal constructs that are likely to interact with novel characteristics of SFT (exemplified by SWT) and assess whether these attitudes can explain farmers willingness to partially forego private profits.
Both farmers’ immediate profits and long-term livelihoods depend on the sustained quality of the natural environments. Therefore, managerial decisions are simultaneously driven by short-term economic goals and motivations to conserve natural resources (Blasch et al. 2020) in order to maintain long-term productivity (Chouinard et al. 2008) and environmental service provision (Juárez-Luis et al. 2018). Producers thus derive utility from innovations that enhance environmental quality, e.g. via the sustainable use of farm assets or in the form of esthetic or recreational values (Chouinard et al. 2008). However, technologies that provide public environmental goods may also be adopted out of a desire to comply with social norms and expectations to improve one's reputation (Kuhfuss et al. 2016a) or because adoption comes with a ‘warm glow’ feeling (Andreoni 1990). Lastly, as SWT can bring about substantial herbicide savings, mitigating environmental impacts, their uptake could be motivated by a farmer's general environmental concern or her perceived responsibility for the environment (Dessart et al. 2019). Hence, even though moving from conventional to SWT implies partially trading off short-term profits, we hypothesize that:
H1: Farmers with a higher degree of pro-environmental attitude (AttEnv) allocate more hectares to environmentally friendly SWT than individuals with a lower degree of AttEnv.
Rogers (2003) describes early adopters as venturous, curious about innovations, and uncertainty-loving. Correspondingly, farmers who perceive themselves as interested and knowledgeable and who actively seek out information about technological innovations through the internet, magazines, or discussions with colleagues should be more likely to experiment with digital technologies. The literature on digital innovation adoption does not entirely confirm this conjecture though. While Michels et al. (2020b) found a positive association between stated innovativeness and smart phone ownership for farming purposes among German farmers, Beza et al. (2018) observed that personal innovativeness (PI) did not effectively promote intentions to use mobile SMS among Ethiopian farmers. One study conducted with Canadian farm managers identified innovativeness to favor the adoption of diagnostic and applicative precision agriculture tools (Aubert et al. 2012). Lastly, Mohr and Kühl (2021) provide a behavioral perspective on the acceptance of artificial intelligence systems among German farmers. While they found no direct effect of higher levels of personal innovativeness on acceptance, the former positively mediated a set of attitudinal measures which in turn indirectly affected acceptance in a positive way. Arguably, the relevance of farmers’ innovativeness may vary across study designs and contexts. Especially for technologies with complex traits, such as SWT, innovativeness may be a necessary but not sufficient condition for adoption. For example, if innovative farmers are also well-informed about pending technological challenges of a particular digital technology, innovativeness may be associated with non-adoption. We hope to better understand this relation and hypothesize that:
H2: Farmers with a higher degree of personal innovativeness (PI) allocate more hectares to environmentally friendly SWT than individuals with a lower degree of PI.
Many SFT have the ability to collect and process high-volume farming data, allowing them to take and continuously improve (semi-)autonomous analytical and operational tasks in real time (Bovensiepen et al. 2016). These novel technological features have sparked a controversial debate. Improved in-field decision-making based on artificial intelligence allows substantial chemical input reductions (Finger et al. 2019), and augmenting farming processes via big data applications will enhance foresight capacities and eventually transform whole farming business models (Wolfert et al. 2017). However, little quantitative research is available on how farmers evaluate the novel data-driven abilities of the ‘digital brain’ of SFT, let alone their effect on adoption intentions and implications for policies required to soothe concerns around big data in agriculture (Sparrow and Howard 2021). Scholz et al. (2021) found that the agricultural digitalization process has raised growing concerns among farmers regarding the sovereignty, security, and ownership of their farming data, which may impose an impediment to the adoption of SFT (Fleming et al. 2018; Jakku et al. 2019; Lioutas et al. 2019; Garbriel and Gandorfer 2020). We are aware of only one recent publication by Mohr and Kühl (2021), who quantified a positive relationship between ‘farmers’ expectation of property rights over business data’ and the acceptance of artificial intelligence in agriculture. We shed further light on this relevant debate by explicitly considering the role of trust in the security and privacy of farming data for farmers’ intentions to adopt SFT:
H3: Farmers with a higher degree of trust in farming data security and privacy (DT) allocate more hectares to autonomous weeding robots (WRs) as an alternative, environmentally friendly, weeding technology than individuals with a lower degree of DT.
The potential environmental benefits that are associated with the adoption of agricultural innovations may pose a rationale for policy intervention. Agri-environmental policy instruments, such as subsidies, can then increase the private profitability of innovations vis-à-vis established agricultural technologies to the benefit of society (Musshoff and Hirschauer 2014; Kuhfuss et al. 2016b; Thomas et al. 2019). For example, in the framework of the EU's Common Agricultural Policy, agri-environmental policy incentives are designed to induce sustainable agricultural innovation by partially compensating the opportunity costs faced by farmers when adopting environmentally beneficial land uses (Kuhfuss et al. 2016b). Beyond compensation for the associated increase in production and transaction costs, subsidies signal societal appreciation to farmers, who are increasingly under pressure to align multiple and often conflicting sustainability demands (EEA 2022). A technology-specific subsidy, even if not fully compensatory, may thus tip the balance in favor of the environmentally more beneficial, but privately less profitable technology option:
H4: A governmental subsidy increases the number of hectares allocated to environmentally friendlier SWT.
More recently, ‘soft’ policy tools (Akerlof and Kennedy 2013) have been proposed to promote the adoption of sustainable practices and technologies. So-called behavioral nudges are designed to influence individuals’ behavior toward more sustainable outcomes and thereby increase the welfare of an individual or (and) society at large (Congiu and Moscati 2022). As such, nudges can be a cost-effective alternative to monetary incentive schemes. According to Thaler and Sunstein (2008), a nudge contains ‘any aspect of choice architecture that alters behavior in a predictable way without forbidding alternatives or significantly changing economic incentives’ (p. 6). While nudges are applied in a multitude of contexts (Thaler and Sunstein 2008; Akerlof and Kennedy 2013), ‘green nudges’ in particular aim at voluntary pro-environmental behavior change (Schubert 2017). Ferrari et al. (2019) reviewed literature on the impact of green nudges on, inter alia, farmers’ pro-environmental behavior and found that the majority of articles used two nudge design principles. Specifically, they either relied on salience and affect by addressing a novel issue of personal relevance to the nudged farmer or they made use of social norms and peer comparison.1 Along these lines, nudges may be aimed at farmers’ self-image (Howley and Ocean 2022), their perceived responsibility toward the dominant social setting (Czap et al. 2015), or the environment (Peth et al. 2018).
However, the effectiveness of behavioral nudges depends on the specific context and behavior under consideration. For example, Buchholz et al. (2018) found that a green nudge significantly lowered participants’ pesticide use, while Czap et al. (2019) showed that an empathy nudge (a personal message) significantly increased the number of Nebraska farmers enrolled in a conservation program. Kuhfuss et al. (2016a) confirmed the effect of a social norm nudge (comparison with other farmers) on intentions to maintain conservation practices in agri-environmental schemes, although this was contrasted by Howley and Ocean (2022), who showed that a similar social nudge had minimal effect on the intention to adopt smartphone apps for farming purposes. Lastly, in Czap et al. (2015), a heterogeneity analysis revealed that an empathy nudge was an effective intervention to increase hypothetical water conservation behavior only for those individuals who already showed higher pre-treatment conservation behavior. Potentially, any hint toward socially or environmentally desirable behavior might even have the opposite effect, i.e. farmers may react with protest behavior since for the adoption of costly innovations such as SWT substantiated support is needed. Despite the ambiguity in the empirical literature, we hypothesize based on the majority of study findings:
H5: A green nudge increases the number of hectares allocated to the environmentally friendly SWT.
In the metaeconomics framework (MEF) and dual interest theory (DIT), Lynne et al. (2016) suggest that economic agents endeavor to find a balance between their (economic) self-interests and other business-related interests when considering outcomes of their managerial decisions. Other interests could be driven by the agents’ empathy toward their social environment. The environmental benefits associated with SWT accrue to society at large as a public good. Thus, according to theory (Lynne et al. 2016), combined policy interventions that simultaneously address farmers’ economic as well as farmers’ societal interests can enhance conservation behavior more than each intervention separately. However, empirical literature testing the superiority of combining policy tools is both scarce and ambiguous. For example, Hagmann et al. (2019) found that a nudge to use green energy reduced the support for a carbon tax. However, experimental findings in Osman et al. (2021) and a review study by Stern (2011) suggest that combined monetary and non-monetary incentives were superior in increasing the consumption of sustainable food and reducing private carbon emissions, respectively, than each of the two incentive types in isolation. Despite several findings that nudges alone may not suffice to produce the desired effects (e.g. Czap et al. 2015; Peth et al. 2018; Reddy et al. 2020), research on combined policy effects is even more patchy in the context of agricultural technology adoption. Promisingly, Howley and Ocean (2022) tested two nudge types, an injunctive norm and social signaling, to find weak evidence that the combined nudge effect exceeded the sum of the individual effects on mobile phone farming app adoption by farmers in the United Kingdom. For the case of French farmers’ enrolment in agri-environmental contracts, Kuhfuss et al. (2016b) showed that a financial incentive combined with an injunctive social norm was more effective and cost-efficient than a subsidy alone. Furthermore, a framed lab experiment in Czap et al. (2015) confirmed that the effect of a combination of a subsidy with an empathy nudge was larger than either of the individual treatment effects on hypothetical water conservation behavior. Accordingly, we formulate our last hypothesis:
H6: Combining monetary incentives and a green nudge leads to a higher number of hectares allocated to SWT than either of the two measures individually.
Note that hypothesis three only addresses WRs. We argue that concerns around farming data security and privacy are mainly associated with fully autonomous WRs, while the remaining hypotheses address both SWT investigated below.
3. Methods and data
3.1 Lab-in-the-field experiment—background and design
The novelty and low diffusion levels of SWT rule out an ex-post assessment based on observed adoption behavior under varying policy interventions for our case. Therefore, we designed a framed lab-in-the-field experiment (Gneezy and Imas 2017; Thomas et al. 2019). Compared to costly controlled field experiments and ex-post observational studies with limited internal validity, lab-in-the-field experiments can be designed at relatively low cost and provide a high level of internal validity (Musshoff and Hirschauer 2014; Gneezy and Imas 2017). To maximize external validity, we addressed the study to non-standard subjects, i.e. active farmers (Gneezy and Imas 2017). We framed the experimental setting to include information on the study context and practical agronomic decision tasks. Framing creates a common ground of contextual knowledge and aligns the (presumably diverging) implicit interpretations and assumptions of participants to the extent possible (Alekseev et al. 2017). Moreover, the experiment aimed to closely resemble a realistic decision situation, which is beneficial for data quality (Musshoff and Hirschauer 2014). As such, the hypothetical nature of the experiment enabled us to study farmers’ behavior in a scenario that assumed the commercial availability of SWT for crop farming and the presence of policy conditions tailored accordingly.
The pre-registered2 and incentivized3 study was programmed in Qualtrics and started out by recording a set of attitudinal measures. This order was chosen to obtain the attitudes unaffected by any information given throughout the experiment. To make hypotheses H1–H3 testable, we developed the three attitudinal measures based on multiple question items that were derived from the discussed literature and operationalized them via 7-point Likert scales on which study participants self-assessed their degree of (dis-)agreement. The final attitudinal constructs entered the analysis as standardized mean scores.4
This was followed by the experimental centerpiece—a two-period business simulation game. We collaborated with the Agricultural Chamber of North Rhine-Westphalia (NRW, a German federal state) for the development of experimental contents. After pretesting with eighteen chamber members (mostly active farmers), minor improvements regarding programming and farming terminology were implemented. Within the game, participants were placed in the role of fictitious farmers managing 50 hectares (ha) of arable land on which cereals and root crops would be cultivated and sold after each production period. The participant's task would be to choose between three weeding technologies—broadcast application (BC), spot spraying (SS), and a weeding robot (WR). Specifically, participants had to decide in each game period separately about the number of hectares allocated to each weeding technology. Only one technology could be allocated to each full hectare, i.e. repeated weeding or weeding fractions of hectares was not possible. On each hectare, two kinds of returns could be generated—economic and environmental—expressed in game points, which were converted into real Euros after the game. Participants were informed that the three weeding technologies would perform equivalently in terms of weeding efficacy, but differently with respect to per-hectare gross margins and environmental impacts, and that all operations would be offered as a service per hectare by a contracting firm. BC served as the technological status quo. It was depicted as an established conventional weeding method with homogenous chemical application, thus no additional benefits to the environment, but a comparatively high profit due to low operational costs. SS and the WR represented SWT alternatives associated with substantial chemical savings, thus providing environmental benefits via reduced impacts. However, these technologies were assumed to imply higher contracting costs and thus a lower profit margin for the farmer (Table 1).5 While SS was depicted as an enhanced spraying boom mounted to a tractor with a human driver, the WR was framed as an autonomously operating SWT, thereby encapsulating the discussed unknowns of early-stage SFT, which allows us to test H3.
Description of weeding technologies.
| Broadcast application | Spot spraying | Weeding robot | |
|---|---|---|---|
| Steering mode | Tractor with human driver | Tractor with human driver | Autonomous |
| Profit margin (pts/ha) | 90 | 66 | 66 |
| Ecological value (pts/ha) | 0 | 45 | 45 |
| Broadcast application | Spot spraying | Weeding robot | |
|---|---|---|---|
| Steering mode | Tractor with human driver | Tractor with human driver | Autonomous |
| Profit margin (pts/ha) | 90 | 66 | 66 |
| Ecological value (pts/ha) | 0 | 45 | 45 |
A key experimental design challenge lies in the parameterization of the absolute and relative private and environmental benefits of weeding technologies. First, no reliable information currently exists on the average profitability and environmental benefits of highly innovative SWT. Second, the experimental setting must allow participants to quickly calculate the payoff of alternative choices. This forced us to work with stylized values for private and ecological payoffs based on available knowledge. Several studies assessed relative yield performance in different crops by comparing broadcast herbicide application to SS or WRs (e.g. Gerhards and Oebel 2005; Sørensen et al. 2005; Kunz et al. 2018) and yield losses in general due to reduced chemical weeding (e.g. Kobusch 2003). Based on Pahmeyer et al. (2021) and the online production planning tool KTBL (2023), the relative profit loss of switching from BC to an SWT was found to range from 23 per cent to 62 per cent. Although the profit differences of switching from BC to SWT are mainly caused by lower average yields, equivalent weeding efficacy for all technologies was assumed for the parsimony of the simulation game. For commensurability and practicability, ecological values in Equation (2) are presented in the same unit to allow for comparison with private profits and illustrate the composition of societal utility. Private profit, ecological value, and total societal utility were calculated as follows:
with |${\rm{h}}{{\rm{a}}}_{{\rm{BC}}} + {\rm{h}}{{\rm{a}}}_{{\rm{SS}}} + {\rm{h}}{{\rm{a}}}_{{\rm{WR}}} = 50{\rm{\ ha}}$|
In the first round (baseline) of the experiment, all participants played the same game. Equations (1)–(3) were shown to each participant, followed by the task of setting up their baseline weed management plan. Thereafter, participants were shown their individual outcomes in terms of private profit, ecological value, and total societal utility. In the following round two (treatment round), participants were randomly assigned to one of the four experimental conditions (Table 2).
Randomized assignment of experimental conditions to treatment groups.
| Subsidy = 0 | Subsidy = 1 | |
|---|---|---|
| Nudge = 0 | T0 | T1 |
| Nudge = 1 | T2 | T3 |
| Subsidy = 0 | Subsidy = 1 | |
|---|---|---|
| Nudge = 0 | T0 | T1 |
| Nudge = 1 | T2 | T3 |
Randomized assignment of experimental conditions to treatment groups.
| Subsidy = 0 | Subsidy = 1 | |
|---|---|---|
| Nudge = 0 | T0 | T1 |
| Nudge = 1 | T2 | T3 |
| Subsidy = 0 | Subsidy = 1 | |
|---|---|---|
| Nudge = 0 | T0 | T1 |
| Nudge = 1 | T2 | T3 |
Prior to deciding on their weeding strategy for round two, each treatment group received a different informational text. The control group T0 received a text without any connection to the experiment. In line with H4, treatment group T1 was informed that they would obtain a subsidy of ten points for each hectare weeded with SS or WR. This partially compensated farmers’ opportunity costs of switching from broadcast to a more sustainable but less profitable technology. Group T1 was thus shown an updated private profit function Equation (4).
The calculation of ecological benefits remained identical to Equation (2). Respondents were informed that societal utility did not include the values of the subsidies; thus, social utility equaled environmental benefits and private profits, excluding subsidies. According to H5, the green nudge, shown to participants of treatment group T2, appealed to the intrinsic motivation of farmers as environmental stewards and key actors in guaranteeing safe and sustained food production, highlighting farmers’ responsibility for the welfare of society as a whole via voluntary sustainable practices. Thereby, the nudge made use of the salience and affect design principle (Blumenthal-Barby and Burroughs 2012).6 Profit, ecological, and societal utility per hectare were kept at baseline levels. Finally, treatment group T3 received treatment texts T1 and T2 in combination (H6) alongside the formulae for the calculations of returns as shown to treatment group T1. After receiving one of the treatment texts and updated information regarding the calculation of their profits, participants set up their weeding plan again, followed by the display of their respective private, ecological, and societal outcomes. Subsequent to the business simulation game, information on sociodemographic and farm structural variables was collected.
Lastly, and only upon finishing the whole survey, respondents could insert their email address to redeem their incentive, which consisted of the countervalue of their economic and ecological benefits from one of the two randomly selected game periods. The profit obtained in that round was converted (150 points = 1 Euro) into a voucher from a workwear retailer and sent out to all farmers who provided their e-mail address. The ecological benefit was converted at the same rate into a donation. For donations, we chose organizations or initiatives that contributed to promoting environmental goals, such as the multifunctionality of rural agricultural landscapes, in the respective German federal state of the participant. The respective information regarding the pay-out was provided to participants prior to conducting the experiment. Depending on participants in-game decisions, voucher values and donations could range from 22 Euros (show-up fee) to 30 Euros and from 0 Euros to 15 Euros, respectively.
3.2 Analysis
3.2.1 Attitudinal measures
First, we assess baseline determinants of SWT allocation shares. While controlling for sociodemographic variables, we mainly focus on attitudinal constructs such as AttEnv, PI, and trust in farming data security and privacy to address hypotheses H1–H3. Let yij be the amount of hectares farmer i allocates to weeding technology j such that the normalized allocation shares are given by sij = yij/50. By construction, allocation shares lie between zero and one and have to sum up to unity for each farmer i. This characteristic of the outcome variables motivates a fractional multinomial logit model (FMNL), the multivariate extension of the bivariate fractional logit model presented in Papke and Wooldridge (1996). The FMNL framework has no assumptions regarding the distribution of outcome variables. This allows for extreme values of zero and one at non-trivial probability, i.e. allocations of zero or 50 ha to one particular technology (which are contained in our data set) can be included (Mullahy 2015). However, the FMNL assumes independence of irrelevant alternatives (IIA), implying that the ratio of two alternatives is unaffected by the characteristics of other options. This may be inconsistent with the unit-sum share in the FMNL, but the varying implicit attributes introduced by our framing render our three weeding options mutually exclusive (Murteira and Ramalho 2016).7 We are therefore not concerned about inferential issues related to the IIA assumption. The conditional expectation of technology land shares sij is expressed as follows (e.g. Mullahy 2015; Ji and Cobourn 2018; Wang and McCarl 2021):
In Equation (5), Gj(xi; βj) is the multinomial logit link function and contains βj and xi to capture the technology-specific parameter vector and farmer-specific control variables, respectively. Setting technology J (BC) as the reference category (normalization of βJ = 0) further yields for the reference technology JEquation (6) and all other technologies jEquation (7), respectively:
The exact empirical model specification is given by Equation (8) in which Gj−1(xi; βj) is the inverse of Equation (5), with µj being the intercept, βj being the technology-specific parameter vector, and xi a matrix of farmer characteristics including sociodemographic and, the main interest of the baseline analysis, attitudinal constructs. The error term is represented by ϵij.
The functional specification of the FMNL requires a quasi-maximum likelihood estimation (QMLE) procedure (Papke and Wooldridge 1996). Assuming the link is correctly specified, the QMLE yields a consistent and asymptotically normal estimator |${\boldsymbol{\hat{\beta }}}$|. Estimated model coefficients represent effects on the log-odds ratios, i.e. the effect of a one-unit change in a covariate on the log of the probability of choosing technology j over the reference technology J. We calculate average partial effects (APEs), which represent the effects of a unit change in a continuous explanatory variable on sij, the observed share of land farmer i dedicates to technology j, while all other explanatory variables are held constant at the sample mean. APEs for discrete explanatory variables are interpreted as the effect on sij due to a change of a covariate from minimum to maximum. The sum of APEs across technology shares for a given covariate yields zero by construction (Mullahy 2015). Reported standard errors of APEs are calculated via the Krinsky–Robb algorithm (Papke and Wooldridge 1996).
3.2.2 Policy treatment effects
To assess the effect of hypothetical policy scenarios (treatments) on weeding decisions (H4–H6), we adopt the same FMNL approach as above. However, we extend the functional specification Equation (9) to include three dummies to account for treatments T1 and T2 individually and their combination T3:
Coefficients ɤ1j–3j are policy scenario coefficients and capture the effect of a respective policy treatment on area allocation to the j’th weeding technology. APEs are calculated as above. Figure 1 depicts the design of the business simulation game.
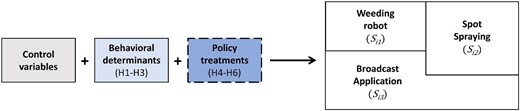
Visualization of business simulation game. Control variables and behavioral determinants (solid border) enter the analysis in both rounds; policy treatments (dotted border) enter the analysis only in round two. Si1, Si2, and Si3 represent the allocation shares associated with the respective weeding technology, as given in Equation (5).
3.3 Data
Data were collected between February and April 2022. We conducted an ex-ante power analysis based on a reference study with a comparable experimental setup to calculate the minimum required sample size.8
The email invitation to the survey was sent out via multiple channels, including farmers’ representatives of several German federal states and training farms (Tables S1 and S2). In total, 713 farmers started the survey by clicking on the invitation link. We excluded all participants who did not finish the study (n = 336; dropout rate = 47.1 per cent), those who did not grant us consent to use their anonymized experimental responses (n = 3), and those who answered a question about their understanding of the experimental instructions incorrectly (n = 40). The final data set consisted of 334 complete responses (Table 3). The average survey duration was 106 minutes and the mean values of vouchers and environmental donations were 25.7 and 9.2 Euros, respectively.
Selected sociodemographic and farm-structural sample characteristics.
| Sample (SD) | German farmer populationa | |
|---|---|---|
| Age in years | 43.3 (11.9) | 53.0 |
| Gender | 90.0 per cent male | 64.0 per cent male (full-time & part-time farmers), 89.0 per cent (full-time farmers only) |
| Farming experience | 24.0 (12.7) | N/A |
| Full-time farming | 82.0 per cent | 41.8 per cent |
| Family farm | 92.0 per cent | 86.7 per cent |
| Farming style | 83.0 per cent conventional | 90.1 per cent conventional |
| Farm size (ha)b | ||
| 0–5 | 0.9 per cent | – |
| 6–10 | 1.8 per cent | – |
| 11–20 | 5.7 per cent | – |
| 21–50 | 16.0 per cent | – |
| 51–100 | 28.0 per cent | – |
| 101–200 | 33.0 per cent | – |
| >200 | 15.0 per cent | – |
| Education | 60.0 per cent vocational training, state-approved/master's certificate; 37.0 per cent Bachelor/Master degree; 0.9 per cent doctoral degree 1.8 per cent none | 58.0 per cent vocational training, state-approved/master's certificate 9.0 per cent Bachelor/Master/doctoral degree 33.0 per cent other |
| Experience with SFT | 32.0 per cent | N/A |
n = 334.
See the Online Appendix for references used for comparison.
Due to substantial differences in farming structures across different German federal states, it did not appear feasible to calculate and present shares of different farm size classes of the German farmer population averaged across all federal states. Average farm sizes per federal state can be found in the additional references in the Online Appendix.
On average, our sample was about ten years younger than the average of the German farmer population. Presumably, younger farmers are more likely to regularly use a computer and thus participate in online surveys distributed through email. The share of male participants was clearly above the German average of 64.0 per cent of male farm workers. However, when assuming that participants were farm owners, the sample closely resembles the German average of 89.0 per cent male farm owners. The share of full-time farmers is twice as high as the German average (41.6 per cent), while family farms are only slightly overrepresented relative to the respective German population (86.7 per cent). With respect to farm size, we found disproportionately large farms in our sample, i.e. 75.0 per cent (47.0 per cent) of our sample cultivated 51.0 (101.0) or more ha (91.0 per cent of the participants originated in the federal states of North Rhine-Westphalia, Bavaria, Baden-Wuerttemberg and Lower Saxony with respective average farm sizes of 43.8, 36.0, 36.6, and 72.7 ha in the underlying populations).
Presumably, larger farms boast a higher degree of digitalization (Fleming et al. 2018) and may thus be more inclined to participate in online surveys. Compared to the nationwide average (90.1 per cent), conventional farmers were underrepresented in our sample, possibly due to the appeal that the technological context of our study might have had on farmers with an interest for sustainable herbicide-saving technologies. We found that our sample was disproportionately well educated. About 38.0 per cent had an academic degree in a related field. Finally, 32.0 per cent of all participants had prior experience with SFT. In light of the online mode of distribution and participation, respective distribution channels, and lack of representativeness of descriptive statistics, the present sample must be regarded as a convenience sample (Ellis et al. 2023), and the findings of subsequent analyses may not necessarily hold for the general German farmer population. However, in line with Hüttel et al. (2022), we argue that it represents a relevant group whose behavior may be illustrative of likely behavior of potential early adopters.
4. Results
4.1 Descriptive analysis
In the baseline, mean area allocation was 23.4 (BC), 17.4 (SS), and 9.1 (WR) ha for the full sample, indicating a general preference for BC and SS over the WR (Fig. 2). As expected, neither a Kruskall–Wallis rank sum test nor pairwise Mann–Whitney U tests point to significant differences in weeding decisions between the treatment groups (Tables S5–S8). Furthermore, we conducted Kruskall–Wallis rank sum tests and Pearson's Chi-squared tests to ascertain the balancing of continuous and binary control variables (sociodemographic, attitudinal, and farm structural variables) across treatment groups, yielding no significant differences. We can thus assume adequate randomization of treatments among participants in our sample (Table S16).
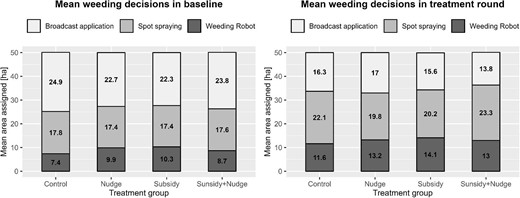
Mean weeding decisions in baseline and treatment round.
Mean technology allocations in the treatment round are surprising (Fig. 2). On average, participants allocated 15.7, 21.3, and 13.0 ha to BC, SS, and WR, respectively, indicating a substantial switch toward SS and WR from the baseline to the treatment round (Table 4). P-values of <0.001 from Wilcoxon rank sum tests imply statistically highly significant differences in technology choices between rounds; also see Table S3. This is confirmed by a statistically significant Wilcoxon-signed rank tests of within-group differences between rounds. Inspecting average weeding decisions per treatment group and comparing baseline and treatment rounds reveals that all groups, including the control group, show similar switching behavior (Table S4).
Average change of weeding technology allocation from round 1 to round 2.
| Technology allocation change (ha) | ||||
|---|---|---|---|---|
| Weeding technology | Control group (T0) | Subsidy (T1) | Nudge (T2) | Subsidy + nudge (T3) |
| Broadcast application | −8.6 | −6.7 | −5.7 | −10.0 |
| Spot spraying | 4.3 | 2.8 | 2.4 | 5.7 |
| Weeding robot | 4.2 | 3.3 | 3.8 | 4.3 |
| Technology allocation change (ha) | ||||
|---|---|---|---|---|
| Weeding technology | Control group (T0) | Subsidy (T1) | Nudge (T2) | Subsidy + nudge (T3) |
| Broadcast application | −8.6 | −6.7 | −5.7 | −10.0 |
| Spot spraying | 4.3 | 2.8 | 2.4 | 5.7 |
| Weeding robot | 4.2 | 3.3 | 3.8 | 4.3 |
Another Kruskal–Wallis rank sum test and pairwise Mann–Whitney U tests on treatment round results yield no significant differences between groups (Tables S9–S12). We further discuss this unusually large round effect below. Lastly, we calculated the changes in each weeding technology allocation for each group and tested them with pairwise Mann–Whitney U tests. No significant differences in the allocation changes were found (Tables S13–S15).
4.2 Multivariate analysis
The controlled hypothetical setting, in principle, allows us to focus on treatments and sociodemographic as well as attitudinal measures in a parsimonious model specification.9 Moreover, to account for multicollinearity, we dropped less informative covariates if their absolute correlation with any other covariate was 0.3 or higher (Table S17). AttEnv and PI (correlation of 0.37) are an exception to this rule in order to test for H1 and H2. Lastly, we dropped gender as a covariate given the fact that respondents are predominantly male. Sociodemographic variables were included as controls in all analyses.
4.2.1 Attitudinal measures
We start by looking at pre-treatment determinants of SWT allocation shares as per the FMNL regression.10Figure 3 presents APEs of the attitudinal constructs. A one-standard deviation increase in AttEnv is significantly associated with a 3.3 per cent (1.7 ha) WR area increase and a 5 per cent (2.5 ha) decrease in BC area allocation. By contrast, a standard deviation increase in PI is significantly associated with a 4 per cent (2 ha) increase in SS and a 6.1 per cent (3.1 ha) decrease in BC. Together, the baseline FMNL results support H1 and H2, i.e. AttEnv and PI significantly increase SWT adoption levels while broadcast usage is reduced. The APEs for the data trust construct are close to zero and statistically insignificant for all technologies (Table S19).
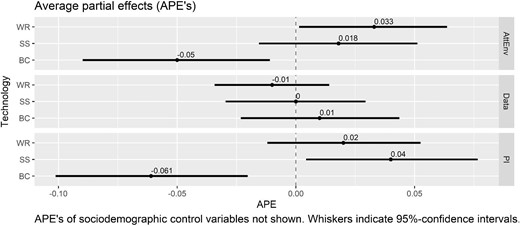
Baseline determinants of technology allocation shares (FMNL). AttEnv, pro-environmental attitude; PI, personal innovativeness; Data, trust in farming data security and privacy; BC, broadcast application; SS, spot spraying; WR, weeding robot.
4.2.2 Policy treatment effects
To assess the effectiveness of hypothetical policy scenarios, we ran another FMNL regression for the treatment round outcomes. The statistical pattern of attitudinal constructs remains robust compared to the baseline (Table S20). Figure 4 shows the APEs of policy scenarios on technology allocation shares. None of the policy treatments, i.e. the subsidy (H4), the nudge (H5), and their combination (H6), have a statistically significant effect on technology choice, and the large confidence intervals indicate considerable variability in responses. The signs of the respective APEs are in line with the hypotheses nonetheless. It is possible that unexplained variation in our model masks a relevant relationship between the policy treatments and hypothetical SWT adoption (Amrhein et al. 2019). While we acknowledge that the estimates are statistically indistinguishable from zero, the magnitudes of the estimated APEs for policy treatments suggest changes in area allocation in the order of 2 ha on average, which constitutes a potentially relevant relationship that merits further research. While T1 and T2 are mainly associated with higher (lower) area allocations to WR (SS), T3 correlates positively with area allocations to both SWT options.

Treatment round determinants of technology allocation shares (FMNL). T1, subsidy; T2, nudge; T3, subsidy + nudge; BC, broadcast application; SS, spot spraying; WR, weeding robot.
4.2.3 Exploratory analyses
The apparent round effect on technology allocations across all participant groups merits further scrutiny. Following Ji and Cobourn (2018), we used a pooled cross-sectional FMNL specification including a game round dummy (Rt) to capture temporal dynamics in our two-period experiment. Moreover, we clustered standard errors at the individual level (Womble and Hanemann 2020). The extended structural specification is depicted in Equation (10):
Given randomization, estimating Equation (10) is equivalent to calculating treatment effects using a difference-in-differences approach. Figure 5 summarizes the results from the extended model. The APEs of policy interventions resemble earlier results (Table S21). The APE of Rt is large and statistically significant, i.e. mere game repetition was associated with a 2.9 ha (4.4 ha) increase in area weeded with WR (SS) and a 7.3 ha decrease in area weeded with BC, a substantial reallocation. Potential explanations are discussed in Section 5.
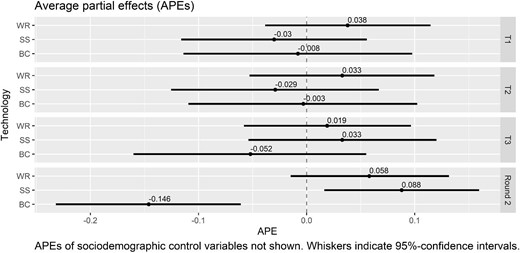
Treatment and round effects of technology allocation shares (pooled cross-sectional FMNL). T1, subsidy; T2, nudge; T3, subsidy + nudge; Round 2, dummy for effect of second round; BC, broadcast application; SS, spot spraying; WR, weeding robot.
Furthermore, we explored the role of organic farming on weeding decisions (Table S22) by extending the model in Equation (8) with a dummy variable controlling for organic farming. On average, participants with an organic farming background allocated 6 ha (12 ha) more to SS (WR) than conventional farmers [APEorganic SS: 0.121, 95 per cent CI (0.010, 0.232); APEorganic WR: 0.240, 95 per cent CI (0.165, 0.315)]. Our results also show that attitudinal differences exist between conventional and organic farmers in our sample. Conventional farmers boasted relatively higher levels of innovativeness, explaining high receptiveness toward new yet familiar technologies, i.e. SS.
Organic farmers scored lower on innovativeness but higher on AttEnv compared to conventional farmers, which arguably motivated them to gravitate toward new SWT associated with yet unprecedented ways of sustainable farming. Additionally, we assessed potential heterogeneity of policy treatment effects by extending Equation (9) with the organic farming dummy and interacting it with the treatment dummies (Table S23). The results suggest that organic farmers were more responsive to the policy treatments than conventional farmers [13.25 ha in response to the subsidy, APEorganic*subsidy WR: 0.265, 95 per cent CI (−0.005, 0.534) and 14.1 ha in response to the combined treatment, APEorganic*(subsidy+nudge) WR: 0.282, 95 per cent CI (0.012, 0.553)], indicating positive associations with a higher intention to use the WR in substantial economic and ecological magnitude. However, given the imbalance in our sample (norganic = 39, nconventional = 295), these explorative results must be interpreted with caution.
5. Discussion
This study focused on SWT as a technological alternative for German crop farmers using a lab-in-the-field experiment. Previous work suggests that farm-level adoption research must expand its focus to include behavioral factors in order to adequately depict the adoption process (Dessart et al. 2019; Hüttel et al. 2022). Correspondingly, we first studied the role of farmers’ AttEnv, PI, and trust in farming data security and privacy as adoption determinants. SWT were explicitly framed to encapsulate novel technology characteristics, and relevant sociodemographic factors were controlled for. The baseline analysis showed that AttEnv and PI were positively associated with higher (lower) SWT (BC) adoption, yielding support for the corresponding hypotheses H1 and H2. Interestingly, higher adoption of WR was primarily associated with higher levels of AttEnv, while higher levels of SS, the intermediate and somewhat less innovative SWT, were primarily associated with higher levels of PI. Arguably, this finding was driven by attitudinal differences between the conventional and organic farmers in our sample, with the former scoring higher with respect to innovativeness and the latter revealing a higher AttEnv. We could not confirm previous research (e.g. Jakku et al. 2019; Garbriel and Gandorfer 2020; Mohr and Kühl 2021) reporting that farmers’ (lack of) trust in the privacy of data collected by SFT is indicative of adoption intentions (H3). Except for Mohr and Kühl (2021), who base their findings on a small sample, in which 43 per cent of the subjects were non-farmers, our study is the first to conceptualize and quantify the effect of a data trust construct in this rigorous manner, which limits further comparison of our results with previous quantitative research. However, the insignificance of our finding may owe to the fact that young and educated managers of large farms are somewhat overrepresented in our sample vis-à-vis the average German farm population. Variation in attitudes toward security and privacy of farming data may thus not be sufficient to explain technology choices in the experiment. Nevertheless, in light of prevalent qualitative evidence, future studies should continue to develop an understanding of the circumstances in which concerns around farming data become relevant for technology adoption. The overarching message from the baseline results is that farmers with higher scores for environmental attitude and innovativeness were more willing to forego private returns to the benefit of society than participants who scored lower in these attitudinal constructs. Trust in farming data privacy, however, was not a relevant determinant of SWT adoption.
Our second objective was to assess policy scenarios to enhance farmers’ adoption of societally desirable SWT. None of the treatments had a statistically significant effect on SFT adoption due to very heterogenous allocation shares. Specifically, the level of partial compensation and design of the green nudge seemed to be insufficient as an adoption incentive for this particular sample. Having acquired sufficient power via adequate sample size, we acknowledge that statistical insignificance of our results prevents the inference of conclusive treatment effects. However, in line with the ongoing debate on the use of P-values, we note that our findings may indicate quantitatively relevant effects that justify further exploration in adapted research designs (Heckelei et al. 2023). All policy effect estimates exhibited the expected sign, i.e. the subsidy (H4) and green nudge (H5) had a net positive association with the adoption of SWT. Notably, in both scenarios, this tendency was primarily driven by increased allocation to WR, whereas SS allocation shares dropped. The parameter estimates of the combined policy treatment (H6) were higher than those of the individual treatments. BC allocation dropped somewhat more, and SS and WR allocation were more balanced than under the single policy regimes. This is in line with our earlier line of argumentation. Farmers supposedly incorporate both personal and societal interests into their managerial decisions (Lynne et al. 2016) to simultaneously address personal and other interest. Similarly, to Czap et al. (2015) and Kuhfuss et al. (2016b), our findings may hint at the presence of such a combined policy effect. Interestingly, our results suggest organic farmers are more responsive to the policy treatments than conventional farmers. This finding is in line with the findings of a recent simulation-based study on SWT adoption in which Shang et al. (2023) found that organic farms are likely willing to pay substantially more for automated technology than conventional farms.
Some implications arise, nonetheless. Farmers showed a clear preference for broadcast allocation over SS over WR (Fig. 2). While an overall preference for BC is expected given the higher hypothetical profit margin, the preference of SS over WR likely reflects varying degrees of familiarity and expertise with the respective technologies and AttEnv in our sample of farmers. Uncertainty associated with the novel characteristics of WRs, though not made explicit in our framing, may also have played a role. Overcoming the diverse potential barriers to SWT adoption may thus require a combination of technology maturation and carefully designed policy incentives. Along these lines, Rogers (2003) theorized that early adopters with an innovative, uncertainty-loving, and intellectual mindset can act as agents of change to initiate and subsequently accelerate the innovation process by being leading examples for their colleagues. Against this backdrop, Hüttel et al. (2022) found the impact of social norms driven by innovative peers and other technology users to be a major determinant of farmers’ intention to use variable rate nitrogen application in crop farming. Similarly, Suvanto et al. (2020) showed that a higher entrepreneurial disposition, including low risk-aversion and innovativeness, was associated with a higher likelihood of starting the cultivation of sustainable protein-rich crops, and, finally, Blasch et al. (2020) looked at the adoption of precision farming tools in general to find that operators’ higher innovativeness and openness toward eco-friendly farming practices were relevant predispositions to uptake. Our findings match this line of research, which justifies the suggestion that targeting innovative and pro-environmentally minded farmers would appear as a promising element in early dissemination strategies based on our findings.
We could not reject the null hypothesis related to H4–H6 after conducting our experiment, but this certainly does not imply that policy interventions do not matter for promoting the adoption of environmentally desirable SFT. All estimates of policy treatments, albeit statistically not significant, consistently pointed toward higher levels of WR adoption at a policy-relevant magnitude of up to 2.2 additional hectares on a single hypothetical farm of 50 ha. In the German agricultural context, this is a relevant area to experiment with new technologies. If anything, the null result suggests that agricultural field robots, if not profitable from a purely private perspective, must come with policy interventions that at least compensate for opportunity cost and perceived additional downside risk (Finger 2023). Green nudges alone, on the other hand, may not work to encourage adoption among all types of farm managers at this stage of technological development. Instead, as pro-environmental discourse becomes mainstream in the public sphere, the occasional scapegoating of agriculture may eventually lead to protest behavior with counterproductive responses to behavioral nudging attempts.
Some caveats apply. Although we could rule out randomization failures and control group contamination, participants in the control group ventured substantially more hectares into SWT in the second round than in the first round. We speculate that this round effect was driven by a combination of the hypothetical experimental setting and the perceived uncertainty associated with adopting a new technology (although not reflected in the actual fixed payoffs). After being reassured in the first round that payoffs materialized as promised, participants also became more familiar with the survey tool and eventually allocated more hectares to the less well-known technology options. Increased adoption may not only be indicative of gambling behavior but also reflect a subjectively perceived reduction in uncertainty. Our findings reveal the importance of including a control group in both baseline and treatment rounds to reduce the risk of overinterpreting treatment effects derived from uncontrolled before-and-after comparisons. Our results, however, are robust to excluding participants with extreme switching behavior. Round effects are caused by the order of the decision tasks within an experiment (Carlsson et al. 2012) and should thus have affected all participants in the same way in our experiment. Hence, our treatment effect estimates remain internally valid. Future work in this domain should pay careful attention to round effects by playing several rounds until stabilization of preferences is observed. We also acknowledge that the hypothetical nature and degree of abstraction created by reducing weed management to a simple area allocation may have confused or upset some participants, causing additional response heterogeneity or deviations from behavior in reality. We tried to address this aspect by making participation incentive-compatible and making payouts of vouchers and donations depend on decisions within the experiment. Moreover, our experiment depicted farmers’ intended adoption at one particular point in time, making it difficult to differentiate between immediate and long-run adoption determinants. All these are known limitations of lab-in-the-field experiments (e.g. Thomas et al. 2019). As more SFT reach technological maturity, future adoption research would benefit from controlled and potentially longitudinal intervention studies in which some of these limitations can be addressed by conceptualizing adoption as a multidimensional process (Khanna et al. 2022). This would enable insights into whether policy can have an influence on farmers’ pro-environmental behavior and attitudes in the long run. While this has been shown for some types of human conservation behavior in general (Akerlof and Kennedy 2013), no conclusive evidence exists for the agricultural context. Finally, the findings stem from a non-representative convenience sample and may therefore only apply to farmers with similar demographic and structural profile among which, however, early SWT adoption is most likely to be observed, rendering them a relevant subject pool to study.
6. Conclusion
The present study brings evidence from an economic experiment to the debate on adoption determinants of SFT, an emerging technology field with the potential to enable a sustainable agricultural transformation (King 2017). In light of current medium to low adoption rates (Mizik 2022), this debate is still largely based on assumptions and demonstration farm data and thus requires a systematic empirical foundation. Our study shows that German farmers’ AttEnv and innovativeness seem to be relevant for the uptake and diffusion of SWT, indicating some willingness to forego private returns in favor of environmentally sustainable herbicide-efficient weeding options. However, data concerns, contrary to widely held concerns, seem to play a negligible role. The subsidy and the green nudge did not significantly affect SWT adoption, neither individually nor in combination, but the response to our treatments is positive on average and should be explored in future research. Thus, our findings inform the design of policy incentives required to accelerate the adoption of socially desirable agricultural innovations that may otherwise fail to unfold their full potential.
Acknowledgments
We would like to thank our partners in the Chamber of Agriculture of the German federal state of North Rhine-Westphalia for the collaboration and continued feedback regarding formulations and terminologies in the experimental instructions, and their support to distribute the survey in their federal state. Moreover, we want to thank Matthias Sand (GESIS, Leibniz-Institute für Sozialwissenschaften, Survey Design, and Methodology) for insightful and inspiring discussions regarding sampling and econometric procedures. Lastly, we want to thank Xinde ‘James’ Ji and Philip Womble. Their invaluable advice enabled us to implement the proposed econometric procedures of the present study via their package ‘fmlogit’ in R.
Funding
This study was funded by the Deutsche Forschungsgemeinschaft (DFG, German Research Foundation) under Germany's Excellence Strategy—EXC 2070—390732324—PhenoRob.
Data Availability
The data, R code and Online Appendix underlying this article are available in Centre for Open Science (OSF) at https://osf.io/nv8kp/?view_only=d1f3a00bd1e940b48b8c80b15e7cc4f8 in the respective folder named after the title of this paper.
Footnotes
See Blumenthal-Barby and Burroughs (2012) for a comprehensive review of nudge design principles.
Pre-registration: https://osf.io/b9ryz/?view_only=feba413987bf429d826ae8665eed15fc. The survey was part of a larger project. Only parts are used for the present study. The full survey, including formulations of attitudinal questions, business simulation game instruction, alongside sociodemographic and farm structural survey questions, can be found in the Online Appendix. The choice of two game rounds was motivated by a similar lab-in-the-field experimental study by Thomas et al. (2019). The decision on the hypothetical farm size of 50 ha was made after consultation with our partners in the Agricultural Chamber of NRW. Difficulties in achieving the minimum sample size required the acquisition of additional survey distribution channels in other federal states with different average farm sizes. However, for internal validity we maintained the original hypothetical farm size of 50 ha in the simulation game.
The explanation of how the experiment was made incentive-compatible can be found at the end of the section.
We tested the attitudinal constructs for internal consistency, yielding Cronbach's alpha values of 0.9 (AttEnv), 0.86 (PI), and 0.49 (DT). We are aware that the latter is below the acceptable level of 0.7. However, after dropping one item from the construct, yielding a Cronbach's alpha of 0.8, results and interpretations of all multivariate analyses remained robust. We thus decided to retain the original construct.
Based on discussions with experts (NRW Agricultural Chamber), we framed BC to be environmentally neutral instead of environmentally harmful to avoid irritation among participants, potentially leading to reduced participation willingness.
The exact wording of the environmental nudge was (translated from German): ‘In their daily work, farmers realize the principles of good agricultural practice in manifold ways. Besides the production of safe and healthy food and other agricultural products, this also means that they cater to a careful handling of the environment and natural resources. The usage of innovative and herbicide saving technologies offers farmers an additional opportunity to contribute to a more sustainable agriculture. Thus, they promote the stability of ecosystems and the protection of biodiversity. Thereby, the sum of individual farmers decisions can significantly enhance the well-being of society and the security of the natural basis of life for current and future generations.’
Murteira and Ramalho (2016) discuss the Dirichlet-Multinomial (DM) model as an alternative fractional response modeling approach. While the DM model is more flexible, it is not as robust to misspecification as the FMNL is (Becker 2014). Moreover, the DM requires assumptions about the distribution of shares, a condition that rarely holds in practice (Becker 2014). When comparing both approaches, Murteira and Ramalho (2016) found only slight efficiency advantages of the DM. In another comparison, Mullahy (2015) found that the APEs did not differ substantially and concluded that the DM model does not come with particular benefits over the FMNL. We thus opted for the FMNL as the main modeling framework for our study.
The linear regression model in Thomas et al. (2019) yielded an R² of 0.12, which translated to a Cohen's f² of 0.136, representing a ‘small’ effect size. To detect such an effect size with a significance level of 0.05 and a power of 0.9, we would require at least 215 observations.
The pre-registration foresaw including farm structural variables. However, excluding them had no major qualitative effect on the coefficients of main interest, which justified the parsimonious model above.
See Table A18 for an additional Tobit regression as foreseen by the pre-registered analysis plan.
