


Abstract
Aged-beef has historically been available in high-end establishments, but investigation into consumer preferences for aging is increasingly important as it has become more readily available. Consumer perceptions of and willingness-to-pay (WTP) for aged-beef under two methods dry-aging and wet-aging, were studied in a representative sample of n = 1,275 US residents alongside USDA quality grades. In general, US residents are not knowledgeable regarding aged-beef but have a positive direct-stated perception of the practice. Respondents self-reported familiarity with USDA grades Prime and Choice and perceived them as superior beef attributes. Half of respondents were randomly assigned to receive a low information treatment about beef aging, while the other half saw a high information treatment with additional information about beef aging. A likelihood ratio test indicated that the two information groups could not be pooled for analysis, and a two-class latent class model was estimated for both the low information and high information treatments. Respondents in class 1, in both information treatments, had stronger preferences for beef and were more receptive of beef aging, with the exception of wet-aged beef in the low information treatment, which they were not willing to pay a premium for. The second latent class, which is probabilistically smaller, had negative WTP estimates for both aging methods under both information treatments provided. Additional information regarding beef aging was found to have a positive impact on mean WTP for dry-aged beef in latent class 2. All models revealed positive mean WTP point estimates which ordinally behaved as expected with USDA Prime commanding the highest premium and Select the least.
1. Introduction
Aging is a practice that is shown to improve tenderness, juiciness, and flavor in beef (Kim, Kemp & Samuelson 2016). The main objective of this inquiry is to quantify consumer perceptions of and willingness-to-pay (WTP) for beef aging alongside USDA beef grades, which are both attributes regarded as indicators of beef quality in the US Beef quality, in the form of tenderness and palatability, have been shown amongst the most important drivers of beef demand (Smith et al. 1995) and to be factors that the industry has the ability to improve upon (Schroeder, Tonsor and Mintert 2013). Because of the standard times that it takes for beef to reach consumers after fabrication, most beef purchased in retail or food service establishments is unintentionally aged. This article researches intentional beef aging beyond standard industry times and advertised to consumers as aged-beef. Two methods for aging beef are considered: dry-aging and wet-aging.
Aging beef is used by a very small number of meat purveyors for upscale hotels and restaurants and by an even smaller number of retailers for the gourmet market (Savell 2008). Aged beef, which was intentionally aged and marketed as such, was not readily marketed to the average consumer in the US until the advent of online meat retailing. The aging of beef steaks in the supply chain, occurring naturally due to time in production, transit, and storage has been documented to be around 25.9 days, by the time steaks arrive at retail establishments (Martinez et al. 2017) but consumers may not be aware of the age of beef nor were the benefits often actively communicated at the point of sale. Increasingly, now consumers can now choose to purchase aged steaks online in outlets like Omaha Steaks (Omaha Steaks International Inc, 2021), Snake River Farms (Snake River Farms 2021), Wild Fork Foods (Wild Fork Foods 2021a) amongst others, and have them delivered to their homes. These online meat providers offer detailed information regarding the rarity, improved eating experience, and craftiness of the beef aging process. Furthermore, some of these online retailers specialize in or market specifically one of the aging methods. For example, Wild Fork Foods shares information about dry-aged and wet-aged beef in their website, while stressing one benefit of wet-aging namely moisture preserving, compared to dry-aged beef (Wild Fork Foods 2021b). The increasing commercial availability of wet-aged and dry-aged beef, along with the lack of published literature on consumer preferences towards these methods motivates this study.
Increased beef quality comes at an additional cost. In the long run, retail prices reflect cost of production (Schroeder & Mark 2000), and though consumers care about quality, price is also very important (Schroeder, Tonsor and Mintert 2013). Since its inception in 2020, the Meat Demand Monitor (MDM), a monthly tracker of US consumer preferences, views and demand for meat, consistently finds that taste and freshness are more important than price in consumers protein purchasing decisions (Tonsor 2022). Increasing beef quality through aging may have an impact on the color stability of fresh beef during retail display, which could affect consumer's perception of freshness, in addition to the always present cost considerations. In addition to the cost of increasing beef quality, industry practitioners need to understand consumers receptibility towards practices like aging. The US Department of Agriculture (USDA) beef grading system that standardized tenderness, juiciness, flavor, and yield (Meadows 2019) could offer a replicable model to transform beef experience attributes, those that are not observable before consuming the product, into searchable attributes, those that can be corroborated before consuming the product. In this context, aged beef could be graded for improved palatability and certified prior to purchase, to offer an increased guarantee for the consumer, regarding attributes that they care about when purchasing beef.
Choice experiments carried out with different information levels regarding a production practice or a meat attribute have been found to have an effect on consumer's valuation for beef attributes, but only in specific circumstances. Consumer choices have been found to be insensitive to information treatments in previous literature such as Beriain, Sanchez, and Carr (2009), a WTP for US meat study, across different production and product quality information treatments. Tonsor, Olynk, and Wolf (2009) found consumer choices for pork attributes where insensitive to different animal welfare information treatments. Merritt et al. (2018) conducted a study to estimate consumer WTP for Tennessee certified beef information about the certification program increased the premium consumers would pay for beef, but only in some cases.
1.1. Beef-aging
Postmortem aging is one of the most extensively practiced methods in the meat industry across the globe to improve palatability attributes (Kim et al. 2018). During the aging process, considerable improvements in eating quality attributes occur mainly through naturally existing endogenous proteolytic enzymes, breaking down structural myofibrillar proteins, resulting in beef that is more tender, juicier, and more flavorful (Kristensen & Purslow 2001; Kemp et al. 2010; Kim, Warner, & Rosenvold 2014). Currently, two types of methods for aging beef have been adopted in the meat industry, the more traditional dry-aging and the more common wet-aging.
While both wet-aging and dry-aging methods in beef have the potential to give the consumer an improved eating experience, the two methods adopt different environmental conditions, which in turn result in considerably different product yield, market value, and palatability attributes. Wet-aging is the most common and extensively practiced method by the meat industry, which adopts vacuum-packaging of beef sub-primals or cuts and storing under a refrigerated room (open called cooler) for a range of 3 to 102 days (Martinez et al. 2017). With the continued advancement in packaging technology, wet-aging provides numerous advantages, such as convenience of handling and distribution, extension of shelf-life, and efficiency in operation space needed during aging. Wet-aging results in relatively equivalent positive aging impacts on eating satisfaction (specifically, no difference in tenderness) compared to the dry-aging counterpart (Laster et al. 2008; Dikeman et al. 2013). However, some negative flavor characteristics have been described in association with wet-aging, including the terms, bloody, serumy, livery, fishy, metallic, and sour (Warren et al. 1992; Jeremiah and Gibson. 2003; O'Quinn et al. 2016). These attributes are considered less than adequate for most beef consumers.
Dry-aging, in contrast, is a centuries-old natural process, where fresh beef (carcasses, primals, or sub-primal cuts) are placed in a cooler without protective packaging for weeks to months (Kim et al. 2018). Although dry-aging is no longer considered as a predominant practice, it has been recently regaining its popularity and interest primarily due to its unique dry-aged taste/flavor, such as brown-roasted, beefy/brothy, buttery, nutty, roasted nut, and sweet flavor, which are attributes that are considered superior to wet-aged beef (Warren et al. 1992; Campbell et al. 2001; O'Quinn et al. 2016; Kim et al. 2016). In addition to flavor, dry-aging also significantly improves tenderness and juiciness (Campbell et al. 2001). In this regard, dry-aging is most typically practiced by local meat processors and small meat purveyors for upscale hotels, restaurants, and gourmet markets.
This study provides a unique contribution as the first known comprehensive study of consumer perceptions and WTP for the two methods of aging beef namely wet-aged and dry-aged. Given the likely relationship between beef quality and preferences for aging, we investigate aged beef WTP alongside USDA grades. Lastly, we investigate the role of additional information provided to consumers regarding beef aging during purchase decisions.
1.2. Materials and methods
A survey instrument was deployed between December 7th, 2020 and December 16th, 2020 using Qualtrics, an online survey tool, to collect household demographic information, general perceptions, buying patterns, and preferences for attributes related to beef and to conduct a hypothetical choice experiment concerning aging methods in beef and USDA grades. Kantar, was used to obtain survey respondents through the use of their large opt-in panel database. Respondents were required to be 18 years of age or older to participate. The sample was targeted to be representative of the US population in terms of gender, age, income, education (U.S. Census Bureau 2019a), and geographical region of residence (U.S. Census Bureau, 2019b) and quotas were built into the survey to facilitate the collection of a representative sample. Regions of residence were defined as in the Census Bureau Regions and Divisions (U.S. Census Bureau, 2019b). In total, 1,275 completed surveys were collected.
After the first set of questions pertaining to demographics and meat shopping basics, respondents participated in a discrete choice experiment. Discrete choice experiments exploit Lancaster's (1966) proposition that consumers maximize utility from different attributes related to a product rather than deriving utility from the product itself (Lusk and Hudson 2004). Since an individual's utility is not directly observable by the researcher, the consumer's choice amongst a set of choices, reveals which alternative provides the greater utility. Respondents were asked to choose between two steak purchasing scenarios or the option ‘I do not choose to purchase either option A or B’ (option C). Each scenario (A and B) included the aging method, namely ‘Wet-Aged’, ‘Dry-Aged’, or ‘Not Aged’; the USDA quality grade, namely ‘Prime’, ‘Choice’, ‘Select’, or ‘Ungraded’ and a price level. The prices presented were |${\$}$|5.49/lb., |${\$}$|6.99/lb., |${\$}$|8.49/lb., |${\$}$|9.99/lb., and |${\$}$|11.49/lb. The price levels were selected to reflect the prices in the time frame during which the survey was administered using national USDA's retail prices (USDA, AMS 2020) from December 6th, 2019 to December 20th, 2019 which is a year prior to when the survey was administered.
SAS OPTEX was used to design the discrete choice experiment and to determine the specific combination of attribute levels seen by respondents in the choice experiment (Lusk and Norwood 2005). The statistical design that maximized D-efficiency was chosen, with a score of 82.9. The final design resulted in forty-one choice scenarios, out of which four were considered non-sensible combinations, resulting in an adjusted total of thirty-seven choice sets. Presenting each respondent with 37 questions may result in survey fatigue, which is known to decrease data quality (Galesic and Bosnjak 2009). Therefore the thirty-seven choice sets were randomly assigned into four different blocks. Three of the blocks contained nine choice sets and one of the blocks contained ten choice sets.
Respondents were presented with a hypothetical beef steak purchasing scenario in each of the choice sets. To estimate consumer demand for novel goods or attributes, economists often turn to hypothetical contingent or experimental markets (Lusk and Hudson 2004). Respondents were informed that steak options presented in each choice scenario had the same characteristics (e.g. similar packaging, brand, weight, etc.) except for varying levels of the attributes (aging method, quality grade, and price). ‘Cheap talk’ proposed by Lusk (2003), was employed in the instructions of the experiment, with the intention to lessen hypothetical bias. The cheap talk statement provided to respondents before engaging with the choice sets in this study was, ‘The experience from previous surveys is that people often state a higher willingness to pay than what a person actually is willing to pay for the good. It is important that you make your selections like you would if you were actually facing these choices in your retail purchase decisions, noting that allocation of funds to these products means you will have less money available for other purchases.’ An example choice scenario is displayed in fig. 1.
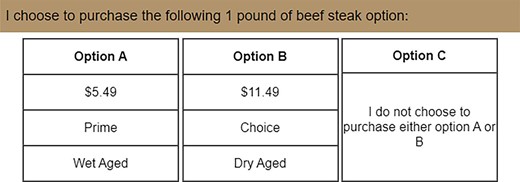
Example choice scenario.
To understand whether additional information regarding both aging methods, dry and wet-aging, had any significant impact into respondents WTP for aged beef, information regarding beef aging provided in the introduction to the WTP experiment was presented in two distinct levels. Respondents were randomly assigned to either a ‘high information’ level or a ‘low information’ level. Each information level -high and low-contained the same thirty seven questions (divided into four blocks, as described earlier in the methods). The low information level included a basic level of information where respondents were given a basic definition of aged beef ‘Two methods of aging beef are wet-aged and dry-aged. The aging is generally believed to result in a better beef eating experience’. The high information level included a general statement regarding aged beef ‘Two methods of aging beef are wet-aged and dry-aged. The aging process allows beef's natural enzymes to break down the meat. This results in beef that is more tender, juicier, and more flavorful.’ A definition for wet-aging is ‘Wet-aging is a process where meat is kept in a vacuum pack during aging. This process is commonly applied to current product due to the simplicity of the process.’ A definition for dry-aging is ‘Dry-aging is a process where meat is exposed to a controlled refrigerated environment during aging without a barrier. This process causes moisture loss, however, it intensifies the beef flavor. Dry aging for 30 days is a common timeframe.’, and a definition for no-aging is ‘Not aged typically available steak in the super market.’ Appendix A provides both information treatments. Information regarding the USDA grades was given uniformly to all participants in the Choice Experiment; Appendix B for the beef quality grade information provided. After Louviere, Hensher, and Swait (2000), a likelihood-ratio test was used to determine if participants amongst information treatments could be pooled for modeling analysis.
Latent Class Models (LCM), derived from random utility theory, allow researchers to account for heterogeneous preferences for the attributes studied (Train 1998; Boxall and Adamowicz 2002; Lusk and Hudson 2004). Given the aim of this study, namely to characterize WTP for aged beef, and expectations of heterogeneous preferences for beef attributes, the LCM model was deemed the most appropriate. A LCM model was chosen over the Random Parameter Logit (RPL) model, which also accounts for preference heterogeneity, due to its key feature, namely LCM models can help explain the source of heterogeneity by intrinsically sorting consumers into a number of heterogeneous latent classes (Ouma et al. 2007), where each latent class is characterized by homogeneous preferences (Boxall and Adamowicz 2002).
In order to consider the entire preference distribution of WTP estimates, rather than just the mean along with considering variability in parameter estimates, we used the Krinsky and Robb method of parametric bootstrapping (Krinsky and Robb 1986). To statistically compare WTP for each attribute between different information treatments, we used the complete combinatorial method as outlined by Poe, Giraud, and Loomis (2005).
Survey responses were tabulated using Stata. The test of proportion was carried out to determine whether proportions of respondents within various demographic categories were statistically representative of the US population as measured by the US Census Bureau. Information from the choice experiment, including the LCM estimation, was analyzed using NLOGIT. The Krinsky and Robb and the Poe, Giraud and Loomis method were both carried out in MATLAB.
2. Results and discussion
2.1. Demographics
Demographics of the sample of respondents, summarized in Table 1, closely matched those of the US population. The following demographic categories were statistically higher than in the US census female; 65+ years; |${\$}$|25,000–49,999 annual household income; respondents who had some college, but no degree earned; and respondents with associate degrees or bachelor degrees. The following demographic categories were statistically lower than in the US census males and respondents who had less than high school education. The samples of respondents assigned to each of the two information treatments did not differ for any demographic categories except for the proportion of respondents residing in the South.
Respondent's demographics, comparison to U.S. census, and comparison between respondents with the two information levels.
| Sample | ||||
|---|---|---|---|---|
| Demographics | US census | Full sample (n = 1,275) | Respondents with high information (n = 639) | Respondents with low information (n = 636) |
| Male | 49Ϯ | 44 | 45 | 44 |
| Female | 51Ϯ | 56 | 55 | 56 |
| Total | ||||
| Age | ||||
| 18 to 24 years | 12 | 11 | 12 | 11 |
| 25–34 | 18 | 16 | 16 | 16 |
| 35–44 | 16 | 16 | 15 | 16 |
| 45–54 | 16 | 16 | 16 | 15 |
| 55–64 | 17 | 18 | 18 | 18 |
| 65+ | 21Ϯ | 23 | 22 | 24 |
| Income | ||||
| 0–24,999 | 18 | 20 | 20 | 19 |
| 25,000–49,999 | 20Ϯ | 22 | 23 | 21 |
| 50,000–74,999 | 17 | 16 | 16 | 17 |
| 75,000–99,999 | 13 | 11 | 11 | 12 |
| 100,000+ | 31 | 30 | 30 | 31 |
| Less than high school | 11Ϯ | 3 | 3 | 3 |
| High school graduate (includes equivalency) | 27 | 27 | 27 | 28 |
| Some college, no degree | 20Ϯ | 23 | 23 | 23 |
| Associate's degree or Bachelor's degree | 29Ϯ | 33 | 32 | 33 |
| Graduate or professional degree | 13 | 14 | 16 | 13 |
| Northeast | 17 | 19 | 21 | 17 |
| South | 38 | 36 | 33Θ | 39 |
| Midwest | 21 | 22 | 22 | 22 |
| West | 24 | 24 | 25 | 22 |
Ϯ Percentage of respondents is statistically different than the percentage of the US population according to the US census (year).
Θ Percentage of respondents is statistically different than the percentage of respondents that received the low information level.
2.2. Beef buying behavior and perceptions
Eighty-three per cent of respondents indicated that they eat beef at least once per week, 13 per cent reported eating beef less than one time per week, and 5 per cent reported that they never eat beef. Beef was the second most often consumed protein by respondents, after chicken, which was reported to be consumed at least once a week by 89 per cent of respondents.
The attributes respondents selected as most important when buying beef were flavor and tenderness (45 per cent and 38 per cent of respondents, respectively). Color and juiciness were selected as the most important attribute by 8 per cent and 9 per cent of the sample, respectively. Regarding USDA beef grading, 38 per cent of respondents reported to have purchased USDA Prime in the past year, 48 per cent reported to have bought Choice, 26 per cent Select, and 6 per cent Ungraded over the past year. Thirty-two per cent of respondents reported that they did not know the USDA grade of the beef they purchased.
The prominent role of tenderness and flavor expressed by consumers in this study is consistent with the overall literature in beef demand, which highlights the highly important role of those attributes (Smith et al. 1995; Schroeder, Tonsor and Mintert 2013). However, dry aging can result in discoloration (Savell, 2008) which may pose concerns consumers who care about color. Consumers ranking of tenderness, juiciness, and flavor considerably above color may give the beef industry and stakeholders confidence regarding the potential acceptability of aging methods that improve the attributes that they care about the most. This is aligned with the MDM tracking, which consistently finds consumer's mean importance of appearance well below that of taste when purchasing protein (Tonsor 2022).
Respondent's familiarity with a selected set of common beef attributes including dry-aged and wet-aged beef was investigated and the results are reported in Fig. 2. The attributes which respondents had the most self-reported familiarity with were USDA grades Prime and Choice, along with Angus Beef. Of particular relevance to this research, wet-aged was ranked as the attribute that respondents had the least level of familiarity with by the largest share of respondents, followed by Wagyu Beef and dry-aged beef.
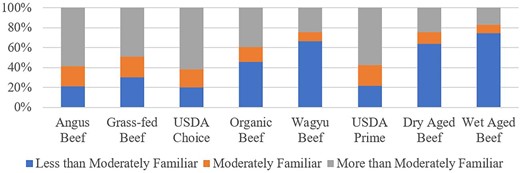
Respondents level of familiarity with labels and attributes of beef.
Respondents were asked to rank their perceived level of superiority amongst a set of common beef attributes and their responses are summarized in Fig. 3. The largest share of respondents ranked USDA Prime as the most superior beef attribute followed by Certified Angus Beef. The attribute ranked as ‘Less Superior’ by the largest share of respondents was wet-aged beef followed by dry-aged beef.
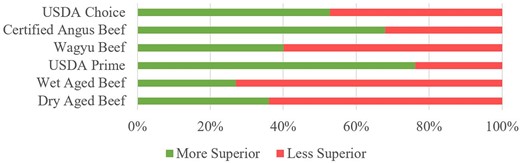
Respondent's superiority perception towards beef attributes.
2.3. Perceptions of beef aging
Respondents were asked specifically about beef aging after they participated in the choice experiment. Specifically, they were asked about their perception, familiarity with and prior experiences surrounding aged-beef; responses are summarized in Table 2. Because different information treatments during the choice experiment may have influenced responses and the likelihood-ratio test indicated that the two sub-samples could not be pooled, answers are reported by information treatment groups. Consistent with the reported low levels of familiarity with beef aging, only about a third of the sample reported to have ever eaten dry-aged beef. Regardless of whether respondents have actually eaten dry-aged beef, the majority of them reported to be indifferent regarding their perception towards dry-aged beef and a larger share of the sample reported a positive perception towards it than a negative perception. When directly asked if they would be willing to pay a premium for aged beef, a larger share of respondents indicated yes for dry-aged beef than for wet-aged beef. Overall, less than half of respondents indicated to be willing to pay a premium for aged beef.
Respondents self-reported experience with, perception of and preferences for beef aging.
| % of Respondents | ||
|---|---|---|
| Question | High information (n = 639) | Low information (n = 636) |
| Have you ever eaten dry-aged beef? | ||
| Yes | 31 | 32 |
| No | 27 | 28 |
| I do not know | 42 | 40 |
| What is your overall perception of dry-aged meat? | ||
| Definitely positive | 11 | 13 |
| Mostly positive | 31 | 28 |
| Indifferent | 52 | 53 |
| Mostly negative | 3 | 4 |
| Definitely negative | 3 | 2 |
| Before today, how familiar were you with aging of meat as a mechanism to improve the eating experience? before preparing? | ||
| Not knowledgably at all | 33 | 34 |
| Slightly knowledgeable | 33 | 30 |
| Moderately knowledgeable | 24 | 24 |
| Very knowledgeable | 7 | 7 |
| Extremely knowledgably | 3 | 5 |
| When you purchase beef, do you intentionally let it age (letting it remain under refrigeration, but not frozen, for a number of days before preparing)? | ||
| No, and I am not interested in such a practice | 35 | 35 |
| No, but I would consider it | 28 | 27 |
| Yes, sometimes | 25 | 27 |
| Yes, always | 6 | 7 |
| I do not purchase or consume beef steaks | 5 | 5 |
| Would you be willing to pay a premium for aged beef? | ||
| Yes, for dry-aged | 18 | 19 |
| Yes, for wet-aged | 9 | 8 |
| Yes, for dry-aged and wet-aged | 17 | 20 |
| No | 56 | 53 |
Mostly positive direct-stated perceptions by respondents towards dry-aged beef could be an early indicator of potential receptibility towards this practice. However, knowledge levels on beef aging are very low. These facts coupled with consumers strong preferences for tenderness and flavor may highlight a potential avenue for beef marketers to signal the beef aging improvements on attributes to consumers.
2.4. Latent class models
The LR test was employed using a linear RPL model to determine if the samples of respondents who saw the basic versus enhanced information sets could be pooled. The hypothesis that observations across respondents receiving the two alternative beef aging information treatments was rejected, thus the results of this study are reported for each information treatment separately. The LCM model displayed with two latent classes was selected using the following criteria: Bayesian Information Criterion (BIC), the significance of the estimate for the price coefficients, the price behavior, and finally the class size were all analyzed for models varying from two to six classes. A final consideration was the feasibility of having comparable numbers of classes across the two sub-samples with varying information treatments.
Separate LCM models for each of the information treatments (respondents with high beef aging information and respondents with low level information) are presented in Table 3.
Latent Classes coefficients (standard errors) and estimated mean willingness-to-pay (WTP) [95 per cent confidence interval] for aged-beef by Information levels (n = 1,275)
| High information level (n = 639) | Low information level (n = 636) | ||||
|---|---|---|---|---|---|
| Variable | Coefficient (SE) | WTP (|${\$}$|/lb.) | coefficient (SE) | WTP (|${\$}$|/lb.) | p-value Comparing difference in WTP between information levels |
| Class 1 | |||||
| Price | –0.16***(0.01) | –0.19***(0.01) | |||
| Dry-aged | 0.03 (0.03) | 0.35 [–0.57, 1.14] | –0.01(0.03) | –0.06[–0.70, 0.54] | 0.20 |
| Wet-aged | 0.06* (0.03) | 0.82 [–0.10, 1.66] | 0.07**(0.03) | 0.77 [0.13, 1.41] | 0.45 |
| Prime | 0.61***(0.04) | 7.91 [6.62, 9.59] | 0.65***(0.04) | 7.01[6.00, 8.34] | 0.18 |
| Choice | 0.51***(0.04) | 6.55 [5.18, 8.41] | 0.50***(0.04) | 5.38 [4.41, 6.55] | 0.11 |
| Select | 0.38***(0.04) | 4.93 [3.78, 6.30] | 0.35***(0.04) | 3.80 [2.85, 4.89] | *0.08 |
| Opt out | –3.35***(0.14) | –21.5 [–24.50, –19.30] | –3.65***(0.13) | –19.66 [–21.60, –18.04] | 0.89 |
| Class 2 | |||||
| Price | –0.35***(0.03) | –0.40***(0.03) | |||
| Dry-aged | –0.52***(0.08) | –2.97 [–4.31, –1.89] | –0.88***(0.10) | –4.41[–5.62, –3.41] | **0.04 |
| Wet-aged | –0.43***(0.08) | –2.44 [–3.56, –1.48] | –0.60***(0.07) | –3.02[–3.94, –2.26] | 0.20 |
| Prime | 0.54***(0.10) | 3.10 [1.87, 4.43] | 0.60***(0.09) | 3.03[2.16, 4.04] | 0.45 |
| Choice | 0.48***(0.09) | 2.72 [1.63, 3.81] | 0.50***(0.09) | 2.51[1.61, 3.50] | 0.37 |
| Select | 0.19* (0.10) | 1.06 [–0.14, 2.16] | 0.32*** (0.09) | 1.60 [0.67, 2.58] | 0.76 |
| Opt out | –1.14*** (0.29) | –3.27 [–4.39, –1.83] | –1.50*** (0.27) | –3.76 [–4.67, –2.64] | 0.27 |
| Estimates LCM probabilities | |||||
| Prob class 1 | 0.6710*** (0.03) | 0.6708*** (0.02) | |||
| Prob class 2 | 0.3290*** (0.03) | 0.3292*** (0.02) | |||
***,**,* Indicates significance at the p < 1%, p < 5% and p < 10% level respectively.
The LCM results reveal significant heterogeneity in consumer preferences across the two latent classes with associated class membership probabilities of approximately 67 per cent for latent class one and 33 per cent for latent class two, in both information treatments. For each information treatment, this means that there is around a 67 per cent probability that a randomly chose respondent belongs to the first class and an approximate 33 per cent probability that the randomly chosen respondent belongs to the second class (Nilsson, Foster, & Lusk, 2006). The Opt Out coefficients across Class 1 and Class 2 for both information treatments, reveal that Class 1 in both models has more disutility associated with walking away from the beef purchase occasion, perhaps reflecting a stronger preference for beef.
The mean WTP estimates under both information treatments is reported in Table 3. Mean WTP for the wet-aged attributes were positive for class 1 across information treatments, but statistically significant only in the low information treatment. Mean WTP estimates for dry-aged beef were not statistically significant in class 1 across information treatments. Class 2 had negative and statistically significant mean WTP estimates for both dry-aged and wet-aged across information treatments, with respondents in this class displaying negative WTP for beef aging in general. The p-value comparing differences in WTP between information treatments indicates no statistically significant difference between mean estimated WTP for all attributes across information treatments with the exception of USDA Select in Class 1 and dry-aged in Class 2.
In class 1, the |${\$}$|0.82/lb. and |${\$}$|0.77/lb. mean WTP for wet-aged beef under the basic and enhanced information levels, respectively, were significantly lower than mean WTP for all USDA grades including USDA Select. This is consistent with respondents’ perceptions that USDA grades Choice and Prime are superior attributes to dry-aged and wet-aged beef. However, the relationship between WTP mean estimates between USDA Select and aged beef is of particular surprise given the lower-end nature of USDA Select, compared to USDA Choice and USDA Prime. As expected, the ordinal ranking on mean premiums for USDA grades followed the Prime, Choice, and Select order, confirming the expectations of consumer's general knowledge of the USDA grading system. However, those mean WTP estimates had overlapping confidence intervals. Our estimates are of similar magnitudes to those found by Lyford et al. (2010) for high quality beef. Lyford et al. (2010) categorized beef quality varying from two stars (unsatisfactory) to five stars (premium) and found mean WTP estimates of |${\$}$|11.09/lb. for five star and |${\$}$|7.86/lb. for four-star beef, which relatively track with our USDA prime mean WTP estimates. In this the probabilistically larger class, the mean WTP estimates were not statistically different across beef aging information levels except for USDA Select.
The second class of consumers identified by the LCM had a class membership probability of 33 per cent. Much like the first class, this second class still had disutility from walking away from the beef steak purchase. However, this disutility was considerably smaller than that of segment 1. This second class had negative and statistically significant mean WTP estimates for both dry-aged and wet-aged. The mean WTP for dry-aged beef was statistically more negative under the low information level. This suggests that regardless of the information level, this segment of consumers had a negative estimated WTP for aging in general, but participants in this segment who received further details regarding beef aging increased their mean WTP, though this increase still left mean WTP at negative levels. The improved consumer valuation for aged beef only in this specific case is consistent with Merritt et al. (2018), which found that there could be a value to beef producers in providing further attribute information to consumers in beef, but only in specific scenarios.
Though the literature on consumer preferences for beef aging is sparse, consumers have reported positive WTP for beef quality in the past (Lusk et al. 2001; Loureiro and Umberger, 2004; Lyford et al. 2010). Lusk et al. (2001) carried out a choice experiment in a grocery store setting and found average premiums of |${\$}$|1.84/lb. for Ribeye steaks. Loureiro and Umberger (2004) carried out a choice experiment where a |${\$}$|1.14/lb. premium was estimated for Ribeye steak that was guaranteed tender. Lyford et al. (2010) found that US consumers were willing to pay |${\$}$|11.09/lb. for premium beef and |${\$}$|7.86/lb. for better than everyday beef, which are significantly higher than the premiums estimated by Loureiro and Umberger (2004) for guaranteed tender. However, Tonsor (2012) highlighted the fact that these beef tenderness studies were conducted in an environment of lower retail prices, higher domestic per capita beef consumption, and before the 2008 domestic recession. Notwithstanding the highlighted limitations of prior studies, the 0.07|${\$}$|/lb. estimated mean WTP estimate for wet-aged beef in class one, under the low information treatment, along with the lack of positive valuation for aged beef in general found in this study, may reflect either a disconnect in association between aged-beef and tenderness or a disapproval of aging-beef as a technique to improve tenderness. Lack of knowledge of meat aging seems more likely as evidenced from the low self-reported consumer familiarity with beef aging along with the self-reported WTP for aged beef reported in Table 2. In any case, the potential market revenue stemming from beef aging are meager, compared to other beef tenderness valuation studies.
The current study integrates USDA beef quality grades as a central aspect of the study design alongside aging, thus filling a gap in the literature valuing a relatively unknown attribute to improve palatability and eating experience alongside a widely recognized grading and signaling mechanism.
3. Conclusions
This study aimed to advance understanding of consumer's perceptions and valuation for a practice that enhances beef's palatability, beef aging. The more traditional beef aging method, especially in high end restaurants, is dry-aging. However, in recent years, more interest has been developing in wet-aging. Both wet-aging and dry-aging were investigated in this study along with the more established USDA quality grades: Prime, Choice, and Select.
The choice experiment revealed that consumers who had more affinity for beef had a higher WTP for aged beef as well. However, only one estimated WTP for aging was positive, specifically wet-aged beef in the low information sub-sample. There was limited evidence of a positive response to a higher level of information regarding beef aging by lessening the estimated negative WTP for dry-aged beef under latent class 2. In contrast, USDA grades (Prime, Choice, and Select) all had positive and statistically significant mean WTP except for USDA Select under the high information level.
This study demonstrated that US residents may not be familiar with aging as a method to improve palatability of beef. Nevertheless, and consistent with prior literature, this study finds that consumers care the most about flavor and tenderness amongst beef attributes. Thus, beef aging, a process known to increase both of those attributes could theoretically be appealing to consumers. Compared to other beef attributes like USDA grades and Angus Beef, aged beef is not well-known and not highly regarded by consumers overall. Beef aging is one way to improve the quality and consistency for beef consumers. However, without additional marketing/branding to convey the eating characteristics of aged beef, it is unlikely at present that consumers are going to be willing to pay a premium to offset the cost of aging beef.
Acknowledgments
This work was supported in part by Agriculture and Food Research Initiative Grant 2017–67017-26475 from the USDA National Institute of Food and Agriculture.
Conflict of interest
The authors declare no conflicts of interest regarding the content of this manuscript.
Data availability
The data underlying this article will be shared on reasonable request to the corresponding author.
Appendix A. Beef Aging Information Treatments
Respondents randomly received one of the following two beef aging information levels:
1. High Information Treatment
Aged beef
Two methods of aging beef are wet-aged and dry-aged. The aging process allows beef's natural enzymes to break down the meat. This results in beef that is more tender, juicier, and more flavorful.
Wet-aging is a process where meat is kept in a vacuum pack during aging. This process is commonly applied to current product due to the simplicity of the process.
Dry-aging is a process where meat is exposed to a controlled refrigerated environment during aging without a barrier. This process causes moisture loss, however, it intensifies the beef flavor. Dry aging for thirty days is a common timeframe.
Not aged typically available steak in the super market.
2. Low Information Treatment
Aged beef
Two methods of aging beef are wet-aged and dry-aged. The aging is generally believed to result in a better beef eating experience.
You will have three different options.
Wet-aged steak
Dry-aged steak
Not aged, steak that is not aged (the one typically available in the supermarket)
Appendix B. USDA Beef Quality Grade Provided in the Choice Experiment
All respondents, irrespective of their beef aging information treatment, received the following information regarding USDA beef quality grades prior to the choice experiment:
USDA-Beef Quality Grade
In the United States, beef is inspected and assigned a ‘Quality Grade’ (Prime, Choice, Select, Standard, Commercial, and Utility) by a USDA (United States Department of Agriculture) inspector before it is sold to the stores or restaurants. A ‘Quality grade’ is a composite measure of the factors that affect tenderness, juiciness, and flavor. Those factors include carcass (harvested steer, heifer, cow, or bull) maturity, firmness, texture, color but the most important factor is the amount/distribution of marbling (intramuscular fat).
Prime- Abundant to slightly abundant marbling.
Choice- Moderate to small marbling.
Select- Slight marbling.
Standard- Traces to practically devoid of marbling.
For more information about USDA quality grades please visit the USDA website here https://dbpia.nl.go.kr/qopen/advance-article/doi/10.1093/qopen/qoac011/6567886.
