


Abstract
Total knee arthroplasty (TKA) is associated with declines in hip abductor (HA) muscle strength; however, a longitudinal analysis demonstrating the influence of TKA on trajectories of HA strength change has not been conducted.
The purpose of this study was to quantify changes in HA strength from pre-TKA through 3 months post-TKA and to characterize the relationship between HA strength changes and physical performance.
This study is a post hoc analysis of a randomized controlled trial.
Data from 162 participants (89 women, mean age = 63 y) were used for analysis. Data were collected by masked assessors preoperatively and at 1 and 3 months following surgery. Outcomes included: Timed “Up and Go” test (TUG), Stair Climbing Test (SCT), Six-Minute Walk Test (6MWT), and walking speed. Paired t tests were used for between- and within-limb comparisons of HA strength. Multivariable regression was used to determine contributions of independent variables, HA and knee extensor strength, to the dependent variables of TUG, SCT, 6MWT, and walking speed at each time point.
Hip abductor strength was significantly lower in the surgical limb pre-TKA (mean = 0.015; 95% CI = 0.010–0.020), 1 month post-TKA (0.028; 0.023–0.034), and 3 months post-TKA (0.02; 0.014–0.025) compared with the nonsurgical limb. Hip abductor strength declined from pre-TKA to 1 month post-TKA (18%), but not at the 3-month time point (0%). Hip abductor strength independently contributed to performance-based outcomes pre-TKA; however, this contribution was not observed post-TKA.
The post hoc analysis prevents examining all outcomes likely to be influenced by HA strength.
Surgical limb HA strength is impaired prior to TKA, and worsens following surgery. Furthermore, HA strength contributes to performance-based outcomes, supporting the hypothesis that HA strength influences functional recovery.
For details about interventions, data interpretation, and implications for post-TKA rehabilitation, don’t miss Editor in Chief Dr Alan Jette's interview with authors Dr Jennifer Stevens-Lapsley and Dr Brian Loyd. Visit https://dbpia.nl.go.kr/ptj/pages/podcasts.
Knee osteoarthritis (OA) currently compromises the quality of life in greater than 40 million individuals (>10% of the population) in the United States. Many of these individuals—approximately 700,000 people annually—elect to undergo total knee arthroplasty (TKA) to alleviate pain and disability associated with knee osteoarthritis.1,2 Despite the high prevalence of OA, and associated TKA, an ideal approach to postoperative rehabilitation remains unknown.
Evidence suggests that the significant decline in knee extensor strength experienced immediately following TKA negatively influences patient functional performance.3,4 Therefore, most rehabilitation protocols have focused on regaining voluntary activation and strength of the knee extensor musculature5 and in turn have engendered improved functional outcomes.6 Yet, while protocols built primarily around regaining strength in the knee extensor muscles have been successful in improving patient outcomes, little work has been published examining the impact of TKA on other lower extremity muscle groups, including the hip abductor (HA) group, which is known to influence the biomechanics of the knee and contribute to function in patients with knee OA.7 In turn, rehabilitation approaches that target strengthening of additional lower extremity muscle groups may further improve functional outcomes following TKA.
Piva et al and Alnahadi et al demonstrated the relationship of HA strength and functional performance following TKA.8,9 In both studies, patients who had previously undergone TKA were tested for maximal voluntary isometric contraction (MVIC) of both the hip abductors and knee extensors at one discrete time point following surgery. Both studies found that knee extensor strength and HA strength significantly contributed to patient performance across various functional measures. In these studies, data were collected from a postoperative, cross-sectional cohort, allowing for an analysis only of the relationship between HA strength and participant function at a single time point. Furthermore, data used in both of the aforementioned studies were collected on participants at least 2 months, and as long as 48 months, following TKA. This time frame fails to characterize the immediate influence of TKA on HA strength and the role that the change in strength of this muscle group plays in the early rehabilitation process.
Therefore, to better characterize the impact of TKA on HA strength and to determine whether these strength changes influence functional performance during the early postoperative period, we performed a longitudinal analysis. Using pooled data from an RCT10 previously completed in our laboratory, which found no significant differences in muscle strength and functional performance between an experimental group that received high-intensity strengthening intervention and a control group that received standard of care intervention following TKA, the authors aimed to: 1) quantify changes in HA strength and knee extensor strength from pre-TKA through 3 months post-TKA, and 2) characterize the relationship between observed strength changes and participant functional performance across time. We hypothesized 1) TKA would result in a significant reduction in surgical limb HA strength, 2) strength deficits would be greater in the surgical limb than the nonsurgical limb, both before and following surgery, and 3) HA strength loss would contribute to functional performance deficits after TKA, independently of those associated with knee extensor strength loss.
Demonstrating the impact TKA has on HA strength may help guide the ongoing development of post-TKA rehabilitation protocols and may help explain how participant functional performance is influenced by strength changes experienced beyond the deficits observed in the knee extensor musculature.
Methods
Design Overview
Data used for this post hoc secondary analysis were collected from participants enrolled in a recently completed multisite randomized controlled trial examining rehabilitation strategies following TKA.10 The outcomes and explanatory variables used in this analysis were collected by assessors blinded to group assignment and represented both primary and secondary outcomes in the parent trial. The stair climbing test was collected as the primary outcome of the parent trial and walking speed, Timed “Up and Go” (TUG), and Six-Minute Walk Test (6MWT) were collected as secondary functional outcomes. No other performance-based functional outcomes were collected in the parent trial. In the parent trial, the experimental group received 26 visits of high-intensity strengthening consisting of knee extensor, flexor, and hip strengthening utilizing the principles of 8-Repetition Maximum. Furthermore, the experimental group did high-intensity stair, gait, and balance training. The control group received 26 visits of physical therapy that mirrored traditional standard of care, focusing on ROM, stretching, low-load strengthening, basic mobility, and pain management.10 Results from this parent trial indicated no significant differences in knee extensor or HA strength between the control and experimental groups at baseline and at 1 and 3 months post-TKA. Because no treatment effect was identified, the control and experimental groups were pooled for the current analysis. All protocols and procedures used in this study were reviewed and approved by the Colorado Multiple Institutional Review Board.
Setting and Participants
One hundred sixty-two people participated in the parent trial between May 2011 and August 2015. Participants were recruited from orthopedic surgeons in 4 hospital systems in Colorado. Interested participants were screened by telephone for eligibility.
Study participants were scheduled for primary, unilateral TKA for OA, were between 50 and 85 years of age, and were willing to participate in 12 weeks (26 visits) of outpatient physical therapy. Individuals were excluded if they reported contralateral knee pain greater than 4 on a numerical pain rating scale (NPRS) and limiting function, previous knee surgery in the last 12 months, uncontrolled diabetes (HbA1C>7.0), or the presence of cardiovascular, neurological, or other disease limiting function.
Measures
All outcome measures used for this analysis were collected 2 to 3 weeks pre-TKA (baseline), and 1 month and 3 months post-TKA.
Strength Testing
Hip abductor muscle strength was measured as a Maximum Voluntary Isometric Contraction (MVIC). This was assessed using a hand-held dynamometer, which recorded force in kilograms (kg), braced by a strap that was attached to the testing plinth (eFigure, available at: https://dbpia.nl.go.kr/ptj). The participant was positioned in side lying with the tested limb fully extended (full hip and knee extension) and the contralateral limb in 90 degrees of hip and knee flexion. With the hand-held dynamometer in place at the ankle, the participant performed 2 warm-up trials at 50% and 75% MVIC. Following the warm-up trials, the participants performed up to 3 maximal contractions. If the force values produced in the first 2 trials were not within 5% of one another, a third trial was recorded and the highest value was used as the MVIC. This method has been previously shown to have strong validity and be a highly reliable method for testing maximal strength of the HA muscles.11,12
Knee extensor strength was measured as an MVIC and recorded in Newton-meters (N-m) using an electromechanical dynamometer (Humac Norm) with the participant seated upright and positioned in 90 degrees of hip flexion and 60 degrees of knee flexion (Fig. 1). Each participant performed 2 warm-up trials at 50% and 75% MVIC followed by up to 3 maximal contractions as previously described.13 If the force values produced in the first 2 maximal attempts were not within 5% of one another, a third trial was recorded and the highest value was used for analysis.
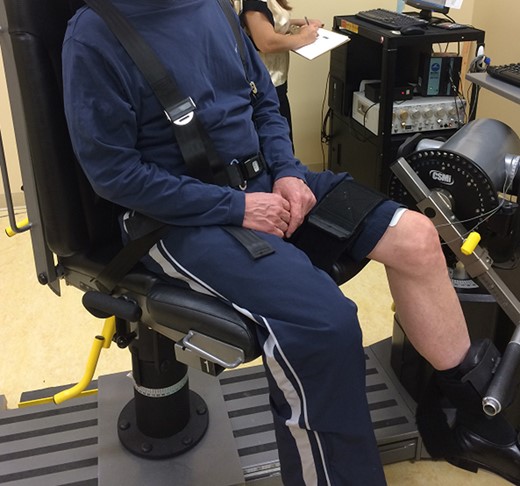
Photograph demonstrating the participant positioning used for strength testing of the knee extensor musculature using the electromechanical dynamometer.
Values for both HA and knee extensor strength used in statistical analysis are presented as normalized values. Normalized HA strength is calculated as: kilograms (kg) of force/kg of body weight, while normalized knee extensor strength is calculated as: N-m of force/kg of body weight. Normalizing to body weight allows for easy comparison between individuals with widely varying anthropometrics, which inherently influences force production (eg, women vs. men).14
Functional Testing
Functional measures used in the parent study were chosen for their ability to provide clinically relevant information, for ease of implementation, and to reflect patient deficits commonly seen after TKA (eg, transfers, stair climbing, and walking speed). The measures chosen include the TUG, Stair Climbing Test (SCT), 6MWT, and walking speed.15 The TUG test required participants to rise from a chair, walk 3 meters, turn around, walk back to the chair, and sit down. This task was timed, and the faster of the 2 trials was used for analysis. During the SCT, participants were asked to ascend and descend a set of 12 steps with or without the use of a handrail for balance. This task was timed and the faster of the 2 trials used for analysis. The 6MWT was also performed and the distance walked during 6 minutes recorded in meters. Walking speed was calculated by timing the participant instructed to walk “as quickly as possible while still remaining safe” across a 4-meter course with 2-meter acceleration and deceleration zones. Walking speed was recorded in m/s. These measures have been shown to provide clinically relevant information both for individuals who are high functioning and individuals who are low functioning across multiple populations, including older patients with orthopedic conditions.4,16-19
Statistical Analysis
The sample size used in this analysis was dependent upon the parent clinical trial and was determined to provide adequate power for the detection of between-group differences in the SCT.20
A maximum likelihood repeated measures model was used to estimate the change in functional measures and knee extensor strength over time, controlling for body mass index (BMI), sex, age, group assignment, and clinic site in which they received physical therapy. A similar model was used to estimate change in HA strength over time and the differences between involved and uninvolved limb HA strength at each time point.
Multiple linear regression was used to determine the contribution of HA strength to baseline function and change in function at 1 and 3 months postsurgery. Each of the functional outcomes was regressed on BMI, age, sex, group, site, HA strength (or change from baseline), and knee extensor strength (or change from baseline) at each time point. Furthermore, all models for change over time included the baseline value of the functional outcome measure being examined. Baseline characteristics are presented as mean ± SD or N(%). All P values from the linear regression models have been provided with the unique contribution to R2 from both the HA muscles and knee extensors. To properly account for the comparisons of the change in outcomes at 2 distinct time points, the significance level was designated at .025. All analyses were conducted using SAS 9.3 (SAS Institute Inc, Cary, NC).
Results
Demographic, anthropometric, and baseline functional information is provided in Tab. 1.
Baseline Participant Characteristics (Mean [SD] and Frequency Count)
| Variable | (N = 162) |
|---|---|
| Age | 63 (7) |
| Sex | 73 male; 89 female |
| Body Mass Index | 30.45 (4.81) |
| Involved Limb Normalized Knee Extensor Strength (N-m/kg) | 1.21 (0.52) |
| Timed “Up and Go” (TUG) (s) | 8.93 (2.70) |
| Stair Climbing Test (SCT) (s) | 16.82 (8.31) |
| Walking Speed (4MWT)a (m/s) | 1.74 (0.39) |
| 6MWT distance (m)b | 460.26 (102.28) |
a4MWT = 4-Meter Walking Test, used to measure walking speed.
b6MWT = 6-Minute Walk Test, used to measure walking endurance.
Prior to controlling for all covariates, operative limb HA strength was found to decrease by –18% (P = .04) from baseline to 1 month following surgery. At the 3-month time point, mean change in involved limb HA strength from baseline was less than 1% (Fig. 2). Similarly, strength loss of the knee extensors was large at 1 month, yet not significant at the designated level of .025 (–36.0%; P = .04). Strength remained decreased at 3 months, but a much smaller magnitude of strength loss was recorded of –2.5% (Fig. 2). However, when adjusting for BMI, age, sex, group, and site, change in involved limb HA and knee extensor strength was much less pronounced at both 1 and 3 months. The adjusted change values along with their respective baseline values and baseline and change scores for the performance measures are included in Tab. 2. Between limb comparisons (operative vs. nonoperative) of normalized HA strength found that the surgical limb was significantly weaker at baseline, 1, and 3 months post-TKA (P<.001) (Tab. 3).
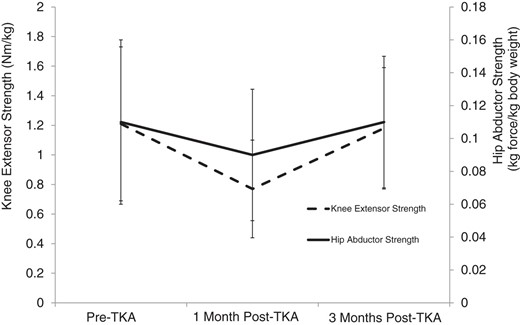
Nonadjusted mean (SD) change in involved limb hip abductor (solid line) and knee extensor (dotted line) normalized strength, from baseline to 1 month postsurgery and from baseline to 3 months postsurgery. TKA = total knee arthroplasty.
Change in Involved Limb Normalized Hip Abductor and Knee Extensor Strength and Outcome Measures From Baseline to 1 and 3 Months After Total Knee Arthroplastya
| Mean (95% CI) N | Mean (95% CI) t, df, P Value | ||
|---|---|---|---|
| Baseline | 1-Month Change From Baselineb | 3-Month Change From Baselineb | |
| Involved Limb Normalized Hip Abductor Strength (Kg/kg) | 0.113 (0.105 to 0.120) 158 | –0.005 (–.011 to .011) –1.50, 663, .13 | 0.001 (–0.006 to 0 .007) 0.22, 663, .83 |
| Involved Limb Normalized Knee Extensor Strength (N-m/kg) | 1.21 (1.13 to 1.29) 162 | –0.14 (–0.20 to –0.09) –4.87, 698, <.001 | –0.03 (–0.10 to 0.03) –1.06, 696, .30 |
| Timed “Up and Go” (TUG) (s) | 8.93 (8.52 to 9.35) 162 | –0.56 (–0.91 to –0.21) –3.14, 706, .002 | –1.08 (–1.45 to –0.71) –5.72, 696, <.001 |
| Stair Climbing Test (SCT) (s) | 16.82 (15.53 to 18.11) 162 | –1.58 (–2.74 to –0.42) –2.67, 711, .008 | –3.60 (–4.81 to –2.39) –5.85, 693, <.001 |
| Walking Speed (4MWT) (m/s) | 1.74 (1.68 to 1.80) 161 | –0.02 (–0.07, 0.02) –1.03, 701, .30 | 0.10 (0.05 to 0.15) 3.99, 692, <.001 |
| 6MWT distance (m) | 460.26 (444.34 to 476.18) 161 | 6.24 (–5.87 to 18.34) 1.01, 701, .31 | 26.20 (13.33 to 39.07) 4.00, 691, <.001 |
aCI = confidence interval, 4MWT = 4-Meter Walking Test; 6MWT = 6-Minute Walk Test.
bConditioned on baseline, sex, site, group, age, and body mass index.
| Mean (95% CI) | Mean (95% CI) t, df, P | ||
|---|---|---|---|
| Involved Limb | Uninvolved Limb | Between-Limb Difference | |
| Presurgery | 0.115 (0.109 to 0.121) | 0.130 (0.124 to 0.136) | 0.015 (0.010 to 0.020) 5.54, 454, <.001 |
| 1 Month Postsurgery | 0.096 (0.091 to 0.102) | 0.125 (0.119 to 0.131) | 0.028 (0.023 to 0.034) 10.47, 459, <.001 |
| 3 Months Postsurgery | 0.110 (0.104 to 0.116) | 0.130 (0.124 to 0.136) | 0.020 (0.014 to 0.025) 7.21, 471, <.001 |
aCI = confidence interval.
bMean differences between limbs at each time point, conditioned on baseline, sex, site, group, age, and body mass index.
| Mean (95% CI) | Mean (95% CI) t, df, P | ||
|---|---|---|---|
| Involved Limb | Uninvolved Limb | Between-Limb Difference | |
| Presurgery | 0.115 (0.109 to 0.121) | 0.130 (0.124 to 0.136) | 0.015 (0.010 to 0.020) 5.54, 454, <.001 |
| 1 Month Postsurgery | 0.096 (0.091 to 0.102) | 0.125 (0.119 to 0.131) | 0.028 (0.023 to 0.034) 10.47, 459, <.001 |
| 3 Months Postsurgery | 0.110 (0.104 to 0.116) | 0.130 (0.124 to 0.136) | 0.020 (0.014 to 0.025) 7.21, 471, <.001 |
aCI = confidence interval.
bMean differences between limbs at each time point, conditioned on baseline, sex, site, group, age, and body mass index.
Operative limb HA strength was found to contribute a greater amount to the variability (R2) in baseline performance on the TUG, 6-MWT, and walking speed than knee extensor muscle strength contributed (Tab. 4). Furthermore, HA strength was responsible for a nearly equivalent contribution to the variance of SCT performance as knee extensor strength at baseline (9% vs. 10%, respectively). At 1 and 3 months following surgery, the change in HA strength and knee extensor strength were found to make substantially smaller contributions to function when controlling for all covariates. These contributions were found to generally be on the order of 2% to 5%. The contributions of knee extensor strength and HA strength to functional outcome measures are displayed in Tab. 4.
Unique Variance Explained in the Multivariable Regression Models by Full Model, Covariates, Knee Extensor Strength, and Hip Abductor Strengtha
| Unique Variance (R2) | ||||
|---|---|---|---|---|
| Variable | Full Modelb | Covariatesc | Knee Extensor Strength (Quad)d (P Value) | Hip Abductor Strength (Hip)e (P Value) |
| Baseline Timed “Up and Go” (TUG) | .48 | .28 | .12 (<.001) | .15 (<.001) |
| 1-Month Change in TUG | .15 | .10 | .03 (.08) | .03 (.12) |
| 3-Month Change in TUG | .64 | .63 | .02 (.04) | .00 (.84) |
| Baseline Stair Climbing Test (SCT) | .47 | .33 | .10 (<.001) | .09 (.002) |
| 1-Month Change in SCT | .24 | .20 | .02 (.14) | .02 (.35) |
| 3-Month Change in SCT | .82 | .80 | .01 (.16) | .02 (.98) |
| Baseline Walking Speed | .47 | .32 | .07 (.005) | .12 (<.001) |
| 1-Month Change in Walking Speed | .45 | .40 | .04 (.02) | .02 (.66) |
| 3-Month Change in Walking Speed | .44 | .40 | .03 (.01) | .01 (.51) |
| Baseline 6MWT | .50 | .31 | .09 (.002) | .15 (<.001) |
| 1-Month Change in 6MWT | .49 | .44 | .02 (.30) | .05 (.02) |
| 3-Month Change in 6MWT | .43 | .40 | .02 (.12) | .02 (.53) |
a4MWT = 4-Meter Walking Test; 6MWT = 6-Minute Walk Test.
bSex, site, group, age, body mass index, quad, hip, baseline (for change at 1 and 3 months).
cSex, site, group, age, body mass index, baseline (for change at 1 and 3 months).
dQuad added to sex, site, group, age, body mass index, baseline (for change at 1 and 3 months).
eHip added to sex, site, group, age, body mass index, baseline (for change at 1 and 3 months).
Discussion
As the number of people receiving TKA continues to rise, designing rehabilitation strategies that effectively improve patient function, reduce postoperative disability, and decrease the burden on the health care system should remain a top priority. Current approaches to post-TKA rehabilitation primarily focus on regaining knee range of motion and some level of lower extremity strengthing.21 However, the specifics of which muscle groups to target for strengthening after TKA are less clear. Although a great deal of research has focused on knee extensor muscles, and has clearly demonstrated the impact of TKA on knee extensor musculature,22-24 evidence is lacking to elucidate the role other muscles play in recovery, specifically, the HA muscles. Shown to significantly impact gait and balance in older patients25,26 and influence knee mechanics,7 the HA muscles are important muscles to examine following TKA. To our knowledge, this is the first study to longitudinally examine HA strength and its effect on functional performance before and after TKA. These data suggest deficits in HA strength are present in the operative extremity in both the preoperative and initial postoperative phases of TKA, and these strength deficits have an impact on function that rivals that of knee extensor muscle strength deficits. One month after TKA, mean strength loss recorded in the surgical limb HA muscles was 18.1%, a substantial loss, considering losses as low as 5.3% have been shown to be clinically meaningful.27 However, HA strength loss was not as large as that observed in the knee extensors 1 month following TKA (18.1% vs. 36.0%, respectively), indicating knee extensor strengthening should remain the focal point of postoperative rehabilitation.
A possible mechanism for post-TKA HA strength loss include disuse atrophy28 and the resultant decrease in muscle cross-sectional area.29 This hypothesis is supported by the significantly lower levels of surgical limb HA strength compared to the nonsurgical limb at each time point (Tab. 3). Declines in physical activity and reductions in surgical limb weight bearing are likely contributing factors to disuse of the involved limb HA muscles, whereas the uninvolved limb may experience higher use demands during the postoperative period23,30 and during the preoperative period as a result of pain-related osteoarthritis.13 Declines in strength may be further compounded by a reduction in movement occurring outside of the sagittal plane following surgery (ie, frontal and transverse) as the muscles of the hip have been shown to play a critical role in pelvis and trunk rotations in the frontal plane.31-34 Thus, the findings presented by Piva et al, who found that HA strength had a greater contribution to the variance of figure-of-8 walking (22%) than to other, less dynamic tasks, were not surprising.8 The figure-of-8 walking test requires participants to walk in both straight and curved paths, placing greater demands on the HA musculature than tasks occurring primarily in the sagittal plane. Interestingly, in the current study, HA strength was found to contribute unique levels of variance, similar to that of knee extensor strength, in tasks occurring primarily in the sagittal plane prior to TKA. This finding indicates HA strength plays a critical role in commonly occurring sagittal plane movements, influencing performance of day-to-day tasks in patients diagnosed with end stage OA.
An alternative hypothesis for the postoperative reduction in operative limb HA strength is a reduction in central activation. Functioning as the primary driver of post-TKA knee extensor strength loss, an impaired ability to activate the quadriceps muscle group has been shown to be extremely influential during the early postoperative time period.24 Measured using a variety of techniques, including the central activation ratio and doublet interpolation technique, multiple studies have demonstrated the relationship between central activation and knee extensor strength.24,35 Similar activation deficits may underlie observed strength losses in the involved limb HA muscles. However, there are currently no validated mechanisms for measuring central activation levels of the HA muscles. Therefore, we are not able to identify activation deficits as the principal culprit of the observed strength loss.
The longitudinal assessment supports the hypothesis that the HA muscles uniquely contribute to patient function, beyond that contributed by the knee extensor muscles and the combination of critical covariates. In fact, the HA muscles were found to contribute a greater amount of unique variance than the knee extensors to baseline 6MWT distance, walking speed, and TUG times, equal or greater than a 10% contribution in each measure. However, 1 month post-TKA, change in both HA strength and knee extensor strength was found to contribute minimally to the variance in the change of each outcome from baseline. For example, the change in HA strength uniquely explained only 5% of the variability in 6MWT, while the knee extensor strength contributed a similarly low 3%. This trend was seen in all reported outcomes, and held true at 3 months post-TKA as well, with nearly equal and negligible contributions from both the HA muscles and the knee extensors to the change in the outcomes. It is of great interest that these 2 muscle groups, known to be critical in functional ability, contributed so minimally to the change in these outcomes, when controlling for the used group of covariates.
The findings from this study present evidence for the support of current rehabilitation approaches, which emphasize remediating knee extensor strength, but also suggest a change toward a wider focus of strength remediation following TKA. The significant declines in the involved limb HA muscles seen 1 month following surgery demonstrate that TKA results in strength deficits in additional muscle groups, rather than solely in the knee extensors, and the need to strengthen varied muscle groups should be considered when making clinical decisions during the postoperative period. The critical nature of HA muscles strength was also evidenced by the large contribution these muscles made to functional performance prior to surgery. Furthermore, altering the timing of the delivery of strengthening interventions may be advantageous, allowing for greater focus to be placed on different muscle groups during critical periods of recovery. Modifying a protocol to primarily target the knee extensors during the first month of rehabilitation with increasing emphasis on the HA muscles as recovery progresses, while maintaining a high level of knee extensor strengthening, may result in better functional outcomes.
This study has limitations. Past studies have shown a strong relationship between HA strength and dynamic tasks such as the figure-of-8 walking test. However, the retrospective nature of this analysis limited our ability to examine the figure-of-8 walking test, which was not assessed in the parent clinical trial. The exploratory nature of the multivariable regression analyses limited our ability to test for statistical significance, leading to an entirely investigative assessment of the contribution the different muscle groups made to functional performance. Lastly, because the parent clinical trial was designed to primarily target the return of knee extensor strength, we are unable to draw conclusions as to how the HA muscles may respond to targeted strengthening interventions following TKA.
Conclusion
The effects of TKA on lower extremity muscle function are not limited to the knee extensor muscles alone.36,37 Total knee arthroplasty results in significant strength loss in the abductor muscles of the hip. The significant decline in strength, observed in both the knee extensors and HA muscles, contributes independently to functional ability in participants undergoing TKA. Importantly, HA strength was found to contribute substantially to the variability in participant function prior to surgery, demonstrating a similar contribution to the variability in outcomes as knee extensor strength preoperative. Therefore, although the current study does not refute the need to focus on knee extensor muscle strengthening in the immediate postoperative period, the declines seen in the HA muscles warrant consideration during rehabilitation. Specifically, remediating HA muscle strength at later time points (about 3 months) following surgery may result in better long-term outcomes and higher levels of patient functioning. Future investigations should examine the benefit of incorporating specific HA strengthening in a postoperative TKA protocol to properly explore how these muscles relate directly to functional performance.
Author Contributions and Acknowledgements
Concept/idea/research design: B.J. Loyd, J. Jennings, D. Judd, R. Kim, D. Dennis, J. Stevens-Lapsley
Writing: B.J. Loyd, J. Jennings, J. Stevens-Lapsley
Data collection: B.J. Loyd, D. Judd, R. Kim, D. Dennis
Data analysis: B.J. Loyd, J. Jennings, P. Wolfe
Project management: B.J. Loyd, J. Stevens-Lapsley
Fund procurement: J. Stevens-Lapsley
Providing participants: R. Kim, D. Dennis
Providing facilities/equipment: J. Stevens-Lapsley
Providing institutional liaisons: J. Stevens-Lapsley
Consultation (including review of manuscript before submitting): D. Judd, R. Kim, P. Wolfe, D. Dennis, J. Stevens-Lapsley
The authors thank Carol Baym, PhD, SPT, for critical review and editing of the manuscript, and Kristine Gerron, BS, for critical review and editing of the manuscript.
Ethics Approval
All protocols and procedures used in this study were reviewed and approved by the Colorado Multiple Institutional Review Board.
Funding
Funding for this study was provided by the US Department of Health and Human Services, National Institutes of Health (R01 HD065900/HD/NICHD NIH HHS T32 AG000279/AG/NIA).
Disclosures
The authors completed the ICJME Form for Disclosure of Potential Conflicts of Interest and reported no conflicts of interest.
Data used for this post hoc secondary analysis were collected from participants enrolled in a recently completed multisite randomized controlled trial examining rehabilitation strategies following TKA (clinical trial registration no. NCT01537328).
References

Comments