


Abstract
The purpose of this study was to test the reliability of the Activity Measure for Post-Acute Care (AM-PAC) “6-Clicks” mobility and activity short forms between patients and therapist proxies. As a secondary aim, reliability was examined when patients completed their self-report before versus after the therapist evaluation.
Patients being seen for an initial physical therapist (N = 70) or occupational therapist (N = 71) evaluation in the acute care hospital completed the “6-Clicks” mobility short form (if a physical therapist evaluation) or activity short form (if an occupational therapist evaluation). Whether patients completed their self-assessment before or after the evaluation was randomized. Patient- and therapist-rated “6-Clicks” raw scores were converted to AM-PAC T-scores for comparison. Reliability was assessed with intraclass correlation coefficients (ICCs) and Bland–Altman plots, and agreement was assessed with weighted kappa values.
The ICCs for the “6-Clicks” mobility and daily activity short forms were 0.57 (95% CI = 0.42–0.69) and 0.45 (95% CI = 0.28–0.59), respectively. For both short forms, reliability was higher when the patient completed the self-assessment after versus before the therapist evaluation (ICC = 0.67, 95% CI = 0.47–0.80 vs ICC = 0.50, 95% CI = 0.26–0.67 for the mobility short form; and ICC = 0.52, 95% CI = 0.29–0.70 vs ICC = 0.34, 95% CI = 0.06–0.56 for the activity short form).
Reliability of the “6-Clicks” total scores was moderate for both the mobility and activity short forms, though higher for the mobility short form and when patients’ self-report occurred after the therapist evaluation.
Reliability of the AM-PAC “6-Clicks” short forms is moderate when comparing scores from patients with those of therapists responding as proxies. The short forms are useful for measuring participants’ function in the acute care hospital; however, it is critical to recognize limitations in reliability between clinician- and patient-reported AM-PAC scores when evaluating longitudinal change and recovery.
Introduction
Many individuals in acute care hospitals experience new or worsening deficits in physical function and their ability to participate in daily activities.1,2 Individual’s functional status in the hospital can drive multidisciplinary mobility interventions.3–5 Further, it is known to be associated with discharge disposition,6–11 hospital readmission risk,12–15 functional improvement in post-acute care facilities,16,17 and mortality.18,19 As this evidence grows, routine measurement of functional status in the hospital is becoming increasingly imperative.2
The Activity Measure for Post–Acute Care (AM-PAC) “6-Clicks” basic mobility and daily activity short forms are valid measures of functional status for hospitalized individuals.20 The 6 functional items included in each of these forms are taken from the 269-item bank of the AM-PAC,21,22 which was designed to measure function across the continuum of care primarily by patient self-report. However, in standard practice, the “6-Clicks” forms are scored by clinical proxies across clinical populations. They have demonstrated excellent interrater reliability between 2 physical therapist raters (using the mobility short form),23 2 occupational therapist raters (using the activity short form),23 and between a physical therapist and a nurse rater (using the mobility short form).4
Interest has increased in measuring function longitudinally across the continuum of care for the purposes of both informing clinical decisions and understanding patients’ outcomes. To enable this practice, careful consideration must be given to the reliability of specific measures if alternating between clinician- versus patient-reported measures within and across settings. In 2 separate studies,24,25 AM-PAC items were shown generally to demonstrate appropriate interrater reliability between patients and family or clinician proxies. Both studies were conducted in post-acute care settings, with one24 limited to a sample of individuals with stroke. It is unclear whether the “6-Clicks” items specifically demonstrate adequate reliability between a patient and a clinician proxy when scored for a clinically diverse cohort of patients in the hospital.
The primary purpose of this study was to test the interrater reliability of the “6-Clicks” forms between a patient and clinician in the hospital. Specifically, we tested for interrater reliability of the basic mobility short form using scores from patients and physical therapists and of the daily activity short form using scores from patients and occupational therapists. As a secondary aim, we examined the interrater reliability when patients completed their self-report before the physical therapist or occupational therapist evaluation versus after the evaluation. Consistent with evidence that there is high patient versus proxy reliability with AM-PAC items generally, we hypothesized that reliability would be high for the “6-Clicks” forms specifically and that reliability would be greater when patients completed their self-report after the therapist evaluation versus before.
Methods
Instruments
The AM-PAC “6-Clicks” basic mobility and daily activity short forms, including evidence of their construct validity and interrater reliability, have been described in detail by Jette et al.20,23 Briefly, there are 6 activities assessed using each form. The mobility short form includes assessment of activities including turning over in bed, moving from lying in bed to sitting at the edge of the bed, moving from the bed to a chair, standing up from a chair, walking in a hospital room, and climbing 3 to 5 steps. The daily activity short form includes assessment of activities including completing lower body dressing, upper body dressing, toileting, grooming, eating, and bathing. Scoring is based on the individual’s need for physical assistance from another person and uses a 4-point Likert scale: 1 (“total assistance”), 2 (“a lot”), 3 (“a little”), and 4 (“none”). Therapists score each activity by either direct observation or using clinical judgment given an individual’s probable capabilities. Higher scores indicate greater functional independence. In our hospitals, the “6-Clicks” basic mobility and daily activity short forms are used in routine clinical practice by physical therapists and occupational therapists, respectively, with each form being scored at each therapy visit. In this study, we converted raw mobility and activity scores to standardized T-scores using the AM-PAC Inpatient Short Form version 2 conversion tables.26 The standard error of measurement was quantified according to the corresponding T-score in the conversion tables.
Participants
Data were collected from 1 hospital, first for all physical therapist–patient pairs then for occupational therapist–patient pairs. Because the “6-Clicks” is used as a general functional measure for all hospitalized individuals, we sought a balanced sample in terms of diagnoses and thus targeted recruitment to have a relatively equal sample size across 4 clinical services: cardiac, medical/surgical, neurological, and orthopedic. Different physical therapists and occupational therapists from each of the 4 services participated. All 8 therapist participants had been trained by a rehabilitation manager or clinical team leader in the standardized scoring of the “6-Clicks” short forms at the beginning of their employment at the hospital. The 4 participating physical therapists had practiced in acute care (all in our hospital) for an average of 7.5 years and the 4 participating occupational therapists for an average of 2.8 years. Therapists conducted their evaluations and “6-Clicks” scoring consistent with their standard practice.
Potentially eligible patients were identified each morning. Patients were recruited for participation if they were scheduled for a therapy evaluation that day; cognitively alert; documented by the bedside nurse (and independently confirmed by the evaluating therapist) to be oriented to person, place, and time; and English-speaking. As data collection progressed, we monitored the distribution of clinician and patient “6-Clicks” scores to refine recruitment so that the range of raw scores was covered. For collection of the final 7 mobility scores and final 10 activity scores, individuals more likely to have lower scores (as suggested by their medical status in the provider notes reviewed prior to the therapist’s evaluation) were targeted for recruitment.
Data Collection
The “6-Clicks” mobility score as rated by the physical therapist and “6-Clicks” activity score as rated by the occupational therapist were collected consistent with standard care. Therapists record these scores in the electronic health record immediately following each clinical evaluation. The scores were extracted by the study team using SAS Enterprise Guide (SAS Institute Inc., Cary, NC, USA). Patients completed their “6-Clicks” self-assessments using Research Electronic Data Capture, a secure, web-based software platform designed to support data capture for research studies with an instance hosted at Cleveland Clinic.27,28 Because we considered the possibility that patients could be biased in their rating of functional status depending on the timing of their self-assessment relative to participating in the tasks associated with a therapy evaluation, they were randomized by simple 1:1 randomization to complete the assessment either before or after the evaluation. For all pairs, the therapist and patient completed their assessments on the same day as the evaluation.
Data were collected for the mobility short form between January 21, 2020, and February 21, 2020. The data collection for the activity short form was interrupted for 9 months due to recruitment holds during the COVID-19 pandemic; data were collected from March 2, 2020, through March 12, 2020, and from December 14, 2020, through February 10, 2021. All data collection and other methods for this study were approved by our institutional review board (#19-1612).
Data Analyses
The reliability for the mobility short form (for physical therapist–patient pairs) and for the activity short form (for occupational therapist–patient pairs) were assessed separately. Mean differences between patient and therapist total T-scores and individual item raw scores were summarized and compared using paired t tests. The reliability of the total T-score was assessed using intraclass correlation coefficient (ICC [2,1], 2-way random effects, consistency, single rater) with 95% CIs.29 This ICC form was chosen to reflect that the therapist raters were from a larger population of raters (random vs mixed effects), with consistency chosen over absolute agreement because systematic differences between raters are irrelevant and the focus is on whether the rater’s scores correlate in an additive manner as opposed to assignment of the same score.30 To assess how overall reliability is influenced by agreement between patients and therapists on individual “6-Clicks” items, the item agreement was evaluated using Cohen’s kappa with quadratic weighting. ICC and kappa values of ≤0.2, 0.21 to 0.4, 0.41 to 0.6, 0.61 to 0.8, and 0.81 to 1.0 indicate slight, fair, moderate, substantial, and almost perfect agreement, respectively.30,31 Bland–Altman plots were constructed to graphically display the agreement between patient and therapist T-scores in terms of mean difference; a mean difference closer to 0 with more narrow limits of agreement overall indicated higher agreement.
Reliability and agreement were evaluated separately within patients who completed their assessments before the therapy evaluation and within patients who completed their assessment after the therapy evaluation.
We determined that a sample size of 70 therapist-patient pairs scoring each of the “6-Clicks” forms would be necessary to achieve >95% power to detect an ICC of 0.75, assuming a null of 0.50. For the secondary aim, a sample size of 35 patients per group (before vs after evaluation) would achieve 80% power to detect an ICC of 0.75, assuming a null of 0.50. All analyses were completed in SAS 9.4 statistical software (SAS Inc, Cary, NC, USA). Statistical significance was established throughout at P < .05. Because the results of our study are focused on magnitudes of effect, there was no formal adjustment for multiple comparisons.
Results
Paired scores were collected for 70 physical therapist–participant pairs using the mobility short form and for 71 occupational therapist-participant pairs using the activity short form. The characteristics of these patients are presented in Table 1.
Patient Characteristics for “6-Clicks” Mobility and Activity Short Forms
| Characteristic | “6-Clicks” Mobility N = 70 | “6-Clicks” Activity N = 71 |
|---|---|---|
| Patient completed before service, no. (%) | 38 (54.3) | 35 (49.3) |
| Patient completed after service, no. (%) | 32 (45.7) | 36 (50.7) |
| Patient age, mean (SD) [range], y | 64.1 (14.2) [27–90] | 66.0 (15.3) [19–98] |
| Female, no. (%) | 39 (55.7) | 33 (46.5) |
| Evaluation service, no. (%) | ||
| Cardiac | 17 (24.3) | 17 (23.9) |
| Medical/surgical | 20 (28.6) | 17 (23.9) |
| Neurologic | 20 (28.6) | 20 (28.2) |
| Orthopedic | 13 (18.6) | 17 (23.9) |
Reliability of “6-Clicks” Mobility
For the “6-Clicks” mobility short form, the mean (SD) total T-score determined by physical therapists for the entire sample (N = 70) was 44.6 (8.7), whereas the mean (SD) total T-score determined by participants was 39.3 (10.1), a mean difference of 5.3 (8.7) T-points, which was statistically significant (P < .001) (Tab. 2).
| “6-Clicks” Measure | Items and Scores | All Patients | Patient Completed Before Service | Patient Completed After Service | ||||||
|---|---|---|---|---|---|---|---|---|---|---|
| Therapist Score Mean (SD) | Patient Score (SD) | Mean Difference (SD) | Therapist Score Mean (SD) | Patient Score Mean (SD) | Mean Difference (SD) | Therapist Score Mean (SD) | Patient Score Mean (SD) | Mean Difference (SD) | ||
| Mobility | Rolling | 3.6 (0.6) | 2.8 (1.0) | 0.8 (1.0)c | 3.8 (0.6) | 2.7 (1.1) | 1.1 (1.0)c | 3.4 (0.6) | 2.9 (0.9) | 0.6 (0.8)c |
| Supine to sit | 3.4 (0.7) | 2.8 (0.9) | 0.6 (0.9)c | 3.6 (0.6) | 2.7 (1.0) | 0.9 (1.0)c | 3.2 (0.8) | 2.9 (0.9) | 0.3 (0.7)c | |
| Moving to chair | 3.2 (0.9) | 2.8 (1.0) | 0.4 (1.0)c | 3.3 (0.9) | 2.9 (1.0) | 0.4 (1.1)c | 3.1 (0.9) | 2.7 (1.0) | 0.4 (0.8)c | |
| Sit to stand | 3.3 (0.8) | 3.0 (1.0) | 0.3 (0.9)c | 3.4 (0.8) | 3.1 (1.0) | 0.4 (1.0)c | 3.2 (0.9) | 2.9 (1.0) | 0.3 (0.8) | |
| Walking in room | 3.2 (0.9) | 2.8 (1.1) | 0.4 (1.0)c | 3.2 (0.9) | 2.8 (1.0) | 0.4 (1.1)c | 3.1 (0.9) | 2.7 (1.1) | 0.4 (0.9)c | |
| Climbing stairs | 2.6 (1.0) | 2.3 (1.2) | 0.3 (1.1)c | 2.7 (0.9) | 2.4 (1.2) | 0.3 (1.2) | 2.5 (1.0) | 2.3 (1.2) | 0.3 (0.9) | |
| Total T-score | 44.6 (8.7) | 39.3 (10.1) | 5.3 (8.7)c | 45.5 (8.6) | 39.3 (10.1) | 6.2 (9.4)c | 43.5 (8.9) | 39.2 (10.2) | 4.3 (7.8)c | |
| SEM | 3.6 (1.4) | 3.2 (1.3) | – | 3.7 (1.4) | 3.1 (1.3) | – | 3.6 (1.5) | 3.2 (1.3) | – | |
| Activity | Lower body clothing | 2.7 (0.9) | 2.9 (0.8) | −0.2 (0.9) | 2.6 (0.9) | 2.8 (0.8) | −0.2 (1.0) | 2.8 (0.9) | 3.0 (0.8) | −0.2 (0.8) |
| Bathing | 2.9 (0.9) | 2.8 (1.0) | 0.1 (1.1) | 2.8 (0.8) | 2.7 (0.9) | 0.1 (1.2) | 3.0 (0.9) | 2.9 (1.0) | 0.0 (1.0) | |
| Toileting | 3.3 (0.8) | 3.3 (0.8) | 0.0 (0.80) | 3.2 (0.9) | 3.2 (0.8) | 0.0 (0.9) | 3.4 (0.8) | 3.3 (0.8) | 0.1 (0.7) | |
| Upper body clothing | 3.5 (0.8) | 3.1 (0.9) | 0.4 (1.0)c | 3.3 (0.8) | 3.2 (0.9) | 0.1 (1.1) | 3.7 (0.7) | 3.1 (0.9) | 0.6 (0.8)c | |
| Grooming | 3.7 (0.6) | 3.6 (0.6) | 0.1 (0.7) | 3.6 (0.6) | 3.6 (0.7) | 0.1 (0.8) | 3.8 (0.4) | 3.7 (0.5) | 0.2 (0.7) | |
| Eating | 3.9 (0.3) | 3.6 (0.7) | 0.3 (0.7)c | 3.9 (0.4) | 3.7 (0.7) | 0.3 (0.6)c | 4.0 (0.2) | 3.6 (0.7) | 0.3 (0.8)c | |
| Total T-score | 44.7 (8.1) | 43.0 (7.8) | 1.7 (8.4) | 43.3 (8.0) | 42.2 (7.1) | 1.1 (8.8) | 46.1 (8.0) | 43.9 (8.5) | 2.2 (8.0) | |
| SEM | 3.6 (1.6) | 3.3 (1.3) | – | 3.4 (1.5) | 3.1 (1.1) | – | 3.8 (1.7) | 3.6 (1.6) | ||
SEM = standard error of measurement
Higher scores indicate better mobility or activity. T-score and SEM are derived using conversion tables in the AM-PAC Short Forms Manual 2.0.26
P < .05 based on paired t test or Wilcoxon signed-rank test.
| “6-Clicks” Measure | Items and Scores | All Patients | Patient Completed Before Service | Patient Completed After Service | ||||||
|---|---|---|---|---|---|---|---|---|---|---|
| Therapist Score Mean (SD) | Patient Score (SD) | Mean Difference (SD) | Therapist Score Mean (SD) | Patient Score Mean (SD) | Mean Difference (SD) | Therapist Score Mean (SD) | Patient Score Mean (SD) | Mean Difference (SD) | ||
| Mobility | Rolling | 3.6 (0.6) | 2.8 (1.0) | 0.8 (1.0)c | 3.8 (0.6) | 2.7 (1.1) | 1.1 (1.0)c | 3.4 (0.6) | 2.9 (0.9) | 0.6 (0.8)c |
| Supine to sit | 3.4 (0.7) | 2.8 (0.9) | 0.6 (0.9)c | 3.6 (0.6) | 2.7 (1.0) | 0.9 (1.0)c | 3.2 (0.8) | 2.9 (0.9) | 0.3 (0.7)c | |
| Moving to chair | 3.2 (0.9) | 2.8 (1.0) | 0.4 (1.0)c | 3.3 (0.9) | 2.9 (1.0) | 0.4 (1.1)c | 3.1 (0.9) | 2.7 (1.0) | 0.4 (0.8)c | |
| Sit to stand | 3.3 (0.8) | 3.0 (1.0) | 0.3 (0.9)c | 3.4 (0.8) | 3.1 (1.0) | 0.4 (1.0)c | 3.2 (0.9) | 2.9 (1.0) | 0.3 (0.8) | |
| Walking in room | 3.2 (0.9) | 2.8 (1.1) | 0.4 (1.0)c | 3.2 (0.9) | 2.8 (1.0) | 0.4 (1.1)c | 3.1 (0.9) | 2.7 (1.1) | 0.4 (0.9)c | |
| Climbing stairs | 2.6 (1.0) | 2.3 (1.2) | 0.3 (1.1)c | 2.7 (0.9) | 2.4 (1.2) | 0.3 (1.2) | 2.5 (1.0) | 2.3 (1.2) | 0.3 (0.9) | |
| Total T-score | 44.6 (8.7) | 39.3 (10.1) | 5.3 (8.7)c | 45.5 (8.6) | 39.3 (10.1) | 6.2 (9.4)c | 43.5 (8.9) | 39.2 (10.2) | 4.3 (7.8)c | |
| SEM | 3.6 (1.4) | 3.2 (1.3) | – | 3.7 (1.4) | 3.1 (1.3) | – | 3.6 (1.5) | 3.2 (1.3) | – | |
| Activity | Lower body clothing | 2.7 (0.9) | 2.9 (0.8) | −0.2 (0.9) | 2.6 (0.9) | 2.8 (0.8) | −0.2 (1.0) | 2.8 (0.9) | 3.0 (0.8) | −0.2 (0.8) |
| Bathing | 2.9 (0.9) | 2.8 (1.0) | 0.1 (1.1) | 2.8 (0.8) | 2.7 (0.9) | 0.1 (1.2) | 3.0 (0.9) | 2.9 (1.0) | 0.0 (1.0) | |
| Toileting | 3.3 (0.8) | 3.3 (0.8) | 0.0 (0.80) | 3.2 (0.9) | 3.2 (0.8) | 0.0 (0.9) | 3.4 (0.8) | 3.3 (0.8) | 0.1 (0.7) | |
| Upper body clothing | 3.5 (0.8) | 3.1 (0.9) | 0.4 (1.0)c | 3.3 (0.8) | 3.2 (0.9) | 0.1 (1.1) | 3.7 (0.7) | 3.1 (0.9) | 0.6 (0.8)c | |
| Grooming | 3.7 (0.6) | 3.6 (0.6) | 0.1 (0.7) | 3.6 (0.6) | 3.6 (0.7) | 0.1 (0.8) | 3.8 (0.4) | 3.7 (0.5) | 0.2 (0.7) | |
| Eating | 3.9 (0.3) | 3.6 (0.7) | 0.3 (0.7)c | 3.9 (0.4) | 3.7 (0.7) | 0.3 (0.6)c | 4.0 (0.2) | 3.6 (0.7) | 0.3 (0.8)c | |
| Total T-score | 44.7 (8.1) | 43.0 (7.8) | 1.7 (8.4) | 43.3 (8.0) | 42.2 (7.1) | 1.1 (8.8) | 46.1 (8.0) | 43.9 (8.5) | 2.2 (8.0) | |
| SEM | 3.6 (1.6) | 3.3 (1.3) | – | 3.4 (1.5) | 3.1 (1.1) | – | 3.8 (1.7) | 3.6 (1.6) | ||
SEM = standard error of measurement
Higher scores indicate better mobility or activity. T-score and SEM are derived using conversion tables in the AM-PAC Short Forms Manual 2.0.26
P < .05 based on paired t test or Wilcoxon signed-rank test.
The mean (SD) difference in total T-scores between participant and therapist was also statistically significant whether participants’ self-assessment was completed before the therapy evaluation (6.2 [9.4]; N = 38) or after (4.3 [7.8]; N = 32). Of the 6 items scored, the mean difference in item-level scores differed significantly between participants and therapists for 5 and 4 items in the before- and after-evaluation groups, respectively.
In the full sample, the ICC for the “6-Clicks” mobility total T-score was 0.57 (95% CI = 0.42–0.69), indicative of moderate reliability. However, reliability was higher when the participant completed their self-assessment after the therapy evaluation (ICC = 0.67, 95% CI = 0.47–0.80) compared with before the therapy evaluation (ICC = 0.50, 95% CI = 0.26–0.67) (Tab. 3). The Bland–Altman plot (Figure 1) indicates that agreement was most variable for total scores in the mid-range.
Reliability Between Patient and Therapist “6-Clicks” Total T-Scores and Stratified by Timinga
| Total Sample | Patients Completed Before Service | Patients Completed After Service | |
|---|---|---|---|
| Mobility scores | |||
| ICC (95% CI) | 0.57 (0.42–0.69) | 0.50 (0.26–0.67) | 0.67 (0.47–0.80) |
| Activity scores | |||
| ICC (95% CI) | 0.45 (0.28–0.59) | 0.34 (0.06–0.56) | 0.52 (0.29–0.70) |
ICC = intraclass correlation coefficient ([2,1], 2-way random effects, consistency, single rater).
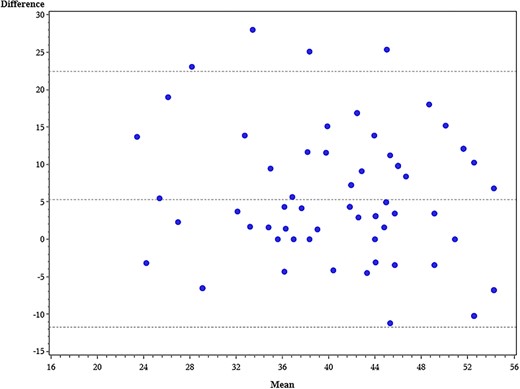
Bland–Altman plot of “6-Clicks” mobility total T-score agreement between patient and physical therapist. x axis = average physical therapist and patient T-score; y axis = difference between physical therapist and patient T-score. Horizontal reference lines indicate the 95% limits of agreement.
For each individual “6-Clicks” mobility item, the quadratic weighted kappa (κ) ranged from 0.18 to 0.39 in the full sample. As with the total score, agreement tended to be higher at the item level in the after-evaluation group (range of κ = 0.24 to κ = 0.53) compared with the before-evaluation group (range of κ = 0.14 to κ = 0.28) (Tab. 4).
Agreement Between Patient and Therapist Mobility and Activity Items and Stratified by Timinga
| “6-Clicks” Measure | Items | Total Sample κ (95% CI) | Patient Completed Before Service κ (95% CI) | Patient Completed After Service κ (95% CI) |
|---|---|---|---|---|
| Mobility | Rolling | 0.18 (0.08 to 0.28) | 0.14 (0.03 to 0.26) | 0.24 (0.06 to 0.41) |
| Supine to sit | 0.25 (0.12 to 0.39) | 0.14 (0.00 to 0.29) | 0.45 (0.23 to 0.67) | |
| Moving to chair | 0.33 (0.18 to 0.47) | 0.23 (0.01 to 0.46) | 0.41 (0.22 to 0.60) | |
| Sit to stand | 0.39 (0.22 to 0.55) | 0.28 (0.01 to 0.56) | 0.49 (0.30 to 0.68) | |
| Walking in room | 0.33 (0.17 to 0.49) | 0.21 (−0.02 to 0.44) | 0.46 (0.24 to 0.67) | |
| Climbing stairs | 0.39 (0.24 to 0.54) | 0.26 (0.06 to 0.47) | 0.53 (0.33 to 0.72) | |
| Activity | Lower body clothing | 0.38 (0.21 to 0.55) | 0.26 (0.02 to 0.50) | 0.48 (0.25 to 0.71) |
| Bathing | 0.26 (0.04 to 0.47) | −0.11 (−0.43 to 0.22) | 0.51 (0.28 to 0.73) | |
| Toileting | 0.53 (0.37 to 0.69) | 0.44 (0.17 to 0.70) | 0.64 (0.46 to 0.81) | |
| Upper body clothing | 0.28 (0.05 to 0.50) | 0.21 (−0.12 to 0.53) | 0.36 (0.07 to 0.66) | |
| Grooming | 0.20 (−0.07 to 0.47) | 0.24 (−0.14 to 0.62) | 0.11 (−0.20 to 0.42) | |
| Eating | 0.19 (−0.16 to 0.54) | 0.40 (−0.10 to 0.90) | −0.03 (−0.09 to 0.03) |
κ = Quadratic weighted kappa.
Reliability of “6-Clicks” Activity
For the “6-Clicks” activity short form, the mean (SD) total T-score determined by the occupational therapist for the entire sample (N = 71) was 44.7 (8.1), whereas the mean (SD) total T-score determined by participants was 43.0 (7.8), a mean difference of 1.7 (8.4) points, which was not statistically significant (P = .10) (Tab. 2). Similarly, no significant difference was observed for the mean [SD] difference in total T-scores between participant and therapist when participants’ self-assessment was completed before the therapy evaluation (1.1 [8.8]; N = 35) or after (2.2 [8.0]; N = 36). Of the 6 items scored, the mean difference in item-level scores differed significantly between participants and therapists for 1 and 2 items in the before- and after-evaluation groups, respectively.
For the “6-Clicks” activity short form, the overall ICC for the total score in the full sample was 0.45 (95% CI = 0.28–0.59), indicative of moderate reliability. However, reliability between participant and occupational therapist scores increased when the participant completed their self-assessment after the therapy evaluation (ICC = 0.52, 95% CI = 0.29–0.70) compared with before the therapy evaluation (ICC = 0.34, 95% CI = 0.06–0.56) (Tab. 3). The agreement in scores for the “6-Clicks” activity was most variable in the mid-range to highest of the total T-scores (Fig. 2).
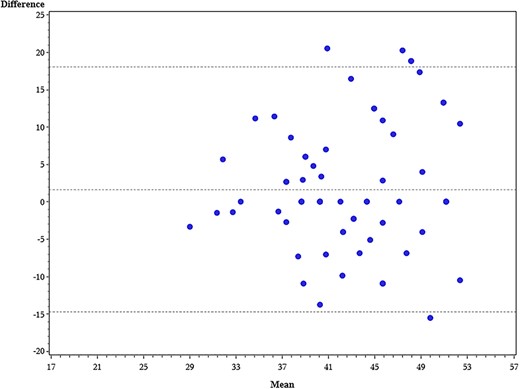
Bland–Altman plot of “6-Clicks” activity total T-score agreement between patient and occupational therapist. x axis = average occupational therapist and patient T-score; y axis = difference between occupational therapist and patient T-score. Horizontal reference lines indicate the 95% limits of agreement.
For the total sample, agreement for each individual “6-Clicks” activity item ranged from κ = 0.19 to κ = 0.53. For the before-evaluation group, item-level agreement ranged from κ = −0.11 to κ = 0.44, and for the after-evaluation group it ranged from κ = −0.03 to κ = 0.64 (Tab. 4).
Discussion
In this prospective study of the interrater reliability of the AM-PAC “6-Clicks” basic mobility and daily activity short forms between participants and therapists, we found moderate reliability. Reliability and agreement were higher between participants and physical therapists using the mobility assessment than between participants and occupational therapists using the activity assessment. For both tools, participants’ and therapists’ scores agreed more when participants completed their self-assessment following the therapy evaluation compared with before.
Despite lower reliability for the activity short form compared with the mobility short form, we did observe smaller mean differences in scores between participants and occupational therapists using the activity short form than between participants and physical therapists using the mobility short form. The reason for this discrepancy may be the greater variability in mobility scores than activity scores. ICCs are lower if between-participant variability is low. Mobility scores were observed across the continuum of the mobility scale, whereas activity scores were mostly observed near the top of the score range. The standard error of measurement is larger at either end of the continuum and has greater precision in the middle of the score range.20 Because activity scores were more likely to be higher, their measurement error was also higher, which could be 1 explanation for the lower ICC demonstrated for activity versus mobility scores.
The level of reliability observed in our study, although moderate, is lower than observed for previous studies of the reliability of the AM-PAC when scored by a clinical proxy. Haley et al,25 using what was at the time of their study the full item banks for the AM-PAC basic mobility (21 items) and daily activity (29 items) functional domains, estimated ICCs of 0.91 and 0.82, respectively, for assessments completed by clinicians and 31 participants in inpatient rehabilitation or transitional care settings. Jette et al,24 in a study of the computer adaptive test version of the AM-PAC that included 67 participants with stroke who were admitted to inpatient rehabilitation facilities, estimated ICCs of 0.72 and 0.63 for the mobility and activity domains, respectively. The ICCs we estimate in this study (0.57 for the mobility domain and 0.45 for the activity domain) may be lower for several reasons. First, we calculated reliability using 2-way random effects (ICC[2,1]), which generalizes the 2 raters. The other studies do not specify the ICC formula, which could substantially affect the magnitude of reliability. If we had chosen other formulas to calculate ICC, our reliability would increase to 0.73 for mobility and 0.62 for activity scores, like those reported in the study from Jette et al.24 Second, we specifically used the “6-Clicks” short forms of the AM-PAC. These short forms each assess 6 distinct tasks, whereas the previous studies drew from more robust item banks to assess function and derive total functional scores. The ability to assess function using a broader bank of items may positively impact the likelihood of score reliability from 2 different raters. Third, ours is the first study, to our knowledge, to assess the proxy reliability of AM-PAC items scored in the acute care hospital, where illness and injury acuity is greater than for those samples with whom proxy reliability had been assessed in prior studies. This greater acuity likely contributes to greater uncertainty (particularly on the part of patients) in the perception of independence with functional tasks, which is underscored by the fact that participants’ scores were consistently lower than therapists’ scores. Lastly, the clinical heterogeneity of our overall sample, although purposeful to be representative of the standard utilization of the “6-Clicks” in practice, may have influenced the estimated level of reliability because this is likely to differ across clinical populations.
Two additional findings from our study highlight that uncertainty about perceived independence with functional tasks influences scoring. First, in the full sample and in the before- and after-evaluation subsamples, agreement was greater for scores from the mobility short form compared with the activity short form. The tasks scored on the mobility short form (eg, getting out of bed and walking) are often performed by individuals in the hospital, whereas the tasks scored on the activity short form (eg, getting dressed and grooming) are not performed as often by most patients. Having the opportunity to attempt the tasks that are scored likely influences perceptions of independence and subsequent scoring responses. Second, as a related observation, agreement between participants and therapists was higher when the participant completed their self-assessment after the therapy evaluation. Of note, the timing of participants’ self-assessment was randomized to before or after the evaluation, but therapists completed their scoring after the evaluation for all participants, which is consistent with standard practice. For participants who completed their assessments after evaluation, both the therapist and participant were able to observe participants’ performance with many of the tasks that are scored on the short forms, which likely contributed to more agreement.
Although moderate reliability may be acceptable, we expected higher reliability between participant and therapist scores than was observed in the study, particularly in the after-evaluation groups. In addition to the perceptions of independence potentially influencing scoring responses, reliability may be limited because of inconsistent understanding of the response meanings. Whereas the therapists in this study have all used the “6-Clicks” short forms with each of their patients and so have been trained to conceptualize the meaning of each of the levels of physical assistance assessed by the tools (eg, “a lot” of assistance means the patient can contribute only 50% effort or less toward the task), patients in this study were not equally trained. Thus, when asked, “How much help do you currently need to [complete a particular task]?” different patients may have considered an otherwise equivalent amount of assistance as, for example, “a lot” versus “a little.”
Importantly, the AM-PAC “6-Clicks” short forms were validated as therapist-measured tools.20 With only moderate reliability between therapists and patients, clinicians should continue to score the “6-Clicks” in standard practice to appropriately apply the evidence-informed decision-making processes that have become associated with its score (eg, discharge disposition recommendations6–10,32 and setting mobility goals5,33). Further, whereas the AM-PAC was designed to measure patients’ functional status across the continuum of care (ie, observing functional status changes from the hospital to post-acute care settings to the community), we would caution against doing so without careful consideration to the mode of measurement. Measurement error was higher for the therapists than the participants, probably due to the therapists’ scores being indicative of higher functioning than indicated by the participant self-report. Thus, any change captured by AM-PAC scores at various time points and/or in different settings, if scored at one point by a clinician and at another by a patient, is likely to include variable measurement error in addition to biases introduced by having therapist versus patient respondents.
Limitations
Our study has important limitations to note. Individuals who were not appropriately alert and oriented were excluded. Many individuals in the hospital have cognitive impairments and/or delirium, which would affect their ability to complete a self-assessment of function. Excluding such persons limits the generalizability of our findings, even for those within the hospital setting, to only those whose cognition is grossly intact. Similarly, we did not include a formal assessment of cognition for participants who were included in the study so were unable to analyze how cognitive status may have influenced scores. Additionally, although the distribution of scores in our sample is representative of the general patient population in our hospital, the limited number of scores at the lower end of the “6-Clicks” score range for both the mobility and activity short forms may have adversely affected the estimation of reliability.
We demonstrate in this study that the interrater reliability of the AM-PAC “6-Clicks” mobility and activity short forms between therapists and patients is moderate, higher for the mobility short form than the activity short form. Taken with the previous evidence that these tools are valid for the assessment of functional status for patients in the hospital when scored by a clinician and that their interrater reliability between clinicians is substantial, our findings suggest that they are best used as clinician-scored instruments. Due to the variability demonstrated in this study, caution should be exercised when using repeated measures of the AM-PAC if the scores come from patients versus clinicians at separate time points. As the AM-PAC “6-Clicks” short forms continue to inform clinical decisions and to address research questions, particularly in the acute care setting, it is important to keep these considerations in mind.
Author Contributions
Concept/idea/research design: J.K. Johnson, B. Lapin, I. Katzan, M. Stilphen
Writing: J.K. Johnson, B. Lapin, F. Bethoux, A. Skolaris
Data collection: J.K. Johnson
Data analysis: B. Lapin
Project management: J.K. Johnson
Providing participants: J.K. Johnson
Providing facilities/equipment: M. Stilphen
Consultation (including review of manuscript before submitting): I. Katzan, M. Stilphen
Funding
There are no funders to report for this study.
Ethics Approval
This study was approved by the Cleveland Clinic Institutional Review Board (#19-1612).
Disclosures
The authors completed the ICMJE Form for Disclosure of Potential Conflicts of Interest and reported no conflicts of interest.

Comments