


Abstract
The study investigated whether cognitive effort decision-making measured via a neuroeconomic paradigm that manipulated framing (gain vs. loss outcomes), could predict daily life engagement in mentally demanding activities in both younger and older adults.
Younger and older adult participants (N = 310) completed the Cognitive Effort Discounting paradigm (Cog-ED), under both gain and loss conditions, to provide an experimental index of cognitive effort costs for each participant in each framing condition. A subset of participants (N = 230) also completed a 7-day Ecological Momentary Assessment (EMA) protocol measuring engagement in mentally demanding daily life activities.
In a large, online sample, we replicated a robust increase in cognitive effort costs among older, relative to younger, adults. Additionally, costs were found to be reduced in the loss relative to gain frame, although these effects were only reliable at high levels of task difficulty and were not moderated by age. Critically, participants who had lower effort costs in the gain frame tended to report engaging in more mentally demanding daily life activities, but the opposite pattern was observed in the loss frame. Further analyses demonstrated the specificity of reward-related cognitive motivation in predicting daily life mentally demanding activities.
Together, these results suggest that cognitive effort costs, as measured through behavioral choice patterns in a neuroeconomic decision-making task, can be used to predict and explain engagement in mentally demanding activities during daily life among both older and younger adults.
A growing literature has suggested a motivational view of cognitive aging (Ebner et al., 2006; Hess, 2014; Swirsky & Spaniol, 2019). In particular, older adults may experience greater subjective costs associated with effortful cognitive activities, which leads to a reduced willingness to engage in such activities, unless they are found to be sufficiently motivating. Indeed, prior findings have revealed a decrease in the overall number of cognitively demanding activities older adults engage in throughout their daily lives (Hertzog et al., 2008). Likewise, physiological markers indicating higher cognitive costs are associated with reduced intrinsic motivation to perform cognitive activities (Hess et al., 2018; Queen & Hess, 2018). These changes may have important consequences for health and well-being. Maintained engagement in cognitively effortful activities has been shown to positively correlate with preservation of cognitive function in older adulthood (Hultsch et al., 1999), and may also be associated with decreased risk for developing Alzheimer’s disease (Wilson et al., 2007). Such findings highlight the importance of understanding the mechanisms that contribute to age-related changes in cognitive motivation, and how these might impact older adults’ daily life engagement in cognitively effortful activities.
The field of neuroeconomics offers a promising framework from which to investigate motivational changes in cognitive effort-based decision-making during older adulthood. A key focus of this framework is on value-based decision-making, in which choices are made according to subjective motivational value and reflect the integration of various sources of reward and cost (Shenhav et al., 2013). Critically, this enables the quantification of the costs of cognitive effort in economic terms, whereby motivational incentives (e.g., monetary gains or losses) are required to offset the costs of engagement in a task with high effort. As such, this framework suggests age-related motivational reprioritization might alter the relevant cost-benefit tradeoffs used to guide decisions about whether to engage in cognitive effort. Indeed, previous work with the Cognitive Effort Discounting (Cog-ED) paradigm, which directly employs the neuroeconomic decision-making framework, supports this hypothesis. Specifically, with the Cog-ED task, a number of prior studies have repeatedly found that, relative to younger adults, older adults require greater amounts of motivational incentives to offset the costs of cognitive effort (Aschenbrenner et al., 2022; Froböse et al., 2020; Hess, Lothary, et al., 2021; Westbrook et al., 2013). Most recently, it was found that these age-related changes might be at least partially related to brain amyloid accumulation (Aschenbrenner et al., 2022), which is also consistent with earlier findings that increased engagement in cognitive activities in daily life is associated with reduced beta-amyloid accumulation among healthy older adults (Landau et al., 2012).
Despite the advances in quantifying cognitive motivation across the adult life span using experimental tasks and paradigms, there has been little work that has attempted to directly relate these findings to daily life activities. Moreover, many of the findings that document age-related changes in daily activities (e.g., Queen & Hess, 2018) are often assessed through retrospective self-report measures, rather than using reports occurring at the time of the activity (or shortly thereafter). Retrospective reports may differentially impact older adult response patterns, given declines in fluid cognitive functioning (Klumb & Baltes, 1999), and greater susceptibility to positivity biases in the recall of emotional information (Neubauer et al., 2020). In younger adults, research has shown that participants’ cognitive effort costs, indexed via the Cog-ED, are positively associated with the average demand of their daily life activities, assessed via experience sampling (Culbreth et al., 2020). In other words, people who have lower Cog-ED effort costs also report engaging in more demanding daily life activities than those with higher Cog-ED effort costs. Likewise, results from a daily diary study in older adults demonstrated that the motivation to perform activities, measured in the laboratory, was predictive of everyday activity engagement, with the effect being specific to those activities thought to place demands on cognitive resources (Hess et al., 2018). Nevertheless, there have been no investigations directly comparing older and younger adults, which have used both experimental measures and intensive micro-longitudinal assessments (i.e., experience sampling) to test for age-related changes in cognitive motivation and their impact on daily life activities.
Furthermore, an important limitation of prior research examining cognitive effort costs in older adults is that so far it has not considered how the framing of incentives, whether trying to gain monetary rewards or avoid losses, affects the relevant cost-benefit tradeoffs involved in decisions pertaining to cognitive effort. This question has high relevance for aging research, given the theorized (Baltes, 1997; Heckhausen et al., 2019) and observed age-related motivational shifts from gain orientation to increased focus on maintenance and loss prevention (Ebner et al., 2006; Gong & Freund, 2020; Mustafić & Freund, 2012). Recent work has shown that younger adults discount losses less than gains across both physical and cognitive effort domains (Farinha & Maia, 2021; Massar et al., 2020). Moreover, a study examining gain and loss incentive framing on physical effort-based decisions in both younger and older adults found that older adults were more motivated to perform effortful tasks when they could avoid monetary losses, rather than accrue monetary gains, whereas younger adults showed the opposite pattern of results, with greater effort mobilization for gains relative to losses (Byrne & Anaraky, 2019). However, there have not yet been parallel age group comparison studies conducted in the domain of cognitive effort-based decision-making. This is an important gap in the literature, since it is currently unknown whether the framing of incentives, whether gain or loss-related, also impacts cognitive effort engagement differentially for younger and older adults (e.g., Seaman et al., 2016).
The current study investigated cognitive effort costs in younger and older adults, both in terms of gain and loss framing, and in the relationship between experimentally derived effort costs and daily life behavior. To accomplish these aims, we asked participants to complete both gain and loss versions of the Cog-ED in addition to completing a seven-day experience sampling protocol to index the mental demand of daily life activities. We pre-registered a number of key hypotheses (https://osf.io/2jtpb/). First, given age-related motivational reprioritization toward maintenance and loss prevention, in contrast to the gain-related motivational orientation often observed in younger adults (Ebner et al., 2006), we predicted that there would be an age × framing interaction, such that older adults would show steeper discounting of cognitive effort costs relative to younger adults in the gain domain, but that these age-related effort cost effects would be reduced in the loss condition. Second, as an extension of prior work in younger adults (Culbreth et al., 2020), we hypothesized that experimental measurements of cognitive effort costs in the gain domain would index the propensity of both younger and older adults to engage in mentally demanding activities in daily life, but that there would be a more tightly coupled relationship (e.g., steeper slope, stronger association) in older adults, reflecting increased selectivity in activity participation as a result of higher costs of engaging in cognitive effort (Hess et al., 2021; Hess & Ennis, 2012; Queen & Hess, 2018).
Method
Participants
Participants were adults, ages 18–40 and 60–80 years, recruited through the online research platform Prolific (www.prolific.co) (Palan & Schitter, 2018). Inclusion criteria for participation included English as native language, with no lifetime history of neurological trauma or seizures, no current use of psychotropic medications, and current residency in the United States. The sample consisted of 310 participants (190 females; Mage = 26.2, SDage = 6.3 [younger adults]; Mage = 65.6, SDage = 5.2 [older adults]; 1 American Indian or Alaskan Native, 13 Asian, 30 Black or African American, 252 White, 14 more than 1 race; 29 Hispanic or Latinx). A subset of these participants completed an additional experimental protocol involving the use of Ecological Momentary Assessment (EMA); N = 230 (see Supplementary Material for full demographic breakdown of the subsample). All experimental procedures were approved by the Washington University Human Research Protections Office prior to data collection. Participants provided informed consent and were compensated $10/hour for all study procedures, with the opportunity to gain up to an additional $8 bonus, based on the experimental tasks and $0.25 for each completed EMA survey (or a bonus payment of $15 if they completed ≥80% of all surveys).
The hypotheses for the discounting and EMA portions of the study were pre-registered separately. These pre-registrations, along with all data and code, can be found in the central repository for this project (https://osf.io/2jtpb). The pre-registration also contains a power analysis used to inform sample size, which indicated that a sample of 250 participants would provide 84% power [0.753, 0.906] to detect the interaction of Framing Condition and Age Group. However, because data collection was conducted online in batches of participants (with the anticipation of drop-out across the discounting and EMA study components), the final sample size (N = 310) exceeded the minimum sample size needed to detect this effect.
Design
Cognitive effort discounting
To examine the relationship between experimental measures of cognitive effort costs and daily life mental demand, we employed the Cog-ED as an established experimental paradigm to enable quantitative estimation of the subjective value (i.e., cost) of cognitive effort in older and younger adults (Aschenbrenner et al., 2022; Froböse et al., 2020; Hess, Lothary, et al., 2021; Westbrook et al., 2013). Multiple prior studies have demonstrated that the Cog-ED provides stable and consistent within-person measurements across different cognitive domains and time in both younger and older adults (Aschenbrenner et al., 2022; Crawford et al., 2022; Westbrook et al., 2019). Furthermore, even when controlling for the effects of individual differences in task performance and working memory capacity on discounting across distinct cognitive domains (Aschenbrenner et al., 2022; Crawford et al., 2022), participants in both age groups still show strong domain-general cognitive effort discounting. Together, this prior work suggests that the Cog-ED is a suitable tool for assessing the trait-like tendency to engage in cognitive effort in older as well as younger adults, and does not merely reflect other stable individual differences, such as working memory capacity.
In the Cog-ED, participants are first familiarized with the N-back working memory task (Familiarization Phase), performing task levels that vary in mental demand (levels N = 1–4, 20 trials/level). Following each run of the N-back, participants completed self-reported ratings of the mental demand, physical demand, temporal demand, effort, frustration, and performance from the preceding task block using the NASA Task Load Index (TLX; Hart, 2006). Participants provided their responses using a visual analog scale ranging from 1 (very low) to 21 (very high). These ratings helped to serve as a manipulation check and were used in control analyses to examine the effect of self-reported frustration and performance on effort discounting (Supplementary Material).
After experiencing and practicing the N-back task at each load level during the familiarization phase, the decision-making phase occurs, in which participants must make repeated choices about whether to repeat performance of a higher load level of the N-back (e.g., 4-back) for a larger reward, or instead perform the easiest load level (1-back) for a smaller reward. The offer for the smaller reward is then stepwise titrated until participants are indifferent between the two offers (i.e., they would choose either offer equally). These indifference points estimate the “cost” of cognitive effort. In other words, the indifference point reflects the amount of money an individual is willing to forgo to avoid performing the more effortful task. For continuity with the prior literature examining discounting in many domains, including time, probability, and effort (e.g., Green & Myerson, 2004; Seaman et al., 2018), we also inter-changeably use the terminology of subjective value to refer to this indifference point. For example, if a participant was making choices between performing the 1-Back versus the 3-Back with a starting amount of $4 for the 3-Back and the indifference point was equal to $1 after the calibration trials, the subjective value estimate for this pairing would be 0.25 (i.e., the indifference point divided by the fixed, large-reward value for that pairing).
Critically, participants were informed that one of their choices would be used to determine compensation, and that in the final “performance phase” of the experiment, they would be asked to repeat the task they chose, for the amount of money offered (i.e., $2 for the 2-back). It is important to note that, consistent with prior work using this paradigm (Aschenbrenner et al., 2022; Crawford et al., 2022; Culbreth et al., 2020; Westbrook et al., 2013), compensation was not based on performance from the familiarization phase. Rather, participants were told that in order to successfully earn the money for repeating the chosen task, they would need to maintain their effort from the familiarization block when repeating the task block (in actuality, all participants earned the bonus money).
In addition to performing the gain version of the Cog-ED, participants were asked to perform the Cog-ED in a loss context. The discounting procedure was identical to the gain condition, except that participants were first given an initial $5 endowment, and then asked to make decisions between low-effort tasks associated with larger monetary losses and high-effort tasks with smaller monetary losses (see Figure 1 for an example). As in the gain condition, participants were informed that, in the performance phase, one of their choices from the decision-making phase would be selected for them to repeat for the amount of reward offered on that trial (i.e., participants received compensation for the randomly selected trial across both gain and loss effort discounting conditions at the conclusion of the experiment). The order of task administration of the discounting tasks (gain, loss) was counter-balanced across participants.
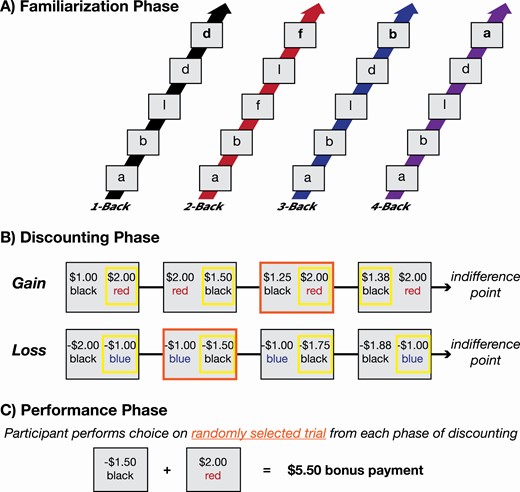
Overview of the cognitive effort discounting paradigm (Cog-ED). (A) Participants complete an initial familiarization phase where they perform four levels of the N-Back task in which they determine if the current letter is a target (bolded for visualization) or non-target. The color of the arrow for each task level corresponds to the label that level of the task is given to avoid anchoring effects (e.g., 2-Back = “red”). (B) After task familiarization, participants complete the discounting phase during which they make a series of decisions about whether to repeat performance of a higher load level of the task or instead perform the easiest load level. The offer amount for the lower effort option is stepwise titrated until the indifference point is reached. (C) A trial from the discounting phase is selected (highlighted in orange) and participants complete that level of the task for the amount of money offered. Two trials are chosen in this experiment for participants to repeat: one from the gain discounting and one from the loss discounting.
Daily life sampling
To examine the relationships between the costs of cognitive effort (i.e., Cog-ED subjective value estimates) and the mental demand of activities in daily life, we invited participants to also complete our EMA protocol. After completing the Cog-ED, participants completed a tutorial describing the necessary steps to download the EMA app (Expiwell; https://www.expiwell.com) and complete the EMA surveys. First, participants were instructed to download Expiwell on their phone and answer a series of questions (e.g., what initial start date did they enter into the app), to ensure that they could understand and follow the instructions for downloading the app and setting up the delivery of the EMA surveys. Next, participants were taken through the structure and content of the EMA survey (including all survey items) and were asked to answer questions about the contents of the survey to ensure proper understanding before beginning the protocol.
All procedures were completed remotely, online, with the opportunity to message the experimenters if participants had any questions or concerns. If participants did not answer the questions successfully (N = 28; 41 additional participants did not enter any information about EMA procedures via the questionnaires at all) or did not have mobile phones that were compatible with the EMA software (N = 11), their data were not included in the final analyses for this portion of the study. As a part of the 7-day EMA protocol, participants received six randomly prompted surveys per day over a fixed 12-hr window, with approximately 2 hr in between each survey, for a total of 42 assessment points. Due to the nature of online testing, all participants received prompts during the same 12-hr window; this was not customized to each participant.
For each survey, participants received a notification containing a link to complete the survey through Qualtrics (Qualtrics, Provo, UT). Upon clicking on the survey link, they were asked to record the activities they engaged in, during the past 2 hr, from a list of activities. Following this prompt, a subset of up to three of the previously endorsed activities were randomly sampled for participants to answer additional questions about. Specifically, these questions asked participants to rate how mentally demanding each of these activities was (using a rating scale ranging from “Not at all” (1) to “Extremely” (5)) and their level of motivation and enjoyment toward each activity. The survey items indexing daily life activities and mental demand were adapted from previous work in younger adults (Culbreth et al., 2020), which aimed to assess the relationships between the costs of engaging in effort (i.e., using discounting paradigms like the Cog-ED) and daily life experiences using EMA. In addition, participants were asked to answer additional questions about their current affective state at the time of each survey and who they are interacting with at the time of the survey (see Supplementary Appendix 1 for detailed information on the structure and content of the survey); however, these data are not analyzed here. Participants were allotted 30 min to begin the survey after each notification from the app, after which time their responses were not recorded. If participants did not complete the survey within 15 min after the initial notification, they automatically received a reminder to complete the survey. Overall, participants completed 74.5% of all surveys delivered.
Analysis
Cognitive effort discounting
We extracted subjective value estimates from both the gain and loss discounting conditions across all participants. If a participant failed to complete both versions of the Cog-ED, their data were not included in the analyses for this study (N = 4). Prior to performing statistical analyses, we transformed the subjective value estimates from the loss condition by multiplying them by −1 to keep the scaling consistent across the two incentive domains. To test hypotheses related to the age × framing interaction, we entered task level, condition, age group, and their interactions as fixed effects into a multilevel model with subjective value as the dependent variable: Subjective Value ~ Task Level × Condition × Age Group + (1 | Participant); task level was contrast coded (2-back = −1, 3-back = 0, 4-back = 1), whereas condition (Gain = 0, Loss = 1) and age group (Young = 0, Old = 1) were dummy coded. In addition, we tested for the effects of task order because the order of conditions was counter-balanced across participants; task order was entered into the model as a dummy coded variable (Gain first = 0, Loss first = 1), although this control analysis was not initially pre-registered.
Daily life sampling
In the present experiment, the EMA data are inherently nested (i.e., EMA data points occur within individuals). Thus, to account for the dependences in this data structure we conducted our analyses using multilevel models. To test our central hypothesis that there is a positive relationship between cognitive effort costs and daily life mental demand, we included the subjective value estimates calculated through the gain and loss versions of the Cog-ED (measuring individual participants’ willingness to expend cognitive effort) as centered level-2 variables in addition to controlling for age group (dummy coded; Young = 0, Old = 1), time of day (contrast coded; Morning = −1, Afternoon = 0, Evening = 1) and day of the week (numeric coding ranging from 0 to 6; Monday = 0, Sunday = 6). The dependent variable for the multilevel model was the mean of the mental demand ratings at each measurement occasion; participants supplied up to three mental demand ratings at each time point, so these estimates were averaged to create a single mental demand value for each measurement occasion. Furthermore, we conducted additional analyses to test for the interactions between age group and subjective value estimates to test our hypothesis that the strength of these associations is moderated by age group.
We also conducted additional exploratory analyses aimed at assessing whether there is a unique effect of reward motivation (i.e., sensitivity to engaging in cognitive effort for gains vs. losses) on daily life mental demand. In all the multilevel models reported in this manuscript, we included the intercept as a random effect; all other covariates were entered as fixed effects. All multilevel models were conducted with the packages lme4 (version 1.1-27.1; Bates et al., 2015) and lmerTest (version 3.1-3; Kuznetsova et al., 2017), in R version 4.1.0 (http://www.r-project.org/; https://scicrunch.org/resources/Any/record/nlx_144509-1/SCR_001905/resolver?q=*&l=; R CoreTeam, 2018) and effects are reported as the estimate from the model with 95% confidence intervals and the corresponding test statistic and p-value.
Results
Cognitive Effort Discounting
Replicating previous work conducted in the laboratory environment (e.g., Culbreth et al., 2020; Westbrook et al., 2013), but here with an online sample, we found that N-back task load was associated with decreased subjective value estimates, indicating that cognitive effort costs progressively increased with increased task difficulty (i.e., 4-back > 3-back > 2-back; B = −0.14 [−0.16, −0.11], t = −10.37, p < .001; Figure 2). Critically, we also extended prior results (Westbrook et al., 2013), in demonstrating with a large and well-powered sample, a robust age effect, B = −0.12 [−0.18, −0.06], t = −3.82, p < .001. Older adults had lower subjective value estimates overall (M = 0.51, SD = 0.38) as compared to younger adults (M = 0.64, SD = 0.33), reflecting higher cognitive effort costs. Control analyses indicated that these age effects on cognitive effort costs could not be explained by key self-reported ratings of frustration or performance (from the NASA TLX; Supplementary Material).
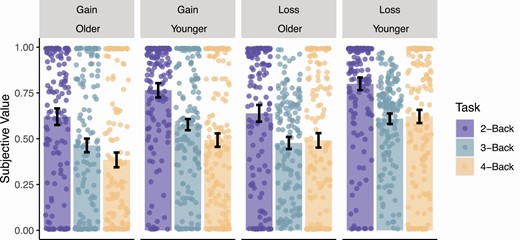
Subjective value of cognitive effort predicted by age group, task level, and incentive framing condition. Higher values of subjective value signify lower costs of cognitive effort. Error bars represent 95% confidence intervals.
In addition, we also observed an effect of framing condition, B = 0.07 [0.04, 0.10], t = 4.33, p < .001. Subjective value estimates were higher in the loss domain (M = 0.61, SD = 0.34) relative to the gain domain (M = 0.55, SD = 0.38), indicating that participants were more willing to choose to engage in cognitive effort for monetary incentives that were framed as avoiding larger potential losses versus obtaining higher gains. Interestingly, the framing effect interacted with task load, B = 0.05 [0.01, 0.08], t = 2.53, p = .011. Specifically, there was no overall difference in discounting between gain and loss conditions for low (2-back; t(309) = −1.42 [−0.65, 0.01], p = .158) or medium levels of effort (3-back; t(309) = −1.31 [−0.06, 0.01], p = .190), but there was a difference at the highest level of effort (4-back; t(309) = −6.15 [−0.16, −0.08], p < .001). These results indicate that, only at the highest level of task difficulty (i.e., 4-back), was subjective value was higher in the loss condition (M = 0.56, SD = 0.38) than in the gain condition (M = 0.44, SD = 0.38).
However, the pre-registered age group × framing interaction was not significant, B = −0.02 [−0.06, 0.02], t = −0.88, p = .379, nor were any of the other interactions in the model, ps > .340 (Table 1). As an additional control, we tested for the effects of task order on cognitive effort discounting. Task order was not a significant predictor of subjective value, B = −0.02 [−0.08, 0.04], t = −0.57, p = .570; all other previously reported effects remained significant, ps < .011, after including task order into the model (Table 1). Further summary of N-Back task performance and its effects on subjective value estimates can be found in the Supplementary Material.
Effects of Task Level, Incentive Framing Condition, Age Group, and Task Order on Subjective Value Estimates (i.e., costs of cognitive effort)
| Subjective value | Subjective value | |||||||
|---|---|---|---|---|---|---|---|---|
| Predictors | Estimates | CI | Statistic | p | Estimates | CI | Statistic | p |
| (Intercept) | 0.61 | 0.57–0.65 | 27.92 | <.001 | 0.62 | 0.57–0.67 | 23.78 | <.001 |
| Task level | −0.14 | −0.16 to −0.11 | −10.37 | <.001 | −0.14 | −0.16 to −0.11 | −10.37 | <.001 |
| Condition | 0.07 | 0.04–0.10 | 4.33 | <.001 | 0.07 | 0.04–0.10 | 4.33 | <.001 |
| Age group | −0.12 | −0.18 to −0.06 | −3.82 | <.001 | −0.12 | −0.18 to −0.06 | −3.79 | <.001 |
| Task level × Condition | 0.05 | 0.01–0.08 | 2.53 | .011 | 0.05 | 0.01–0.08 | 2.53 | .011 |
| Task level × Age group | 0.02 | −0.02–0.06 | 0.95 | .340 | 0.02 | −0.02–0.06 | 0.95 | .340 |
| Condition × Age group | −0.02 | −0.06–0.02 | −0.88 | .379 | −0.02 | −0.06–0.02 | −0.88 | .379 |
| Task level × Condition × Age group | −0.00 | −0.06–0.05 | −0.10 | .919 | −0.00 | −0.06–0.05 | −0.10 | .919 |
| Task order | −0.02 | −0.08–0.04 | −0.57 | .570 |
Notes: CI = confidence interval. Task level was contrast coded (2-back = −1, 3-back = 0, 4-back = 1), whereas condition (Gain = 0, Loss = 1), age group (Young = 0, Old = 1), and task order (Gain first = 0, Loss first = 1) were entered into the model as dummy coded variables. p < 0.05 are shown in bold.
Daily Life Mental Demand
On average, participants endorsed engaging in approximately two activities in the previous 2 hr (M = 2.18, SD = 1.25, range = 1–13). Further descriptive information pertaining to the mental demand ratings and activities of the sample (e.g., person means, iSD) can be found in the Supplementary Material. Prior to conducting the multilevel models described above, we ran a null model of the mental demand ratings and extracted the intraclass correlation coefficient (ICC) in order to the partition the within- and between-person variance. The ICC for the null model was 0.226, suggesting that daily life mental demand consisted of both within-person variance (77.4%) and between-person variance (22.6%), providing a sound rationale to conduct our planned analyses examining the contribution of between-person differences in the costs of cognitive effort and within-person daily life variables (e.g., time of day, day of survey) on daily life mental demand.
We observed a main effect of age group, B = −0.14 [−0.26, −0.02], t = −2.24, p = 0.025, demonstrating that older adults engaged in overall less mentally demanding daily activities, after controlling for the other model covariates (see Supplementary Table 1 for full model output). Further, we replicated and extended the findings of Culbreth et al. (2020), in that subjective value of cognitive effort was a significant predictor of engagement in mentally demanding activities, B = 0.75 [0.42, 1.09], t = 4.38, p < .001. In other words, participants who had a higher subjective value of cognitive effort in the gain domain (i.e., lower cognitive effort costs) tended to report engaging in more mentally demanding daily life activities. Although cognitive effort costs in the loss domain were positively correlated with the gain domain, in both younger, r = .58 [0.47, 0.68], t = 9.14, p < .001, and older adults, r = .54 [0.41, 0.64], t = 7.66, p < .001, they exhibited an opposite pattern of association with daily life activities, B = −1.01 [−1.39, −0.63], t = −5.19, p < .001. Specifically, participants who had a higher subjective value of effort in the loss domain (i.e., greater willingness to engage in cognitive effort to avoid losing money) engaged in less rather than more mentally demanding activities in daily life.
We did observe an interaction between cognitive effort costs and age group across both gain, B = −0.49 [−0.93, −0.05], t = −2.16, p = .030 (Figure 3a) and loss incentive domains, B = 0.70 [0.21, 1.18], t = 2.81, p = .005 (Figure 3b). However, these effects were counter to our pre-registered prediction, in that younger adults exhibited a tighter coupling of the costs of cognitive effort and daily life mental demand engagement in both gain and loss incentive contexts, relative to older adults (Supplementary Table 1). Moreover, as an additional control, we found that the effects of subjective value (gain and loss) and its interactions with age group remained after controlling for the number of activities completed at each measurement occasion and the total number of surveys completed over the sampling period, ps < .026. Further control analyses suggest that these effects were not due to fluctuations in energy level. Including self-reported ratings of arousal or sluggishness in the period prior to engaging in activities did not alter the relationship between cognitive effort costs (as measured by the Cog-ED) and the mental demand of such activities (even though sluggishness did predict a generalized reduction in engagement with demanding activities; see Supplementary Material for further details and discussion of both sets of control analyses).
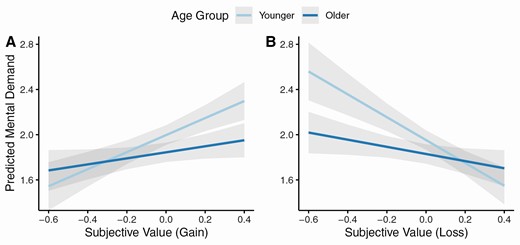
Daily life mental demand as predicted by gain and loss subjective value estimates across both younger and older adults (from multilevel model). Confidence bands represent 95% confidence intervals.
To further investigate the gain and loss patterns, we conducted an exploratory analysis, to compare participants who were more reward motivated, in that they exhibited lower cognitive effort costs in the gain relative to loss domain (i.e., gain > loss subjective value), with those who were more loss motivated (i.e., loss > gain subjective value). Strikingly, reward motivated individuals tended to report more engagement in mentally demanding daily life activities, B = 0.54 [0.26, 0.81], t = 3.78, p < .001, and this was not moderated by age group, B = −0.30 [−0.65, 0.05], t = −1.69, p = .090; see Supplementary Material for related exploratory analyses.
Discussion
We found compelling evidence for the linkage between experimentally derived measures of cognitive effort costs and naturalistic assessment of engagement in daily life mentally demanding activities across both younger and older adults. As an extension of prior work (Culbreth et al., 2020), but with a large online sample including older as well as younger adults, we found that in both age groups, individuals who exhibited lower effort costs (in the gain domain) tended to have higher levels of engagement in mentally demanding activities in daily life. Strikingly, the opposite pattern was observed in the loss domain, wherein participants who were the most likely to engage in cognitive effort to avoid losing money actually had lower levels of engagement in mentally demanding activities in daily life. Importantly, both effects explained unique variance in the multilevel model predicting daily life mental demand when entered simultaneously, which suggests that the cognitive effort costs measured across both incentive domains tap into distinct aspects of daily life behavior. Furthermore, exploratory analyses revealed a specific relationship to reward-related cognitive motivation, as individuals exhibiting higher subjective value for cognitive effort to obtain reward outcomes (rather than to avoid losses), also reported higher engagement in mentally demanding activities in daily life.
Furthermore, the results clearly showed that older adults discount cognitive effort overall more than younger adults, providing additional empirical support for age-related increases in the subjective costs of cognitive effort, in a large, online sample. As a novel extension of this prior work, both younger and older adults completed discounting across loss incentive framing conditions in addition to the gain framing (i.e., the original version of the Cog-ED). We observed that participants tend to discount losses less than gains overall, however, this effect appeared to be driven by differences between gain and loss discounting at the highest level of task difficulty; both younger and older adults have higher subjective value estimates (i.e., less discounting) at the highest level of task difficulty, but not at lower levels of task difficulty. This pattern of results replicates and extends prior work in younger adults using a similar cognitive effort discounting paradigm, which showed that younger adults discount cognitive effort less in loss incentive contexts only at high levels of task difficulty (Massar et al., 2020).
Contrary to our pre-registered predictions, we did not observe any interactions with age group in terms of the framing effect. This suggests that younger and older adults show similar patterns of cognitive effort discounting across gain and loss incentive contexts, with older adults having overall higher cognitive effort costs. Although this pattern of results contrasts prior work in other research domains, multiple meta-analyses have found no differences in gain and loss framed decision making across older and younger adults (Best & Charness, 2015; Mata et al., 2011), which might suggest that the nature of these age-related motivational shifts is highly task specific. Conversely, we did find age-related interactions in the relationship between cognitive effort costs and daily life activity. These were also counter to our pre-registered predictions, in that this relationship was stronger for younger relative to older adults, in both gain and loss domains. Interestingly, however, the multilevel modeling indicated that not only were there overall age-related reductions in daily life mentally demanding activities, but that much of this age-related variance could be accounted for by cognitive effort costs, which were significantly increased in older adults.
Future Directions and Limitations
Together, these findings provide a strong foundation and clear guidance regarding promising future research directions. For example, future studies could use the EMA data to test for the subsequent affect experienced after engaging in mentally demanding activities, and whether such effects are moderated by age. These results could help to clarify the affective component of age-related cognitive effort costs (i.e., investigating the socioemotional selectivity account of mental demand engagement in daily life; Charles & Carstensen, 2010). Likewise, the results suggest the potential of experimental interventions aimed at reducing cognitive effort costs, as these might be instrumental in increasing older adults’ daily life engagement in mentally demanding activities, with the associated protective effects that this confers. Furthermore, it remains an open question as to how cognitive effort costs fluctuate within-person across time and whether such metrics can be used to predict the types of activities people choose to engage in daily life. Relatedly, a final direction of high potential is to rigorously test the relative contributions of between-person characteristics (e.g., cognitive ability and motivation; Queen & Hess, 2018) and dynamic within-person fluctuations during daily life, such as affect and social interactions, to better determine how they respectively account for variation in effortful activities across the adult life span.
The findings also suggest the importance of discovering the biological mechanisms associated with increased cognitive effort costs in older adults. Prior functional magnetic resonance imaging (fMRI) studies in younger adults have pointed to the brain valuation network, with key nodes in ventromedial prefrontal cortex and striatum, as being critical for cognitive effort-based decision-making (Lopez-Gamundi et al., 2021; Westbrook et al., 2019), while positron emission tomography (PET) studies have implicated the dopamine system (Westbrook et al., 2020, 2021). However, a heterogenous pattern of findings have been found in older adults, with both preservation of fMRI valuation signals (Seaman et al., 2018), and maintenance/increases in striatal dopamine synthesis capacity (Karrer et al., 2017), but also decreases in PET radioligand indices of striatal D2 receptor binding potential (Berry et al., 2018; Seaman et al., 2019). These findings suggest that assessing the function of valuation-related regions in older adults, using a combination of PET and fMRI modalities, will be most informative in providing insights into the nature of age-related increases in cognitive effort costs. Moreover, acquiring these neural measures could also shed light on individual differences in discounting behaviors across gain and loss incentive contexts that contribute to the observed pattern of daily life behaviors reported in this manuscript (for review, see Yee et al., 2021). Finally, studies on the relationship of cognitive effort costs to daily life mental activities should also assess AD-related biomarkers (e.g., beta-amyloid) in older adults, as recent work has indicated that the presence of such biomarkers may contribute to age-related increases in effort cost (Aschenbrenner et al., 2022).
Although a clear strength of the study was its large sample size, the online nature of data collection (which facilitated the sample size increase) was also a potential source of limitation. With online data collection, participant samples may be distinct in make-up compared with in-person studies, experimenter control over task performance is clearly lower, and the experimental session time may also need to be significantly reduced (as was done here, to 1 hour), limiting the number of additional measures that could be collected. Consequently, we did not collect health-related measures or measures of job complexity, which are likely to be an important factor when assessing the mental demand of daily life activities, especially across age groups (e.g., Hess et al., 2012); nor were we able to use standard cognitive screening instruments given the remote, online task administration. Likewise, we did not acquire other cognitive measures that could enable rigorous tests of the contribution of cognitive ability to cognitive effort costs in younger and older adults. Nonetheless, we did conduct analyses controlling for N-Back performance (accuracy and RT) and self-reported ratings of performance and frustration in the models predicting subjective value and all effects remained when controlling for these variables, suggesting that cognitive ability and self-reported performance metrics do not fully explain cognitive effort costs (Supplementary Material). It is also important to acknowledge that the present study used an extreme group design, which could exaggerate the effect of age on these estimates, relative to the richer age effects that could emerge with a continuous life span sample.
Conclusion
Despite its limitations, the present study provides some of the first data linking experimental assessments of cognitive motivation with the daily life behavior in younger and older adults, capitalizing on a sample that was many times larger than any of the previous work conducted in this domain. We confirmed that older adults exhibit increased cognitive effort costs, as assessed by the Cog-ED decision-making task, and in both gain and loss domains. We further demonstrated that ecological validity of these findings by demonstrating that older adults also exhibited clear reductions in engagement in mentally demanding activities during daily life. These effects were strongly linked to the Cog-ED, with independent contributions of both the gain and loss-related effort cost measures, while also suggesting a specific role for reward-related cognitive motivation in promoting daily life effortful activity engagement. Indeed, the results are consistent with the idea that it is the increase in cognitive effort costs experienced by older adults that leads them to reduce engagement in mentally demanding activities in their daily lives. Taken together, these results suggest that the estimates of cognitive effort costs obtained with the Cog-ED task, in both gain and loss incentive contexts, provide a sensitive metric that can be used to help understand how older and younger adults experience daily life activities, as well as how these experiences might change with increasing age.
Acknowledgments
We thank Vivian Gao, Angela Gormley, HN Hoffmann, and Julia Strauss for their assistance with data collection. Furthermore, we are grateful to the members of the Cognitive Control & Psychopathology Lab for useful feedback on the experiments reported in the manuscript. A portion of this work was presented at the Cognitive Aging Conference (2022). All data, study materials, relevant pre-registrations, and analysis code are publicly available on the Open Science Framework (https://osf.io/2jtpb/).
Funding
This work was supported by the National Institutes of Health (R24-AG054355 subaward to J. L. Crawford and R21-AG067295 to T. S. Braver). J. L. Crawford was further supported by National Institutes of Health grants T32-AG000030 and T32-NS115672. T. S. Braver and T. English were further supported by the National Institutes of Health grant R01-AG070139.
Conflict of Interest
None declared.

