


Abstract
A burgeoning literature links being married to better cognitive health, but less attention has been paid to how couples view their marital relationships. Couples do not always concur in their assessments, and such discrepancies affect both partners’ health. We present a dyadic study on whether and how overall and discrepant views of marital quality predicted (a) dementia onset and (b) changes in older adults’ depressive symptoms with spousal dementia.
A pooled sample of couples aged 50+ (dyad N = 3,936) from the Health and Retirement Study rated positive and negative marital quality at baseline (2006/2008). Each participant reported whether they had been told of having dementia and their depressive symptoms once every other year (2006/2008–2014/2016).
Cox proportional hazards regression revealed that older adults who rated their marriages either more positively or more negatively than their spouses were more likely to develop dementia. We applied multiphase growth curve modeling to older adults whose spouses developed dementia, finding that those in marriages that were more negative overall reported more depressive symptoms but exhibited a smaller increase in these symptoms in response to spousal dementia.
This study adds to the literature by showing how discrepant marital assessments shape cognitive aging and offers new insights into identifying older adults with greater dementia risk. Findings also revealed the impact of overall negative marital quality on older adults’ psychological adjustment to spousal dementia, which could inform interventions intended to help couples better cope with early-stage dementia from a relational perspective.
Aging co-occurs with inevitable declines in some cognitive functions (e.g., memory), with dementia being an extreme pathological case that negatively affects many older adults (Salthouse, 2019). It is estimated that almost 6 million Americans live with Alzheimer’s disease (AD), the most common type of dementia and the fifth leading cause of death in later life (Alzheimer’s Association, 2020). Older adults with dementia typically require intensive care from their family members, who experience considerable physical, emotional, and financial challenges (Pinquart & Sӧrensen, 2011; Zarit et al., 2019). Thus, researchers have devoted increasing efforts to identifying risk and protective factors that underlie the development of dementia, in the hope of designing preventions that can delay such impairment. The current study added to this growing body of research with a focus on one of the yet scantly examined social factors—older adults’ relationships with their spouses. A spouse is often first to attend and respond to their partners’ needs, share suffering, and incur burden (Zarit et al., 2019). Although research has revealed salubrious effects of being married on cognitive health (Fingerman et al., 2020), marriage is not always positive, especially in the context of one partner experiencing cognitive impairment (Kiecolt-Glaser & Wilson, 2017; Umberson et al., 2006). This study assessed positive and negative marital quality and examined the impact of marital quality on both the development of dementia and changes in well-being with spousal dementia.
To the best of our knowledge, we present the first dyadic study of marital quality and dementia onset that utilizes both partners’ ratings of their marital quality. Most studies have relied on one partner’s self-report on relationships (Liu & Waite, 2014; Liu et al., 2021; Xu et al., 2016), but partners may not necessarily concur when evaluating their marriages (Carr & Boerner, 2009). Overall views on marriage reflect a holistic assessment of marital quality at the couple level, whereas discrepant views present individual differences within a couple. Discrepancies can lead to detrimental outcomes, such as greater stress, poorer emotional well-being, and worse psychological adjustment following stressful events (Carr & Boerner, 2009; Clare et al., 2012; Liang et al., 2001). We extended prior research and asked whether overall and discrepant views on marital quality are associated with dementia onset and older adults’ responses to the onset of spousal dementia; these responses may influence how well older couples cope with the cognitive impairment and manage their own stress and burden. Findings can make unique contributions to our understanding of marriage and health in later life. Further, this study may offer new insights into the burgeoning dyadic programs by targeting couples at greater risk and suggesting some nondrug strategies to reduce the risk of dementia and protect older adults’ mental health in the face of spousal dementia onset.
Marital Quality and Dementia Onset
A plethora of research documents that compared to nonmarried older adults, married older adults experience slower cognitive declines and are less likely to develop dementia (Fingerman et al., 2020; Sommerlad et al., 2018). Yet, much less attention has been paid to the quality of these older adults’ marriages, which may matter more than the simple presence of a spouse. To address this gap, the current study drew on the burgeoning literature of social relationships and cognitive aging (Fingerman et al., 2020) and asked how marital quality is associated with dementia. We examined overall and discrepant views on marital quality.
An overall high-quality marriage may grant older adults unique access to various resources protecting them against cognitive declines. High positive marital quality may facilitate spousal network overlap and promote social engagement, which have been associated with better cognitive health and delayed cognitive impairment (Berkman et al., 2000; Cornwell, 2012; Fingerman et al., 2020). Older adults in marriages with more conflicts (i.e., those who report more negative marital quality), however, tend to report increased feelings of loneliness (Hsieh & Hawkley, 2018) and heightened reactivity to stress (August et al., 2007), which have been shown to increase risk for all-cause dementia (Greenberg et al., 2014; Sundstrӧm et al., 2020).
We also looked at spousal discrepancies in marital quality, which have been overlooked in the literature. Scholars propose that over the course of an intimate relationship, couples tend to develop a shared understanding of their relationship (Berger & Kellner, 1964). Similar positive marital assessments may help couples maintain satisfying close relationships and enhance their experience of positive emotions (Liang et al., 2001); these positive emotions, according to the broaden-and-build theory, could widen participants’ scope of attention and help build cognitive resources over time (Fredrickson, 2013; Johnson et al., 2010). A longitudinal study has explicitly linked positive emotions to reduced risk for dementia (Murata et al., 2016). Further, a growing body of research highlights benefits of co-experienced positive emotions (Brown & Fredrickson, 2021); thus, partners both enjoying their marriage may report better well-being. Yet, couples do not always agree with each other when assessing their marital quality (Carr & Boerner, 2009); such violated consensus views likely elicit stressful tensions (Deal et al., 1992) that contribute to increased dementia risk (Greenberg et al., 2014). Discrepant views on marital quality may reflect imbalance of love and poor communication leading to distress and negative emotions in the relationship (Kilmann & Vendemia, 2013; Liang et al., 2001), which have been shown to increase individuals’ risks for cognitive impairment (Pellegrino et al., 2013; Wilson et al., 2007).
We expected that older adults who reported better marital quality overall (i.e., more positive and less negative marital quality), and who held less discrepant views on marital quality (particularly when views indicate better marital quality) would be less likely to develop dementia.
Marital Quality and Psychological Response to Spousal Dementia
We then tracked changes in older adults’ depressive symptoms as their spouses develop dementia and asked whether marital quality affects these changes. Spousal dementia may present unprecedented challenges to older adults and influence their own well-being. The stress process model (Pearlin et al., 1981) identifies various stressors that may be encountered by older adults when they have family members living with dementia; exposure to such stressors is typically greater in the case of spousal dementia given that couples often share the same households. Stress related to spouses’ dementia may occur as a process that changes over time as older adults encounter and adapt to stressors (Zarit et al., 2019), such as their spouses’ behavioral problems (e.g., aggressive behaviors, wandering), memory loss, and disabilities in self-care activities (McKhann et al., 2011). Thus, we expected to observe changes in older adults’ depressive symptoms as they encountered the onset of their spouses’ dementia.
These changes may vary, however, depending on their marital quality. The stress buffering hypothesis proposes positive relationships as a key resource that helps people cope with stressors and protects their well-being (Cohen & Wills, 1985). Couples who report more positive marital quality are also more likely to treat one partner’s dementia as a shared stressor and engage in dyadic coping, which predicts better well-being (Berg & Upchurch, 2007). Yet, some studies have documented that individuals who report more positive marital quality may exhibit worse well-being when their spouse is suffering given emotional contagion (Monin et al., 2017). We considered competing hypotheses with regard to how positive marital quality is associated with older adults’ depressive symptoms in response to their spouses’ dementia.
Negative marital quality and discrepant views on marital quality may clearly reduce older adults’ resilience during such a stressful transition. The stress-exacerbation model explains the detrimental effect of negative marital quality on individuals’ physiological responses to stress, which leads to emotional burnout and worse well-being (August et al., 2007). As for discrepant views on marital quality, research has observed a positive link between discrepancy and stress in spousal caregivers of people with early-stage dementia (Clare et al., 2012). It is possible that spousal discrepancy prior to the onset of spousal dementia already affect how older adults would respond to this onset that heralds loss of intimate exchange and elicits depression (Aneshensel et al., 1995). Indeed, research on spousal loss—another major stressful transition for older adults-has linked preloss discrepancy in marital quality to poorer psychological adjustment to bereavement and more negative emotions (e.g., anger; Carr & Boerner, 2009).
Other Factors as Covariates
We adjusted for demographic characteristics and health indicators associated with marital quality, dementia onset, and depressive symptoms. Demographic characteristics included participants’ age, gender, education, household income, racial/ethnic status, employment status, marital duration, and caregiver status. Research has revealed age-related cognitive declines (Salthouse, 2019); older adults are at greater risk of having dementia (Alzheimer’s Association, 2020). Women tend to rate marital quality less positively (Carr & Boerner, 2009), and they are more likely to develop dementia (Ruitenberg et al., 2001). Socioeconomic status, as indicated by education and household income, acts as a protective factor against cognitive declines (Sattler et al., 2012). Individuals from different racial/ethnic groups differ in their marital quality (Bulanda & Brown, 2007), and in the prevalence of dementia (Mehta & Yeo, 2017). Having a spouse with dementia may add extra burden to those who are already spending much time working for pay. We also considered how long older couples have been married, which may influence their assessments of marital quality and how they respond to their spouses’ dementia onset (Allendorf & Ghimire, 2013). Spouses do not always take on a caregiver role. Little research explicitly compares spousal caregivers and spouses who do not assume caregiving responsibilities. Yet, compared to their noncaregiver counterparts, caregivers tend to report poorer marital quality and health including depressive symptoms (Clare et al., 2012; Pinquart & Sӧrensen, 2003).
Health indicators included self-rated health, number of chronic conditions, and functional limitations. Physical health is strongly associated with cognitive health (Frisoni et al., 2000), and individuals living with dementia are likely to exhibit some functional or psychological problems (Tschanz et al., 2011). We also adjusted for participants’ cognitive function at baseline, as some older adults may experience cognitive impairment but never seek out a diagnosis.
The current study used longitudinal data (across five waves) from the Health and Retirement Study (HRS) on older adults’ dementia and depressive symptoms. Utilizing data from older couples, we examined both partners’ reports to examine overall and discrepant views on marital quality. We asked whether older adults with better marital quality overall and less discrepant views are less likely to develop dementia (Hypothesis 1). We then examined the role marital quality plays in the changes in older adults’ depressive symptoms with spousal dementia onset (Hypothesis 2). We tested competing hypotheses for overall positive marital quality, but expected those who reported more negative marital quality and more discrepant views to be less resilient in response to the onset of spouses’ dementia.
Method
Data and Study Sample
We used data from the HRS, a nationally representative panel study of Americans aged 50+ and their spouses (spouses were recruited regardless of age). The core interviews of the HRS have been conducted approximately once every other year, but the key variable of this study, marital quality, was assessed in the Leave Behind Questionnaire (LBQ; Participant Lifestyle Questionnaire; Smith et al., 2017). The LBQ was added in 2006 and administered to two random halves of the sample in alternative waves; thus, the LBQ data in the same sample were collected once every 4 years. The two subsamples were mutually exclusive, and we pooled participants from 2006 and 2008 as the initial wave (i.e., baseline) and tracked them across five waves (2014 and 2016 in the last wave, respectively; 8 years). We adjusted for a dummy variable (0 = initial wave in 2006, 1 = initial wave in 2008) in the model.
In total, 8,698 participants (4,682 completed the 2006 LBQ and 4,016 completed the 2008 LBQ) were included in the pooled sample; they were all married or partnered, their spouses/partners were also a part of the HRS, and they reported no missing data in marital quality in the initial wave (see Supplementary Figure 1 for a detailed flow chart of analytic sample selection). Among the 8,698 participants, 510 were excluded because at least one partner in the couple was younger than 50 years old, and 316 were excluded because at least one partner already had dementia in the initial wave. The final sample included 7,872 participants (dyad N = 3,936); they were older, less likely to be non-White or working for pay, and had more chronic conditions than the excluded participants (n = 826). We drew on data from 7,872 participants and addressed the question of whether their marital quality influenced the likelihood of developing dementia in the following waves. We then focused on a subsample of participants whose spouses reported dementia. In total, 526 spouses reported dementia. Yet, 116 participants passed away or dropped out of the study before their spouses received a diagnosis, leaving us 410 participants in the analytic sample who reported depressive symptoms at the onset of spousal dementia.
Measures
Marital quality
In the LBQ, participants indicated how they felt about seven statements about their spouses: (a) how much do they really understand the way you feel about things, (b) how much can you rely on them if you have a serious problem, (c) how much can you open up to them if you need to talk about your worries, (d) how often do they make too many demands on you, (e) how much do they criticize you, (f) how much do they let you down when you are counting on them, and (g) how much do they get on your nerves (Liu et al., 2021; Umberson et al., 2006). Responses were coded on 1 (not at all), 2 (a little), 3 (some), and 4 (a lot). Mean scores were calculated to indicate positive (first three items; α = .78) and negative (last four items; α = .78) marital quality; these variables were treated as missing if participants had missing values for two or more items on the positive scale and three or more items on the negative scale.
We calculated four marital quality scores. We measured overall marital quality at the couple level by averaging both partners’ ratings of their marital relationship (i.e., two mean scores per couple, one for positive quality and the other for negative quality). We also presented a novel calculation of discrepant views of marital quality by subtracting partner rating of marital quality from participant’s own rating of marital quality (i.e., two discrepancy scores per participant, one for positive quality and the other for negative quality; Lee et al., 2012). This calculation allowed us to capture whether and how participants rated their marriage more positively and negatively than their spouses. Overall and discrepant views of marital quality were continuous predictor variables entered into models simultaneously, adjusting for each other.
Dementia onset
In 2006 and 2008, participants indicated whether a doctor has ever told them they had a memory-related disease (1 = yes, 0 = no). Starting from 2010, participants indicated whether a doctor has ever told them that they had (a) AD and (b) dementia, senility, or any other serious memory impairment (1 = yes, 0 = no). Using these items, we generated variables to indicate whether the participant reported that they had dementia at each wave’s interview and identify at which wave the dementia diagnosis was first reported.
Depressive symptoms
We also considered depressive symptoms, rated by participants using the shortened version of the Center for Epidemiological Studies-Depression scale (Radloff, 1977). In each wave, participants indicated whether they had experienced certain symptoms much of the time during the past week (1 = yes, 0 = no). Symptoms include eight items: feeling depressed, everything was an effort, restless sleep, was happy, felt lonely, enjoyed life, felt sad, and could not get going. We reverse-coded two items that were phrased positively (i.e., was happy, enjoyed life) and created a sum of depressive symptoms (α = .77–.79 across waves).
Background characteristics
We adjusted for background characteristics measured at baseline (i.e., the initial wave, 2006 or 2008). Participants reported age in years, gender (1 = male, 0 = female), employment status (1 = working for pay, 0 = not working for pay), and racial/ethnic status (non-Hispanic White [treated as the reference group], Hispanic, non-Hispanic Black, and non-Hispanic other race). Participants reported the number of years they attended school. For participants’ income, we used the cleaned and imputed income variable provided by the RAND Corporation and transformed it using the inverse hyperbolic sine function due to a highly skewed distribution (Friedline et al., 2015). Participants reported the number of years they have been married, as a measure of marital duration.
We also considered participants’ health at baseline. Participants self-rated their health (1 = poor, 2 = fair, 3 = good, 4 = very good, and 5 = excellent) and reported the number of chronic conditions they ever had, including eight conditions (e.g., hypertension, psychiatric problems, diabetes, and arthritis). We took out psychiatric problems and generated a new score of chronic conditions (including seven conditions) for the second hypothesis predicting depressive symptoms. They indicated whether they had limitations in performing 12 activities (e.g., walking, jogging, and picking up a dime), all coded as 1 (yes) or 0 (no) and then summed (Nagi, 1976). Participants completed the Telephone Interview for Cognitive Status (Servais, 2010), which tested immediate and delayed recall of 10 words (1 point per word), five trials of serial 7s (1 point per trial), and backward counting (2 points). The composite score of cognition ranges from 0 to 27, and a score below 7 (i.e., 0–6) has been used to identify dementia (Crimmins et al., 2011). We adjusted for a binary variable indicating whether participants had cognitive impairment as severe as dementia at the initial wave based on their cognitive scores. We generated a variable indicating whether participants provided any unpaid care related to basic and instrumental activities of daily living (e.g., toileting, dressing, shopping) to their spouses post the transition to dementia (1 = yes, 0 = no).
Analytic Strategy
Our first hypothesis stated that higher overall and less discrepant marital quality predicted a reduced likelihood of developing dementia. We estimated Cox proportional hazards regression analysis using PROC PHREG (SAS 9.4), adjusting for the clustering of couple. We created an event variable for each participant indicating whether they developed dementia (1 = yes, 0 = no) and a time variable measuring how many years had passed since the baseline when a participant reported dementia. During the study period, 526 participants developed dementia (7%), while 1,395 passed away (18%) without a report of dementia, and 836 dropped out without a report of dementia (11%). We treated dementia, death, and dropout (attrition) as competing risks—given the nature of panel data of older adults. We present hazard ratios (HRs) of developing dementia by marital quality. All four continuous predictors of marital quality were entered into one model. We adjusted for participants’ background characteristics (i.e., age, gender, education, income, minority status, work status, marital duration) and health information (i.e., self-rated health, number of chronic conditions, functional limitations, cognition) measured at baseline.
Our second hypothesis focused on older adults whose spouses developed dementia during the study period (n = 410); we expected that older adults would differ by marital quality in the changes in their depressive symptoms at the onset of spousal dementia. We first estimated the model depicting within-person changes in depressive symptoms related to spousal dementia (Model 1) and then examined between-person differences in multiple phases of the change (Model 2). We generated two variables: (a) time-to/from-spouse-dementia and (b) reaction, following prior research that examined changes in response to major stressful events (Singer & Willett, 2003). Because participants reported onset of dementia at different waves (in different years), we realigned their spouses’ depressive symptoms in relation to the wave the onset of dementia was reported (Fauth et al., 2012). Time-to/from-spouse-dementia measures the distance in time from spousal dementia (i.e., centered at the transition point when spouse reported dementia). This variable allowed us to track changes in older adults’ depressive symptoms prior to, within 2 years of, and in subsequent years following a report of spousal dementia. We calculated the time metric in specific years rather than waves. Reaction is a time-varying dummy variable (0 = prior to transition, 1 = at/post transition) that measures whether a change is observed in older adults’ depressive symptoms in response to the onset of spousal dementia. We also entered an interaction term of time-to/from-spouse-dementia and reaction to examine changes prior to and post spousal dementia.
We then examined whether marital quality explained between-person variability in depressive symptoms during the transition related to spousal dementia. We added marital quality variables at the participant level (level 2), and included the same set of control variables (except that in this model we used seven items for chronic conditions excluding psychiatric disorders and added a variable indicating caregiver status); all continuous variables were grand mean centered.
Results
Table 1 presents sample characteristics. On average, participants were 67 years old, completed 13 years of education, and reported good physical health. About one in every five participants self-identified as non-White. Over a third of participants (38%) were still working for pay. Couples in this sample have been married for about an average of 38 years. Most couples are heterosexual, but we also included nine lesbian couples and seven gay couples in this study. Most couples reported high positive and low-to-moderate negative marital quality. We observed spousal discrepancy in marital quality among the majority of participants (i.e., having nonzero discrepancy scores); 64% of participants disagreed on positive marital quality and 84% disagreed on negative marital quality.
Background Characteristics of the Study Sample
| All participants (N = 7,872) | Participants whose spouses developed dementia (n = 410) | |
|---|---|---|
| Variable | M (SD) | M (SD) |
| Age | 67.36 (8.95) | 71.48 (8.54) |
| Education (in years) | 12.86 (3.00) | 12.87 (2.81) |
| Income | 78,988.03 (94,393.56) | 64,143.32 (64,679.99) |
| Marital duration (in years) | 37.97 (15.51) | 41.01 (17.12) |
| Self-rated health | 3.27 (1.06) | 3.27 (1.03) |
| Chronic conditionsa | 1.94 (1.37) | 2.05 (1.32) |
| Functional limitations | 2.16 (2.46) | 2.43 (2.52) |
| Cognition | 15.73 (4.11) | — |
| Overall marital qualityb | ||
| Positive | 3.51 (0.48) | 3.49 (0.47) |
| Negative | 1.96 (0.55) | 1.99 (0.54) |
| Discrepant marital qualityc | ||
| Positive | 0.00 (0.68) | -0.19 (0.69) |
| Negative | 0.00 (0.74) | 0.03 (0.69) |
| Depressive symptomsd | — | 1.47 (1.91) |
| Proportion | Proportion | |
| Male | .50 | .44 |
| Race | ||
| Non-Hispanic White | .82 | .85 |
| Non-Hispanic Black | .07 | .07 |
| Hispanic/Latinx | .08 | .07 |
| Other race | .02 | .02 |
| Working for pay | .38 | .26 |
| TICS score below 7e | .04 | .04 |
| Caregiving post spousal dementia | — | .70 |
Notes: All characteristics were measured at baseline (2006/2008), except depressive symptoms when spouses developed dementia. SD = standard deviation; TICS = Telephone Interview for Cognitive Status.
aNumber of chronic conditions based on the 8-item scale; for the 7-item scale adjusted for in the model testing Hypothesis 2, M = 1.88, SD = 1.25.
bAveraged across partners; range from 1 to 4.
cSelf-rating subtracted by partner rating; range from −3 to 3.
dAt the onset of spousal dementia.
e1 = received a TICS score below 7 (indicating cognitive impairment as severe as dementia), 0 = received a TICS score of 7 or higher.
Marital Quality and Dementia Onset
Our first hypothesis was that overall and discrepant views on marital quality would predict the likelihood of developing dementia (see Table 2). Cox proportional hazards regression revealed that older adults who reported more positive (HR = 1.25, p = .002) and negative marital quality (HR = 1.15, p = .021) than their spouses were more likely to report a diagnosis of dementia. We did not observe significant findings with regard to overall positive (HR = 0.96, p = .73) or negative marital quality (HR = 1.14, p = .21).
Cox Proportional Hazards Regression Predicting Dementia Onset From Marital Quality
| Variable | B (SE) | HR |
|---|---|---|
| Overall marital qualitya | ||
| Positive | −0.04 (0.12) | 0.96 |
| Negative | 0.13 (0.10) | 1.14 |
| Discrepant marital qualityb | ||
| Positive | 0.22** (0.07) | 1.25 |
| Negative | 0.14* (0.06) | 1.15 |
| Covariates | ||
| Age | 0.09*** (0.01) | 1.10 |
| Male | 0.07 (0.10) | 1.08 |
| Education (in years) | 0.04* (0.02) | 1.04 |
| Hispanic | 0.16 (0.19) | 1.17 |
| Non-Hispanic Black | −0.09 (0.18) | 0.91 |
| Other race | −0.32 (0.40) | 0.73 |
| Self-rated health | −0.22*** (0.06) | 0.81 |
| Chronic conditions | 0.02 (0.04) | 1.02 |
| Functional limitations | 0.04 (0.02) | 1.04 |
| Working for pay | −0.62*** (0.14) | 0.54 |
| Income | 0.02 (0.06) | 1.02 |
| Marital duration (in years) | −0.01 (0.00) | 0.99 |
| Random samplec | −0.18 (0.10) | 0.84 |
| TICS score below 7d | 1.36*** (0.16) | 3.92 |
| −2 log likelihood | 7,641.5 |
Notes: Participant N = 7,872. HR = hazard ratio; SE = standard error; TICS = Telephone Interview for Cognitive Status.
aAveraged across partners.
bSelf-rating subtracted by partner rating.
c0 = initial wave in 2006, 1 = initial wave in 2008.
d1 = received a TICS score below 7 (indicating cognitive impairment as severe as dementia), 0 = received a TICS score of 7 or higher.
*p < .05. **p < .01. ***p < .001.
We also conducted survival analysis for competing risks—death and attrition. More positive marital quality overall (HR = 0.84, p = .017) was associated with a smaller likelihood of death without a report of dementia, whereas spousal discrepancy in positive marital quality (HR = 1.16, p < .001) predicted a greater likelihood to drop out of the study (not shown in table).
Marital Quality and Psychological Response to Spousal Dementia
We tracked within-person changes in depressive symptoms among the 410 participants whose spouses developed dementia (see Model 1 in Table 3). Multiphase growth curve models revealed a significant increase in older adults’ depressive symptoms at their spouses’ dementia onset on average (B = 0.31, p = .014). Figure 1 presents changes in older adults’ depressive symptoms over time, centered at spouses’ dementia onset.
Multiphase Growth Curve Models Predicting Changes in Older Adults’ Depressive Symptoms in Response to Spouses’ Dementia Onset
| Model 1 | Model 2 | |
|---|---|---|
| Variable | B (SE) | B (SE) |
| Fixed effects | ||
| Intercept (β 0i) | 1.20*** (0.12) | 1.39 (0.79) |
| Overall positive marital qualitya | — | −0.06 (0.17) |
| Overall negative marital qualitya | — | 0.49** (0.15) |
| Discrepant positive marital qualityb | — | −0.10 (0.11) |
| Discrepant negative marital qualityb | — | −0.07 (0.09) |
| Time-to/from-dementia (β 1i) | 0.00 (0.03) | 0.00 (0.02) |
| Reaction (β 2i) | 0.31* (0.12) | 1.48 (1.00) |
| × Overall positive marital qualitya | — | −0.24 (0.19) |
| × Overall negative marital qualitya | — | −0.35* (0.17) |
| × Discrepant positive marital qualityb | — | 0.08 (0.12) |
| × Discrepant negative marital qualityb | — | 0.12 (0.11) |
| Time-to/from-dementia × Reaction (β 3i) | 0.05 (0.03) | 0.02 (0.03) |
| Random effects | ||
| Intercept variance | 1.48*** (0.26) | 0.65** (0.23) |
| Time-to/from-dementia variance | 0.00 (0.01) | 0.01 (0.01) |
| Reaction variance | — | 0.39 (0.42) |
| Residual variance | 2.02*** (0.09) | 1.37*** (0.08) |
| −2 log likelihood | 7,090.6 | 4,897.2 |
Notes: SE = standard error. Participant n = 410. Intercept and reaction were fully adjusted for covariates in Model 2 (not shown in table). The level-1 equation for individual i’s depressive symptoms at time t: Depressive symptomsti = β 0i + β 1i (time-to/from-spouse-dementiati) + β 2i (reactionti) + β 3i (time-to/from-spouse-dementiati × reactionti) + eti; the intercept β 0i refers to individual i’s depressive symptoms in the year of spousal dementia onset; β 1i is an individual-specific slope indicating rates of linear change in individual i’s depressive symptoms prior to spousal dementia; β 2i captures the effect of spousal dementia on individual i’s depressive symptoms; β 3i examines whether rates of change in individual i’s depressive symptoms differed prior to and post spousal dementia; eti indicates residual error.
aAveraged across partners.
bSelf-rating subtracted by partner rating.
*p < .05. **p < .01. ***p < .001.
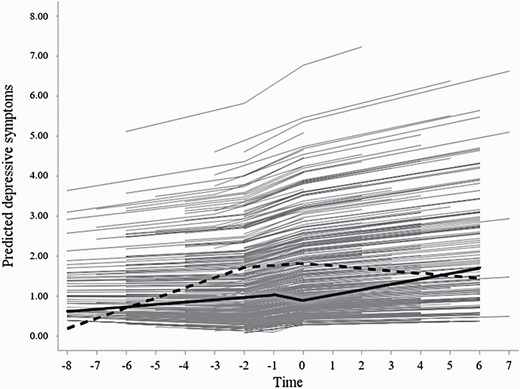
The effect of overall negative marital quality on depressive symptoms in response to spouses’ dementia onset. Notes: Time was centered at the onset of spousal dementia (yearly interval). Solid curve = low overall negative marital quality; dashed curve = high overall negative marital quality.
We then examined the effect of marital quality on changes in depressive symptoms with spouses’ dementia onset (see Model 2 in Table 3). Older adults in marriages characterized by more negative quality overall (i.e., more negative marital quality averaged across partners) had more depressive symptoms (B = 0.49, p = .001) but exhibited a smaller increase in these symptoms (B = −0.35, p = .039) in response to their spouses’ dementia onset. See solid curve versus dashed curve in Figure 1. We did not find significant effects of other marital quality indicators.
Post-Hoc Tests
Given documented gender differences, we estimated the moderating effect of gender in all models. Yet, no significant gender differences were observed. We estimated models to examine interaction effects between overall and discrepant views on marital quality. Findings showed that the detrimental impacts of discrepant views on marital quality were particularly salient among couples who reported poorer marital quality overall (low positive marital quality: B = −0.36, p = .007; high negative marital quality: B = 0.29, p = .017). We calculated absolute discrepancy between two partners’ ratings within each couple and reestimated the models. The only different finding was that older adults in couples with more discrepant views on negative marital quality were less likely to develop dementia (HR = 0.80, p = .030).
Discussion
Dementia has increasingly become a serious public health issue that negatively affects many older adults’ lives (World Health Organization, 2012). Worse still, the impact does not occur in a vacuum, but also compromises the well-being of people who are close to older adults with dementia (Alzheimer’s Association, 2020). Indeed, despite a generally low prevalence of mental health problems in later life (Fiske et al., 2009), spouses of persons living with dementia, particularly those who assume caregiving duties, are much more likely to report depression (Kiecolt-Glaser & Wilson, 2017; Pinquart & Sӧrensen, 2011). Thus, understanding dementia onset as a shared stressful transition for couples is crucial and may shed new light on the burgeoning dyadic interventions.
The current study built on prior research and made unique contributions to the literature. We utilized a dyadic approach to capture older couples’ evaluations of their marital quality, and drew on prospective data to examine how overall and discrepant views on marital quality were associated with (a) the development of dementia and (b) the psychological reaction to spousal dementia. We found that older adults who disagreed with spouses on their marital quality were more likely to develop dementia. When faced with spousal dementia, older adults in marriages with more negative quality overall had more depressive symptoms but exhibited a smaller increase in these symptoms.
Marital Quality and Dementia Onset
This study extended the literature by explicitly revealing how spousal discrepancies in marital assessments influence older adults’ cognitive health. We found that older adults who viewed their marriages either more positively or more negatively than their spouses did were more likely to develop dementia. Spousal discrepancies in marital assessments may hint at relationship issues (e.g., a lack of reciprocity, ineffective communication) that can reduce positive emotions and increase distress in marital interactions, both of which could compromise individuals’ cognitive health (Fredrickson, 2013; Greenberg et al., 2014). The impact of such discrepancies, however, may be nuanced. In our post-hoc test examining absolute spousal discrepancy scores, we observed a seemingly counterintuitive finding showing that absolute spousal discrepancy in negative marital quality predicted lower odds of dementia. It is worth noting that raw discrepancy scores (i.e., self-rating minus partner rating) reported in the main findings were specific to each coupled individual, but absolute scores corresponded to each couple as a whole unit. It is possible that having negative marital experiences is not necessarily detrimental to cognitive functioning. Indeed, recent studies have shown that negative marital experiences may serve as mild stressors that may help to sharpen older adults’ cognition and slow down cognitive impairment (Comijs et al., 2011; Xu et al., 2016). Yet, our study further suggests that within a couple, the partner who has more negative feelings about their marital relationship may be particularly vulnerable. To better understand spousal discrepancies, we encourage researchers to collect participants’ self-reports on their awareness of discrepancies.
Further, the adverse effects of discrepant views on marital quality were weaker in marriages of higher quality overall. Those couples who report discrepancies but are still able to maintain high marital quality overall may have already figured out a way to deal with their discrepancies, which protect their cognitive health. Findings refine our understanding of marital quality as a key factor intertwined with cognitive aging and may help us identify older adults at greater risk for dementia.
Marital Quality and Psychological Response to Spousal Dementia
We then took a closer look at couples where at least one partner developed dementia. We applied multiphase growth curve models to capture changes in depressive symptoms prior to, at, and post the transition. Older adults reported more depressive symptoms at or soon after the transition when their spouses reported dementia. This finding is in line with prior research that documented increased depressive symptoms or even higher odds of depression disorders within 2 years after the onset of spousal dementia (Chen et al., 2020; Joling et al., 2015). The onset of spousal dementia marks the start of coping with an incurable disease as a partner. Unlike other diseases and disabilities, dementia involves declines in many aspects related to the relationship per se, such as loss of identity and intimate exchange (Aneshensel et al., 1995).
It is crucial to test whether some older adults are more resilient or vulnerable during the transition at the onset of spousal dementia. We found that older adults in marriages with more negative quality overall reported more depressive symptoms. Indeed, these older adults may be less motivated to treat their spouses’ illness as a shared stressor or engage in joint problem-solving (Berg & Upchurch, 2007); instead, they may encounter conflicts and report worse mental health. Yet, we also found that older adults in marriages with less negative quality reported a steeper increase in depressive symptoms when faced with the onset of spousal dementia, which offers additional evidence to the emerging notion that individuals in better quality relationships may report worse well-being given their emotion contagion of spousal suffering (Kiecolt-Glaser & Wilson, 2017; Monin et al., 2017). Therapists and intervention practitioners should focus on reducing negativity in couple relationships, promoting mutual problem-solving, and training people to develop effective coping strategies in dealing with spouses’ suffering.
Limitations
Our study has several limitations. Future research will benefit from developing a more explicit measure of spousal discrepancy and how couples appraise their discrepant views. We relied on participants’ self-reports of a doctor-diagnosed dementia and considered it as a proxy marker of a stressful transition. Individuals seek out a diagnosis at different phases. Some may have exhibited relevant symptoms prior to a diagnosis. While dementia symptoms in spouses could already serve as stressors that depress older adults, these psychological reactions may not be captured at the transition determined by a formal diagnosis. Additionally, some older adults may not get a diagnosis despite their symptoms, attenuating the significance of our finding to some extent. Qualitative reports may help provide older adults’ insights in the face of their spouses’ cognitive declines. More ready diagnosis should be encouraged, and future research may collect more data from this clinical population. Although we drew on longitudinal data, this study is observational and cannot infer causality. As with all longitudinal research, the current study suffers from sample attrition and selection bias. The competing risks analysis necessitates a more cautious interpretation of findings; those lost to follow-up were more likely to report worse marital quality and more discrepant views on marital quality.
The current study adds to the growing body of research intended to identify risk factors for dementia with a focus on social factors. Our examination of overall and discrepant marital assessments prior to the onset of dementia offers new insights to designing preventive strategies targeting imbalances or poor communication in marriages. We considered dementia in a relationship context and tested interindividual differences in older adults’ psychological well-being at the onset of spousal dementia. More research should be conducted to advance our understanding of ways that could better protect older adults in the face of spousal illness and prepare them for coping with chronic stressors.
Funding
This research was supported by grant, P30AG066614, awarded to the Center on Aging and Population Sciences at The University of Texas at Austin by the National Institute on Aging, and by grant, P2CHD042849, awarded to the Population Research Center at The University of Texas at Austin by the Eunice Kennedy Shriver National Institute of Child Health and Human Development. The content is solely the responsibility of the authors and does not necessarily represent the official views of the National Institutes of Health.
Conflict of Interest
None declared.
Acknowledgments
This study drew on data from the Health and Retirement Study (HRS), which are publicly available on the HRS website (https://hrs.isr.umich.edu/). Data and analytic strategies are described in the text, and will be available to other researchers upon request. This study did not involve clinical trials, and was not preregistered.
Author Contributions
M. Huo planned the study, reviewed the literature, performed statistical analyses, and wrote the manuscript. K. Kim and S. H. Han helped to plan the study, supervised data analysis, and provided critical revisions to this manuscript.
References

