


Abstract
Political advertising on social media has become a central element in election campaigns. However, granular information about political advertising on social media was previously unavailable, thus raising concerns regarding fairness, accountability, and transparency in the electoral process. In this article, we analyze targeted political advertising on social media via a unique, large-scale dataset of over 80,000 political ads from Meta during the 2021 German federal election, with more than
Social media platforms have become important tools for political campaigning worldwide. In our study of over 80,000 political ads from the 2021 German federal election, we reveal extensive use of targeted political advertising across the full political spectrum, significant discrepancies between targeted and actual audiences, and a systematic bias in the algorithmic delivery of ads favoring populist parties. These findings highlight the complex relationship between digital campaigning strategies and democratic processes, and caution about the potential for algorithmic biases to influence election campaigns. Overall, our work contributes to a better understanding of targeted political advertising on social media and informs policymakers about the design of effective regulatory frameworks to promote fairness, accountability, and transparency.
Introduction
With around 4.6 billion users globally (1), social media platforms such as Facebook, Instagram, and Twitter/X have become important tools for political campaigning worldwide (2). For example, in the United States, expenditure on online political advertising rose from USD ∼70 million in 2014 to USD ∼1.8 billion in 2018 (3). Similarly, politicians in Europe have recognized the importance of social media for their campaigns. For instance, the majority of candidates in the 2021 German federal election believed that social media can influence voters (4).
An essential feature of advertising on social media is targeting, which allows advertisers to select specific user groups and deliver tailored political messages to particularly receptive audiences (2, 5–7). For example, campaigns can send tailored ads that align with the interests of distinct voter groups (8), thus ensuring that their content resonates with the unique political perspectives of each audience (9). However, targeting in political advertising is problematic (10–12). First, targeting is concerning if parties cater ads to specific groups (13) or send conflicting messages on political issues to different audiences (14). Second, targeted ads are distributed by proprietary algorithms that are beyond societal scrutiny and that may exhibit biases that influences the audience of specific ads (11, 15–17). Third, privacy concerns are eminent given that political targeting heavily depends on potentially sensitive information (e.g. ethnic origin, sexual orientation) to identify receptive audiences (18–20). Essentially, the use of targeting raises concerns regarding fairness, accountability, and transparency in electoral processes.
The concerns regarding democratic integrity have spurred calls to monitor political advertising on social media (21, 22). However, granular information about political ads (e.g. impression counts, price per ad) is in the hands of proprietary social media platforms and, so far, has been either unavailable or deemed imprecise (23, 24). This lack of transparency may prevent accountability for misconduct, which is particularly concerning given recent evidence suggesting that political advertising on social media directly affects voter turnout (25) and vote choice (26–28). As such, there is a growing need to monitor targeted political advertising on social media to safeguard democratic integrity.
A combination of public pressure (3) and regulatory efforts (e.g. the Honest Ads Act in the United States (29) and the Digital Services Act in the E.U. (30)) have pushed social media platforms to strengthen their transparency efforts around political advertising. Indeed, Meta has launched the Meta Ad Library, which provides public access to all political and social ads published on Facebook and Instagram, and allows researchers to study political advertising at scale (31–35) (see Supplementary Material S1 for a comprehensive overview of the literature). However, existing analyses had only limited access to political ads, since crucial information about targeting was missing. As such, it remains unclear how targeting is used, how targeted ads are distributed, what the different targeting strategies behind political ads are, and how their reach at a given budget varies.
There are good reasons to believe that parties adopt diverse targeting strategies (8, 9, 36). Previous research on the content of online political ads has shown that parties pursue different communication strategies (32, 37). Some parties advertise by particularly focusing on issues related to their base (32, 37) such as, for example, environmentalism in the case of the Grüne. In contrast, other parties avoid ads related to specific political issues (9, 37) and tend to publish more “generic” ads, for example, introducing a candidate or calling to vote. Since the latter does not refer to a concrete political issue, such ads may reach audiences across party boundaries, which may vary with respect to age, gender, and interests (32). As such, targeting may limit the political participation of disadvantaged groups due to a party’s targeting strategy (differently from ads on broadcast media that can be received by all voter groups). Furthermore, there is reason to expect that the algorithmic delivery of social media ads may introduce further bias (15–17), thus resulting in differences between actual and intended audiences. For example, social media algorithms exhibit a tendency to target fewer women due to differences in advertising costs (17). Such algorithmic bias can lead to discrimination as women may be less frequently exposed to political campaigns and thus harm political participation. Moreover, such bias can harm political competition when, for instance, some parties consistently pay higher prices for political ads, thus leading to fairness issues.
In this article, we analyze targeted political advertising on social media using a large-scale dataset with
Our analysis is three-fold: (i) We assess the prevalence of targeted political ads across the full political spectrum and infer detailed targeting strategies used by political parties for their election campaigns. (ii) We evaluate discrepancies between targeted and actual audiences due to algorithmic bias in the ad delivery and how such discrepancies vary across parties. (iii) We analyze the characteristics of targeted ads with far reach at a given budget during elections and analyze whether parties are discriminated by algorithmic ad delivery in that they pay a higher price per impression.
Results
Targeted political advertising during the 2021 German federal election
We analyze targeted political ads on Meta during the 2021 German federal election (see Supplementary Material S2 for additional context on the election) and compare how parties across the political spectrum use targeting for their campaign purposes. Overall, we analyze
Targeting has spurred concerns regarding political advertising on social media (12, 38). However, it is unclear to what extent parties use targeting during election campaigns. Throughout the article, we consider an ad to employ “targeting” if it uses any targeting category available to advertisers on Meta in addition to demographics (i.e. gender and age) and location (since the latter must always be specified in the ad creation). For details, see Materials and methods section.
To analyze the prevalence of targeted political ads on Meta during the 2021 German federal election, we start by quantifying the number of targeted ads. In the run-up to the election, 72.3 % of all ads used targeting, which corresponds to 72.6 % of the total ad spending on Meta during the election. This highlights the importance of targeted ads for political campaigns on social media.
Meta allows advertisers to target users based on various targeting categories (see Supplementary Material S8 for an overview). We expect that some targeting categories are more popular than others and thus study how the campaign budget is distributed between categories. Figure 1 shows the top-10 targeting categories in terms of spending across all parties. We find that parties tend to use exclusion rather than inclusion criteria to target users. This result suggests that most parties rely on broad audiences and allow Meta to optimize ad delivery among users. To define inclusion criteria, parties largely rely on so-called interests (e.g. social equality, environmentalism, and international relations), behaviors (e.g. early adopters of new technology, commuters, international travelers), or employers (e.g. business owners, police officers, Ford Deutschland). Parties also frequently define a specific list of users to be targeted (“Custom”) or an audience that is similar to a previously defined target group (“Lookalike”). Lastly, parties commonly target users based on their location. For example, 88.72 % of the ads have a precise location targeting (beyond Germany). Overall, these results show that parties employ a wide variety of targeting strategies. For a breakdown of the top-10 targeting criteria by party, see Supplementary Material S3.
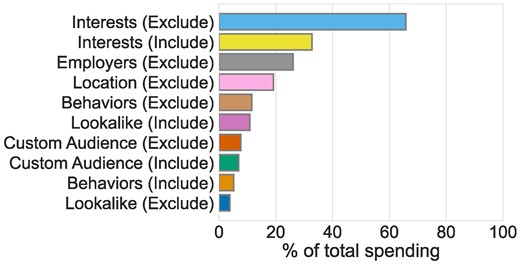
Top-10 targeting criteria by total spending.
We now study the reach of political ads at a given budget. To do so, we focus on the number of impressions an ads generates per EUR spent (henceforth simply impressions-per-EUR). Political parties employ different campaign strategies on social media (37), which may also lead to differences in the impressions-per-EUR of political ads. We thus compare impressions-per-EUR across political parties and test for statistically significant differences using a Kruskal–Wallis test (39). The results are in Fig. 2a and b. We find that impressions-per-EUR significantly differs across parties (
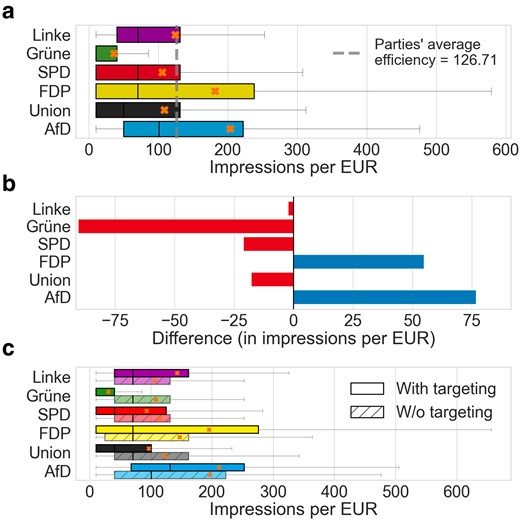
a) Distributions of impressions-per-EUR across the ads of each party. The cross indicates the mean of the distribution. b) Difference between average impressions-per-EUR of a party and average impressions-per-EUR in the overall sample. c) Distribution of impressions-per-EUR across the ads of each party. The cross indicates the mean of the distribution.
Given the high prevalence of targeted ads, we also compare impressions-per-EUR for targeted ads and ads without targeting. Our results are mixed (see Fig. 2c). While targeted ads achieve, on average, more impressions-per-EUR compared to ads without targeting for the Linke, FDP, and AfD, the opposite is true for the Grüne, SPD, and Union. Performing multiple pairwise Kruskal–Wallis tests with Benjamini–Hochberg correction based on a family-wise error rate (FWER) of
Discrepancies between targeted and actual audiences
Previous research has shown that algorithmic ad delivery can lead to discrepancies between intended and actual audiences on Meta (15, 16). This may be concerning if algorithmic ad delivery would propagate existing biases in voting patterns that restrict the reach of a party among a certain population, and thus hamper fair electoral competition. For example, some parties (e.g. Grüne) tend to receive more votes from younger female audiences while others are more popular among older male audiences (e.g. AfD). We thus explore potential discrepancies between the demographic distribution of the intended (
Let us first focus on age (Fig. 3). For each party, we compute the proportion of actual impressions generated by different age buckets, where we weight each ad by the amount of money spent. We refer to this vector as the actual audience of an ad. Similarly, we compute the proportion of targeted impressions by different age buckets, where we again weight each ad by the amount of money spent. This vector is the target audience of an ad. Figure 3a shows the discrepancy (percentage difference) between the actual and target audience. All parties reach an actual audience that is younger than the one targeted, except for the far-right AfD which generally reaches an older audience. We also compute the Wasserstein distance

a) Discrepancy in the age distribution between the actual and target audience (in %). We find that ads by most parties (except AfD) are seen by more users between 25 and 34 than originally intended. b) Comparison of actual and target audience by age for political ads published by AfD. A red color (i.e. proprotion of target audience is larger than actual audience) indicates areas where the difference between the actual and targeted audience is negative (green for positive, i.e. proportion of target audience smaller than actual audience). Younger and older users see the ads less often than originally intended by the party. c) Discrepancy in the gender distribution between the actual and target audience (in %). We find large differences between male and female audiences for right-wing parties (e.g. Union, AfD), implying that ads are seen by considerably fewer females than originally intended due to the algorithmic ad delivery.
We repeat the procedure above to compute the variables for the actual and target audience of an ad by gender. For all parties, there is a large discrepancy between the targeted vs. actual audience in terms of gender, with ads shown to fewer female users than intended, except for the Grüne (see Fig. 3c). This is particularly pronounced for right-wing parties such as the Union and the AfD. For example, the AfD reaches 12.91% more male individuals than originally targeted. Interestingly, the Grüne is the only party for which the opposite is true: its ads reach 5 % more female individuals and 8 % fewer male individuals than targeted. To quantify the discrepancies in the gender distribution between actual and target audience, we again compute the Wasserstein distance for each party:
Systematic differences in impressions-per-EUR across parties
Regression analysis
To evaluate how key aspects of online political advertising are associated with impressions-per-EUR, we perform a regression analysis. For this, we estimate three separate linear regression models that focus on different determinants for impressions-per-EUR, namely, (i) targeting strategies, (ii) demographics, and (iii) ad characteristics (see Materials and methods for methodological details).
Targeting strategy: Our first regression model assesses how targeting strategies are related to impressions-per-EUR (see Fig. 4a). Ads that use more targeting criteria are linked to lower impressions-per-EUR as indicated by the negative and statistically significant coefficients for “No. Include criteria” (
Demographic segments: Our second regression model evaluates how different demographics explain impressions-per-EUR. The regression results are in Fig. 4b. We find a positive and statistically significant coefficient for “Female” (
Ad characteristics: In our third regression model, we study how ad characteristics are linked to impressions-per-EUR (Fig. 4c). For example, the timing and content of an ad explain its impressions-per-EUR. In particular, ads that are online for a longer period and published earlier in the week tend to receive more impressions-per-EUR as indicated by the positive and statistically significant coefficient for Duration (
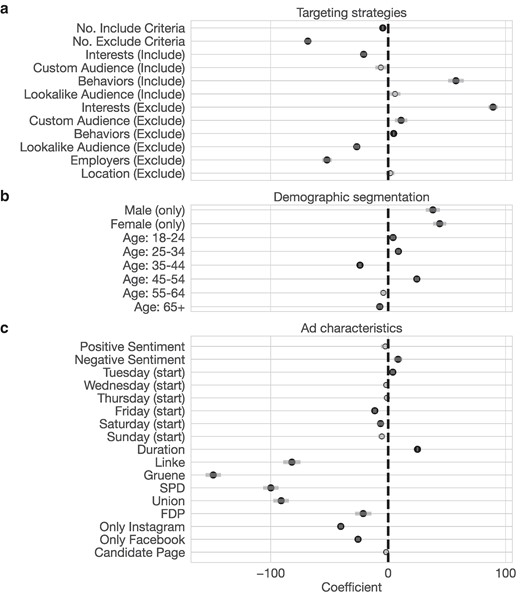
Coefficient estimates and 95 % confidence intervals for a) targeting strategies, b) demographics, and c) ad characteristics. Statistically significant coefficients ( , all others by gray circles
  . Sentiment, weekday, platform dummy, and party dummy are categorical variables, and the reference categories are “neutral” sentiment, “Monday”, “both platforms”, and “AfD”.
Of note, sentiment, weekday, platform dummy, and party dummy are categorical variables. Hence, they need a reference condition to include them in our regression model. The coefficients of these variables should be interpreted relative to the reference categories. In this analysis, we chose “neutral” sentiment, “Monday”, “both platforms”, and “AfD” as reference categories.
We further conducted two additional analyses, which are motivated by the fact that larger competition may influence ad impressions. Generally, we expect competition among political ads to be small given that political ads represent only a small fraction out of all ads on Meta. Nevertheless, we perform two analyses where we control for the time-to-election-day and the number of competing political ads. We find that publishing ads earlier in the campaign is related to higher levels of impressions-per-EUR. Furthermore, higher competition in terms of more active ads at the publishing day is negatively related to impressions-per-EUR. Of note, all other results remain consistent with our main analysis except for the coefficient of negative sentiment, which is no longer statistically significant. Details are in Supplementary Material S6.
Machine learning approach
We now employ a machine learning approach to predict the reach of political ads for a given budget based on the information provided by Meta. The rationale for this design is two-fold. (i) If the available information in the Meta Ad Library and the Meta Ad Targeting Dataset is sufficiently complete, we should be able to make accurate predictions of impressions-per-EUR given the available features. In other words, a low prediction performance suggests that other unobserved features explain the heterogeneity in the reach of different ads for a given budget (e.g. factors related to the algorithmic delivery of ads), but these features are not captured in the dataset and are thus not available for external stakeholders. Hence, this can provide a glimpse into the transparency provided by the available data. (ii) The machine learning predictions can also be used to examine empirically whether there are systematic differences between the predicted and actual reach of an ad for a given budget, across different political parties. In other words, if a party consistently receives more views for a given budget than others targeting the same audience, this could indicate that the algorithmic delivery of ads is advantaging said party, which would undermine fair competition.
We fit a random forest model (41) by using all variables from our regression analysis related to key determinants of the reach of an ad for a given budget, namely, (1) targeting strategies (e.g. the type and frequency of targeting categories), (2) demographics (age, gender of target group), and (3) ad characteristics (e.g. sentiment of an ad, ad duration, publishing party). In addition, we use the full set of targeting variables and add variables that indicate whether (i) the advertisers supplied a data file to include/exclude a custom audience and (ii) the data supplied by the advertisers to include/exclude a custom/lookalike audience was complete. For a full list of variables, see Materials and methods. To measure the reach of an ad for a given budget, we again rely on the number of impressions generated per EUR spent (i.e. impressions-per-EUR). Details on the implementation are in Materials and methods.
Our model achieves an average root mean squared error
Next, we compute the mean difference between the predicted and actual impressions-per-EUR across parties. This measure indicates whether specific parties consistently achieve more or fewer impressions-per-EUR while controlling for all other available sources of heterogeneity in targeting strategies, demographics, and ad characteristics. Figure 5 shows that most left-leaning parties (i.e. the Grüne and the SPD, except for Linke) and Union consistently achieve fewer impressions-per-EUR than predicted by our model. In contrast, the FDP and AfD, on average, receive 12.83 and 2.81 additional impressions per EUR, respectively. This result implies a relative advantage of 10.13 and 2.22% in impressions-per-EUR compared to the average ad that achieves 126.71 impressions-per-EUR. Overall, our results suggest that the algorithmic delivery of political ads may advantage specific parties.
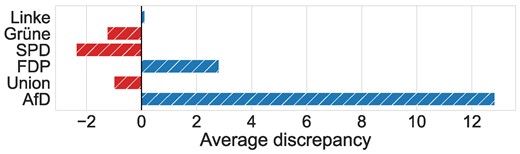
Average difference between actual vs. predicted impressions-per-EUR based on our machine learning model over 10 runs.
We perform a series of checks to ensure the robustness of our results. First, we train an XGBoost model using the same training procedure as outlined for the random forest model. Second, we check the heterogeneity of our results across platforms and re-train our random forest model by using political ads that were solely published on (i) Facebook and (ii) Instagram. Across both checks, our main findings regarding (i) and (ii) remain consistent. Details are in Supplementary Material S10.
Discussion
Targeted political advertising on social media has raised significant concerns regarding fairness, accountability, and transparency among researchers, policymakers, and society at large. Given the known and significant impact of political advertising on voter turnout and vote choice (25–28), it is crucial to analyze how parties across the political spectrum employ targeting during election campaigns and inform policymakers on the implications of targeted political advertising for democracies.
Our findings contribute to the existing literature on political advertising on social media by providing evidence of the prevalence of targeting across the political spectrum. While social media was found to be an essential communication channel for parties during election campaigns (9, 32, 37), it was previously unclear whether and how parties make use of targeting.
Targeting was used in 72.3% of all ads published on Meta during the 2021 German federal election. In fact, parties rely on a wider range of targeting categories available to advertisers on Meta. For example, a majority of campaign budget is spent for ads that exclude users based on so-called interests (e.g. social equality, environmentalism, and international relations), behaviors (e.g. early adopters of new technology, commuters, international travelers), or employers (e.g. business owners, police officers, Ford Deutschland). We further find significant differences in the reach of ads at a given budget. For example, the far-right AfD achieves significantly more impressions-per-EUR compared to other parties.
Our results further show that the algorithms of the platforms drive—to a large extent—who views an ad, which can lead to discrepancies between the intended (targeted) and actual audience. Indeed, we find considerable discrepancies between both. For instance, the Grüne reaches considerably more female users than intended, while the Union and the AfD reach a larger male audience than intended. Algorithmic bias in the delivery of political ads may amplify stereotypes associated with vote choices among distinct segments of the electorate. In fact, previous research has shown that algorithmic bias is responsible for systematically delivering ads based on gender stereotypes, but in a job context (17). This aligns with the fact that the Grüne traditionally receives more support from female voters compared to both the Union and the AfD, which more strongly depend on male voters.
The results of our regression analysis provides evidence for significant heterogeneity in the impressions-per-EUR of targeted ads. For example, ads targeting only a single gender achieve significantly more impressions-per-EUR. This may be due to a higher level of personalization but also raises concerns on whether algorithmic bias propagates gender-specific ads particularly well. Moreover, ads by Grüne receive considerably fewer impressions-per-EUR than other parties. Given that their voters have an above-average income targeting them may be more costly than the average. In contrast, ads published by the AfD generate the most impressions-per-EUR. This could be explained by the fact that incendiary political issues promoted by populist parties (e.g. anti-immigration), tend to attract high attention on social media (32, 42, 43).
Finally, the results of our machine learning approach show that detailed information on targeting strategies, demographics, and ad characteristics cannot fully explain the reach of an ad for a given budget in terms of impressions-per-EUR. This finding indicates that current transparency measures do not suffice to evaluate how proprietary algorithms deliver political ads. In fact, we find systematic differences between predicted and actual impressions-per-EUR, which is particularly wide for the far-right AfD. This gap is concerning as it possibly indicates the presence of algorithmic biases that may favor populist ads.
As with other research, ours is not free from limitations that offer opportunities for future work. We focus on the 2021 German federal election; extending our results to other countries is important for generalizability. Nevertheless, the federal structure in Germany is similar to other countries, and the election is comparatively large, with more than 60 million eligible voters and candidates from parties across the political spectrum (44). Our analysis is based on a unique, large-scale dataset that is proprietary and, as such, offers granular insights. However, more research is needed to assess the accuracy of the Meta Ad Library (23). Furthermore, the effects of algorithmic ad delivery are not yet fully understood and may require further data disclosure by platforms. For instance, Meta only offers specific audience details related to age and gender, without providing comprehensive pricing information. This lack of data precludes a broader analysis of how pricing mechanisms vary and the discrepancies between the targeted and actual audiences. We thus encourage future research to focus on pricing mechanisms for political ads on social media and more granular analyses of actual and targeted audiences. Lastly, while our current focus is on targeting, we also provide insights on the purpose (see Supplementary Material S4) and focus of ads (i.e. candidates vs. parties; see Supplementary Material S5). Here, interdisciplinary approaches combining computational methods and theory from political science (45) could expand our analysis on the communication strategies employed by various parties on social media beyond targeting.
Our results contribute to the political science literature by shedding light on the prevalence of targeting during real-world elections. Targeting is highly prevalent in political campaigns and allows parties to focus on specific voter segments. This result mandates additional efforts by researchers to unravel the impact of targeted political advertising on society.
Our results have further implications for parties and policymakers. For parties, we provide valuable insights into the delivery mechanisms of targeted ads on social media. For policymakers, our research emphasizes the necessity to intensify auditing and regulation regarding political advertising on social media. The discrepancies between actual and targeted audiences that we identified potentially originate from algorithmic bias that favors certain voter segments. This is concerning as such bias may harm political participation and reinforce discrimination against disadvantaged groups.
Policymakers should pay particular attention to addressing these issues in regulatory frameworks and hold platforms accountable for ensuring fairness, accountability, and transparency in political advertising. For example, previous research (46) recommends that platforms make adaptations to the auction mechanisms to subsidize political advertisers or provide quotas in combination with separate auctions for political and commercial advertisers to lower competition for political advertisers. Policymakers could also require randomization of ad delivery among the target population as discussed by the European Parliament (47), thereby preventing discrimination due to algorithmic bias. Most importantly, policymakers should incentivize additional transparency measures. For example, current measures are insufficient to evaluate how the platform’s pricing mechanism influences ad delivery, limiting independent assessment by researchers. Mandatory disclosure of information about click rates could help to better understand the effectiveness of social media ads. Overall, there is a pressing need for policymakers to mandate such disclosures, allowing for third-party monitoring and contributing to a more accountable system of political advertising on social media.
Materials and methods
Data
We collect
The Meta Ad Library API provides detailed information about content, page/sponsor name, money spent, start and stop dates, and the number of impressions distributed across gender and age (i.e. in buckets corresponding to 18–24, 25–34, 35–44, 45–54, 55–64, 65+ years). It also indicates whether an ad was published (a) only on Facebook, (b) only on Instagram, or (c) simultaneously on both platforms. For ad spending and the number of impressions, Meta only reports discretized buckets. Following previous research (9, 26, 31–34), we average the maximum and minimum of each bucket to obtain conservative point estimates of the ad spending and the number of impressions per ad. A full list of variables is available in Supplementary Material S7.
We further use the Meta Ad Targeting Dataset (49) to access ad targeting information. The Meta Ad Targeting Dataset contains targeting information on all social issue, electoral, and political ads published after 2020 August 3, on Facebook or Instagram (49). The dataset can be accessed after approval by Meta via https://developers.facebook.com/docs/ad-targeting-dataset. We accessed the dataset in August 2023 and queried targeting information for all
Wasserstein distance
Following Capozzi et al. (32), we compute the Wasserstein distance
where u and v are the two distributions to compare, and U and V the respective cumulative distribution functions.
Regression analysis
We hypothesize that targeting affects the impressions-per-EUR of political ads on social media. We thus use regression analysis to study what factors drive the reach of an ad at a given budget for political advertising on social media. To measure the reach of an ad, we rely on the number of impressions an ad generated per EUR spent (or simply impressions-per-EUR). Let
where α represents the model intercept, and β measures the associations between the variables in
We use three different regression models to analyze how impressions-per-EUR varies across ads. To do so, we use a comprehensive set of variables available to us in the Meta Ad Library or the Meta Ad Targeting Dataset that represent three key determinants of impressions-per-EUR. In particular, we focus on (i) different targeting strategies, (ii) different demographics, and (iii) different ad characteristics. We estimate separate models for each of these dimensions to avoid multicollinearity (50) and facilitate interpretability.
Targeting strategy: To assess the role of targeting strategies as a determinant of impressions-per-EUR, we compute two variables that correspond to the overall number of inclusion and exclusion criteria. The hypothesis is that more granular targeting may incur higher costs. Further, we consider which targeting categories have been used by a party. Here, we include two variables for each targeting category available to advertisers on Meta that indicate whether a certain category was used (
Demographics: To study which demographics are linked to higher impressions-per-EUR, we include whether an ad is targeting only users from a single gender (i.e. only female or male users;
Ad characteristics: Ad characteristics are likely to influence the reach of political ads at a given budget. Hence, we study how (i) content, (ii) timing, (iii) the platform an ad was published on, and (iv) the publisher of an ad is linked to impressions-per-EUR. (i) Content: We thus analyze the sentiment conveyed by an ad and classify the content of each ad as “positive”, “neutral”, or “negative”. We use German Sentiment Bert, a state-of-the-art transformer-based sentiment model for German text that was trained on 5.4 million labeled samples (51). (ii) Timing: We analyze whether launching an ad on specific weekdays is beneficial and how ad duration (i.e. the timespan an ad remains online) relates to impressions-per-EUR. (iii) Platform: Platform characteristics such as audience, user behavior, and ad competition can influence political campaigning (52). Hence, we study the association between impressions-per-EUR and the platform on which an ad was published, by using dummy variables to encode whether an ad was published on Facebook, Instagram, or both platforms simultaneously. (iv) Publisher: In the context of the German dual-vote system, which features both party and candidate votes, political science literature shows the role of both party and candidate behavior in shaping voter perceptions (53). These perceptions may affect the impressions-per-EUR of ads authored by different party and candidate pages. Thus, we encode the different parties using dummy variables. We further encode whether the ad was distributed through a candidate’s page (
Sentiment, weekday, platform dummy, and party dummy are multilevel categorical variables. Hence, we have to choose a reference condition to include them in our regression model and interpret the coefficients relative to the reference categories. In analysis, we choose “neutral” sentiment, “Monday”, “both platforms”, and “AfD” as reference categories.
Machine learning approach
Objective: We employ a machine learning approach to evaluate whether we can predict the reach of an ad for a given budget as measured by impressions-per-EUR. The aim is two-fold. (i) We study whether a machine learning model can accurately predict impressions-per-EUR of ads based on the information provided in the Meta Ad Library and Meta Ad Targeting Dataset. A high prediction performance implies that the provided information is sufficient to understand the ad delivery mechanisms of the platforms. Vice versa, a low prediction performance suggests the presence of unobserved confounders that explain the observed heterogeneity but which are currently unavailable for external audits. (ii) We analyze the difference between predicted and actual impressions-per-EUR across parties. In a fair environment, we would expect no systematic differences in terms of impressions-per-EUR between different parties. In contrast, if a party consistently receives more views at a given budget than others targeting the same audience, this could indicate that the algorithmic delivery of ads is advantaging said party, which would undermine fair competition.
Features: For our machine learning model, we use all variables from our regression model that represent key determinants of impressions-per-EUR: (i) different targeting strategies, (ii) different demographics, and (iii) different ad characteristics (see above).
In addition, we use the full set of targeting variables (see Table S3 for a full list) and add variables that indicate whether (i) the advertisers supplied a data file to include/exclude a custom audience (
Implementation: We (i) study whether machine learning can accurately predict impressions-per-EUR based on the above variables and (ii) analyze the difference between predicted and actual impressions-per-EUR. To do so, we fit a random forest model (41) by using all features from above. We split our data into a training (80%) and a hold-out set (20%) for evaluation, and tune the model via 10-fold cross-validation in combination with a grid search (see below). To control for the number of ads published by each party, we weigh observations inverse proportionally to the ad frequency by party in our training set when fitting the model. We further z-standardize numeric variables.
Hyperparameter tuning: For the training of the random forest model, we use 10-fold cross-validation in combination with a grid search. In particular, we vary (i) the number of trees used for a forest (N estimators), (ii) the number of variables to consider at each split (Max features), (iii) maximum depth of the tree (Max depth), (iv) minimum samples to split a node (Min node), (v) minimum samples in a leaf (Min leaf), and (vi) whether to bootstrap samples when building trees (Bootstrap). Details on the hyperparameter tuning are in Supplementary Material S9.
Evaluation: We evaluate the predictive power of our model based on the average root mean squared error (RMSE) over 10 runs with different seeds. We further rely on the
where n is the number of observations, with
Notes
Advertisers on Meta may purchase ads with the same creatives (i.e. content, image, etc.) multiple times. Therefore, we use “ad” to refer to the specific ad contract, including its timing, budget, and targeting settings besides its creative parts.
For detailed election results, see www.bundeswahlleiterin.de/en/bundestagswahlen/2021/ergebnisse.html.
Acknowledgments
This manuscript was posted on a preprint server: https://arxiv.org/abs/2310.10001.
Supplementary Material
Supplementary material is available at PNAS Nexus online.
Funding
F.P. is partially funded by the European Union (NextGenerationEU project PNRR-PE-AI FAIR), the Italian Ministry of Education (PRIN PNRR grant CODE and PRIN grant DEMON). This manuscript reflects only the authors’ views and opinions, and funding bodies are not responsible for them.
Author Contributions
D.B., F.P., G.D.F.M., and S.F. contributed to conceptualization. D.B. and F.P. contributed to data analysis. D.B., F.P., G.D.F.M., and S.F. contributed to results interpretation and manuscript writing. D.B., F.P., G.D.F.M., and S.F. approved the manuscript.
Data Availability
All code to replicate our analyses is available via our GitHub repository at https://github.com/DominikBaer95/auditing_targeted_political_advertising. All data used for the analysis is publicly available. Data on political ads on Facebook and Instagram is available via the Meta Ad Library: https://www.facebook.com/ads/library/. Targeting data is available via the Meta Ad Targeting Dataset: https://developers.facebook.com/docs/fort-ads-targeting-dataset/. To ensure reproducibility, we provide ids for all ads in our dataset, which can be used to retrieve the original data through the Meta Ad Library (both through the API and with the web interface by simply using the id as query) via our GitHub repository at https://github.com/DominikBaer95/auditing_targeted_political_advertising. Due to Meta’s ToS we cannot share any further information.
References
Author notes
D.B. and F.P. contributed equally to this work.
Competing Interest: The authors declare no competing interest.