


Abstract
Mass behavior is the rapid adoption of similar conduct by all group members, with potentially catastrophic outcomes such as mass panic. Yet, these negative consequences are rare in integrated social systems such as social insect colonies, thanks to mechanisms of social regulation. Here, we test the hypothesis that behavioral deactivation between active individuals is a powerful social regulator that reduces energetic spending in groups. Borrowing from scaling theories for human settlements and using behavioral data on harvester ants, we derive ties between the hypermetric scaling of the interaction network and the hypometric scaling of activity levels, both relative to the colony size. We use elements of economics theory and metabolic measurements collected with the behavioral data to link activity and metabolic scalings with group size. Our results support the idea that metabolic scaling across social systems is the product of different balances between their social regulation mechanisms.
All social systems, from bacterial colonies to human societies, experience a phenomenon called mass behavior, which is the rapid adoption of similar conduct by all group members through social contagion. Mass behaviors can have catastrophic outcomes such as mass panic and stampedes. However, not all social systems are equally susceptible to mass behavior. Social insect colonies, whose extreme level of social integration has earned them the name of superorganisms, are even remarkably resistant to them. Our manuscript explains this high degree of stability in the context of activity regulation and suggests a link between patterns of social interaction in an ant colony and its ability to efficiently scale its total metabolic activity as its size increases.
Introduction
Social contagion—the spread of behaviors throughout a group by means of neighbor-to-neighbor interactions (1)—is a powerful organizing principle in animal societies (2, 3). It results from processes of social imitation and/or social pressure that create a positive relationship between the number of neighbors performing a given behavior around a given individual and the probability that this individual starts engaging in that behavior. When repeated, social contagion can lead to the emergence of mass behavior, during which individuals rapidly adopt very similar conduct, sometimes over large spatial scales (4). These mechanisms are ubiquitous in social systems (2, 5, 6), such as human crowds clapping as one (7), ants excavating complex nest structures (8), and the aerial and underwater ballets of flocks of birds (9) and schools of fish (10).
Mass behaviors are prone to nonlinearities because of the amplifying effect of social contagion. Therefore, in highly integrated social systems (for example, social insect colonies, cooperatively breeding groups, and human societies), social contagion is often regulated to prevent the whole population from dedicating all its energy to a single behavior, especially if it has detrimental consequences (for example, stampedes (11, 12), futile cycles (13), and mass panic (14, 15)). One effective social regulation mechanism, often observed in the form of stop-signaling mechanisms (16) and blocking interactions (17), is achieved through behavioral deactivation between active individuals. Specifically, an individual engaged in a given behavior becomes more likely to interrupt its activity as it interacts with more neighbors engaged in the same behavior (18). We call this mechanism reverse social contagion (Fig. 1).
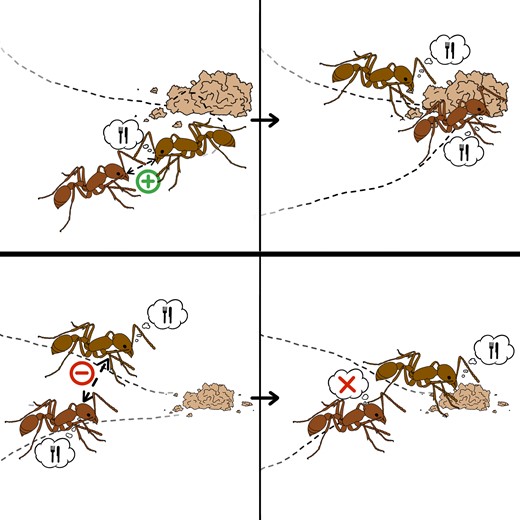
Illustration of the concepts of social contagion (top) and reverse social contagion (bottom). (top) An inactive ant interacts with an ant engaged in a foraging task: through social contagion (for example, caused by active recruitment), it also begins foraging. (bottom) Two ants engaged in foraging interact: through reverse social contagion (for example, caused by steric exclusion), one of them ceases their activity to become inactive. Image credit: Isabella Muratore.
Here, we explore the role of reverse social contagion on activity regulation in colonies of harvester ants (Pogonomyrmex californicus). Using tracked video recordings of several colonies by Waters et al. (19), we observe that, on average, ants do not increase their level of individual activity with the size of the colony, despite an increasing number of social interactions at the colony level. To shed light on the mechanisms underlying this observation, we apply scaling theories commonly used for the study of human settlements (20–22) to the collected data. We derive scaling relationships that link the size of a colony to the organization of its network of interactions and activity levels, under the hypothesis that individual ants are subject to reverse social contagion. By leveraging this scaling, we show a potential link between activity and metabolism using flow-through respirometry data collected at the same time as the behavioral data. We conclude the paper with a parallel between an insect colony and a city, where social interactions lead to opposite allometric scalings for energy expenditure: hypometric (insect colonies) versus hypermetric (cities) scaling.
Experimental materials and methods
We analyze experimental data of harvester ant colonies (Pogonomyrmex californicus) by Waters et al. (19) and partially re-analyzed by Toth et al. (23), combining simultaneous measurements of whole-colony metabolic rates via flow-through respirometry and video recordings of ants within their artificial nest enclosures (Fig. 2a). The video recordings make it possible to study the activity of and interactions among workers, while flow-through respirometry allows measurement of metabolic rates.
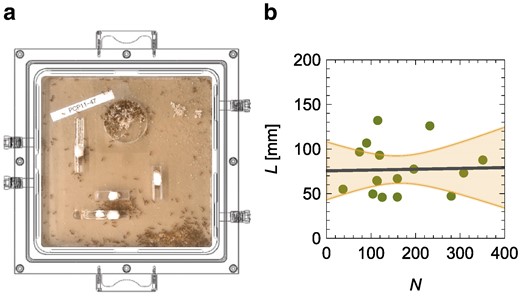
a) Experimental setup of Waters et al. (19) to study the metabolic rate of Pogonomyrmex californicus colonies as a function of individual ant movement, by placing the entire artificial nest enclosures where the colonies were reared into an airtight chamber with a clear lid, for simultaneous behavioral observation and flow-through respirometry measurements. b) Independence of the average length traveled by a worker, L, from the number of workers, N; the solid line is the linear fit and the shaded region is the
Activity, interactions, and metabolism measurements
Twelve same-aged colonies were studied by Waters et al. (19), with sizes naturally ranging from a few dozen up to hundreds of workers. All the ant colonies started from queens of the California seed harvester ant. Video observations and flow-through respirometry were conducted in a lab maintained at 30–32° C. After each respirometry run, the wet mass of the colony was also determined.
To explore the causal mechanisms underlying allometric scaling of metabolic rate, these authors also tested size-reduced versions of the 12 colonies, obtained by removing 50% of the workers, larvae, and pupae, totaling 24 measurements over 16–24 hours of the metabolic rate as a function of the colony mass. The intervention of removing half of the colony retained all the members required for the colony to function while allowing for exploring the role of colony size. Waters et al. (19) showed that colony identity (paired before and after size-reduction) did not have a significant effect on metabolic rate, meaning that the data from colonies and their size-reduced versions are independent, and combining them does not run the risk of pseudoreplication.
For these 24 colonies, Waters et al. (19) acquired 30-second videos of 16 of them (eight whole and eight size-reduced colonies). Video observations were conducted in
Statistical analysis
Upon completing the video tracking for each colony, we ultimately had access to the metabolic rate (B), the mass (M), and individual trajectories for all tracked ants. The total number of workers (
For each frame, we created an undirected, unweighted network where two workers are connected if they are within the set distance and computed the total number of edges in the network. The number of interactions (E) was computed as the time average of the number of edges over the video. The area spanned by the workers was computed by dividing the enclosure into a
Statistical analysis was performed using the built-in function “
Results and discussion
Activity regulation as a function of colony size
The average path length does not vary with the colony size (Fig. 2b) [linear regression of L versus N:
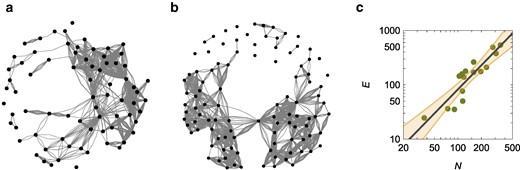
a) Representation of the spatial proximity network for the colony with 74 workers, showing an average degree of 0.982. b) Representation of the spatial proximity network for the colony with 104 workers, showing an average degree of 2.784. In a) and b), each node is a worker and the number of links between each pair identifies the number of frames in which they were within the chosen interaction distance. c) Hypermetric scaling of the number of interactions, E, versus the number of workers, N, for spatial proximity network; the solid line is the scaling
By examining the entire dataset of 16 colonies, we observe hypermetric scaling of the number of interactions with respect to the colony size (Fig. 3c) [scaling of E versus N,
The hypermetric scaling of the number of interactions is likely due to factors promoting the congregation of the ants, such as the formation of pheromone trails in the colony that do not uniformly cover the enclosure (26). As shown in Fig. 4a for the colony with
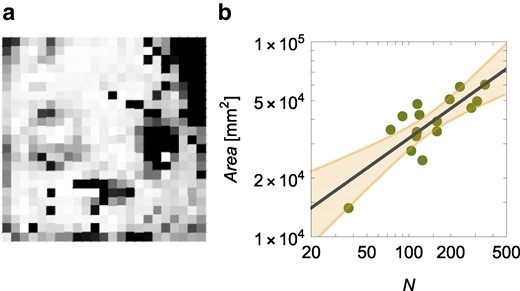
a) Colormap in gray scale of the spatial occupancy of workers in the next enclosure for the colony with 351 workers (white means locations never occupied by any worker and black location occupied the most). b) Hypometry of the area spanned by the workers,
For simplicity, assuming ants to be uniformly distributed in the spanned region, the overall number of interactions can be estimated as
Reverse social contagion is the process by which an active worker may cease their activity following an interaction with another active worker. Under the assumption of complete mixing, each worker interacts with
We determine an association between the overall extent of the reverse social contagion and the colony size (Fig. 5a) [linear regression of
Such a prediction is in agreement with experimental observations (Fig. 5b) [experimental data versus theoretical predictions:
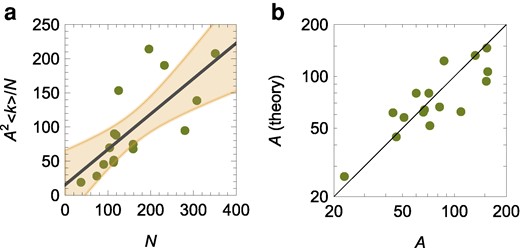
a) Evaluation of the hypothesis of reverse social contagion as a linear relationship between the number of interactions of active workers with other active workers,
Linking activity regulation and metabolism
The scaling of the number of active workers is reminiscent of “Kleiber’s law” stating that
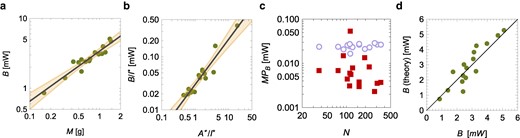
a) Hypometric scaling of metabolic rate, B, with colony mass, M; the black line is the scaling
Energy expenditure of ants is known to increase with their speed, and running ants can spend as much as six times the energy than those at rest (31). As such, we opted to differentiate between the energy costs of active versus inactive workers in the prediction of the metabolic rate through a Cobb–Douglas function (32), where we treat the number of active workers as “labor input” for the colony (like the number of manual workers employed in American manufacturing for Douglas) and the number of inactive workers as the “capital input” of the colony (like the fixed capital in manufacturing for Douglas),
Here, we use scaled variables to acknowledge the fact that some of the ants that are not visible can contribute to the metabolic rate of the colony; namely, we introduce
From the Cobb–Douglas function, we computed the marginal product of the number of active (inactive) workers on the overall metabolic rate, defined as the variation in metabolic rate due to one additional active (inactive) worker, while keeping the number of inactive (active) workers constant. In formulas, the marginal product of the number of active workers (
and the marginal product of the number of inactive workers (
A Cobb-Douglas function is compatible with the use of a scaling theory (21), facilitating the mathematical development of our approach and accurately describing the observed metabolic response (Fig. 6b) [scaling of
Based on the Cobb–Douglas function and the reverse social contagion, we expect that
Such a prediction is met by experimental observations (Fig. 6d) [experimental data versus theoretical predictions:
Assuming that
A parallel between social insect colonies and human urban centers
Urban settlement theories were the basis upon which we formulated our predictions. Like with metabolic scaling in insect colonies, most urban properties (Y) scale allometrically with a city’s population (N) as
A balance like the one underlying the amorphous settlement model cannot hold for the ant colonies: the metabolic rate B scales hypometrically with N, while the number of interactions E scales hypermetrically. One way to interpret the relationship between the total cost of movement and social benefits is by looking at the colony as one superorganism, rather than a collection of many, distinct organisms. Through this lens, the social benefit is the one of the collective, which seeks to maintain an average connectivity level in the colony: the higher the average connectivity, the lower the energy expenditure of a worker. While each human will want to transform their costs into their own interactions (Fig. 7a), insects may sacrifice their efforts for the benefit of the colony (Fig. 7b).
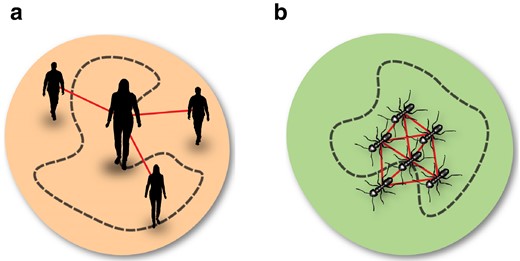
a) Illustration of an urban settlement composed of individuals who act for their own benefits: each person transforms their cost of movement (measured in some form of currency depending on their means of transport,
Conclusions
Unlike in human settlements, the results of this study support the idea that ants act to control their energy spending at the level of the colony rather than the individual. This view is backed by the close matching between scaling laws derived from a model of reverse social contagion, which captures colony-level activity regulation, as well as the recovery of metabolic scaling with colony mass, in line with Kleiber’s law. Therefore, this work suggests that the appropriate atomic unit for an ant is its colony—and not itself as a single organism—and that social interactions between individuals and the overall colony metabolism are inextricably linked. Future work to further explore this relationship will include time-resolved models of social contagion and inhibition which capture the dynamics of these regulatory interactions and the energy savings they enable, as well as detailed observations to identify the proximal mechanisms underlying reverse social contagion in ant colonies.
Acknowledgments
We would like to express our gratitude to Isabella Muratore and Anna Sawulska for their help with the graphics, and the URoL:EN research team including Dr. Ioulia Bespalova, Christopher Buglino, Dr. Sayomi Kamimoto, Prof. Michael Rubenstein, and Michelle Zhang for discussions about modeling ant behavior. The first author would also like to thank Prof. Nicola Pugno for interesting discussions around scaling theories.
Supplementary Material
Supplementary material is available at PNAS Nexus online.
Funding
This work is supported in part by funds from the National Science Foundation (NSF: # EF 2222418).
Author Contributions
M.P., J.S.W. and S.G. conceived the study; M.P., S.M., and J.S.W. curated the data; M.P. and P.DL performed the formal analysis; M.P., N.A., J.S.W., and S.G. acquired funding; M.P., P.DL., E.A., S.M., N.A., J.S.W., and S.G. performed the investigation; M.P. created the methodology and software, and provided and supervised the project administration; M.P. and J.S.W. provided resources; M.P., P.DL., and E.A. performed validation; M.P. and P.DL. created visualizations; M.P. and S.G. wrote the original draft; M.P. P.DL., E.A., S.M., N.A., J.S.W., and S.G. reviewed and edited the manuscript.
Data Availability
Data needed to generate the results presented are included in supplementary material, in a compact form, and publicly available via Zenodo (https://zenodo.org/doi/10.5281/zenodo.11622717), in a more complete form. The code created to generate results is also available via Zenodo (https://zenodo.org/doi/10.5281/zenodo.11622717).
References
Author notes
Competing Interest: The authors declare no competing interest.