Abstract
Densely packed, motile bacteria can adopt collective states not seen in conventional, passive materials. These states remain in many ways mysterious, and their physical characterization can aid our understanding of natural bacterial colonies and biofilms as well as materials in general. Here, we overcome challenges associated with generating uniformly growing, large, quasi-two-dimensional bacterial assemblies by a membrane-based microfluidic device and report the emergence of glassy states in two-dimensional suspension of Escherichia coli. As the number density increases by cell growth, populations of motile bacteria transition to a glassy state, where cells are packed and unable to move. This takes place in two steps, the first one suppressing only the orientational modes and the second one vitrifying the motion completely. Characterizing each phase through statistical analyses and investigations of individual motion of bacteria, we find not only characteristic features of glass such as rapid slowdown, dynamic heterogeneity, and cage effects, but also a few properties distinguished from those of thermal glass. These distinctive properties include the spontaneous formation of micro-domains of aligned cells with collective motion, the appearance of an unusual signal in the dynamic susceptibility, and the dynamic slowdown with a density dependence generally forbidden for thermal systems. Our results are expected to capture general characteristics of such active rod glass, which may serve as a physical mechanism underlying dense bacterial aggregates.
Editor:
Victor Nizet
Search for other works by this author on:
Bacteria often live in the form of dense populations, such as biofilms. While diverse approaches have been taken to understand such aggregates, physical consequences of being dense remained largely unexplored. Here, by using a microfluidic device suitable for a uniform culture of dense bacteria, we revealed that bacteria transition from an actively swimming state to jammed states as they proliferate, through a pathway analogous to glass transitions of colloidal rods. Through analysis of both single-cell and statistical properties, we characterized the observed collective states and transitions, and identified not only similarities but dissimilarities with usual glass formers including colloids. Our model experiment of dense bacteria may impact broad contexts beyond biofilms, hinting at general characteristics of such active rod systems.
Introduction
Dense bacterial populations offer an exciting frontier of research for both physical and microbial sciences. From the biological viewpoint, dense bacterial populations, especially biofilms, abound in diverse natural environments and beyond (1, 2), being also encountered in medicine and industries often as the bane (2–4). It is therefore crucial to characterize their multifaceted aspects (1, 2), including not only extracellular substances and cell phenotypes as studied extensively in the literature, but also physical consequences of being dense aggregates, which have gained an emerging interest in physical sciences. Indeed, recent physical studies on dense bacterial populations unveiled a plethora of collective states not seen in conventional passive materials (5, 6), which however remain in many ways mysterious.
Generally, dense particle systems may undergo glass and jamming transitions as the number density is increased, showing dramatic changes in both single-particle dynamics and material properties as suspension (7–11). Even for conventional thermal systems, it is only recently that firm theoretical grounds on glass transitions started to be built for some idealized cases (12). Therefore, it constitutes an important challenge in physics to extend this understanding to active systems (13–15), i.e. systems made of motile particles akin to cells, or more generally, to athermal systems including intracellular environments. Experimentally, glassy dynamics has been reported in cytoplasm and cell extracts (16–18) as well as in mammalian tissues (19–21), posing interesting problems both in physics and biology (13–15). Concerning bacteria, by contrast, whereas a few recent studies suggested the relevance of glassy phenomena to the regulation of motility and three-dimensional growth in bacterial colonies (22, 23), identification of glassy states in bacterial populations remains a challenge, especially under controlled environments that are necessary for the quantitative investigation. A primary difficulty is to keep uniform growth conditions for such dense cell populations for a long time. While microfluidics is generally suitable for controlled experiments, conventional devices that deliver nutrients through channels cannot maintain uniform growth conditions for large and dense populations (24).
Here we overcame past difficulties and report a controlled experiment characterizing emergent glassy phases of dense populations of motile bacteria. We used a membrane-type microfluidic device developed in (25) (Fig. 1a), named the extensive microperfusion system (EMPS). Delivering growth medium to bacteria through a porous membrane, this device can maintain a uniform and constant growth condition for bacteria trapped in a 2D well, even if the bacterial cells are densely packed (25). The membrane may also let out substances secreted by cells, thus providing an ideal platform for studying the physical effect of crowding. In the present work, we cultured motile bacteria (E. coli, strain RP437, width , length varying roughly from 2 to ; see Fig. S1 for the distribution of cell areas) in a closed 2D well (diameter , depth ) supplied with growth medium (tryptone broth supplemented with surfactant; see Methods), and monitored their spatiotemporal dynamics in a region near the center. Bacteria were initially swimming actively. However, as the area fraction of bacteria, , increased by cell growth and division at a uniform and constant growth rate (Fig. 1b–e, Figs. S2 and S3), we found that the motion of the bacterial population started to be hampered rapidly (Movies S1–5), while their positions and orientations remained globally disordered in space (Fig. 1f–i). In particular, the static structure factor does not show a significant change in its shape (Fig. 2a) in the range of where the bacterial motion slows down.
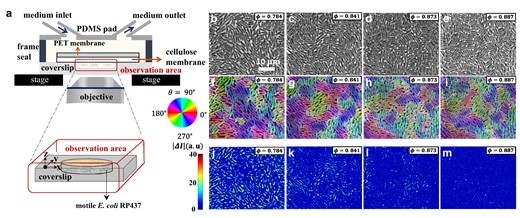
Fig. 1.
Experimental setup and vitrification of the bacterial population. a) Sketch of the experimental system. b–e) Phase-contrast images for different area fractions φ, taken at different times from a single experimental run (see Fig. S2). f–i) Orientation field (pseudocolor) overlaid on the phase-contrast images. j–m) Intensity difference with .
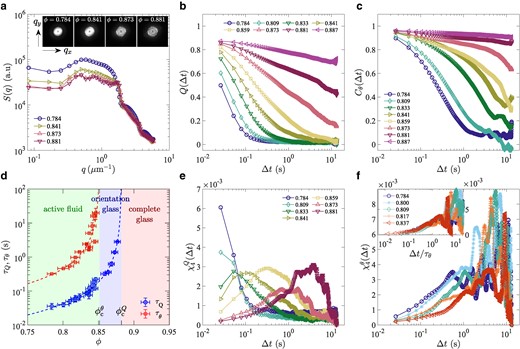
Fig. 2.
Static structure factor, structural relaxation, and dynamic susceptibility. a) The static structure factor for different area fractions φ. In the main panel, it is shown as a function of by taking the average over all angles in the reciprocal space. b) The overlap function for different area fractions φ (legend). c) The orientational correlation function for different area fractions φ (legend). d) The translational (overlap) and the orientational relaxation times, (blue circles) and (red squares), respectively, as functions of φ. The dashed lines indicate the results of the mode-coupling theory fitting, , with for and for . e) The dynamic susceptibility associated with the overlap function, for different area fractions φ (legend). f) The dynamic susceptibility associated with the orientation modes, for different area fractions φ (legend). The same symbols indicate the same values of φ in all panels except d.
Rapid dynamic slowdown
The rapid suppression of motion can be evaluated by the difference of phase-contrast image intensities taken at two different times, . Figure 1j–m shows that, with increasing , the region with (where bacteria hardly moved during the chosen time interval) expanded, and eventually, near , the entire population became kinetically arrested, i.e. vitrified. We also notice that this kinetic arrest took place heterogeneously (see Fig. 1k,l and Movie S1), analogously to glassy systems showing the dynamic heterogeneity (8, 9).
We characterize the observed vitrification by the differential variance analysis (DVA) (26), which uses the intensity difference to analyze the structural relaxation and the dynamic heterogeneity. The structural relaxation is studied by the overlap function defined by
where is the intensity variance taken over position and reference time t, and is evaluated by twice the variance of . The quantity roughly corresponds to the fraction of bacteria that did not move over lag time . More quantitatively, was reported to behave similarly to the self-intermediate scattering function (26), a quantity often used to characterize the structural relaxation of glassy materials.
Figure 2b shows the result of structural relaxation assessed through for different . For low , decays to zero after a relatively short relaxation time, indicating fast structural relaxation. This corresponds to what is called the α-relaxation in the literature (7–11). However, this α-relaxation time increases rapidly for , soon exceeding the observation time. To be more quantitative, we fit the data by a stretched exponential function, , well known to describe the α-relaxation of glassy materials (7, 8), and evaluate the relaxation time thereby (Fig. S4). The result indeed shows a rapid increase of (Fig. 2d, blue circles), by nearly two orders of magnitude in . The observed superexponential growth of indicates that our bacterial populations are a fragile glass former (7–9). It is compatible with typical growth laws documented in the literature, such as the power-law divergence
predicted by mode-coupling theories (MCT) (7, 8, 11) (Fig. 2d, blue dashed line), as well as the Vogel–Fulcher–Tamman law (7–9), (Fig. S6). This allows us to evaluate the glass transition point; for example, from the MCT power law Eq. (2), one obtains , where the number(s) in the parentheses represents the uncertainty in the last digit(s) (see Methods).
Two-step transition
At this point, it is worth recalling the spherocylindrical shape of the constituting entity, namely E. coli, which has both translational and orientational degrees of freedom. The relaxation of the orientational degrees of freedom can be evaluated by the orientational correlation function
where represents the nematic orientation angle. Figure 2c shows for different . Similarly to , also decays, following the stretched exponential form (Fig. S7), with a characteristic relaxation time that increases rapidly with (Fig. 2d, red squares). Importantly, we find that the orientational relaxation time is larger than that of the overlap function by an order of magnitude or more, and seems to diverge at lower . This is underpinned by the MCT fitting (Fig. 2d, red dashed line)
which gives that is significantly smaller than . The same conclusion was reached when the data were fitted with the Vogel–Fulcher–Tamman law (Fig. S6). From , we conclude that the orientational degrees of freedom vitrify earlier than the rest, i.e. the translational degrees of freedom, the latter of which essentially governed the relaxation of the overlap function. In other words, the glass transition in our system takes place in two steps, the first being a transition to the orientation glass at and the second the ultimate transition to the complete glass at (Fig. 2d).
Dynamic heterogeneity
Another hallmark of glassy dynamics is dynamic heterogeneity, which concerns nontrivial spatiotemporal correlation that develops near the glass transition (8, 9). It is often quantified by the dynamic susceptibility , which is essentially the variance of the structural correlation function. In DVA (26), it can be evaluated through the variance of , defined analogously to Eq. (1) but with a given t, without taking average over time. Here we adopt the following definition:
where denotes time averaging. The result in Fig. 2e shows that develops a peak as the second transition point is approached, at the time scale consistent with . This is typical of glassy systems (8), providing another support of characteristic glassy dynamics in our bacteria. By contrast, Fig. 2e also shows an unusual peak development for low , at small . This will be scrutinized below, through the analysis of the motion of bacteria and the collectivity. We also evaluated the dynamic susceptibility associated with the orientational degrees of freedom, defined by (Fig. 2f). In this quantity, we only see the peak due to the transition to the orientation glass, with the profile change controlled by the increase of (inset).
Individual dynamics of bacteria
Now we characterize the observed phases. First, we tracked single cells and investigated the evolution of their position and orientation . Figure 3a displays an example in the orientation glass phase, shown with time series of the displacement and the orientation (Fig. 3b,c, respectively; see also Movie S6). This cell was initially caged by neighbors (), but eventually escaped and moved significantly, over or so during , until it was caged again. This is the cage effect, another characteristic of glassy systems (7–9) (see Fig. S8 and Movie S7 for another cage escape event). Moreover, Fig. 3d shows that the displacement tends to occur along the cell orientation, even in such a dense population where cells are pushed by neighbors in all directions. In other words, cells are led to move along the orientation field , which is frozen in the orientation glass. As a result, it is practically only when bacteria move, by escaping from a cage, that they change the orientation significantly in the orientation glass phase (compare Fig. 3b,c). By contrast, in the active fluid phase , the orientation field along which bacteria tend to move evolves in space and time.
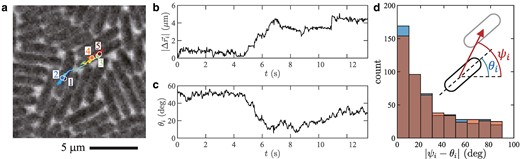
Fig. 3.
Glassy dynamics in the motion of individual bacteria. The displayed results are for , which is in the orientation glass phase. a) Trajectory of a single cell for , drawn on the phase-contrast image taken at the last time frame. The positions at are shown by colored disks with labels , respectively. b,c) Time series of the displacement from the initial position, b), and that of the orientation c) of the cell tracked in panel a. These time series show a cage escape event during . d) Histogram of the angle difference between the cell orientation and the displacement (see the sketch). The cell orientations and the displacements are measured between two times separated by an interval , with (blue) and (red). The two histograms are overlaid with semitransparent colors, so that the dark bars indicate the overlapping part and the light blue and red regions indicate the difference.
Formation of microdomains and collective motion
Here we scrutinize the spatial structure of the orientation field , which turned out to guide the motion of bacteria. Figure 4a,b shows, in their top left corner, measured in the entire well, for (active fluid phase) and (orientation glass), respectively (see also Movies S8–11). Both figures indicate the formation of nematic microdomains, composed of cells that are oriented in similar directions, reminiscent of those reported earlier for growing colonies of nonmotile bacteria (27). By plotting (main panels of Fig. 4a,b), we find that these domains are surrounded largely, if not entirely, by nearly discontinuous borders (red; notice the logarithmic scale of the pseudocolor code) with neighboring domains oriented in different directions. This microdomain structure is considered to be a result of the competition between the steric interaction, which tends to align the cells locally, and the activity-driven force, which originates from self-propulsion and cell growth and tends to destabilize the ordered alignment. We characterize the distribution of microdomain areas A and find an exponential distribution , with characteristic area that hardly depends on (Fig. 4c and Fig. S9). The exponential distribution was also found for nonmotile bacterial colonies (27), but the characteristic area turned out to be much smaller in our motile bacteria, presumably because of the stronger destabilizing force due to the self-propulsion.
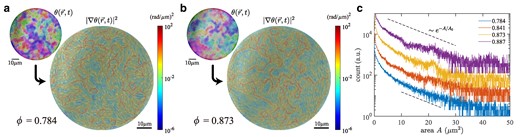
Fig. 4.
Formation of microdomains of aligned cells. a,b) The orientation field (top left) and its gradient squared (main) overlaid on the phase-contrast image, for (a, active fluid) and (b, orientation glass). See also Movies S8–11. The pseudocolor code for the orientation is identical to that used in Fig. 1f–i. c) Histograms of the microdomain area A for different (legend). The results were shifted vertically for the sake of visibility. The dashed lines are guides for the eyes indicating the exponential distribution with . The presented results were obtained with a threshold here. Changing this threshold results in a constant vertical shift (Fig. S9), while it hardly affects the characteristic area of the exponential distribution.
An important consequence of the formation of microdomains is the emergence of collective motion. Since individual bacteria tend to move along the orientation field, they attempt to move collectively in each microdomain, though the motion is largely hampered in the glassy states. However, in the active fluid phase, bacteria do move in the form of microdomains or clusters (Fig. 5a,b and Movies S8 and 9), more visibly for lower , similarly to swarming states of bacteria (28–32). The collective motion is evidenced by the presence of the velocity correlation between nearby cells (Fig. 5c), within a distance of , which is consistent with the typical size of the microdomains reported above. Note that the velocity correlation is generally absent in thermal systems, hence another athermal characteristic of our system, and is known to play a significant role in active glassy dynamics (13, 15, 33). In our system, the velocity correlation is formed as a result of the microdomain structure of the orientations, but it is noteworthy that the observed velocity correlation indicates the presence of polar order, despite the essentially nematic nature of the steric interaction. This collective motion produces nontrivial spatiotemporal correlation in the cell positions, which presumably results in the anomalous peak of the dynamic susceptibility found to develop for low (Fig. 2e). This argument is also supported by the fact that the anomalous peak is absent in the dynamic susceptibility of the orientation (Fig. 2f), , which is not affected by the bacterial motion. Interestingly, a similar short-time peak was also reported in a recent simulation of particles self-propelling in discrete directions and attributed to the cooperative vibrational motion of active particles (34).
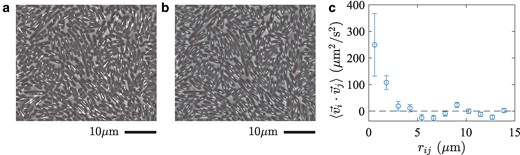
Fig. 5.
Collective motion of bacteria in the active fluid phase for . a,b) The displacements a) and the orientation changes b) of the individual bacteria during a short time interval, , displayed on top of the image at time t. In a, the displacements are indicated by the white arrows, whose endpoints are placed at the positions of the center of mass at times t and . In b, the orientation at time t and is shown by the white and cyan lines, respectively. c) The velocity correlation as a function of distance . The distances between cells were divided into bins and the average was taken in each bin. The error bars indicate the standard error, evaluated by regarding all pairs of cells as independent.
Concluding remarks
To summarize, we report that dense populations of motile bacteria spontaneously vitrify as the number density increases by cell growth and division. We found that this transition takes place in two steps as sketched in Fig. 2d, first from the active fluid phase to the orientation glass, where only the orientational degrees of freedom are arrested, and second to the complete glass where the remaining translational degrees of freedom are also arrested. These transitions were found to show characteristic properties of glass transitions, such as rapid slowdown, fragility, dynamic heterogeneity, and cage effects. We also showed that bacteria form nematic microdomains, leading to collective motion which seems to result in the unusual signal in the dynamic susceptibility for low . These are attributed to the rod shape and self-propulsion of bacteria, and as such, can be characteristic of active rod systems in general.
Our analysis has revealed some other aspects that deserve further investigation. First, regarding the two-step transition, it is not trivial whether the glass transition should first occur in the orientation modes, in the translation modes, or both simultaneously. The literature is mixed in this respect; experiments and simulations of ellipsoidal colloid glass showed the two-step transition in the same order (35–38), but an MCT approach to hard ellipsoids (39) as well as simulations of an active dumbbell model (40) exhibited the two transitions in the opposite order, i.e. first translation, then orientation. The two transitions may occur simultaneously depending on the particle aspect ratio, but to our knowledge, no theory or system has demonstrated a change in the order. It is therefore an interesting open problem to clarify what physical property controls the type of the two-step transition. Second, we remark that our estimates of the MCT exponents for the dynamic slowdown, and , seem to suggest the athermal nature of our system, because MCT generally gives for thermal systems (7) (see Supplementary material). It is important to identify what aspect of our active system is responsible for violating this lower bound for thermal systems, and what the consequence is.
All in all, our experiment serves as a model system for investigating physical properties of dense bacterial populations, with potential relevance in various contexts such as biofilms. It also contributes to the understanding of characteristic glassy dynamics of such active rod systems, a class of active, or athermal glass, which represents a frontier in the study of the physics of glass.
Materials and methods
Culture of bacteria
We used a motile strain of E. coli, RP437. As one of the standard strains for motility studies, its run-and-tumble behavior is well documented in the literature (41). First we inoculated bacteria into a sterile test tube with of Luria–Bertani (LB) medium (containing bacto-tryptone , yeast extract , and NaCl ). Then we incubated the liquid culture inside a shaking incubator at 37 °C for at the shaking speed of . We resuspended of the overnight culture into of fresh tryptone broth (TB, containing bacto-tryptone and NaCl ), and again incubated it for in the same culture condition. Finally, we measured the optical density of the liquid culture by a spectrophotometer. The optical density at wave length , was , which is equivalent to . We diluted the liquid culture to a concentration of () by resuspending it into a fresh TB medium containing of surfactant Tween-20.
Fabrication of microfluidic device
We performed experiments using a membrane-based microfluidic device, namely, the EMPS (25) (Fig. 1a). The EMPS comprises a micropatterned coverslip, a bilayer porous membrane (cellulose and polyethylene terephthalate), and a polydimethylsiloxane (PDMS) pad with an inlet and two outlets. The coverslip substrate used in the present work has an array of circular wells (diameter and depth ) that we microfabricated. To assemble the device, we first soaked the coverslip substrate in solution of 3-(2-aminoethyl aminopropyl) trimethoxysilane (Shin-Etsu Chemical) and then treated it with biotin solution. We also prepared a bilayer membrane of EMPS, which comprises a biotin-coated polyethylene terephthalate porous membrane (taken from Transwell 3450, Corning, with a nominal pore size of ) and a streptavidin-decorated cellulose membrane (Spectra/Por 7, Repligen, Waltham, MA, molecular weight cut-off 25,000). Before the experiment, we put of the bacterial suspension (, prepared by the aforementioned method) on top of wells on the substrate and attached the bilayer membrane to confine bacteria in the wells below the membrane, by biotin-streptavidin bonding between the cellulose membrane and the coverslip. Then we placed a double-sided tape (also acting as a spacer) of thickness on the coverslip, enclosing the micropatterned region, and attached a PDMS pad on the double-sided tape. This completes the fabrication of EMPS.
Observation of bacteria
The assembled EMPS device was placed on the stage of an inverted optical microscope (Leica DMi8), equipped with a 63x (NA=1.30) oil immersion objective and operated by the software Leica LasX. During the experiment, bacteria in the microfluidic wells were kept supplied with TB medium containing of surfactant Tween-20, through the bilayer porous membrane of EMPS. This medium was infused from a syringe by a pump (NE-1,000, New Era Pump Systems), at the flow rate of for the first and for the rest. As a result, bacteria grew and proliferated throughout each experiment. We monitored bacterial population in a well (diameter ) by phase-contrast microscopy, capturing images (pixel size , optical resolution ) by a charge-coupled device camera (DFC3000G, Leica). For the main experiment presented in this work, there were initially three cells in the observed well, but after roughly five hours, the number increased to . We then started to repeat series of acquisition of 1,000 images at an interval of , preceded by automatic focus adjustment (Leica adaptive focus control, single-shot mode). We further grouped the images into sets of 500 consecutive images and statistical analysis was carried out for each group. Bacteria continued growing and proliferating during this set of image acquisitions too, leading to an increase of the area fraction (Fig. S2). Note that, because the timing of the transition varied a little among different samples, we used a single biological replicate for the main analysis presented in this paper. For the uninterrupted observation shown in Movie S1, phase-contrast images were acquired at a regular interval of with automatic focus adjustment (continuous mode).
Image pre-processing
Pre-processing of the phase-contrast images consists of the following two parts. We corrected the effect of non-uniform illumination, by normalizing the image intensity with the local threshold intensity evaluated by adaptthresh function of MATLAB. Also, unless otherwise stipulated, we cropped the images to the region of interest of size pixels () near the center of the well, to avoid influence from the well perimeter.
Estimation of the area fraction
The area fraction , i.e. the ratio of the area occupied by bacteria to the total area of the region of interest, was evaluated by binarizing the pre-processed phase-contrast images as follows. The binarization threshold was set by a method called the 3-class fuzzy c-means clustering (42). Then we evaluated the fraction of the darker pixels in the binarized images. Using all 500 images of each data set, we evaluated the mean and the standard deviation of the fraction of the darker pixels, and used them as the most probable value and the error, respectively, of the area fraction .
Static structure factor
The static structure factor is defined as the squared modulus of the Fourier transform of the image intensity , i.e. , where is the 2D Fourier transform and is the wavenumber vector.
Orientation field
The coarse-grained orientation field of bacteria, with , was obtained by the structure tensor analysis (43). From the intensity field of a pre-processed phase-contrast image (here t is omitted from the argument for simplicity), the structure tensor is defined by
where
with a Gaussian kernel and . Then, the orientation field was obtained by
Tracking bacteria
To track the motion of individual bacteria, we first need to carry out cell segmentation of phase-contrast images. This was done by applying MiSiC (44), a deep learning-based method for the segmentation of bacteria, iteratively to each pre-processed phase-contrast image. More specifically, after each application of MiSiC, we removed the regions where cells were detected, added small noise to the image intensity, varied parameters that set the criteria of cell detection slightly and randomly, and applied MiSiC again, unless cells were already detected in a sufficient fraction of the area or MiSiC was already applied sufficiently many times (specifically, 300 times). After this iteration, we manually corrected the segmentation result if necessary, at least for the cell we focused on and its neighbors for the results presented in Fig. 3 and Movie S6, and for all cells in the field of view, except those on the boundary, for the results in Fig. 5. Then, using the segmentation results of all images in a given data set, we applied Blair and Dufresne’s particle tracking code available at https://site.physics.georgetown.edu/matlab/, which is based on the algorithm developed by Crocker, Grier, and Weeks (45). For the results on the active fluid phase shown in Fig. 5, manual correction of the tracking result was also necessary for bacteria that happened to move over a long distance through the neighbors. Note that the analysis shown in Fig. S8 and Movie S7 did not use the method described here, but is a result of fully manual tracking.
Nonlinear fit
All nonlinear fits presented in this work were carried out by using the Levenberg–Marquardt algorithm, known to solve nonlinear least-squares problems reliably. The uncertainties of the fitting results indicate the 95% confidence interval.
Acknowledgments
We are grateful to Y. Wakamoto and R. Okura for their help in the construction of a prototype of the experimental device used in this work. We thank A. Ikeda for his enlightening discussions on interpretations of the MCT fitting results (Supplementary material), H. Yoshino and A. Ikeda for discussions on glass transitions of anisotropic particles, G. Luca for his suggestion to carry out domain analysis (Fig. 4), Y. Han for his suggestion to measure the displacements (Fig. 5), and D. Nishiguchi for frequent discussions. We acknowledge the useful codes and libraries made available by S. Panigrahi and L. Espinosa for MiSiC (44), by J. C. Crocker, E. R. Weeks, D. Blair and E. Dufresne for the particle tracking, by G. Xiong for the 3-class fuzzy c-means clustering (42), and by F. Grussu for the structure tensor method.
Supplementary Material
Supplementary material is available at PNAS Nexus online.
Funding
This work is supported in part by KAKENHI from Japan Society for the Promotion of Science (Grant Nos. JP16H04033, JP19H05800, JP20H00128, JP21K20350, JP24K00593), by Core-to-Core Program “Advanced core-to-core network for the physics of self-organizing active matter (JPJSCCA20230002), and by “Planting Seeds for Research” program and Suematsu Award from Tokyo Institute of Technology.
Author Contributions
K.A.T. conceived the project and directed the research. H.L. and T.S. constructed the device. H.L. performed the experiments. H.L. and K.A.T. analyzed the data. M.J.Y. and Y.F. contributed to the development of the project. All authors contributed to the interpretation of the results. H.L. and K.A.T. wrote the manuscript, and all authors revised or commented.
Preprints
A preprint of this article is published at DOI:10.48550/arXiv.2205.10436.
Data Availability
The data that support the findings of this study, as well as relevant microscope images and scripts, have been deposited in Zenodo at https://doi.org/10.5281/zenodo.11522483.
References
1
Flemming
H-C
,
Wuertz
S
.
2019
.
Bacteria and archaea on Earth and their abundance in biofilms
.
Nat Rev Microbiol
.
17
(
4
):
247
–
260
.
2
Sauer
K
,
et al.
2022
.
The biofilm life cycle: expanding the conceptual model of biofilm formation
.
Nat Rev Microbiol
.
20
(
10
):
608
–
620
.
3
Hall-Stoodley
L
,
Costerton
JW
,
Stoodley
P
.
2004
.
Bacterial biofilms: from the natural environment to infectious diseases
.
Nat Rev Microbiol
.
2
(
2
):
95
–
108
.
4
Vishwakarma
V
.
2019
.
Impact of environmental biofilms: industrial components and its remediation
.
J Basic Microbiol
.
60
(
3
):
198
–
206
.
5
Be’er
A
,
et al.
2020
.
A phase diagram for bacterial swarming
.
Commun Phys
.
3
(
1
):
66
.
6
Aranson
I
.
2022
.
Bacterial active matter
.
Rep Prog Phys
.
85
(
7
):
076601
.
7
Götze
W
.
2009
.
Complex dynamics of glass-forming liquids: a mode-coupling theory
.
International series of monographs on physics
.
New York
:
Oxford University Press
.
8
Berthier
L
,
Biroli
G
.
2011
.
Theoretical perspective on the glass transition and amorphous materials
.
Rev Mod Phys
.
83
(
2
):
587
–
645
.
9
Hunter
GL
,
Weeks
ER
.
2012
.
The physics of the colloidal glass transition
.
Rep Prog Phys
.
75
(
6
):
066501
.
10
Charbonneau
P
,
Kurchan
J
,
Parisi
G
,
Urbani
P
,
Zamponi
F
.
2017
.
Glass and jamming transitions: from exact results to finite-dimensional descriptions
.
Annu Rev Condens Matter Phys
.
8
(
1
):
265
–
288
.
11
Reichman
DR
,
Charbonneau
P
.
2005
.
Mode-coupling theory
.
J Stat Mech
.
2005
(
05
):
P05013
.
12
Parisi
G
,
Urbani
P
,
Zamponi
F
.
2019
.
Theory of simple glasses
.
Cambridge
:
Cambridge University Press
.
13
Janssen
LMC
.
2019
.
Active glasses
.
J Phys Condens Mat
.
31
(
50
):
503002
.
14
Berthier
L
,
Flenner
E
,
Szamel
G
.
2019
.
Glassy dynamics in dense systems of active particles
.
J Chem Phys
.
150
(
20
):
200901
.
16
Zhou
EH
,
et al.
2009
.
Universal behavior of the osmotically compressed cell and its analogy to the colloidal glass transition
.
Proc Natl Acad Sci USA
.
106
(
26
):
10632
–
10637
.
17
Parry
BR
,
et al.
2014
.
The bacterial cytoplasm has glass-like properties and is fluidized by metabolic activity
.
Cell
.
156
(
1-2
):
183
–
194
.
18
Nishizawa
K
,
et al.
2017
.
Universal glass-forming behavior of in vitro and living cytoplasm
.
Sci Rep
.
7
(
1
):
15143
.
19
Angelini
TE
,
et al.
2011
.
Glass-like dynamics of collective cell migration
.
Proc Natl Acad Sci USA
.
108
(
12
):
4714
–
4719
.
20
Park
J-A
,
et al.
2015
.
Unjamming and cell shape in the asthmatic airway epithelium
.
Nat Mater
.
14
(
10
):
1040
–
1048
.
21
Garcia
S
,
et al.
2015
.
Physics of active jamming during collective cellular motion in a monolayer
.
Proc Natl Acad Sci USA
.
112
(
50
):
15314
–
15319
.
22
Rhodeland
B
,
Hoeger
K
,
Ursell
T
.
2020
.
Bacterial surface motility is modulated by colony-scale flow and granular jamming
.
J R Soc Interface
.
17
(
167
):
20200147
.
23
Takatori
SC
,
Mandadapu
KK
.
2020
. Motility-induced buckling and glassy dynamics regulate three-dimensional transitions of bacterial monolayers, arXiv, arXiv:2003.05618, preprint: not peer reviewed.
https://doi.org/10.48550/arXiv.2003.05618 24
Mather
W
,
Mondragón-Palomino
O
,
Danino
T
,
Hasty
J
,
Tsimring
LS
.
2010
.
Streaming instability in growing cell populations
.
Phys Rev Lett
.
104
(
20
):
208101
.
25
Shimaya
T
,
Okura
R
,
Wakamoto
Y
,
Takeuchi
KA
.
2021
.
Scale invariance of cell size fluctuations in starving bacteria
.
Commun Phys
.
4
(
1
):
238
.
26
Pastore
R
,
Pesce
G
,
Caggioni
M
.
2017
.
Differential variance analysis: a direct method to quantify and visualize dynamic heterogeneities
.
Sci Rep
.
7
(
1
):
43496
.
27
You
Z
,
Pearce
DJG
,
Sengupta
A
,
Giomi
L
.
2018
.
Geometry and mechanics of microdomains in growing bacterial colonies
.
Phys Rev X
.
8
:
031065
.
28
Marchetti
MC
,
et al.
2013
.
Hydrodynamics of soft active matter
.
Rev Mod Phys
.
85
(
3
):
1143
–
1189
.
29
Bechinger
C
,
et al.
2016
.
Active particles in complex and crowded environments
.
Rev Mod Phys
.
88
(
4
):
045006
.
30
Doostmohammadi
A
,
Yeomans
JM
.
2019
.
Coherent motion of dense active matter
.
Eur Phys J Special Topics
.
227
(
17
):
2401
–
2411
.
31
Be’er
A
,
Ariel
G
.
2019
.
A statistical physics view of swarming bacteria
.
Mov Ecol
.
7
(
1
):
9
.
32
Be’er
A
,
et al.
2020
.
A phase diagram for bacterial swarming
.
Commun Phys
.
3
(
1
):
66
.
33
Szamel
G
,
Flenner
E
,
Berthier
L
.
2015
.
Glassy dynamics of athermal self-propelled particles: computer simulations and a nonequilibrium microscopic theory
.
Phys Rev E
.
91
(
6
):
062304
.
34
Dey
S
,
Mutneja
A
,
Karmakar
S
.
2022
.
Enhanced short time peak in four-point dynamic susceptibility in dense active glass-forming liquids
.
Soft Matter
.
18
(
38
):
7309
–
7316
.
35
Zheng
Z
,
Wang
F
,
Han
Y
.
2011
.
Glass transitions in quasi-two-dimensional suspensions of colloidal ellipsoids
.
Phys Rev Lett
.
107
(
6
):
065702
.
36
Mishra
CK
,
Rangarajan
A
,
Ganapathy
R
.
2013
.
Two-step glass transition induced by attractive interactions in quasi-two-dimensional suspensions of ellipsoidal particles
.
Phys Rev Lett
.
110
:
188301
.
37
Zheng
Z
,
et al.
2014
.
Structural signatures of dynamic heterogeneities in monolayers of colloidal ellipsoids
.
Nat Commun
.
5
(
1
):
3829
.
38
Roller
J
,
Laganapan
A
,
Meijer
J-M
,
Fuchs
M
,
Zumbusch
A
.
2021
.
Observation of liquid glass in suspensions of ellipsoidal colloids
.
Proc Natl Acad Sci USA
.
118
(
3
):
e2018072118
.
39
Letz
M
,
Schilling
R
,
Latz
A
.
2000
.
Ideal glass transitions for hard ellipsoids
.
Phys Rev E
.
62
(
4
):
5173
–
5178
.
40
Mandal
R
,
Bhuyan
PJ
,
Chaudhuri
P
,
Rao
M
,
Dasgupta
C
.
2017
.
Glassy swirls of active dumbbells
.
Phys Rev E
.
96
(
4
):
042605
.
41
Min
TL
,
et al.
2009
.
High-resolution, long-term characterization of bacterial motility using optical tweezers
.
Nat Meth
.
6
(
11
):
831
–
835
.
42
Pant
M
,
Sharma
TK
,
Verma
OP
,
Singla
R
,
Sikander
A
.
2020
.
Soft computing: theories and applications: proceedings of SoCTA 2018
.
Advances in intelligent systems and computing
.
Springer Singapore
.
43
Jähne
B
.
1993
:
Spatio-temporal image processing: theory and scientific applications
.
Lecture Notes in Computer Science
.
Springer Berlin Heidelberg
.
44
Panigrahi
S
,
et al.
2021
.
Misic, a general deep learning-based method for the high-throughput cell segmentation of complex bacterial communities
.
eLife
.
10
:
e65151
.
45
Crocker
JC
,
Grier
DG
.
1996
.
Methods of digital video microscopy for colloidal studies
.
J Colloid Interface Sci
.
179
(
1
):
298
–
310
.
Author notes
© The Author(s) 2024. Published by Oxford University Press on behalf of National Academy of Sciences.
This is an Open Access article distributed under the terms of the Creative Commons Attribution License (
https://creativecommons.org/licenses/by/4.0/), which permits unrestricted reuse, distribution, and reproduction in any medium, provided the original work is properly cited.


