


Abstract
Mediating the terminal reaction of gluconeogenesis and glycogenolysis, the integral membrane protein glucose-6-phosphate catalytic subunit 1 (G6PC1) regulates hepatic glucose production by catalyzing hydrolysis of glucose-6-phosphate (G6P) within the lumen of the endoplasmic reticulum. Consistent with its vital contribution to glucose homeostasis, inactivating mutations in G6PC1 causes glycogen storage disease (GSD) type 1a characterized by hepatomegaly and severe hypoglycemia. Despite its physiological importance, the structural basis of G6P binding to G6PC1 and the molecular disruptions induced by missense mutations within the active site that give rise to GSD type 1a are unknown. In this study, we determine the atomic interactions governing G6P binding as well as explore the perturbations imposed by disease-linked missense variants by subjecting an AlphaFold2 G6PC1 structural model to molecular dynamics simulations and in silico predictions of thermodynamic stability validated with robust in vitro and in situ biochemical assays. We identify a collection of side chains, including conserved residues from the signature phosphatidic acid phosphatase motif, that contribute to a hydrogen bonding and van der Waals network stabilizing G6P in the active site. The introduction of GSD type 1a mutations modified the thermodynamic landscape, altered side chain packing and substrate-binding interactions, and induced trapping of catalytic intermediates. Our results, which corroborate the high quality of the AF2 model as a guide for experimental design and to interpret outcomes, not only confirm the active-site structural organization but also identify previously unobserved mechanistic contributions of catalytic and noncatalytic side chains.
Glycogen storage disease type 1a is a rare disorder of glucose metabolism caused by inhibition of glucose-6-phosphatase catalytic subunit 1 (G6PC1) hydrolytic activity of its substrate glucose-6-phosphate (G6P). Outlining the molecular mechanisms driving dysfunction establishes principles of catalysis and supports the rational development of therapeutic strategies. To explore putative mechanisms, we combine biophysical assays and protein stability predictions of G6PC1 active-site variants with molecular dynamics simulations of G6P binding to an AlphaFold2 structural template. Our results identify structural, thermodynamic, and kinetic perturbations induced by missense mutations that may contribute to pathogenesis. Our approach adds a new dimension to G6PC1 variant analysis by distinguishing the properties of pathogenic from benign mutations.
Introduction
Interconversion of glucose between its free and phosphorylated forms is among the most central reactions in metabolism, controlling its transport between extracellular, cytoplasmic, and luminal compartments, and thereby its storage and homeostasis. For example, glucose-6-phosphatase (G6Pase) couples the uptake of intracellular glucose-6-phosphate (G6P) into the endoplasmic reticulum (ER) lumen (1) with G6P hydrolysis into glucose and inorganic phosphate (Pi) (2, 3). The hydrolysis reaction is catalyzed by one of the three membrane-embedded G6Pase catalytic subunit (G6PC) family members that differ in primary sequence and tissue expression patterns (4). The terminal reaction of gluconeogenesis and glycogenolysis is mediated by G6PC1, which is predominantly expressed in the liver, kidney, and small intestine (5–7). Consequently, G6PC1 serves as the gatekeeper for hepatic glucose production that stabilizes blood glucose between meals. By residing at the crux of glucose homeostasis, G6PC1 is a potential therapeutic target for disorders of glucose metabolism. Whereas up-regulation of g6pc1 gene expression contributes to diabetes by increasing fasting blood glucose concentration (8–17), aberrant mutations in the primary sequence that impair activity cause glycogen storage disease (GSD) type 1a (18, 19).
With an approximate incidence of 1 in 100,000 births, GSD type 1a is an autosomal recessive disorder characterized primarily by severe hypoglycemia following a fast (20). Due to inactive G6PC1, the accumulation of intracellular G6P stimulates flux through alternate metabolic pathways including glycogenesis that promotes excessive glycogen storage in the liver. In addition to hepatomegaly, GSD type 1a is also associated with a host of other metabolic complications including hyperuricemia and hyperlipidemia and an enhanced risk of hepatic adenoma and carcinoma (21–23). The disorder is juvenile lethal if left untreated. Although adenoviral gene delivery and lipid-encapsulated mRNA are being explored as clinical treatment options (24–26), therapeutic interventions are limited presently to dietary restrictions supplemented with a drug regimen to treat the disease complications (27). According to the Human Gene Mutation Database, more than 100 pathogenic mutations scattered throughout the g6pc1 coding sequence have been identified in patients with GSD type 1a (28). However, the structural and mechanistic basis for the catalytic dysfunction of these mutations remains to be fully elucidated.
Despite considerable effort since its discovery in the early 1950s (7), G6PC1 extracted from its native membrane environment has been recalcitrant to in vitro investigations due to structural and catalytic instability (29–32), precluding detailed analysis of the structure/function paradigm. In 2021, DeepMind revolutionized the field of structural biology with the introduction of AlphaFold2 (AF2), a deep-learning platform that integrates knowledge of protein folds with residue coevolution encoded within deep multiple sequence alignments to predict remarkably accurate structures of proteins (33). Highlighted in one of two seminal publications (34), the AF2 model of G6PC1 displayed a fold consistent with the type 2 phosphatidic acid phosphatase (PAP2) superfamily that includes membrane-integrated lipid phosphatases and water-soluble haloperoxidases (35) as well as the predicted topology of G6PC1 from biochemical experiments (36, 37). The defining feature of this superfamily is a signature tripartite sequence motif (KX6RP—PSGH—SRX5HX3D/Q) that participates in active-site formation (38) and includes positions of GSD type 1a mutations (18). Although the AF2 model recasts G6PC1 and disease-linked mutations in a novel structural context, notably absent from the computational prediction is an understanding of fundamental substrate-binding interactions critical to the catalytic mechanism.
In this work, we use molecular dynamics (MD) simulations to explore G6P binding to the G6PC1 AF2 model immersed in a representative ER membrane. Moreover, we predict the molecular consequences of G6P-binding energetics and G6PC1 thermodynamics by introducing a select panel of GSD type 1a mutations into the active site in silico. Capitalizing on our recently published in vitro methods that overcome previous experimental limitations with purified enzyme (39), we complement the computational evaluation of the model with biochemical and biophysical studies of G6PC1 variants to outline changes in expression, activity, and stability. We find that the AF2-generated model is remarkably stable and binds both α-G6P and β-G6P anomers with a nearly identical pattern of electrostatic and van der Waals interactions within the predicted active site. Perturbation of these interactions through disease-linked amino acid substitutions not only causes changes to G6P-binding energetics but also to G6PC1 structure and intrinsic stability. The integrated analysis suggests novel side-chain contributions to substrate binding and Pi release, and implies that GSD type 1a mutations disrupt catalysis via multiple molecular pathways.
Results
Structure and stability of G6PC1 in a model lipid bilayer
We chose to exploit mouse G6PC1 as an archetype G6Pase catalytic subunit for the structural and mechanistic questions addressed here. Mouse G6PC1 bears 89% sequence identity with the human homolog and is predicted by AF2 to possess an identical tertiary fold (root mean squared deviation ∼0.125 Å) epitomized by a conserved active-site organization. Globally, 90 of the 94 residues at positions of naturally occurring GSD type 1a missense/nonsense mutations, including all of those at the active site, are strictly conserved between the two homologs. Moreover, a murine model of GSD type 1a (g6pc1−/−) recapitulates a similar phenotype as human patients (40, 41). Importantly, detergent-solubilized mouse G6PC1 demonstrates elevated structural and catalytic stability relative to human G6PC1 in biochemical assays (39), supporting an unequivocal interpretation of the in vitro studies reported here. Thus, mouse G6PC1, subsequently referred to simply as G6PC1, is an appropriate model for computational and experimental studies.
Because the AF2 modeling pipeline does not account explicitly for the membrane, the high-accuracy (average predicted local distance difference test [pLDDT] = 92.58) G6PC1 model was placed into an approximate ER membrane to assess its relative stability and interaction with lipids (Fig. 1A). G6PC1 was almost entirely buried within the membrane with the active site residing at the membrane–water interface. This model, which was gently relaxed from its initial state during the minimization phase, was then subjected to equilibrium MD simulations, which converged within 100 ns in multiple iterations to arrive at a common structural model suitable for ligand docking and thermodynamic predictions. The aggregate simulation data yielded a final all-atom rmsd of only 1.76 Å relative to the original AF2 model (Fig. 1B), consistent with a highly stable structure within experimental error (33, 42). Regions of higher internal flexibility are highlighted by root mean squared fluctuation (RMSF) analysis of the simulation dataset (Fig. 1C) and correlate well with unstructured loops and regions of lower confidence from the AF2 prediction.
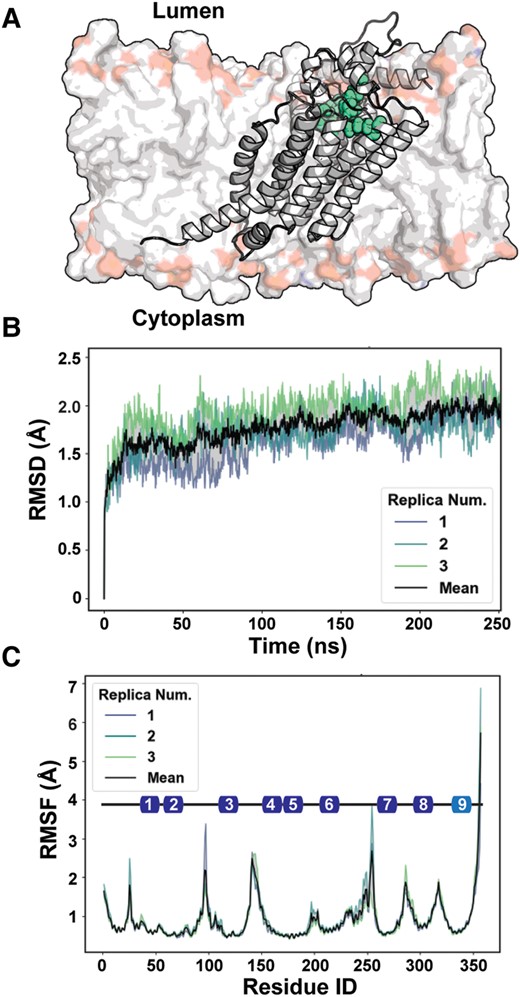
Modeling the AF2 G6PC1 structure in a simulated bilayer. A) Cartoon rendering of G6PC1 immersed into a representative ER bilayer. The composition is reported in Materials and methods. The active site is demarcated by residues in space filling representation that contribute to the phosphatidic acid phosphatase sequence motif. B) Time series of rmsd of G6PC1 over the course of equilibrium simulations. C) RMSF showcases regions of higher disorder that map to termini and loops. The colored boxes illustrate the topology of the nine transmembrane helices along the primary sequence. The color represents the pLDDT score of the AF2 model for these segments, with the darker blue indicating higher pLDDT that reflects higher predicted accuracy of the model.
Modeling the G6P-bound active site
We leveraged available crystallographic structures from a vanadium-containing chloroperoxidase (43) and three bacterial PAP2 type lipid phosphatases (44–46) that contain surrogate phosphate molecules (, , and ) to guide docking of the G6P substrate into the putative G6PC1 active site. When aligned with the AF2 model of G6PC1, these protein structures highlight a strongly conserved active-site organization composed of key residues in the phosphatase sequence motif (Fig. S1A). We mapped the phosphate moiety of both α-G6P and β-G6P anomers, derived from 95 crystal structures, to the AF2 G6PC1 model by targeting the atomic coordinates belonging to the phosphate analogs. Although placement of the phosphate group for each modeled G6P was well defined, a “cloud” of possible conformations was showcased by the glucose moiety likely due to dihedral flexibility (Fig. S1B and E).
Two conformations representing an α-G6P and a β-G6P anomer were chosen for preliminary docking onto the membrane-relaxed G6PC1 structure (Fig. S1C). These two G6P-bound models were subjected to 500 ns equilibrium MD simulations performed in triplicate to assess stability. Although repacking of critical active-site residues was observed early in the simulations (Fig. S1D), rmsd analysis indicated stability and robustness similar to the apo state (Fig. 2A). Both G6P anomers induced marginal structural perturbations relative to the apo model (<2.5 Å rmsd). Although binding of either anomer was thermodynamically favorable, free energy perturbation (FEP) calculations indicated that binding of the β-anomer to this conformation of G6PC1 is energetically preferred by ∼5 kcal/mol (Fig. S2). The ΔΔG between anomers may reflect more stabilizing interactions with G6PC1 facilitated by more dynamic conformational sampling of β-G6P as indicated by the bimodal distribution of sugar pucker angles during simulations (Fig. S1E). In some cases, residues lining the active site showed increased contact probability with β-G6P (Fig. 2B). Even though these contact differences were variable across three independent simulations, additional hydrogen bonding contacts between polarized hydrogens on the β-G6P ring between D38 and E110 side chains (Fig. 2F) may have contributed to increased binding energy in FEP calculations.
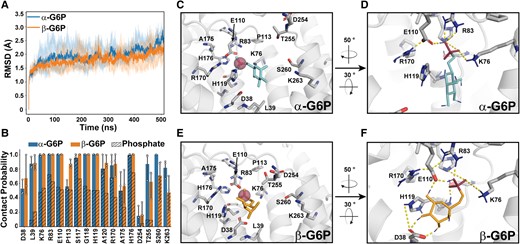
Identification of G6P-binding residues and stability of the ligand-bound model. A) The rmsd of substrate-bound simulations for each anomer. The dark traces are the average rmsd over multiple runs (n = 3). B) Per residue contact probability, defined as the proportion of time each residue spends within 4 Å of G6P, was assayed from over 10,000 frames. The relative proportion of residue contacts with the phosphate moiety is indicated by hash marks. The mean and SD is derived from n = 3 replicas. Representative binding modes of α-G6P (C and D) or β-G6P (E and F) to the active site. The highlighted hydrogen-bonding interactions range from 1.6 to 4 Å. The poses chosen were based on the shortest contact distance to side chains of the phosphatase sequence motif.
Figure 2C–F captures a representative binding mode sampled for each G6P anomer from ∼30,000 simulation frames as determined by a minimal sum of distances to the catalytic K76, R83/170, and H119/176 side chains. For these poses, atomic distances between polarized hydrogens of the side-chain functional groups and the phosphate oxygen atoms of both anomers typically reached <2–4 Å. Interestingly, the backbone amides of S117, G118, and H119 were in good position to provide hydrogen bonding contacts with the phosphate moiety, whereas the H119 side chain could support coordination of the ring of β-G6P (Fig. S3). Potential longer range (>4 Å) interactions between the phosphate moiety of both G6P anomers and the backbone amide of A120 were also suggested (Fig. S3). Collectively, the structural convergence of multiple independent simulations as well as the intricate and consistent pattern of interactions with G6P strongly supports the predicted active-site identity of G6PC1.
Energetic perturbations arising from pathogenic missense mutations
Nine of the 16 residues that make contacts with G6P over the simulation time course are sites of naturally occurring GSD type 1a mutations in G6PC1 (Table 1). Previous in vitro characterization of these missense variants in the context of ER microsomes showed that G6P catalysis was reduced or abrogated (19), but the molecular basis of compromised function was unclear. Based on the G6P-bound model alone, mutation of interacting residues may affect substrate-binding energy. Alternatively, side-chain substitutions may destabilize critical packing interactions. Calculation of changes in Gibbs energy (ΔΔG) within an implicit membrane using the Rosetta macromolecular modeling suite (49–52) predicted that six of these variants (D38V, K76N, R83H, E110K, P113L, and T255I) promoted thermodynamic instability >2 kcal/mol in the bilayer-relaxed Apo model (Table 1 and Fig. S4). In contrast, H119L and R170Q enhanced stability. A similar predicted pattern was observed using an orthogonal method that calculates ΔΔG from energy-minimized AF2 structure predictions (53), although the absolute values differed (Table 1). The significance of these findings was emphasized by ΔΔG analysis of two uncharacterized missense variants, Q14R and E319K, listed in the Genome Aggregation Database (48) that are found outside the active site on the protein surface and expected to be well tolerated (Table 1). These predicted thermodynamic perturbations suggest that compromising native side-chain energetic interactions could disrupt active-site stability, potentially contributing to local or global misfolding. We further explored these possibilities by a series of computational and biochemical assays.
Stability of G6PC1 variants.
| Variant | Clinical significancea | ΔΔG-Ros (kcal/mol)b | ΔΔG-AF (kcal/mol)c | TM (°C) |
|---|---|---|---|---|
| WT | 36.7d | |||
| Q14R | Unknown | +1.0 | +0.6 | 38.8 |
| D38V | Pathogenic | +3.7 | +2.5 | 33.0 |
| K76N | Pathogenic | +2.8 | +1.3 | 36.7 |
| R83H | Pathogenic | +11.7 | +6.3 | ND |
| E110K | Likely Pathogenic | +7.0 | +1.4 | ND |
| P113L | Pathogenic | +161.0 | +0.6 | ND |
| G118S | Pathogenic | −0.7 | +0.4 | 36.5 |
| H119L | Pathogenic | −4.0 | −1.5 | 37.8 |
| R170Q | Pathogenic | −5.5 | −8.8 | 41.7 |
| T255I | Pathogenic | +71.5 | +3.8 | 36.3 |
| E319K | Unknown | +0.8 | +1.9 | N.D. |
Residue-specific interaction energies with both G6P anomers were calculated using NAMD (54, 55). The time series of energy distributions was binned from three independent 250-ns replicates for a total of 54 mutant simulations accumulating 13.5 µs of sampling. The consequences of the in silico mutagenesis on G6P binding per residue are shown in Fig. 3. Importantly, the trends observed for individual side chains were parallel to those in composite interaction energies summed over the entire active site (Fig. S5), indicating that a single substitution can perturb sufficiently global substrate-binding energetics. Although the absolute number of side-chain contacts was reduced across all variants, interaction energies could be categorized into three classes (Fig. 3). In one class, the enthalpic component to G6P interactions was largely abolished by nonconservative substitution of key phosphatase residues K76, R83, H119, or R170 incurring ∼20–100 kcal/mol loss of interaction energy in each. According to the model, these positively charged native side chains are positioned optimally to coordinate the negatively charged phosphate moiety of G6P (Fig. 2). In a second class, the introduction of the D38V, P113L, G118S, or T255I mutations was less impactful (though nonnegligible) by demonstrating similar energy distributions, suggesting that impaired function of these variants originates from either a unique mechanism or a combination of factors.
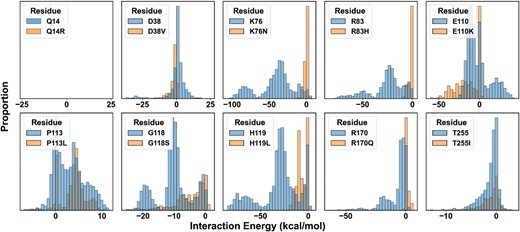
Perturbations of nonbonded interaction energies with G6P in GSD type1a variants. Interaction energy of each residue with G6P illustrates changes in the enthalpy of binding. Data are pooled from both G6P anomers. Energies shown are the summation of van der Waals and electrostatics. Q14R, a negative control, sits outside the active site and does not interact with G6P.
The distinct pattern emerging from E110K established a third class defined by a left shift in the energy histogram indicating greater stabilization of the substrate in the binding pocket. Recently, E110 was postulated to serve as a surrogate substrate of the apo enzyme by stabilizing a closed conformation of the active site through salt bridges with the nearby R83 and R170 (34). In the bound state, the E110 side chain served as a hydrogen bonding bridge between a polarized hydrogen belonging to the phosphate moiety of G6P and R170 (Figs. 3D, F and S6A–C). The formation of this bridge shifted the ensemble of salt bridge dynamics between the E110 and R83/170 side chains in the apo state (Fig. S6D). While this electrostatic interaction with the substrate attenuated salt bridge potential of E110 with R83, interaction of E110 with R170 increased (Fig. S6E). Importantly, the MD simulations indicated that K110 is more energetically favorable to G6P binding than E110, which is likely rooted in the increased positivity of the binding pocket and the disrupted salt bridge interactions with the conserved Arg side chains (Fig. S6D). Thus, these observations imply that the native Glu (E) participates in product release, whereas the E110K variant favors trapping of G6P in the active site.
Expression and activity profiles of GSD type 1a variants
To explore the hypotheses derived from our computational analysis, we tested the biological outcomes of these active-site GSD type 1a mutations as well as the Q14R and E319K variants by employing the enzyme expression and activity screens that we developed recently (39). Specifically, wild type (WT) and mutant G6PC1 were transfected into adherent HEK293SG cells as a fusion with EGFP on the C-terminus to facilitate assay analyses. G6PC1 expression was confirmed via cell epifluorescence (Fig. S7). Relative quantities and homogeneity of G6PC1 fusion protein were determined by EGFP fluorescence detection size exclusion chromatography (FSEC) (56) following whole-cell solubilization with lauryl maltose neopentyl glycol (LMNG) detergent. LMNG was identified previously from a detergent screen to support extraction of active and homogeneous G6PC1 (39).
Representative FSEC traces in Fig. 4A illustrate the spectrum of chromatographic behaviors observed for the variants. The full complement of traces is shown in Fig. S8. In general, expression of disease-linked variants was either unperturbed or greatly reduced relative to WT. Additionally, the elution profiles, which indicate the presence of either polydisperse entities or folded monodisperse protein, reported a variable propensity for aggregation. The R83H and P113L mutations displayed highly compromised G6PC1 expression with elution profiles consistent with a large degree of structural disorder. Although D38V and E110K expression levels were attenuated strongly, the peak shapes suggested that these mutants largely retained the structural properties of the WT. Interestingly, K76N, G118S, H119L, R170Q, and T255I behaved similarly to WT, Q14R, and E319K. These features were captured by integration of the elution peak (AUC, area under the curve) from multiple independent trials, translating the FSEC traces into an expression bar graph for each variant relative to WT (Fig. 4B). The observed trends were comparable with the whole-cell epifluorescence pattern (Fig. S7). Statistical analyses of these data supported the conclusion that expression of Q14R, K76N, G118S, H119L, R170Q, T255I, and E319K was unchanged relative to WT (Table S1).
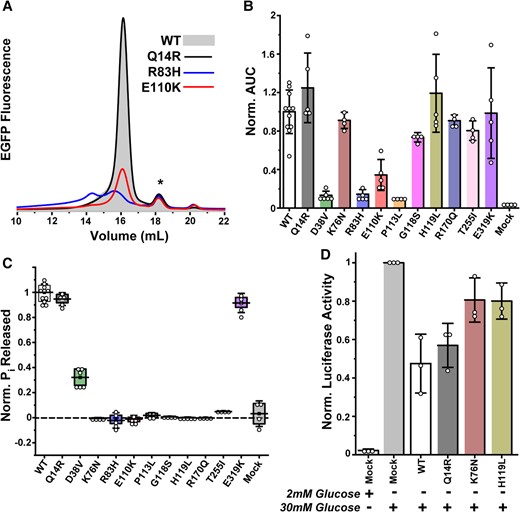
Expression and activity profiles of GSD type 1a variants from transfection of adherent cells. A) Representative FSEC traces illustrate the range of chromatographic behaviors, including reduced expression (E110K) or the presence of misfolded species (R83H). The * identifies a minor population of cleaved EGFP. B) Expression levels, quantified by the AUC in FSEC traces, are dependent on the variant. The bar graph captures the mean ± SD of multiple independent experiments (n = 4–11). C) The corresponding variant catalytic capacity normalized to its enzyme concentration obtained from B) is plotted relative to the WT. D) In situ assay of G6PC1 variant activity stimulated by glucose in adherent 832/13 rat islet-derived cells confirms compromised activity of the K76N and H119L variants relative to functional constructs (n = 3, mean ± SD shown). The metrics in B–D) were analyzed by one-way ANOVA and Tukey tests (Table S1).
Apart from D38V, in vitro hydrolysis measurements of LMNG-solubilized G6PC1 with a saturating concentration of G6P revealed a binary enzyme activity profile (Fig. 4C). Not surprisingly, the absence of G6P hydrolysis in R83H and P113L was linked directly to either absent or poor expression of folded protein. Even though E110K expressed better than D38V, catalysis was abolished. Likewise, K76N, G118S, H119L, R170Q, and T255I were catalytically inactive despite similar expression as WT. We further confirmed the impaired activity of K76N and H119L with an in situ luciferase reporter assay that indirectly measures G6Pase activity within intact cells (57, 58). This assay capitalized on a cell line derived from rat islets, 832/13, which displays limited endogenous G6Pase activity. These cells express a transfected rat G6PC1-luciferase gene fusion when robustly induced with glucose, stimulating G6P production via glucokinase activity. In the absence of hydrolysis, G6P binds to the luciferase promoter to drive fusion gene expression (Mock, Fig. 4D). As expected, cotransfection of functional WT or Q14R blunted glucose-induced fusion gene expression by mediating G6P hydrolysis and reducing glycolytic flux (Fig. 4D). On the contrary, cells cotransfected with the K76N and H119L variants behaved similarly to the mock control, consistent with these variants being catalytically impaired (Table S1).
Active-site contraction induced by GSD type 1a variants
The striking observation that K76N, G118S, H119L, R170Q, and T255I retained WT-like expression properties demonstrated that these substitutions are structurally tolerated, precluding a clear correlation with the predicted ΔΔG (Table 1). Given that energetic disruptions to G6P binding were unequal among these variants (Fig. 3), we considered that the molecular consequences of these substitutions may be conferred to the protein backbone. Accordingly, we observed a variant-dependent reduction in the solvent-accessible surface area (SASA) of the active site calculated by the molecular visualization program VMD. This reduction was characterized by changes to the ensemble average and breadth of SASA distributions relative to WT and Q14R (Fig. 5A), suggesting contraction of the active site. These changes in SASA correlated with average pairwise residue–residue distances in these variants, which highlighted regions of constriction predominately localized to the large luminal loops between transmembrane helices (TMs) 2/3 and TMs 6/7 that contribute residues to the active site (Fig. S9). The restructuring of the active site could be visualized from the perspective of a putative substrate-permeable portal composed mostly of residues from TM1 and the large luminal loops (Fig. 5B). Selected to represent the mean SASA for each variant (dashed lines in Fig. 5A), the frames capture the displacement of active-site residues and variable degrees of portal collapse. As a corollary, dynamic sampling of the protein backbone was altered relative to WT over the simulation time course. Relative changes in backbone dynamics reported by (ΔRMSFs not only occurred near the active site, but also extended into the transmembrane core (Fig. S10). Collectively, the computational analysis emphasized the potential for active-site variants to drive structural alterations that may be causative or degenerate with other mechanisms of catalytic impairment, such as reduced stability as discussed below.
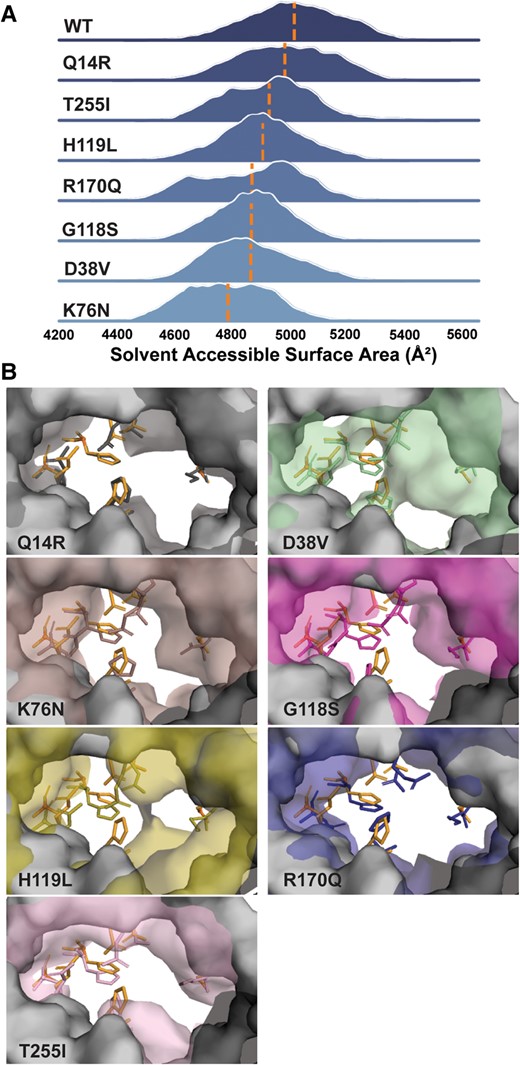
Active-site SASA calculated in VMD. A) The distribution of SASA for each variant relative to WT suggested contraction of the active site. The mean of the distribution is demarcated by a dashed line. B) View of active-site residues through a portal captured side-chain repacking and portal collapse at the mean.
Determinants of reduced expression and hydrolytic capacity of D38V
D38V was the only disease-linked variant that retained catalytic activity significantly above background (Fig. 4C). Yet the hydrolysis screen indicated that this variant retained only ∼30% of the Pi release capacity from the equivalent concentration of WT enzyme. The experimental and computational analysis suggested that both expression of the folded protein (Fig. 4B) and access to the active site (Fig. 5) were attenuated strongly. To ascertain more specifically how these observables may reflect structural and catalytic properties, we sought to define the turnover kinetics and stability of D38V when purified into LMNG detergent micelles. Unlike Q14R, which displayed nearly identical saturation kinetics as the WT (39), the specific activity of D38V was reduced 3-fold without a shift in KM (Fig. 6A). Thus, the diminished hydrolytic capacity of D38V was a direct consequence of a lower Pi release rate.
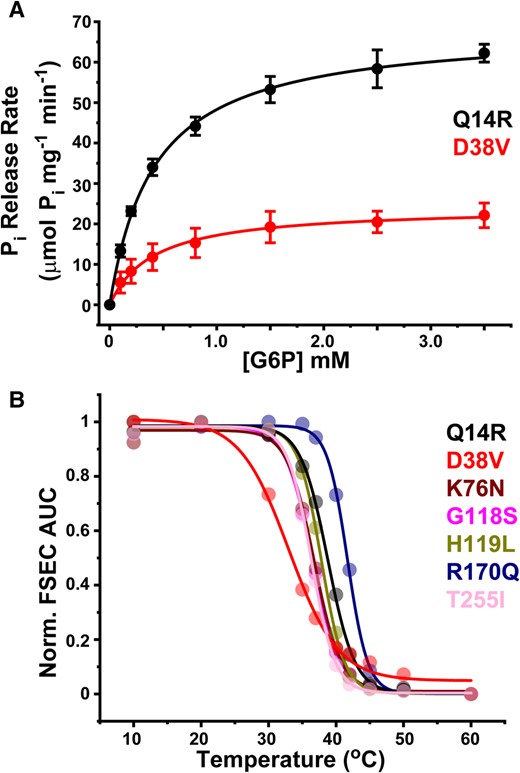
Saturation kinetics of D38V correlates with reduced thermostability. A) Michaelis–Menten kinetics of G6P hydrolysis indicates that the specific activity of GSD type1a variant D38V (Vmax = 24.5 ± 1.9 μmol/mg/min; Km = 0.472 ± 0.246 mM) is reduced 3-fold relative to the WT-like Q14R variant (Vmax = 68.4 ± 3.0 μmol/mg/min; Km = 0.413 ± 0.017 mM). Solid lines are fits of the data using a single binding site model. B) The left shift in the D38V melting curve indicates reduced thermostability relative to other well-expressed variants. Solid lines are fits of the data assuming a simple dose–response model to determine TM, which is reported in Table 1.
While a more constricted active site may contribute to the depressed Vmax, reduced substrate turnover may also be associated with compromised structural stability. To test the implicit computational prediction of the ΔΔG calculations (Table 1), we measured the thermostability of D38V and compared it with that obtained for other well-expressed variants. Thermostability was determined by a chromatography-based approach wherein purified protein samples subjected to a thermocycler heating protocol were analyzed for soluble protein content by FSEC monitoring intrinsic Trp fluorescence (39, 59). Plotting the elution peak integral as a function of temperature produced a curve characterized by a melting temperature, TM. As shown in Fig. 6B, the melting curves of most variants clustered within a narrow window that was reminiscent of the WT (39). However, the D38V melting curve was strongly left-shifted, which was indicative of a loss of heat tolerance. Nonlinear least squares fitting of the data confirmed a >3 °C TM differential between D38V and all other variants (Table 1). Interpreted as a reporter of ΔGunfolding, this phenomenological analysis of the D38V variant was consistent with compromised thermodynamic stability. Thus, the reduced thermostability of D38V not only rationalized the lower abundance of folded G6PC1, but also correlated with observed catalytic impairment.
Discussion
Systematic exploration of protein structure and function is widely recognized as essential to defining pathogenic mechanisms arising from missense mutations, and reliable protein models are a prerequisite for contextualizing such biochemical data (60–62). Homology models derived from high-resolution structures of related proteins have been proposed to serve as sufficient templates for the interpretation of disease-causing variants (63, 64), although AF2 models are expected to further improve the accuracy of the predictions (65). Conflicting reports of AF2's sensitivity to missense mutations (66–68) have cast doubt on uncovering either strong correlations or predictive outcomes between WT and variant sequences for a given structural metric or phenotype. However, a recent evaluation of AF2 applications showed that high-accuracy AF2 models (average pLDDT > 90) matched or improved the correlation between experiment-derived ΔΔG and ΔΔG from structure-based predictors, such as that available with Rosetta, relative to a structure obtained from experiment (65). In this current example, we show that combining a high-accuracy AF2 model of G6PC1 with orthogonal computational and experimental approaches supports mechanistic insight into critical catalytic interactions and characterization of molecular disruptions caused by known disease-linked missense mutations.
We find that the AF2 G6PC1 model is highly stable in the simulated in vivo environment and that the two stereoisomers of G6P make favorable electrostatic and van der Waals interactions with a network of side chains in the putative active site. This active site, outlined by the consensus phosphatidic acid phosphatase sequence motif, demonstrates similar packing of conserved side chains observed in the crystal structures of evolutionary-distant PAP2 superfamily members with bound quaternary ions. Despite subtle repacking of active-site side chains in the MD simulations to optimize G6P interactions, the overall conformation of G6PC1 remains intact, suggesting that the AF2 model represents a relevant intermediate in the catalytic cycle. In particular, the tertiary organization of the active site is well suited to mediate hydrolysis chemistry in accordance with the presumed model mechanism (38). While R83 and R170 are arranged to stabilize the substrate and its transition state via hydrogen bonds, both H119 and H176 are primed to function as the proton donor and phosphate acceptor, respectively (69). Given that the panel of interacting residues is either strictly conserved or categorically similar in the G6PC family, we anticipate that G6P-bound G6PC1 (Fig. 2) captures common features of substrate binding in G6PC2 and G6PC3.
Previous measurements of glucose anomer composition in microsomes have suggested that while G6P transport by the SLC37A4 translocase to the G6PC1 active site appears selective for the β-anomer (70), G6Pase phosphohydrolase activity per se is not anomer selective (70, 71). Thus, the discovery that binding of β-G6P is favored by up to three orders of magnitude under equilibrium conditions (K ≍ 3,300 at 37 °C) was unexpected. We speculate that increased binding affinity is associated with enhanced conformational flexibility of β-G6P, which could promote favorable interactions with the modeled conformation of the G6PC1 active site (Fig. S1E). Nevertheless, these results cannot predict if hydrolysis kinetics is dependent on the bound anomeric form. To emphasize this point, we found that fructose-6-phosphate (β-F6P) was predicted by FEP analysis to display a similar binding ΔG as α-G6P, albeit with a higher association energy barrier (Fig. S2), even though G6PC1 catalytic efficiency is at least 10-fold lower for F6P (39).
The in silico mutagenesis, permitting both side-chain interaction energy analysis and ΔΔG predictions, confirms the anticipated contribution of conserved active-site residues in substrate coordination, but also suggests multiple modes of inhibition that are not necessarily mutually exclusive. For instance, the charge reversal variant E110K increases the binding energy with G6P, which indicates that this variant likely traps the substrate within the positively charged active site. Moreover, this observation implies that the native Glu participates in Pi release. This could be achieved mechanistically through the dynamics of salt-bridge formation and rupture between E110, R170, and R83 over the course of a catalytic cycle, perhaps operating as a modulator of active-site polarity to trigger product release. Indeed, we observed a complete loss of salt bridge potential (within 4 Å) for the K110 variant (Fig. S6). In turn, the R170Q mutation would be expected to compromise salt bridge formation in addition to losing electrostatic interactions with the substrate (Fig. 3).
Interestingly, the protein stability predictor ΔΔG suggests divergent effects of E110K and R170Q on ΔGunfolding (Table 1). In concert with the predictions, the destabilizing E110K variant displays highly attenuated expression of folded protein, whereas the stabilizing R170Q reports similar expression as WT. For most variants, a general pattern emerged in which predicted destabilizing substitutions caused either reduced expression or misfolding, while neutral or stabilizing substitutions retained WT-like expression profiles. However, this pattern was not explicitly predictive of expression levels with respect to the value of ΔΔG, nor could ΔΔG be assigned as a predictor for activity. For example, while K76N is expected to be moderately destabilizing (+1.3–2.8 kcal/mol), the variant is nonfunctional due to impaired G6P binding (Fig. 3) combined with induced structural distortions (Fig. 5) despite WT-like expression levels. On the other hand, D38V is predicted to be similarly destabilizing (+2.5–3.7 kcal/mol), and expression is reduced markedly, but it retains a fractional yet significant level of activity relative to WT. Thus, we find that the protein stability predictor ΔΔG is limited in its interpretive power without additional supporting methodological approaches.
The collective body of work highlights the complexity for which missense mutations found in the active site of G6PC1 conspire to sabotage function via multiple mechanisms. These mechanisms may be at the origin of altered protein biosynthesis and intracellular localization patterns observed for selected G6PC1 variants (72), including some investigated here. In few cases, the primary means of mechanistic disruption is straightforward, such as R83H and P113L that induce thermodynamic instability (+ΔΔG) manifesting as gross misfolding. A confluence of factors mediates impaired catalysis for most active-site variants, requiring integration of in silico predictions with robust experimental protocols to develop mechanistic models. While thermodynamic stability contributes to expression patterns, altered energy barriers to G6P binding or access to functional intermediates along the reaction coordinate (ΔG°) generate catalytically trapped states, which may be reflected in changes to backbone fluctuations or induced structural distortions. In contrast, Q14R and E319K, variants of uncertain clinical significance, possess a benign phenotype in our assays and so would not be expected to confer disease. Since the variants explored here are but a small subset of the 78 known GSD type 1a missense mutations in G6PC1, this study supports further characterization of the full complement of variants using the AF2 structural model as a tractable template.
Materials and methods
Modeling of Apo G6PC1 in a simulated ER membrane bilayer
The structural model of mouse G6PC1 (Uniprot P35576) was acquired from the publicly available AF2 database (https://alphafold.ebi.ac.uk/). The initial equilibrium simulation was set up using the CHARMM-GUI web server (73). An approximate ER lipid bilayer composition was chosen consisting of 55% 1-palmitoyl-2-oleoyl-glycero-3-phosphocholine (POPC), 20% 1-palmitoyl-2-oleoyl-sn-glycero-3-phosphoethanolamine (POPE), 10% 1-palmitoyl-2-oleoyl-sn-glycero-3-phosphoinositol (POPI), 5% 1-palmitoyl-2-oleoyl-sn-glycero-3-phospho-L-serine (POPS), 5% cholesterol, and 5% sphingomyelin for both membrane leaflets. The position of G6PC1 relative to the bilayer was computed using the Orientation of Proteins in Membranes server (OPM) performed through CHARMM-GUI to ensure proper placement (74, 75). The pKa of titratable residues was calculated by PropKa3.1. H119 was protonated (HSP) as predicted by its catalytic role as a proton donor in the reaction mechanism. All other histidine residues were assigned neutral (HSD).
The model was relaxed from its initial state over a series of equilibration steps with decreasing restraints using NAMD2 and the CHARMM36 force field (54, 76). First, a 10,000-step minimization was performed after which a slow heating protocol of increasing the system temperature by 25 K every 10 ps until 310 K was reached. During heating and the first 2.5 ns of equilibration, there was a 1 kcal/mol/Å2 harmonic restraint placed on lipid head group and protein backbone atoms to allow the lipid tails to melt. This was followed by 2.5 ns of simulation with a 1 kcal/mol/Å2 restraint only on the protein backbone, and a final 2.5 ns of simulation with a 0.5 kcal/mol/Å2 restraint on protein alpha carbons. Five nanoseconds of unrestrained equilibration were then performed to allow for switching to constant pressure simulation (NPT ensemble) and subsequent relaxation of the system.
Simulation replicas were generated after equilibration using the Membrane Mixer tool in VMD in order to sufficiently sample the initial lipid configuration (77, 78). Production MD runs were carried out using NAMD3 with a time step of 2 fs and a long-range interaction cutoff of 14 Å (55). In production runs, each replica was simulated for 100 ns resulting in a cumulative total of 300 ns of trajectory data.
In silico mutagenesis and thermodynamic predictions
ΔΔG calculations were performed to predict the thermodynamic effects of missense variants using Rosetta following the method described in Ref. (49). Briefly, the model was oriented in an implicit membrane environment by aligning it to the OmpLA structure provided in $ROSETTA/main/demos/public/mp_ddg/inputs/1qd6_tr_C.pdb using UCSF Chimera 1.16 (79). The spanfile was generated using the consensus server at TOPCONS.net (80) and edited to optimally specify the membrane-spanning helices. The structure was relaxed into Rosetta’s franklin2019 score function using 1,000 independent runs of the rosetta_scripts executable version 2020.37.61417 with the membrane_relax.xml protocol. The lowest scoring relaxed decoy was then used as the input for the predict_ddG.py script with a repack radius of 8.0 Å. The predict_ddG.py script was adjusted to run under pyrosetta-2021.49 release r305 (Python 3.8.12, Conda version 5.0.1) inside a Slurm array of 357 jobs on Vanderbilt's ACCRE cluster to assess all 20 possible mutations at each position in the protein. The ΔΔG values of disease-associated variants were compiled from the output files using GNU Awk 4.0.2, mapped onto the structural model using Pymol 2.5.4 (81) (Fig. S4) and reported in Table 1. The error associated with these predictions is expected to be within 1 kcal/mol on average (50, 52, 82). Therefore, any value >2 kcal/mol was considered destabilizing, whereas any value <−2 kcal/mol was considered stabilizing.
Preliminary docking of G6P
Crystal structures of bacterial PAP2 type lipid phosphatases (PDB 6EBU, 6FMX, and 5JKI) and vanadium-containing chloroperoxidase (PDB 1IDQ) were aligned with the AF2 G6PC1 model using the catalytic Arg, His, and Lys side chains from the signature phosphatase sequence motif. In MATLAB (MathWorks), the moiety of the α-G6P and β-G6P anomers (also obtained from crystal structures) was transformed onto the atomic coordinates of the quaternary ions of , , and from the aligned structures yielding 95 potential configurations of G6P. Any G6P model within 1.2 Å of the AF2 model, whether in side chains or backbone atoms, was discarded to prevent van der Waals clashes. From the remaining G6P models, two were chosen as representative α-G6P and β-G6P for further MD simulations.
Equilibrium simulations with docked G6P
For the apo simulations, a similar equilibration protocol was followed. Parameters for G6P were obtained from phosphorylated sugar parameters in the CHARMM36 force field. G6P was free to sample various conformations (boat, chair, skew, etc.) throughout the simulations. The same initial lipid configuration as in the apo replicas was used to seed the docked simulations, and each was simulated for 250 ns of production MD for each G6P anomer.
From the initial WT state, nine mutants were also generated (Table 1) using the Mutagenesis tool in VMD. In each mutant state, the system charge was adjusted accordingly by reionization to ensure a net charge of 0. Each replica was equilibrated as above for the WT systems and simulated for 250 ns resulting in a cumulative total of 15 µs of trajectory data.
All computational analysis was performed using in-house TCL scripts, the MDAnalysis python package or tools that are built into VMD. This includes SASA calculations via the SASA tool (77, 83).
FEP calculations
FEP was performed using a representative model for either G6P anomer. In each system, the substrate molecule was duplicated and placed >25 Å away from the protein in the bulk solvent. The resulting system was re-minimized and then equilibrated for 30 ns. The protein backbone atoms as well as the G6P phosphorus atom were restrained throughout the simulation with a force constant of 1 kcal/mol/Å2 to allow for side-chain rearrangement and substrate internal sampling to still occur. Each FEP protocol consisted of 50 windows of lambda values ranging between 0 and 1 with increments of 0.02. Each window was simulated for 1 ns, resulting in a total of 50 ns per FEP set in each direction.
Free energies were extracted from the trajectories using the Analyze FEP plugin in VMD. Gram-Charlier expansion was set to 0 and the Bennet acceptance ratio estimator was used to compute error. Forward and backward paths were plotted to ensure the convergence of the simulation set. Relative binding free energy was then calculated and reported.
Screening G6PC1 expression and activity in vitro
Measurements of expression and G6P hydrolysis following transfection of adherent HEK293SG cells (N-acetylglucosaminyl-transferase I-negative; ATCC CRL-3022) followed the previously published methods (39). Briefly, WT mouse DNA (accession number NM_008061) was cloned into the pJPA5 MOD expression vector. EGFP was fused to the C-terminus of G6PC1 with a linker that included a thrombin protease recognition sequence. Mutations were introduced via site-directed mutagenesis using complementary oligonucleotide primers, and DNA sequencing confirmed the presence of the desired mutation and the absence of unwanted changes. Adherent semiconfluent HEK293SG cells cultured in DMEM:F12 medium supplemented with 10% fetal bovine serum were transfected in 6-well plates with 2 μg/well of plasmid DNA complexed with Lipofectamine 2000 reagent (Invitrogen). The cells were incubated for 48 h at 37 °C under 7% CO2. Expression was confirmed by visualizing cell epifluorescence on a Zeiss Axio Zoom.V16 fluorescence stereo microscope. Epifluorescence intensity was quantified for mock (H2O), WT, and variants across multiple independent transfection experiments (n = 3–7) using the ImageJ application (84) running the StarDist plugin.
Following harvest, the cells were solubilized in 300 μL buffer containing 50 mM Tris-HCl pH 8.0, 150 mM NaCl, 1 mM EDTA, 5 mM (0.5% w/v) LMNG, and 5 mM PMSF. Insoluble material was removed by ultracentrifugation at 105,000 rcf for 20 min. Supernatant containing solubilized G6PC1-EGFP was injected onto a Superose6 Increase 10/300 GL column equilibrated in 50 mM Tris-HCl pH 8.0, 150 mM NaCl, 1 mM EDTA, and 0.01% (w/v) LMNG buffer. The column was attached to an Agilent 1260 Infinity II chromatography system equipped with a fluorescence detector and a temperature-controlled multisampler. Sample elution profiles monitored EGFP fluorescence (Ex 475 nm, Em 515 nm). The enzyme concentration was estimated by integration of the elution peak obtained from 15 to 17 mL and normalized to the WT for each transfection experiment (n = 4–9). Variability in the calculated expression level (Fig. 4) was a function of transfection efficiency compounded with detergent solubilization efficiency for each experimental iteration. One-way ANOVA and the Tukey test were used to assess statistical variation in the mean epifluorescence and FSEC peak area datasets at the 0.05 level (Table S1).
Phosphohydrolase activity was measured by diluting 20 μL of LMNG-solubilized enzyme into a final volume of 150 μL 50 mM Tris/Mes pH 6.5, 50 mM NaCl, 0.2 mM LMNG in the presence or absence of 1.5 mM G6P, and mixed on ice. The reaction was transferred to a 30 °C water bath for 5 min to stimulate G6P hydrolysis. The reaction was quenched with 150 μL of 12% (w/v) SDS and vortexed. The amount of Pi released was determined from a colorimetric assay relative to a Pi standard curve, as previously described. Absolute Pi released was normalized to the enzyme concentration determined from the FSEC peak area and then scaled relative to the WT. Reactions were performed in triplicate per biological repeat (n = 4–9), and the means were subjected to ANOVA and Tukey tests (Table S1).
Measurement of G6Pase activity in situ
G6Pase activity was measured in situ, as previously described (57). Briefly, semi-confluent 832/13 cells in 3.5 cm diameter dishes were cotransfected with 2 μg of a G6pc1-firefly luciferase fusion gene construct, 0.5 μg of SV40-Renilla luciferase (Promega, Madison, WI, USA) and 1 μg of an expression vector encoding WT or mutated G6PC1-EGFP, using the lipofectamine reagent (Invitrogen, Waltham, MA, USA). Following transfection, cells were incubated for 18–20 h in serum-free medium supplemented with 2 or 30 mM glucose. Cells were then harvested using passive lysis buffer (Promega) and both firefly and Renilla luciferase activity were assayed using the Dual Luciferase Assay kit (Promega). To correct for variations in transfection efficiency, the results were calculated as a ratio of firefly activity to protein concentration in the cell lysate. The four G6PC1 constructs (WT, Q14R, K76N, and H119L) were measured in duplicate with n = 3 independent biological replicates. The means were subjected to ANOVA and Tukey tests (Table S1).
Expression and purification of G6PC1 from Sf9 insect cells
Heterologous expression and purification of Q14R and D38V followed the previously published protocols with minor adjustments (39). Briefly, G6PC1 in the pFastBac1 vector was expressed as an EGFP fusion that contains a C-terminal His8 tag via baculovirus transduction of Sf9 insect cells for 72 h at 27 °C. Isolated membranes were solubilized with 5 mM (0.5% w/v) LMNG in 50 mM Tris pH 8, 100 mM NaCl, 10% (v/v) glycerol buffer for 1 h on ice. Insoluble material was removed by ultracentrifugation at 185,000 rcf for 50 min. The supernatant was filtered through a 0.45-μm syringe filter and mixed with Ni2+-NTA Superflow (Qiagen) equilibrated in the same buffer supplemented with 25 mM imidazole for 4 h at 4 °C with gentle shaking. The resin was washed with 10 column volumes of buffer containing 100 mM imidazole followed by elution of G6PC1-EGFP with 300 mM imidazole buffer. EGFP was cleaved via thrombin digestion (0.04 NIH units/μg of fusion protein) at 15 °C for 16 h. EGFP and thrombin were removed from G6PC1 by gel filtration through a Superose6 Increase 10/300 GL column equilibrated with 50 mM Tris pH 7.5, 150 mM NaCl, 0.2 mM LMNG. Enzyme concentration was determined from absorbance at 280 nm assuming a 90,340 per M/cm molar extinction coefficient calculated from the protein sequence. Sample purity was assessed by SDS–PAGE using a 13% acrylamide gel.
Measurement of G6P hydrolysis and thermostability with purified G6PC1 variants
The Pi release rate was determined from the titration of 0.1 μg (2.4 pmol) G6PC1 with G6P at 30 °C for 1 min at pH 6.5, as previously described (39). A linear [G6P]-dependent curve collected on ice was subtracted from the reaction carried out at 30 °C. Catalytic parameters were determined from fits of the saturation curve assuming a Michaelis–Menten model in the program Origin (OriginLab). The reported mean values and SDs of KM and Vmax were derived from the analysis of duplicate hydrolysis curves acquired from two independent enzyme preparations for each variant.
The thermostability of each variant was described by the temperature-dependent, irreversible depletion of soluble enzyme as observed by FSEC (39, 59). Purified Q14R or D38V (0.1 mg/mL) was transferred to standard PCR tubes and incubated in a thermocycler at defined temperatures for 10 min intervals. Precipitated material was removed by ultracentrifugation at 105,000 rcf, and the supernatant was injected on a Superose6 Increase 10/300 GL column equilibrated in 50 mM Tris pH 7.5, 150 mM NaCl, 0.2 mM LMNG buffer. Enzyme elution was monitored by fluorescence (Ex 280 nm, Em 320 nm). Peak area, representing the remaining soluble population, was plotted as a function of increasing temperature and the data fit with a dose–response curve in the program Origin to quantify the melting temperature (TM).
Acknowledgments
The authors thank Mr Michael Mohan for assistance with baculovirus production and protein expression and Dr Chris Newgard for providing the 832/13 cell line. The authors also thank Dr Hassane Mchaourab and Dr Benjamin Brown for helpful discussions and a critical reading of the manuscript.
Supplementary Material
Supplementary material is available at PNAS Nexus online.
Funding
This work was supported by the National Institutes of Health grants P41-GM104601 and R24-GM145965 (M.S. and E.T.) and R01-DK132259 (R.O’B.), the Vanderbilt Molecular Endocrinology Training program 5T32-DK07563 (E.M.H.), the American Heart Association 23PRE1017904 (E.M.H.), the Juvenile Diabetes Research Foundation 1-INO-2022-1121-A-N, Vanderbilt University's Program in the Molecular Basis of Genetic Diseases and unrestricted funds to D.P.C. The authors acknowledge computing resources provided by eXtreme Science and Engineering Discovery Environment (XSEDE) (grant MCA06N060 to E.T.).
Author Contributions
M.S. and D.P.C.: designed and performed the research, analyzed the data, and wrote the paper. R.A.S., J.H.S., and E.M.H.: performed the research and analyzed the data. R.M.O.: designed the research. E.T.: designed the research and wrote the paper.
Preprints
This manuscript was posted as a preprint: https://doi.org/10.1101/2023.03.13.532485.
Data Availability
Models of G6PC1 with and without bound G6P are available in ModelArchive (modelarchive.org) with password accession code “STJHKxKmlc” at this link: https://nam04.safelinks.protection.outlook.com/?url=https%3A%2F%2Fwww.modelarchive.org%2Fdoi%2F10.5452%2Fma-i4kqi&data=05%7C01%7Cderek.p.claxton%40vanderbilt.edu%7C0b0c471667274271177208dba85d6959%7Cba5a7f39e3be4ab3b45067fa80faecad%7C0%7C0%7C638288891417753954%7CUnknown%7CTWFpbGZsb3d8eyJWIjoiMC4wLjAwMDAiLCJQIjoiV2luMzIiLCJBTiI6Ik1haWwiLCJXVCI6Mn0%3D%7C3000%7C%7C%7C&sdata=Prc5D0Odm5BcZbEWqsGgush2YAetdyLZOEd82yKGNNc%3D&reserved=0”.
References
Author notes
Competing Interest: The authors declare no competing interest.