


Abstract
Microbial interactions impact the functioning of both natural and engineered systems, yet our ability to directly monitor these highly dynamic and spatially resolved interactions in living cells is very limited. Here, we developed a synergistic approach coupling single-cell Raman microspectroscopy with 15N2 and 13CO2 stable isotope probing in a microfluidic culture system (RMCS-SIP) for live tracking of the occurrence, rate, and physiological shift of metabolic interactions in active microbial assemblages. Quantitative and robust Raman biomarkers specific for N2 and CO2 fixation in both model and bloom-forming diazotrophic cyanobacteria were established and cross-validated. By designing a prototype microfluidic chip allowing simultaneous microbial cultivation and single-cell Raman acquisition, we achieved temporal tracking of both intercellular (between heterocyst and vegetative cells of cyanobacteria) and interspecies N and C metabolite exchange (from diazotroph to heterotroph). Moreover, single-cell N and C fixation and bidirectional transfer rate in living cells were quantified via SIP-induced characteristic Raman shifts. Remarkably, RMCS captured physiological responses of metabolically active cells to nutrient stimuli through comprehensive metabolic profiling, providing multimodal information on the evolution of microbial interactions and functions under fluctuating conditions. This noninvasive RMCS-SIP is an advantageous approach for live-cell imaging and represents an important advancement in the single-cell microbiology field. This platform can be extended for real-time tracking of a wide range of microbial interactions with single-cell resolution and advances the understanding and manipulation of microbial interactions for societal benefit.
Microbial interactions have profound effects on diverse ecosystem functions, yet real-time monitoring of these dynamic and intimate processes at the single-cell level is not conceivable. Here, by developing a synergistic approach coupling single-cell Raman microscopy with 15N2 and 13CO2 tracers and a neat design of Raman microfluidic culture chip, we advanced the single-cell microbiology field in live tracking and imaging metabolic interactions within and between living N2/CO2-fixing autotrophs and heterotrophs. We were able to quantify single-cell N2 and CO2 fixation and transfer rates, while simultaneously tracking cell-specific physiological responses to environmental stimuli. We anticipate that this method will advance our understanding and harnessing of microbial interactions for societal benefits such as mitigating algal bloom and climate change.
Introduction
Microbial interactions are ubiquitous in nature and have profound effects on the structure and function of microbial communities, biogeochemical cycles, and even impact global phenomena, like climate change (1–4). Different forms of microbial interactions have been documented in the environment, such as diazotroph–nondiazotroph (5, 6), phototroph–heterotroph (7), and bacteria–host (8). Metabolite exchange and the resultant element transfer are crucial for microbial interactions (4). They not only enable microbes to optimize the use of scarce nutrients and to keep microbial guilds in nutrient and energetic equilibrium but also act as fundamental drivers of global element cycling (2, 4). Metabolic interactions and the associated element fluxes are complex and dynamic processes that occur at the single-cell level and develop along various extrinsic factors, such as nutrients (9), light (10, 11), temperature (12, 13), and pH (ocean acidification) (14). To resolve such intimate and dynamic microbial interactions, it is necessary to track the metabolite exchange and physiological responses within and among living cells with single-cell resolution. Yet, our ability to monitor these processes non-destructively and quantitatively with high microscale resolution is very limited.
Currently, the only method competent to trace element fluxes and resolve metabolic interactions at the single-cell level is nanoscale secondary ion mass spectrometry coupled with stable isotope probing (NanoSIMS-SIP) (3, 5, 9, 15–17). NanoSIMS-SIP offers a snapshot of the metabolic processes taking place at a certain time with very high spatial and mass resolution. It has given important insights into trophic interactions and element (C, N, and S) fluxes in various microbial communities (3, 5, 9, 15–17). However, the analytical conditions of ultrahigh vacuum and the destructive nature of NanoSIMS do not allow the monitoring of living cells in real-time. A further challenge for NanoSIMS is to simultaneously resolve the rapid changes of cells physiology in response to external stimuli, which normally require retrieving comprehensive information of molecular events. Transcriptomics and proteomics allow a comprehensive analysis of cellular responses and give insights into the mechanism and biochemical pathway underlining microbial interactions (3, 18, 19). However, the bulk measurements of the total microbial population can average out the cell-to-cell variance which is the key strategy for microbes to adapt to fluctuating environments. Moreover, transcriptomics and proteomics depend on highly expressed genes and proteins and may overlook subtle metabolic and physiological changes.
Raman spectroscopy is a promising noninvasive technique for studying the metabolic and physiological state of living microbes at the single-cell level (20–23). Raman spectra of a microbial cell provide its intrinsic biochemical fingerprints, including nucleic acids, lipids, proteins, metabolites, and pigments, which are highly sensitive to cellular composition and physiological states under varying conditions (20–23). Raman spectroscopy is also flexible to integrate with stable isotope labelings such as 13C, 15N, and 2D (20, 24–29). Characteristic SIP-induced Raman shifts can be measured to quantify the metabolic assimilation of isotope-labeled substrates, thereby providing a way to reveal the associated microbial functions and activities. However, Raman-based techniques reported to date are not ready for tracking dynamic metabolic interactions and physiological states of living cells. Such developments require the exploration of SIP-specific Raman biomarkers (which are still scarce compared with the large diversity of microbial functions) and the design of devices suitable for both live-cell culturing and Raman monitoring.
Here we developed a synergistic approach combining single-cell Raman microspectroscopy analysis with 15N and 13C SIP in a microfluidic culture system (RMCS-SIP) to live track metabolic interactions at both intercellular and interspecies levels. We first tested the approach with diazotrophic cyanobacteria capable of both N2 and CO2 fixation. Cyanobacteria were chosen due to their significant contributions to biogeochemical cycling, extensive interactions with other organisms, and ability to function in both local and global ecosystems (11, 15, 16, 30–33). In addition, N2- and CO2-fixing cyanobacteria offer a useful system to follow the transfer of both nitrogen and carbon-based nutrients simultaneously. Some CO2-fixing vegetative cells (Vegs) in cyanobacteria differentiate into N2-fixing heterocyst cells (Hets) under N-deficient conditions (34, 35). Hets and Vegs are spatially separated and functionally interdependent by exchanging N and C metabolites like amino acids and sugars. Here we used the Hets–Vegs and diazotrophs–heterotrophs interactions as model systems to investigate intercellular and interspecies interactions frequently found in nature, respectively. Quantitative and robust Raman-15N and 13C biomarkers specific for N2 and CO2 fixation were established and strictly validated. Using RMCS-SIP, we achieved a quantitative and time-resolved tracking of element fluxes and physiological changes within individual living cells. Moreover, interspecies element transfer between diazotrophs and heterotrophs was also temporally resolved. We recognize that this approach to resolving functional microbial interactions in real-time at single-cell precision could result in significant advances in disciplines including microbial ecology and ecophysiology.
Results
Raman spectra of heterocysts and vegetative cells in N2-fixing cyanobacteria
Here, two heterocyst-bearing cyanobacteria, i.e. Anabaena sp. PCC 7120 and bloom-forming Raphidiopsis raciborskii XM1, were examined (33). These strains are morphologically distinct, with Anabaena sp. cells being more ellipsoidal while R. raciborskii is more columnar (Fig. 1A and C). Both contained Hets (red arrow) that were morphologically larger than Vegs (blue arrow). Single-cell Raman spectra from both Hets and Vegs cell types were acquired. When excited with visible lasers at 532 or 633 nm, strong fluorescence originating from photosynthetic pigments (e.g. chlorophyll, cyanophycin, scytonemin) (36–41) almost completely masked the Raman signal. Only slight carotenoid bands appeared due to the resonance Raman enhancement at 532 nm (Fig. S1A). The fluorescence was substantially reduced when a near-infrared 785 nm laser was used. High-quality Raman spectra containing more bands other than carotenoids were obtained from both individual Hets and Vegs cell types (Fig. 1B and D). These bands were mainly assigned to pigments including phycobilin, chlorophyll, and carotenoids (Table S1) (36–40). Notably, Hets and Vegs in both N2-fixing cyanobacteria displayed prominent spectral differences with the two peaks at 668 cm−1 and 1,637 cm−1 (phycobilin) (36, 37, 40) in Vegs being much stronger than those in Hets (Fig. 1B and D), indicating a lower amount of photosynthetic pigments in Hets. This observation is consistent with previous work using a 967-nm laser for excitation (36). Considering that Hets are differentiated from Vegs under N-depletion conditions, these two Raman peaks can be selected as an internal biomarker for monitoring the differentiation process.
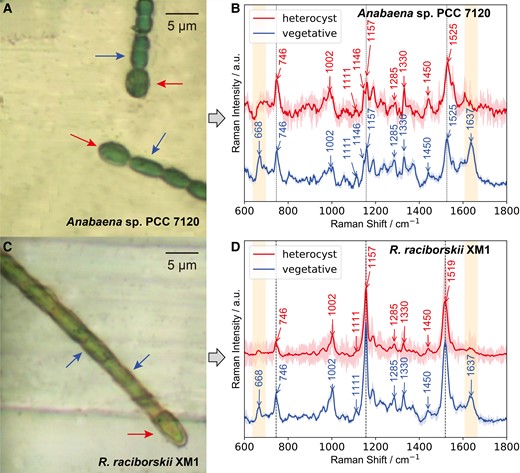
Morphology and single-cell Raman spectra of two diazotrophic cyanobacteria. (A, C) Microscopic images of Anabaena sp. PCC 7120 and Raphidiopsis raciborskii XM1. The arrows at the end of cyanobacterial filament show representative heterocysts, and the arrows next to the end show vegetative cells. (B, D) Single-cell Raman spectra of heterocysts and vegetative cells in Anabaena sp. PCC 7120 and R. raciborskii XM1 excited by a 785-nm laser. Mean spectra together with the respective standard deviations as coronas are shown.
Quantitative identification of Raman-SIP biomarkers for N2 and CO2 fixation
Currently, there are no available Raman biomarkers associated with N2 fixation in diazotrophic cyanobacteria, hindering the study of intercellular N and C exchange by this approach. To identify key Raman biomarkers, Anabaena sp. and R. raciborskii were cultured in an N-free medium supplemented with increasing concentrations of 15N2 from natural abundance 0.36 at% to ∼99.36 at% 15N. From the mean Raman spectra of ∼20 randomly selected single cells, it was interesting to observe that the bands at 1,111, 1,146, and 1,285 cm−1 in 0.36% 15N shifted to 1,103, 1,133, and 1,280 cm−1 in 99.36% 15N, respectively (Fig. 2A and B). The same 15N-associated shifts were observed in both cyanobacteria species (Fig. 2B). These shifts were identical to those in cyanobacteria cultured with bioavailable 15NO3− (Fig. S2B and C) and were all assigned to N-related C–N vibrations (Table S1), thus indicating that the synthesis of identical 15N-biocomponents following 15N2 fixation and 15NO3− assimilation. These findings demonstrated that 15N2 fixation and incorporation in newly synthesized biomolecules accounted for the 15N-induced changes. In contrast, such shifts were not observed in Raman bands wherein N was absent, such as the strong C–C stretching band at 1,157 cm−1 from carotenoids (Fig. 2A, B, and Fig. S2) (38). Hence, these 15N2-induced Raman changes were selected as robust biomarkers for N2 fixation in cyanobacteria.
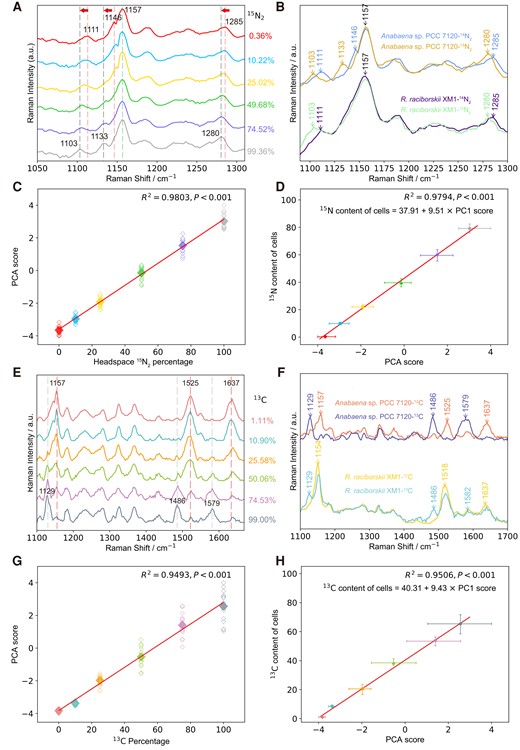
15N2 and 13CO2 fixation by cyanobacteria as measured by Raman and isotope ratio mass spectrometry. (A) Single-cell Raman spectra of Anabaena sp. PCC 7120 incubated with 15N2 at various headspace percentages. (B) A comparison of single-cell Raman spectra of Anabaena sp. PCC 7120 and R. raciborskii XM1 incubated in the air (14N2) and 15N2 of 99.36%, respectively. (C) The linear correlation between 15N2 percentages in the headspace and PCA scores derived from 15N-induced spectral variations of Anabaena sp. PCC 7120. Each point is from a single-cell, and ∼20 cells were measured. A significant difference was observed between 0.36 and 10.22% of 15N2 in the headspace (P < 0.001, t-test). (D) The linear correlation between PCA scores and bulk 15N contents of Anabaena sp. PCC 7120 measured via isotope ratio mass spectrometry. (E) Single-cell Raman spectra of Anabaena sp. PCC 7120 incubated in 13C-NaHCO3-amended media. (F) A comparison of single-cell Raman spectra of Anabaena sp. PCC 7120 and R. raciborskii XM1 incubated in 12C-NaHCO3 and 13C-NaHCO3 at 99.36%. (G) The linear correlation between 13C-NaHCO3 percentages in the incubation medium and PCA scores derived from 13C-induced spectral variations of Anabaena sp. PCC 7120. Each point is from a single-cell. A significant difference was observed between 1.11 and 10.90% of 13C in the medium (P < 0.001, t-test). (H) The linear correlation between PCA scores and bulk 13C contents of Anabaena sp. PCC 7120 was measured via isotope ratio mass spectroscopy.
To determine whether these shifts can be used to quantify the N2-fixing activity, we conducted a validation process. First, principal component analysis (PCA) was employed to discern and quantify subtle spectral variations by avoiding deconvolution errors due to the overlap of 15N-assoicated bands with neighboring bands. PCA scores accounting for 15N-induced spectral variations displayed a linear relationship with the amount of 15N2 supplied to both Anabaena sp. (R2 = 0.9803) (Fig. 2C) and R. raciborskii (R2 = 0.9103) (Fig. S3B). Meanwhile, bulk analysis via isotope ratio mass spectrometry (IRMS) was employed to assess the reliability of Raman biomarkers in quantifying 15N abundance in cells. IRMS results showed increasing 15N abundance of 0.37, 9.91, 22.06, 39.66, 59.62, and 79.19% with increasing 15N2 incubations concentrations in Anabaena sp. (Fig. 2D). Remarkably, the 15N abundance quantified by IRMS correlated linearly with the PCA scores representing 15N-induced Raman spectral changes (R2 = 0.9794) (Fig. 2D), clearly illustrating a larger spectral change at a higher intracellular 15N abundance. As such, these 15N-induced Raman changes can not only act as robust biomarkers for 15N2 fixation but also be used to quantify the fixation activity/rate of cyanobacteria.
Both carbon and nitrogen fixation are the primary processes by which photoautotrophic cyanobacteria assure its C and N demands and fuel metabolic interactions with other species. To identify Raman biomarkers for CO2 fixation, cyanobacteria were cultured with 13C-NaHCO3 as the sole carbon source. For both cyanobacteria strains, prominent 13CO2-induced band changes were observed, including 1,157 to 1,129 cm−1 (C–C stretching of carotenoids) (38), 1,525 to 1,486 cm−1 (C=C stretching of carotenoid) (38), and 1,637 to 1,579 cm−1 (C=C stretching of phycobilin) (Fig. 2E and F) (36, 40). Consecutive shifts along with an increase in 13C from 1.11% (natural abundance) to 99.00% were obvious (Fig. 2E). All of these vibrations were C related, confirming that 13CO2 fixation induced the shifts. The spectral PCA scores of Anabaena sp. increased linearly with the 13C percentages in medium (R2 = 0.9493) (Fig. 2G) and correlated well with the 13C enrichment in N2-fixing cyanobacteria measured by IRMS (R2 = 0.9506) (Fig. 2H), demonstrating that these shifts can quantify CO2 fixation.
To determine the detection limit of 15N and 13C, the threshold of PCA scores that can consider a cell labeled was calculated based on the mean + 3 standard deviation of PCA scores from natural abundance cells following previous reports (28, 42). The corresponding threshold PCA scores were then used to determine the Raman detection limit based on the linear relationship between PCA scores and isotope contents (Fig. 2D and H). The detection limit was determined as 9% for 15N and 7% for 13C enrichment in cells, respectively.
Construction of the microfluidic culture system
An RMCS was designed to enable cell cultivation, microscopic observation, and in situ Raman measurements simultaneously in one chip (Fig. 3). Several strategies were adopted to construct RMCS as polydimethylsiloxane (PDMS) and glass that are typically used to fabricate microfluidic chips can produce strong Raman/fluorescence signals and interfere or even mask Raman of microbes. As shown in Fig. 3A–C, firstly, quartz (white) with a low Raman background was used as the bottom substrate to bind PDMS (yellow). Secondly, channels (green) were specially designed and fabricated on PDMS for cells and medium to flow in and out. The height of channels from the surface of the quartz to the bottom of PDMS was 100 μm after proving that this height would allow a neglectable Raman signal of PDMS to be excited by the laser focusing on the quartz below (Fig. S4). The shapes of the channels at the inlet and outlet were designed differently. A narrow neck structure (50 μm wide) was fabricated as an outlet, to allow medium to flow out while holding cells in. The inlet was 500 μm wide and allowed the overflow of surplus cells during cultivation. Fig. 3D–F shows the RMCS mounted on a Raman microscopic stage and the microscopic image of cyanobacteria cultured inside. With this RMCS, living cells can be observed and measured by singe-cell Raman spectroscopy, and culture media amended with 13C-NaHCO3, 15N2 or nitrate can be flexibly changed.

Microfluidic culture system used for Raman measurement of living cyanobacteria. (A) Three-dimensional structure, (B) cross-section, and (C) top view of the system. The microfluidic part is made of PDMS which is bonded to a quartz slide to form an enclosed device. (D) A photograph of RMCS mounted on a microscopic stage for in situ Raman measurement of living cells. Microphotographs of an Anabaena sp. PCC 7120 colony (E) and two filaments (F) culturing in the chamber of the microfluidic chip. Heterocysts (top two and bottom one arrows) and vegetative cells (middle two arrows) can be clearly distinguished by their morphology.
Live imaging N and C fluxes in cyanobacteria and derivation of single-cell-based rate
To track N and C fixation and transfer in and between living cyanobacteria, cells were cultured separately with either 15N2 or 13C-NaHCO3 and measured in RMCS, i.e. 15N and 13C traces were applied in parallel. Four continuously connected cells including one Het and three Vegs from the same filament of Anabaena sp. were subjected to Raman mapping at 0, 48, 72, and 96 h. Based on the linear relationship between cellular 15N and 13C contents and PCA scores representing isotope-induced spectral variations (Fig. 2D and H), both the temporal and spatial dynamics of 15N and 13C enrichments in these individual Hets and Vegs were determined, and visualized by color coding in Raman mapping images (Fig. 4). Single-cell inspection indicated that Vegs and Hets displayed distinct temporal dynamics toward 13C and 15N enrichment. Significant enrichment in 13C was initially detected only in the Vegs, followed by a progressive increase in both Vegs and Het where more newly fixed 13C were allocated to Vegs until a balanced distribution was reached (Fig. 4A and C). This result indicated that Vegs not only performed active CO2 fixation for their use but also transferred newly fixed 13C to the Het. In contrast, 15N fixation and enrichment were detected initially in the Het, followed by observation of elevated levels of 15N in both Het and Vegs, with the Het having a higher 15N level than the three adjacent Vegs (Fig. 4B and D), demonstrating that Hets fixed N2 and actively transferred the newly fixed 15N to Vegs. The observed gradual N and C transfer is due to that Hets and Vegs rely on each other for energy and growth. Hets lack a functional photosystem and thus rely on Vegs to supply the C and energy required for N fixation and exportation. At the same time, Vegs require new N import to maintain their photosynthesis, growth, and differentiation (35). After a 96-h incubation, the 15N or 13C level of the Het and Vegs converged, implying that the newly fixed 15N and 13C reached an even distribution among the four cyanobacterial cells. These findings demonstrated that RMCS-SIP was competent in quantifying N and C fixation and bidirectional transfer within and between individual live cells. Notably, although the three Veg cells were located at different distances from the Het, no obvious 15N gradient was observed at any time point which could be attributed to the rapid transport of N among Vegs to keep pace with the N demand for their growth as formerly proposed (17). In addition to the in situ measurement of these four cells, ex situ Raman measurement of around 20 Vegs and Hets randomly selected from cyanobacterial filaments taken out at different time points was also performed. Similar temporal patterns of N and C fixation and transfer were observed in both Anabaena sp. and R. raciborskii (Fig. S5).
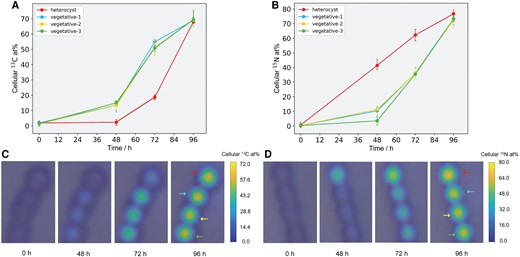
Temporal tracking and imaging of N and C fluxes in four living cyanobacterial cells. Temporal dynamics of PCA-derived 13C (A) and 15N (B) contents in four connected cyanobacterial cells including one heterocyst and three vegetative cells cultured in RMCS. 13C and 15N labeling were applied separately with each containing four cells (a total of eight cells). The corresponding color coding for 13C (C) and 15N (d) contents is based on Raman mapping images. The color bars indicate 13C (C) and 15N (D) isotope enrichment (at%) in the cells and their surroundings.
Because the same living individual cells were measured using RMCS at different time points, single-cell flux rates can be calculated based on the 15N or 13C enrichment over time. The single-cell fixation rates were calculated as the amount of 15N (13C) fixed in the individual Hets (Vegs) over the incubation time (Fig. 4A and B). Because the fixed N released as ammonia was not considered, the net instead of gross fixation rates were determined (16). The single-cell 15N (13C) transfer rates were calculated as the amount of 15N (13C) transferred to Veg (Het) over time (17, 31). All the rate values of fixation and transfer are presented in Table S2. The C fixation started slowly (∼0.30% cell−1 h−1 at 48 h), but increased rapidly from 48 to 72 h (∼1.60% cell−1 h−1), then slowed down (∼0.70% cell−1 h−1) ending with 69.2% 13C net fixation at 96 h. The transfer of 13C to Het was also initiated slowly but kept increasing (2.05% cell−1 h−1 at 96 h) until a balanced 13C enrichment was reached. In contrast, N fixation initiated rapidly (0.86% cell−1 h−1 at 48 h), and the rate was almost constant except for a small drop at 96 h (∼0.56% cell−1 h−1), ending with 76.8% 15N net fixation. The transfer trend of 15N from Het to Veg was similar to that of 13C from Veg to Het, namely, a slow start in the initial 48 h followed by a rapid increase until an even distribution of 15N or 13C was reached among the four cells.
Impact of nutrients on cellular physiology and element fluxes in living cells
We further studied the impact of nutrient additions on cell physiology in living cyanobacterial cells and the related element fluxes. Time wise impact of NO3− on living Hets and Vegs was studied by adding NO3− containing medium into the microfluidic channels. Following NO3− addition, although Hets can still be morphologically distinguished from Vegs (red circles in Fig. 5A), the Raman band at 1,637 cm−1 (assigned to phycobilin) (36, 37, 40) specific to Vegs appeared in Hets at 2 h and increased in intensity with the incubation time (Fig. 5B). At 72 h, Hets were no longer recognized by their morphology, and the intensity of 1,637 cm−1 band became almost the same as those of Vegs (Fig. 5C), indicating Raman-based approach can capture the occurrence of physiological changes much earlier (2 h) than morphological changes (>48 h). Moreover, with nitrate addition, 15N-induced spectral redshifts were shifted back over time in both Hets and Vegs, such as those from 1,103 to 1,111, 1,113 to 1,146, and 1,280 to 1,285 cm−1 (Fig. 5B and C). Accordingly, the cellular 15N at% derived from spectral changes decreased, indicating that 15N in living cells was gradually replaced with 14N due to nitrate assimilation (Fig. 5D). Moreover, contrary to the distinct 15N uptake dynamics in Hets and Vegs (Fig. 4B and D), the 14NO3− assimilation dynamics (Fig. 5D) were very similar in Hets and Vegs with the original Hets being even faster in NO3− substitution. The reason could be that the original Hets required more NO3− to support state transition. Therefore, sensitively tracing cellular physiological changes by Raman provides an important single-cell means to decipher the state and function of living cells under varying conditions.
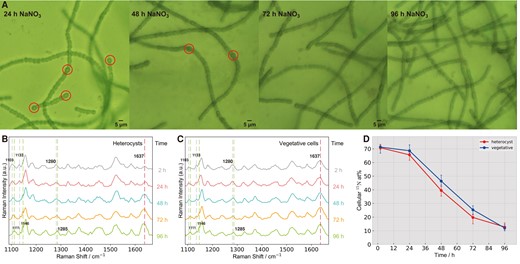
Temporal tracing of cell morphology and physiology shifts impacted by nitrate nutrient. (A) Temporal changes of cell morphologies. The circles outline single cells with heterocyst morphology. Spectral responses of heterocysts (B) and vegetative cells (C), and PCA-derived 15N contents (D) of Anabaena sp. PCC 7120 in RMCS after adding NaNO3 at different times.
From intercellular to interspecies metabolic exchange
To demonstrate the wide applicability of the presented approach, the interspecies metabolic exchange between N2-fixing Azotobacter chroococcum and heterotrophic Escherichia coli was also traced by co-culturing the two species in media using 15N2 as the only N source. Individual A. chroococcum and E. coli can be easily distinguished based on their distinct Raman spectral features and morphologies. Azotobacter chroococcum displayed characteristic resonance Raman bands assigned to cytochrome c at 749, 1,114, 1,312, and 1,589 cm−1 (Fig. S6A), which has essential role in protecting the activity of oxygen-labile nitrogenase (26, 43, 44). These cytochrome c bands were absent in E. coli (Fig. S6B). Following the incubation with 15N2 in the co-culture system, characteristic 15N-induced Raman band shifts were observed in both species (Fig. 6A and B), i.e. 1,129 to 1,114 (C–N vibration of cytochrome c) and 1,245 to 1,232 cm−1 (Amide III) in A. chroococcum, and 1,245 to 1,232 cm−1 (Amide III) and 1,579 to 1,570 cm−1 (ring stretching of guanine and adenine) in E. coli. These 15N-induced shifts were all from chemical bonds containing N and consistent with previous works (24, 26, 27), indicating the uptake and substitution of 14N with 15N. By comparison, when the E. coli were cultured alone in 15N2 without A. chroococcum, no band shifts were observed from those in 14N2 (Fig. S7), indicating the inability of E. coli to utilize 15N2 without A. chroococcum. Additionally, the time-course results indicated that the prominent shift in A. chroococcum happened at 24 h (Fig. 6C), much earlier than E. coli after 72 h (Fig. 6D). Because only A. chroococcum can fix 15N2 but E. coli cannot, these results clearly demonstrated the fixation of 15N2 by A. chroococcum and the following interspecies transfer of 15N from A. chroococcum to E. coli.
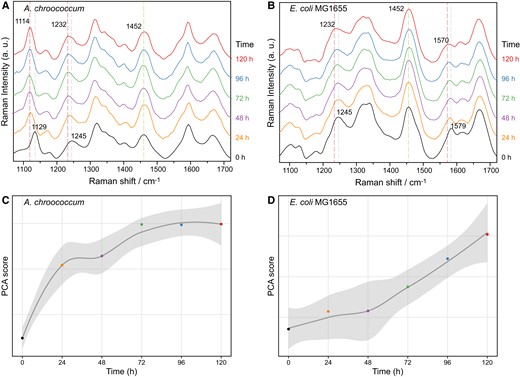
Temporal tracking of interspecies N transfer between A. chroococcum and E. coli. Single-cell Raman spectra of A. chroococcum (A) and E. coli (B) co-cultured in media using 15N2 as the sole nitrogen source with time. Temporal dynamics of PCA scores derived from 15N-induced spectral variation between 1,200 and 1,275 cm−1 in A. chroococcum (C) and E. coli (D). The curve and shadow indicate the mean value and standard deviations of PCA scores from around 50 single cells.
Discussion
Microbial interactions impact the functioning of natural and engineered systems, yet our ability to see these dynamic and highly spatially resolved interactions directly in living cells is extremely limited. Here quantitatively live tracking of N and C fixation and bidirectional transfer at the single-cell level was achieved via RMCS-SIP. This approach is applicable for both intercellular metabolic exchange within the same organism and interspecies metabolic exchange between organisms of different physiologies. At the same time, RMCS-SIP reveals physiological responses to nutrient stimuli through a comprehensive metabolic profiling, providing multimodal information to understand the dynamics of microbial functions and interactions under fluctuating conditions.
Major methodological innovations of RMCS-SIP are the establishment of robust Raman-15N and 13C biomarkers specific to N2 and CO2 fixation and the development of the microfluidic culture chip. Despite the recognized potential of Raman-SIP in revealing microbial functions, available SIP-associated Raman biomarkers have been very limited, particularly for 15N when compared with the more frequently used 13C and 2D. This is because 15N substitution causes a significantly smaller redshift than 13C and 2D (24). Here we showed 15N-induced characteristic Raman shifts of chlorophyll can be used as quantitative markers for N2 fixation in diazotrophic cyanobacteria. These biomarkers were confirmed with distinct cyanobacteria species and validated with IRMS, revealing the relatively common applicability for different diazotrophic cyanobacteria. Together with our previous reports on 15N2-induced cytochrome c band shift for the identification of non-photosynthetic diazotrophic bacteria in the soil such as Rhizobium (26), these identified Raman biomarkers can be used to study the metabolism of different N2-fixing microorganisms and their interactions with other bacteria in artificial or natural ecosystems. Furthermore, the designed microfluidic culture chip enables the simultaneous cultivation of microorganisms and Raman detection of metabolically interconnected living cells with minimal interference from PDMS due to its sufficiently large distance from cells on quartz. RMCS is flexible to couple with other state-of-the-art approaches, like the application of laser tweezer Raman (45, 46), to capture and detect microbial cells that may move rapidly in solution. The design of the microfluidic culture system can be further tailored to accommodate special cultivation demands such as anaerobic, dark, and high-pressure conditions expanding uses for microbial interactions across many habitats. Presently, one limitation of RMCS-SIP is that 15N and 13C labeling cannot be always applied and detected simultaneously, for instance when Raman shifts caused by 13C masked those caused by 15N. This limitation could be resolved by using advanced chemometric or machine-learning methods to recognize subtle spectral changes. Additionally, the bleaching effect induced by a 785-nm laser, especially on photosynthetic bacteria, limits the time points for spatiotemporal Raman imaging. This could be resolved by the future use of a 1,064 nm laser which may minimize bleaching and autofluorescence effects (36). Finally, the sensitivity of Raman in detecting isotopes is lower than that of NanoSIMS. A high enrichment of 15N (>9%) and 13C (>7%) in cells is required, rendering the analysis of slower processes and low-activity microbial cells difficult. This can be partially avoided by using a higher percentage of labeling during incubation and a longer exposure time.
Proof of principle application showed that RCMS-SIP can temporally track both intercellular and interspecies (from autotroph to heterotroph) N and C transfer, and simultaneously determine the single-cell nutrient uptake and transfer rates. Although N and C bidirectional transfer between individual Het and Veg of cyanobacteria is known (17), here the occurrence and rate of this process are determined in living single cells. Microbial interactions based on N2 and CO2 fixation are widespread in nature, including associations of N2− and CO2− fixing microorganisms with bacteria, archaea, algae, protists, and plants, with implications in ecosystem functioning (e.g. induction of recurrent bloom) (11, 16, 32, 47) or nature-based services (e.g. enhanced wastewater treatment and carbon capture) (48, 49). Given the similarities to the system investigated here, we anticipate that RCMS could be used to live track metabolic interactions within such associations and advance our understanding of how complex communities operate and serve to harness microbial interactions for human benefits.
Furthermore, RMCS enabled the measurement of physiological responses of living cells to nutrient stimuli, a feature that can be extended to understand how environmental fluctuations impact metabolic processes. An increase in the phycobilin characteristic band was rapidly detected in Hets following only 2 h of nitrate addition, much earlier than morphological changes at 48 h. Phycobilin is an important pigment for photosynthesis and was previously reported as absent or at a lower level in Hets than in Vegs (50), consistent with the Raman observation (Figs. 1 and 5). The increase in Hets may indicate a physiological and functional shift toward an elevated photosynthetic activity before their morphology changes. It is noteworthy that the ability of Raman in chemically profiling of multiple endogenous molecules plays a key role in capturing such subtle physiological changes in individual cells (22, 23, 51, 52). This is also applicable to many cases wherein cell type and function cannot be readily determined by their morphology as observed in Hets and Vegs here (10, 53). For example, in some cyanobacteria, N- and C-fixation occur in the same cells but are temporarily separated as a function of the diel cycle, without morphological changes (10). Therefore, sensitively tracing of ongoing physiological evolution by Raman provides a useful way to decipher the competitive advantage from a physiological perspective for microbes encountering periodic or episodic environmental alterations, such as nutrients, temperature (climate change), and pH (ocean acidification). The observed rapid response to nitrate addition in physiological states of cyanobacteria indicates their advantage in trophic strategy to acclimate a wide range of nutrients. This may also partly explain the continuous expansion of R. raciborskii toward higher latitudes in past decades (32).
In summary, RMCS-SIP represents an important advancement for single-cell microbiology in both natural and engineered systems. It offers a non-destructive single-cell means for real-time monitoring the occurrence, rate and physiological shifts of metabolic interactions in metabolically active microbial populations. It complements the destructive NanoSIMS-SIP-based chemical imaging approaches, which are currently the only single-cell methods used to quantify element uptake and fluxes within microbial guilds (3, 5, 9, 11, 15–17, 53). We believe this innovative non-destructive technique can be expanded for real-time unraveling a wide range of metabolic interactions in situ. This will advance our understanding and harnessing of microbial interactions for societal benefits like reducing algal bloom and climate change and improving wastewater treatment and crop productivity.
Materials and methods
Bacterial strains, media, and culture conditions
Two types of heterocyst-forming diazotrophic cyanobacteria i.e. Anabaena sp. and R. raciborskii were used in this study. A model strain Anabaena sp. PCC 7120 was obtained from the Freshwater Algae Culture Collection of the Institute of Hydrobiology, China. The bloom-forming cyanobacterium of R. raciborskii XM1 was isolated in a Xiamen reservoir during a summer bloom in 2018 (33). To further confirm the N2 fixation potential of these strains, dinitrogenase reductase genes (nifH) were amplified and visualized on agarose gels. Briefly, extracted cyanobacterial DNAs were polymerase chain reaction amplified with primers nifH1 (5′-TGYGAYCCNAARGCNGA-3′) and nifH2 (5′-ADNGCCATCATYTCNCC-3′). The appearance of nifH at around 359 bp in agarose gel electrophoresis is shown in Fig. S2a. These two cyanobacterial strains were cultured in BG11 or N-free BG11 (BG110) medium at ∼28°C and 90 rpm under constant light condition. They were cultured in BG110 to ensure heterocyst formation before isotope labeling. N2-fixing A. chroococcum (ACCC10096) and E. coli MG1655 were purchased from the Guangdong Culture Collection Center of Microbiology, China, and cultured in N-free azotobacter media and Luria−Bertani broth, respectively before co-culture. All culture medium recipes are provided in Supplementary information.
The chemicals used for stable isotope incubation included 15N-NaNO3 (98 atom% 15N, Sigma−Aldrich, United Kingdom), 13C-NaHCO3 (99 atom%; Cambridge Isotope Laboratories, Inc., UK), and 15N2 (99 atom%; Aladdin, China). Unless otherwise stated, all chemicals were purchased from Sinopharm Chemical Reagent Co., China.
Incubation of N2-fixing cyanobacteria with 15N and 13C stable isotopes
15N2 incubation was performed according to our previous work (26). Briefly, an aliquot of 20 mL of BG110 medium was filled into a 120-mL crimp-top vial and inoculated with 500 μL of Anabaena sp. PCC 7120 or R. raciborskii XM1 solution. The vials were sealed, and air in the headspace was replaced with Ar gas after 10 min of continual aeration. Then, a gas mixture consisting of N2 and O2 (4:1 v/v) was aerated into the vials to achieve different volume percentages of 15N2 (15N2/(15N2 + 14N2)). Considering that 15N content is 0.36% in natural abundance and 99% in commercial areas, the absolute atmospheric 15N abundances in the incubations were calculated as 0.36, 10.22, 25.02, 49.68, 74.52, and 99.36%. To temporally track N2 fixation and transfer, cyanobacteria were incubated in the prepared 15N2-containing atmosphere and harvested after 6 or 12 h time intervals.
In parallel incubation experiments, to perform 13C labeling, BG110 medium without NaHCO3 was aerated with Ar gas to remove dissolved CO2. Premixed 12C and 13C-NaHCO3 solutions with 13C percentages (13C/(13C + 12C)) of 1.11, 10.90, 25.58, 50.06, 74.53, and 99.00% (calculated after considering the 13C natural abundance) were immediately added to the medium. The vials were sealed, and air in the headspace was replaced with Ar gas after 10 min of continual aeration. Then, a mixture gas consisting of N2 (as a sole source of nitrogen) and O2 (4:1 v/v) was aerated into the vials. After inoculating 500 μL of Anabaena sp. PCC 7120 or R. raciborskii XM1 solution, cyanobacteria were cultured in these media and harvested at 6 or 12 h time intervals.
Co-culturing of A. chroococcum and E. coli with 15N2 stable isotopes
Azotobacter chroococcum and E. coli were inoculated simultaneously into Azotobacter-specific media using 15N2 as the sole nitrogen source and co-cultured at 28°C and 180 rpm (26). The control consisted of E. coli grown in the same media with 15N2 and 14N2 as the only nitrogen sources in the absence of A. chroococcum.
Single-cell Raman measurement and data analysis
Single-cell Raman measurements were conducted using a LabRAM Aramis confocal micro-Raman system (HORIBA Jobin-Yvon, Japan). For cyanobacteria, excitation was mainly provided by a 785-nm near-infrared laser (Diode laser, Sacher Lasertechnik). For A. chroococcum and E. coli, excitation was provided by a 532-nm laser (Nd:YAG, UK). In ex situ measurement, cyanobacteria were washed with deionized water twice, loaded on an aluminum foil substrate, and air-dried before Raman measurements (54). A 100× objective with a numerical aperture of 0.9 (Olympus, Japan) was used for bacteria visualization and Raman measurement on Al foil. In in situ measurement, a 50× objective with a numerical aperture of 0.55 and a longer working distance of 8 mm (Olympus, Japan) was used to detect Raman signals of cyanobacterial cells in the microfluidic chip. At least 20 spectra were acquired from individual cells of each bacterial sample.
LabSpec5 software (HORIBA Jobin-Yvon) was used for Raman spectra preprocessing, including baseline subtraction, mean spectra calculation, normalization, and peak fitting. To quantify 15N- or 13C-induced spectral variations, PCA was performed via the IRootLab toolbox running on MATLAB 2012a (https://code.google.com/p/irootlab/) (26, 55). Spectral regions from 1,098 to 1,120 cm−1 and from 1,465 to 1,545 cm−1 were extracted for PCA of 15N- and 13C-related spectral variations in cyanobacteria, respectively. Spectral regions from 1,200 to 1,270 cm−1 were used for PCA of the 15N-induced spectral variation in A. chroococcum and E. coli. The resulting PC1 scores were plotted against the 15N2 or 13C-NaHCO3 percentages in the medium or the incubation time. The processed Raman spectra and linear correlations were plotted using Python 3. The distribution map of isotopes in cells via Raman detection was plotted using MATLAB.
Quantification of 15N and 13C isotope incorporation by IRMS
Isotope ratio mass spectrometry was used to measure the bulk isotope contents of 15N or 13C in Anabaena sp. PCC 7120 was incubated with various percentages of 15N2 or 13C-NaHCO3. For 15N or 13C measurement, 0.01–0.03 mg of lyophilized 15N- or 13C-labeled Anabaena sp. PCC 7120 and 0.05–0.17 mg of urea (standards) were mixed in a tin capsule. About 0.10–0.20 mg of non-labeled lyophilized Anabaena sp. PCC 7120 used as control groups were placed in tin capsules. The samples were analyzed with an elemental analyzer (Flash HT 2000 Thermo Fisher) coupled via a ConFlo IV device to the IRMS (Delta V advantage). The bulk isotope contents were calculated using the equation below:
where At 15N% (At 13C%) is the percentage of 15N (13C) relative to the total N (C) measured by IRMS; Murea and M7120 are the weights of urea and lyophilized cyanobacteria, respectively; 0.36% (1.11%) is the natural abundance of 15N (13C) in the urea; 46.67 and 11.3% (19.98 and 51.4%) are the total N (C) contents in urea and cyanobacteria, respectively; and 15N% (13C%) is the abundance of 15N (13C) in cyanobacteria that needs to be calculated.
Raman microfluidic culture system for cyanobacteria
The RMCS was constructed by binding PDMS with specially designed chambers to a quartz slide substrate. The RMCS production processes were as follows. First, a mask to cover the selected area was designed and prepared before the subsequent photolithography process. Second, photolithography technology was used to transfer the pattern on the mask to a silicon wafer with a suitable thickness of photoresist. Subsequently, a chip formpiston was obtained via photolithography, and PDMS was poured on it and solidified. The PDMS and quartz substrates were placed in anhydrous ethanol for ultrasonic cleaning. Finally, the dried PDMS and quartz substrates were treated with oxygen plasma and bombarded for 15 s. The bonding and sealing of the PDMS on a quartz plate were performed to produce a microfluidic chip.
Five parallel micro-chambers (1 mm wide, 100 μm high) were used for cyanobacterial culture, microscopic observation, and Raman detection. The entrance of the micro-chamber was 500 μm wide, which was used to load the strain and media solution, and the exit was designed as a narrow neck structure with a width of 50 μm to block cyanobacteria from flowing out during media input. Two wide channels (100 μm high, 2 mm wide) that connected to the chamber were used to deliver media and discharge waste solution during cyanobacterial culture. Cyanobacteria that were diluted in fresh BG11/BG110 medium (or amended with 15N2 or 13C-NaHCO3) were immediately loaded into the microfluidic chip through a polytetrafluoroethylene tube. The chip was sealed by linking the outlet tube to a 15-mL crimp-top vial. Thereafter, the medium flowed into the chip at a rate of 0.5 μL min−1 for 15 min, and the flow was maintained at 0.3 μL min−1 to continuously provide nutrients to the cells and simultaneously eliminate metabolic waste. All the cyanobacteria in the RMCS were cultured at ∼28°C under light conditions. Fig. S8 shows the continuous growth and reproduction of the cyanobacteria in the RMCS.
Raman mapping at a rectangular area of 6 μm × 14 μm containing the same four cyanobacterial cells was performed over time. The PC1 scores representing the isotope-induced spectral variations were obtained in the same way as before. The linear relationship between PC1 scores and IRMS-measured cellular 15N and 13C contents were used to determine the 15N and 13C enrichments in the four cells analyzed, which were further visualized as color coding in Raman mapping images.
Funding
This work was supported by the National Natural Science Foundation of China (91851101, 42021005, 22241603, 92251306) and the Chinese Academy of Sciences (ZDBS-LY-DQC027).
Supplementary material
Supplementary material is available at PNAS Nexus online.
Author contributions
L.C., Y.X., K.Y., and H.L. performed the experiment, analyzed the data, and plotted the figures. L.C. designed the whole experiment, wrote, and revised the manuscript. N.M. and F.M. codesigned the experiment, participated in writing and revised the manuscript. L.C., Y.X., and Y.Z. designed and verified the culture chip. X.L. and Z.Z. fabricated the culture chip. F.T. and J.Y. isolated and cultured bloom-forming cyanobacteria. S.K., B.R., and Y.G.Z. discussed the results, interpretation, and contributed to revising the manuscript. L.C., Y.X., and K.Y. contributed equally to this work. All authors provided feedback on the manuscript.
Data availability
All study data are included in the article and/or supporting information.
References
Author notes
L.C., Y.X., and K.Y. contributed equally to this work.
Competing Interest: The authors declare no competing interest.