


Abstract
In plants, epitranscriptomic mark N6-adenine methylation (m6A) is dynamically regulated in response to environmental cues. However, little is known about m6A dynamics under biotic stresses and their role in environmental adaptation. Additionally, current methodologies limit the investigation of m6A dynamics at single-nucleotide resolution on specific RNA molecules. Using Oxford Nanopore Technology direct RNA sequencing and a neural network model, we show transcript-specific dynamics of m6A modification at single-nucleotide resolution during Hyaloperonospora arabidopsidis (Hpa) infection in Arabidopsis (Arabidopsis thaliana). In wild-type seedlings, pathogen infection causes a significant reduction in global m6A ratios, which corresponds with the activation of m6A-modified transcripts. Defect of m6A deposition in the m6A mutant hakai-1 mimics m6A reduction from Hpa infection at ∼70% of sites, resulting in constitutive overexpression of basal defense genes and enhanced resistance against the pathogen. Our results demonstrate that m6A dynamics impact defense response against Hpa, providing a promising target for future crop improvement strategies.
Introduction
Epitranscriptome comprises over 170 RNA modifications, with N6-adenine methylation (m6A) being the most extensively studied and abundant in eukaryotes, particularly in mRNA (Shinde et al. 2023). In the model plant Arabidopsis (Arabidopsis thaliana), m6A is deposited by a complex of methyltransferases mRNA adenosine methylase A (MTA, homolog of mammalian METTL3) and methyltransferase B (MTB, homolog of mammalian METTL14), along with cofactors VIRILIZER (VIR, homolog of mammalian VIRMA), E3 ubiquitin ligase AtHAKAI (homolog of mammalian HAKAI), and FKBP12-INTERACTING PROTEIN 37 (FIP37, homolog of mammalian Wilms’ tumor 1-associated protein) (Růžička et al. 2017; Shen 2023). In mRNA, m6A is deposited at the RRACH (R = A/G, H = A/U/C) consensus motif and is mostly prevalent near start/stop codons and at 3′ untranslated regions (3′-UTRs) of mature mRNAs (Shinde et al. 2023). Several studies in different eukaryotic systems have shown that m6A modulates mRNAs fate in cells, by affecting mRNA stability and half-life, alternative splicing, mRNA translation, nucleo-cytoplasmic export rates, and m6A-mediated phase separation (Zaccara et al. 2019). Removal of m6A is mediated by α-ketoglutarate-dependent dioxygenase homolog (ALKBH) proteins, such as ALKBH9B and ALKBH10B (Shinde et al. 2023), in Arabidopsis (Mielecki et al. 2012). Recent studies reveal that abiotic environmental cues such as salt, cold, or heat stresses dynamically modulate N6-adenine (de)methylation (Hu et al. 2021; Wang et al. 2022a). In wild-type (Wt) plants, heat stress application increased m6A levels, while cold treatment reduced them, particularly at 3′-UTR of mRNAs (Wang et al. 2022a, 2023). Additionally, loss-of-function mutants for the core components of m6A deposition displayed salt-stress (Hu et al. 2021) and cold-stress (Wang et al. 2023) hypersensitivity, whereas m6A demethylase mutant alkbh10b-1 was impaired in thermotolerance and flower development (Duan et al. 2017; Wang et al. 2022a), underlining the significance of m6A dynamics in plant–environment interactions. More recently, a role of m6A in the context of pathogens resistance in Arabidopsis has been suggested (Prall et al. 2023). However, quantitative analyses of m6A dynamics during biotic stress and plant defense responses at single-nucleotide resolution on single mRNA molecules remain unresolved due to technical limitations.
Results and discussion
To investigate the role of m6A in plant basal defense to pathogens, we inoculated Wt, hakai-1, hakai-2, and mta/ABI3:MTA (mta) (Růžička et al. 2017) Arabidopsis seedlings (Col-0 accession) with biotrophic oomycete Hyaloperonospora arabidopsidis WAC09 (Hpa), biotrophic bacteria Pseudomonas syringae pv. tomato DC3000 (Pst), and necrotrophic fungus Plectosphaerella cucumerina PMM (Pc) and assessed their disease resistance. Additional mutants of the core m6A writer complex mtb, vir, and fip37 have been excluded from pathogen resistance phenotyping assays due to their severe developmental defects, ranging from embryonic lethality to greatly reduced size, even when complemented at embryogenesis stage (Růžička et al. 2017; Wong et al. 2023). Compared to Wt, mutants hakai-1 and hakai-2 exhibited a significant reduction in Hpa leaf colonization (χ2 tests, P < 0.05), indicating an elevated resistance, while the mta mutant showed a small reduction in Hpa colonization that was not significantly different (Fig. 1A). All 3 mutants showed a mild reduction in Pst colonization, albeit not significant, and displayed no differences in resistance/susceptibility against Pc (Fig. 1A). To dissect transcriptional responses of Wt and m6A deposition mutants to Hpa inoculation, we performed transcriptomic analysis of Mock- and Hpa-treated Wt, hakai-1, hakai-2, and mta seedlings at 48 h after treatment using short-read Illumina RNA-seq. Differential gene expression (DGE) analysis of Hpa-treated Wt seedlings identified 947 upregulated and 533 downregulated genes compared to Mock-treated control. Upregulated genes showed significant enrichment of gene ontology (GO) biological processes (BP) terms related to both early-stage defense responses to Hpa, such as reactive oxygen species production or callose deposition, and late-stage ones, such as salicylic acid-dependent responses (Supplementary Fig. S1), as previously reported for this timeframe following pathogen inoculation (Furci et al. 2019). A comparison between Wt and mutants revealed a subset of 188 differentially expressed genes (DEGs) specifically upregulated in Hpa-resistant hakai-1 and hakai-2 mutants under basal (Mock) conditions, significantly enriched for GO terms for BP related to biotic stress responses (Fig. 1B and Supplementary File 1). On the other hand, downregulated DEGs in any condition showed no GO terms enrichments related to basal defenses (Fig. 1B and Supplementary File 1). Focusing on Hpa-inducible genes of Wt that showed differential induction in hakai mutants, we identified 3 major clusters based on their expression patterns: Hpa-inducible genes showing constitutive upregulation in hakai mutants (Cluster I); Hpa-inducible genes showing enhanced induction in hakai mutants (Cluster II, similar to the transcriptional responsiveness of primed plants); and Hpa-inducible genes showing a combination of constitutive overexpression and enhanced induction (Cluster III) (Fig. 1C). Notably, only genes in Clusters I and III showed enrichment for defense-related GO terms (Fig. 1C and Supplementary File 1), particularly related to salicylic acid-dependent defense pathway required for Hpa resistance (Herlihy et al. 2019). Together, these results indicate that increased basal resistance to Hpa in hakai mutants correlates with the constitutive overexpression of defense-related genes.
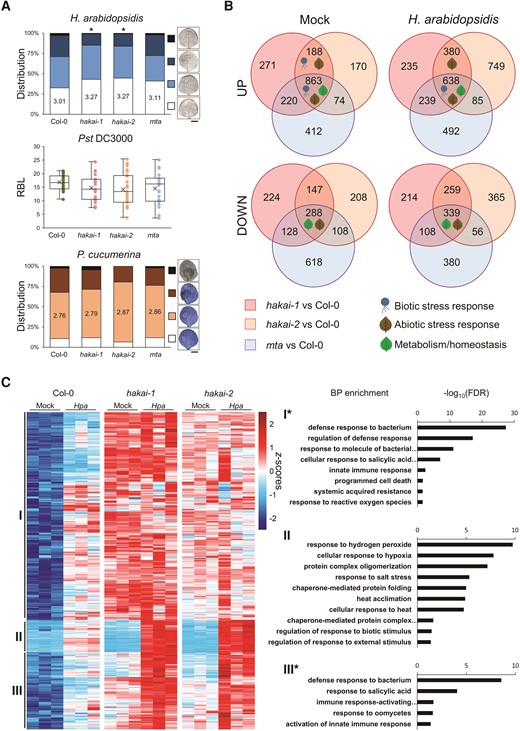
Phenotypical and transcriptional characterization of m6A deposition mutants. A) Basal resistance phenotype of hakai-1, hakai-2, and mta mutants against different pathogens. Top graph shows distribution of infection classes for Hpa-treated leaves from each genotype, ranging from least infected (white), to most infected (black, examples shown on the right. Scale bar = 3 mm). Statistically significant differences in Hpa leaf colonization between Wt and mutants were assessed by χ2 test (n = 150+). Middle graph shows quantification of relative bioluminescence (RBL) from transgenic Pst colonization (x indicates mean RBL for each genotype; center line indicates median, with lower and upper quartiles below and above; uppermost and lowermost whiskers points indicate maximum and minimum RBL values, respectively). Statistically significant differences in Pst colonization between each mutant and Wt were assessed by 2-tailed Student's t-test (n = 20+). Bottom graph shows distribution of severity of necrotic lesions for Pc drop-inoculated leaves, ranging from no lesion (white) to completely necrotized leaves (black, examples shown on the right. Scale bar = 3 mm). Statistically significant differences in Pc necrotic lesion category distribution between Wt and mutants were assessed by χ2 test (n = 35+). Asterisks indicate P < 0.05. Images were digitally extracted for comparison. B) Distribution and overlaps of up- or downregulated DEGs in m6A deposition mutants. Each circle represents DEGs in pairwise comparisons between the indicated mutant and Wt at the appropriate condition (Mock of Hpa). Comprehensive list of enriched BP terms is provided in Supplementary File 1. C) Hierarchical clustering (Ward's method) of Hpa-inducible genes in Wt seedlings showing differential induction in both hakai mutants. For each cluster (I to III), GO terms enrichments for BP are shown on the right. Asterisks indicate clusters that contain additional GO terms not related to basal defenses (full list provided in Supplementary File 1).
To investigate the dynamics of m6A and its impact on transcription during Hpa infection, we sequenced mRNA from Mock and Hpa-treated Wt and hakai-1 seedlings using Oxford Nanopore Technology direct RNA sequencing (ONT-DRS). We exploited the deeplearning explore nanopore m6A (DENA) neural network tool that demonstrated identification of 90% of miCLIP-detected m6A sites and quantification of m6A ratio at single-nucleotide resolution in the RRACH context from ONT-DRS raw signals (Qin et al. 2022). Analysis of the global distribution of m6A at RRACH sites across all conditions revealed a significant reduction in average m6A during Hpa infection in Wt seedling compared to Mock-treated ones (Fig. 2A). Similarly, hakai-1 mutation led to a significant reduction in m6A averages in both Mock- and Hpa-treated mutant seedlings (Fig. 2A). These results align with a previous report that observed a partial reduction in m6A in hakai mutants using 2D thin-layer chromatography, in comparison with other mutants of m6A deposition like vir or fip37 (Růžička et al. 2017). The number of transcript-specific RRACH sites in each sample meeting the minimum coverage threshold (50 reads) varied proportionally to each sample's read depth, as expected (Fig. 2A, Supplementary Fig. S2A). Hence, we focused on a subset of 8,691 m6A sites shared across all four conditions to ensure a more robust quantification of m6A changes by pathogen treatment or mutation (Supplementary Fig. S2B). Across transcript regions, we confirmed an overall higher m6A levels around 3′-UTRs (Fig. 2B), as previously reported across different model species (Shinde et al. 2023; Wang et al. 2022b). Notably, we found that Hpa treatment of Wt resulted in a significant reduction in m6A, particularly at the coding sequence (CDS) region of transcripts (Fig. 2B). In contrast, hakai-1 mRNAs showed significant reductions in m6A across entire transcripts, particularly at 3′-UTRs compared to Wt, without strong impact of Hpa treatment on m6A levels (Fig. 2B). These results demonstrate the presence of dynamic m6A regulation during the defense response.
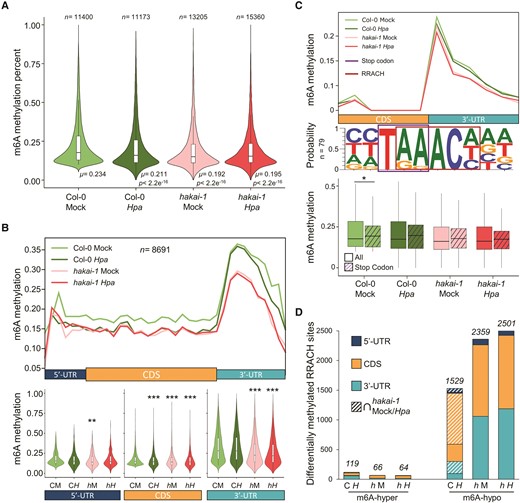
Dynamics of m6A in Wt and hakai-1 Arabidopsis seedlings upon Hpa infection. A) Global distribution and average m6A percentages in Mock- and Hpa-treated Arabidopsis seedlings. Statistically significant differences in distribution were assessed by Student's t-test in pairwise comparisons with Mock-treated Wt (μ, mean; n, number of m6A sites). B) Top panel: Mean m6A methylation ratio (50 bp resolution) over transcript regions for shared m6A sites (n = 8,691, Supplementary Fig. S2) across conditions. Bottom panel: distribution of methylation ratios for shared m6A sites in each transcript region. Statistically significant differences in distribution were assessed by Student's t-test in pairwise comparisons with Mock-treated Wt. **P < 0.01; ***P < 0.001. C) Top panel: mean m6A methylation ratio at 1 bp resolution around transcripts stop codon. Middle panel: motif enrichment of stop-codon terminal m6A sites. Bottom panel: m6A methylation ratios for stop-codon terminal m6As (purple stripes, n = 79) compared to all m6A (no stripes, n = 8,691). Center line of boxplots indicates median, with lower (Q1) and upper (Q3) quartiles below and above; whiskers indicate Q1 ± 1.5 × interquartile range. Statistically significant differences in distribution were assessed by Student's t-test. *P < 0.05. D) Number of differentially methylated m6A sites compared to Hpa-treated Wt (Fisher's exact test), separated by transcript region location. Striped bars indicate differentially methylated m6A sites shared between Hpa-treated Wt and Mock-/Hpa-treated hakai-1 mutant. C, Col-0; h, hakai-1; M, Mock treatment; H, Hpa treatment.
While previous studies identified an enriched peak of m6A downstream of CDS using immunoprecipitation techniques, they could not resolve the exact m6A positions at single-nucleotide resolution (Dominissini et al. 2012; Prall et al. 2023). By separating m6A profiles across each of the 12 unique RRACH motif combinations, we found overall higher m6A ratios at RRACH motifs starting with AA or GA (Supplementary Fig. S3A). Intriguingly, visualizing the distribution of m6A at 1 bp resolution revealed the highest m6A peak specifically at 1 nucleotide downstream of CDS stop codon (Supplementary Fig. S3B). For these stop-codon terminal m6As, the last 2 AA/GA/AG nucleotides of the stop-codon triplet have been co-opted as first 2 elements of the m6A RRACH motif (Fig. 2C, middle panel, Supplementary Fig. S3C). Additionally, we found that in Arabidopsis stop-codon terminal m6As showed a preference for TAA stop-codon trinucleotide (Supplementary Fig. S3C), in contrast to the TGA trinucleotide reported in human or mouse cells (Luo et al. 2022). Transcripts possessing stop-codon terminal m6A had the highest significant GO enrichment for BP related to translation, of which all genes code for ribosomal proteins (Supplementary Fig. S3D). Further investigations are needed to elucidate the functional relevance of the stop-codon terminal m6A in transcription and translation control.
Quantification of differentially methylated adenines in Hpa-treated Wt seedling compared to Mock revealed 119 significantly hyper-methylated (m6A-hyper) or 1529 hypomethylated (m6A-hypo) m6A sites (Fig. 2D). Interestingly, m6A deposition complex components HAKAI and MTA or m6A demethylase ALKBH10B did not show transcriptional changes in Hpa-treated Wt seedlings (Supplementary Fig. S4). On the other hand, we found Hpa-dependent upregulation of HAKAI-interacting zinc finger protein 1 (HIZ1, Supplementary Fig. S4) in Wt seedlings, which is known to downregulate HAKAI-dependent methylase activity, causing m6A reduction when overexpressed (Zhang et al. 2022). These results demonstrate dynamic modulation of m6A in Wt seedlings following Hpa infection, predominantly leading to a reduction in m6A levels at specific mRNA transcripts. As expected, more m6A-hypo sites were found in hakai-1 mutant in both Mock- and Hpa-treated samples (2,359 and 2,501, respectively), with a larger proportion occurring at the 3′-UTR, compared to m6A-hypo caused by Hpa infection in Wt plants (Fig. 2D, Supplementary File 2). Notably, 69.2% of m6A-hypo sites in Wt following Hpa infection were also hypomethylated in either Mock- or Hpa-treated hakai-1 mutant, compared to Mock-treated Wt (Fig. 2D). This result indicates that hakai-1 mutation mimics most of m6A-hypomethylation caused by Hpa-derived epitranscriptional reprogramming in Wt.
Two of the best-characterized roles of m6A in post-transcriptional regulation of RNA are the modulation of alternative splicing and mRNA abundance (Shinde et al. 2023). To investigate the effects of m6A changes induced by Hpa infection or hakai mutation in alternative splicing, we conducted differential transcript usage (DTU) analysis using short-read RNA-seq data of Mock- and Hpa-treated Wt and hakai-1 seedlings. We next crossed DTU results with isoform-specific ONT-DRS m6A calling to pinpoint changes in isoform usage that could be linked by m6A modulation. Overall, Hpa infection had the largest effect on DTU, with a total of 268 isoforms for 153 genes showing significant change in isoform usage, whereas only 175 and 183 isoforms for 98 and 106 genes were identified in Mock- and Hpa-treated hakai-1 mutant, respectively, compared to Mock-treated Wt (Supplementary Fig. S5). For most genes, however, no m6A sites were identified, or data were limited to the main isoform (Supplementary Fig. S5). This is most likely due to lower transcript abundance of alternative isoforms, making detection of m6A sites above the minimum coverage threshold (50 ONT-DRS reads/site) more difficult. Nonetheless, we could identify a few genes showing both DTU between two or more isoforms and at least a single differentially methylated m6A site at any isoform (Fig. 3A). For these genes, the reduction in m6A at different transcript regions generally correlated with an increased isoform expression in each condition (Fig. 3A). For the gene YUELAO 2 (YL2, At5G25280), the different proportions of overexpression for isoforms 1 and 2 in Hpa-treated hakai-1 (compared to Mock-treated Wt) correlated with m6A changes at region-specific sites detected only in either isoform (5′-UTR for isoform 1 and CDS for isoform 2, Fig. 3B). Additionally, for the most overexpressed isoform 1, a shared m6A site at the 3′-UTR was specifically hypomethylated in Hpa-treated hakai-1 at this isoform (Fig. 3B, purple box). We then shifted our focus to the role of m6A dynamics on regulation of mRNA abundance by combining DGE analysis with ONT-DRS differential m6A calling. We identified 41 genes showing both differential transcriptional responsiveness to Hpa in the hakai-1 mutant (Fig. 1C) and significant m6A-hypo or m6A-hyper methylation in at least a single adenine of their transcript in any condition (Fig. 3C). For most of these genes, increased mRNA accumulation by Hpa in Wt corresponded with a dynamic reduction in m6A in their transcripts (Fig. 3C). Interestingly, in hakai-1, these genes showed lower m6A at basal conditions (Mock) which correlated with constitutive transcriptional upregulation (Fig. 3C). In human cells, deposition of m6A increases mRNA decay by YTHDF2-mediated CCR4/NOT degradation (Wang et al. 2022b), suggesting a negative correlation between m6A and transcript abundance. For the subset of genes, our results suggest that the hakai-1 mutant at basal condition can mimic the Hpa-induced m6A reduction associated with increased mRNA accumulation in Wt plants. The 41 targets include many genes previously reported to be involved in pathogen response (Supplementary File 3), such as MITOGEN-ACTIVATED PROTEIN KINASE 3 (MPK3, At3G45640), a well-characterized kinase involved in innate immunity downstream signaling (Sun and Zhang 2022), and EARLY RESPONSE TO DEHYDRATION 6 (ERD6, At1G08930), a putative sucrose transporter involved in AZELAIC ACID INDUCED 1(AZI1)-dependent priming of salicylic acid induction and systemic acquired resistance (Wang et al. 2016) (Fig. 3D, Supplementary File 3). For both genes, m6A reduction localized at multiple sites at CDS and 3′-UTR of their transcript and was proportional to increased gene expression levels caused by Hpa infection or hakai-1 mutation (Fig. 3D). In yeast, a causal link between a reduction in a single m6A site in the 3′-UTR of meiotic regulator REGULATOR OF MEIOSIS 1 (scRME1) and an increase in its mRNA abundance has been reported (Bushkin et al. 2019).
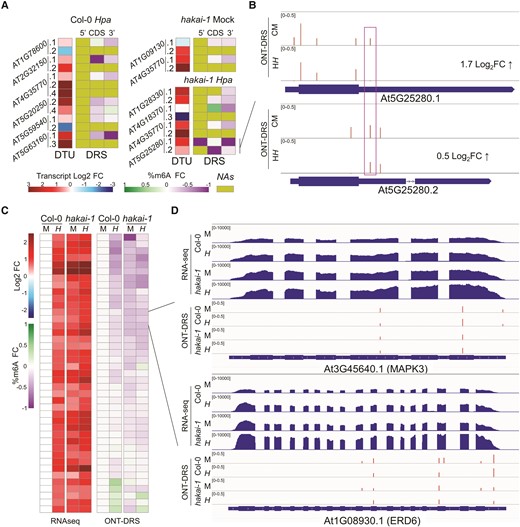
Gene-specific epitranscriptomic regulation of alternative splicing and mRNA accumulation. A) Correlation between DTU and m6A changes at selected genes. DTU heatmap displays log2-fold changes in isoform expression; DRS heatmap shows fold changes in m6A percentage across transcript region of each isoform (NA, no data available). B) Example of transcript-specific m6A changes for differentially spliced At5G25280.1 and At5G25280.2 isoforms in Hpa-treated hakai-1 vs Mock-treated Wt. ONT-DRS tracks display m6A percentages at identified m6A sites (bars). C) Correlation between transcriptional changes and m6A changes of 41 candidate genes. RNA-seq heatmap displays log2-fold changes in gene expression; ONT-DRS heatmap shows fold changes in m6A percentage averaged across each transcript. D) Browser view of representative candidates MAPK3 and ERD6 (with corresponding heatmap cells indicated in Fig. 1C). RNA-seq tracks display normalized read coverages; ONT-DRS tracks display m6A percentages at identified m6A sites (red bars). C, Col-0; h, hakai-1; M, Mock treatment; H, Hpa treatment.
In mammalian cells, a mechanistic link between m6A and mRNA abundance has been ascribed to altered mRNA degradation (Zaccara et al. 2019), transcriptional repression (Akhtar et al. 2021), or transcriptional activation (Deng et al. 2022), depending on which m6A reader protein interacts with methylated RNA. To assess a potential role of m6A dynamics in mRNA stability of candidate genes MAPK3 and ERD6, we performed mRNA degradation experiment by exposing Mock- and Hpa-treated Wt and hakai-1 seedlings to transcriptional inhibitor 3′-deoxyadenosine (cordycepin). Analysis of MAPK3 and ERD6 mRNA abundance over a 120-min time course following cordycepin treatment showed low degradation rates for both genes, when compared with control gene EXPANSIN-LIKE A1 (EXLA1, At3G45970) characterized for low mRNA stability (Niu et al. 2019) (Supplementary Fig. S6). At the last timepoint (120 min), no significant differences in MAPK3 and ERD6 mRNA abundance were detected in either Hpa-treated Col-0 or hakai-1 seedlings when compared with Mock-treated Col-0 ones (Supplementary Fig. S6), indicating that m6A reduction caused by Hpa treatment or hakai mutation does not affect mRNA stability. Overall, our results suggest that modulation of transcripts’ m6A levels at specific sites mediates transcriptional activation of defense genes and pathogen response, altering mRNA accumulation.
In conclusion, our study provides insight into Arabidopsis m6A dynamics in response to biotic stress during pathogen infection. In Wt, epitranscriptional reprogramming following Hpa treatment coincides with m6A reduction at specific m6A sites (Fig. 2B). In the m6A defective mutant hakai, around 70% of Hpa-derived m6A-hypo sites in Wt are hypomethylated in both Mock and Hpa conditions, suggesting a role of HAKAI in mediating m6A dynamics in response to Hpa infection. Increased mRNA accumulation in a subset of Hpa-inducible defense-related genes in Wt correlates with transcript-wide m6A reduction (Fig. 2C), consistent with previous reports in different model organisms (Bushkin et al. 2019; Wang et al. 2022b). In the hakai mutant, these genes possess lower transcript-wide m6A ratios at basal state, resulting in global constitutive overexpression of biotic stress response genes (Fig. 2C and Fig. 1, B and C) and increased resistance (Fig. 1A). Given recent advances in methodologies for targeted m6A mRNA editing (Fang et al. 2023), our findings provide a promising avenue for novel methods of crop protection against pathogens and future crop improvement programs.
Materials and methods
Plant materials and growth conditions
The Arabidopsis (A. thaliana) hakai-1 line (GABI_217A12) was obtained from ABRC (Ohio, USA) and genotyped to retrieve homozygous plants. The hakai-2 and mta seeds were kindly provided by Prof. Rupert G. Fray. The hakai-2 line is homozygous for CRISPR-induced point mutation in HAKAI, as described previously (Růžička et al. 2017). The mutant mta corresponds to homozygous SALK_074069 line complemented with ABI3:MTA, to rescue the embryo-lethal phenotype of homozygous T-DNA insertion, as previously described (Bodi et al. 2012). All mutants are in Col-0 background.
Seeds of Wt and mutants were stratified in water for 4 d in darkness at 4 °C before sowing in soil. Seedlings were grown for 3 wk under short-day conditions (8.5-h light/15.5-h dark, 21 °C, 60% relative humidity, ∼125 μmol s−1 m−1 light intensity) before pathogen inoculations.
Pathogen resistance assays
For Hpa infection, seedlings were spray-inoculated with a suspension of asexual conidia in sterile water at a density of 105 spores/ml and kept at 100% RH to promote infection. Hpa colonization was quantified 6 d post-inoculation by microscopic scoring of leaves, as described previously (Furci et al. 2019; Berthelier et al. 2023). Trypan blue-stained leaves (Asai et al. 2015; Furci et al. 2019) were analyzed with a stereomicroscope (KL200 LED, Leica Microsystems) and assigned to four colonization classes: class I, no hyphal colonization; class II, ≤ 50% leaf area colonized by pathogen hyphae, without formation of conidiophores; class III, ≤ 75% leaf area colonized by hyphae, presence of conidiophores; and class IV, > 75% leaf area colonized by the pathogen, abundant conidiophores, and sexual oospores. At least 150 leaves per were analyzed per genotype (Supplementary File 1). Statistically significant differences in Hpa colonization in each mutant were assessed with χ2 test in pairwise comparison with Wt (P < 0.05).
For Pst infection, plants were spray-inoculated with bioluminescent Pst::LUX (Fan et al. 2008) at OD600 = 0.15 in 10 mm MgSO4 + 0.01% v/v Silwet L-77. Inoculated plants were kept for 3 d at 100% RH to promote disease progression. After 3 d, digital photographs of infected seedlings were taken with ChemiDoc XRS + Imager (BioRad). Relative bioluminescence was quantified as described previously (Furci et al. 2023, 2021). The day before inoculation, Pst::LUX bacteria were cultured from 1 mL of frozen stocks in a shaking incubator (BioShaker BR-43FL) O/N at 28 °C in King's medium B, containing 50 μg/mL of rifampicin and kanamycin. More than 20 infected plants were scored per genotype (Supplementary File 1). Statistically significant differences in Pst colonization in each mutant were assessed with Student's t-test in pairwise comparison with Wt (α = 0.05).
Pc was maintained from frozen stock in 1/2 strength potato-dextrose agar plates kept for at least 2 wk at room temperature in the dark until sporulation. Spores were gently scraped from plates using sterile water, and spore density was adjusted to 106 spores/ml using a hemocytometer (Improved Neubauer, Hawksley, UK). For each seedling, the first 2 adult leaves were inoculated with 3 µl droplets of the spore suspension and kept at 100% RH following drop-inoculation. Six days after inoculation, infected leaves were collected for trypan blue staining and scored under stereomicroscope (KL200 LED, Leica Microsystems). Infected leaves were assigned to 4 different classes based on size of the necrotic lesion caused by the pathogen, as described previously (Pastor-Fernández et al. 2020): class I, no necrotic lesion; class II, small necrotic lesion surrounding the drop-inoculation site; class III, large necrotic lesion extending beyond drop-inoculation site; and class IV, completely necrotic leaves. More than 35 leaves were scored per genotype (Supplementary File 1). Statistically significant differences in Pc necrotic lesion distribution in each mutant were assessed with χ2 test in pairwise comparison with Wt (P < 0.05).
RNA extraction, Illumina, and Nanopore DRS sequencing
Total RNA was extracted from each genotype 48 h after treatment with Hpa or Mock (sterile water) using Maxwell 16 LEV Plant RNA kit (Promega, USA). For each genotype/treatment combination, 12 seedlings were harvested in 3 biological replicates (four individual seedlings per sample).
For Illumina short-read sequencing, mRNA was isolated using NEBNext Poly(A) mRNA Magnetic Isolation Module (NEB). Libraries were prepared using NEBNext Ultra II RNA Library Prep Kit for Illumina (NEB) according to the manufacturer's instructions, using size selection to obtain 450+ bp inserts. Concentration-normalized libraries were sequenced using Nova Seq 6000 (Illumina) at OIST sequencing facilities (150 bp, paired-end).
For ONT-DRS sequencing, total RNA from Col-0 and hakai-1 (Mock and Hpa) 3 biological replicates (same samples used for Illumina RNA-seq) was pooled into a single sample and used to generate sequencing libraries with the Direct RNA Sequencing Kit (SQK-RNA002, Oxford Nanopore Technologies, UK) according to the manufacturer's instructions. ONT-DRS was performed using MinION devices (device: MIN-101B, flow cells: FLO-MIN106 R9 version; Oxford Nanopore Technologies, UK) at our laboratory. We performed 2 sequencing runs for each condition. The basecalling was performed with Guppy (v4.4.2, https://nanoporetech.com/) to fit DENA requirement. We basecalled at least 2.6 million reads with a minimum of quality control of 8 for each of the 4 conditions.
Illumina RNA-seq DGE analysis and DTU analysis
Demultiplexed reads were trimmed using Trimmomatic (v0.39) (Bolger et al. 2014), with options LEADING:10 TRAILING:5 SLIDINGWINDOW:4:20 MINLEN:33. For DGE analysis, paired trimmed reads were aligned to TAIR10 reference genome using Hisat2 (Kim et al. 2019) (default options) and read counts obtained with HT-seq “count” function (Putri et al. 2022) using Araport11 transcriptome as reference. DGE analysis was performed with DESeq2 (Love et al. 2014) in R (v4.3.1). For DTU analysis, transcript-specific read counts were obtained by mapping paired trimmed reads to the Araport11 reference transcriptome using Salmon (Patro et al. 2017) (v1.10, mapping-based mode, default options). DTU analysis was performed on transcript-based Salmon counts using a published workflow (Love et al. 2018) that combines DRIMseq (Nowicka and Robinson 2016) and DEXseq (Anders et al. 2012). For each indicated gene list, significant GO enrichment for BP terms was performed with PANTHER (v18.0) (Thomas et al. 2022) using Benjamini–Hochberg false discovery rate (fdr) < 0.05.
M6a methylation calling from ONT-DRS and quantification
m6A methylation calling was performed with machine learning tool DENA for each of the 4 conditions (Wt Mock, Wt Hpa, hakai-1 Mock, and hakai-1 Hpa) using Araport11 transcriptome as reference, by following DENA instructions (Qin et al. 2022). Re-squiggling of ONT-DRS raw signal was done with Tombo (https://github.com/nanoporetech/tombo) as indicated in DENA manual, to obtain a unique mapping between the signal section of each base of each read and the reference sequence. ONT-DRS reads were aligned to the reference transcriptome using minimap2 (Li 2018) with option: -ax map-ont -L –secondary = no. Next, the DENA scripts LSTM_extract.py and LSTM_predict.py were applied (Qin et al. 2022). For m6A methylation predictions, we only considered RRACH positions supported by at least 50 reads and with m6A ratio ≥0.1, as indicated by DENA's authors (Qin et al. 2022). The m6A percentages were calculated as the number of modified reads divided by the number of total reads. To increase robustness in differential m6A calling, only m6A sites supported by at least 50 reads in each of the four conditions and methylated in Wt Mock (percentage ≥ 0.1) were considered (Supplementary Fig. S2B). Because of DENA's false-positive rate (Qin et al. 2022), m6A sites with ratio below 0.1 were considered unmethylated and their ratio was set at 0. To identify differentially methylated m6A sites, Fisher's exact test (P < 0.05) was used for each condition in pairwise comparison with Wt Mock sample.
RT-qPCR
One μg of total RNA extracted as indicated above was converted to cDNA using Takara's PrimeScript II 1st strand cDNA Synthesis Kit, according to the manufacturer's instructions. RT-qPCRs were performed using Takara's TB Green Premix Ex Taq II in a Thermal Cycler Dice Real Time System III. Relative expression was quantified using the 2−ΔΔCT method with correction for reaction efficiency (Pfaffl 2001). cDNA abundance of each sample was normalized using ACT2 (At3G18780) and GAPDH (At1G13440) housekeeping genes (Berthelier et al. 2023). All primers used are listed in Supplementary Table S1.
Cordycepin treatment and degradation analysis
Three-wk-old Col-0 and hakai-1 seedlings were treated with Mock or Hpa as indicated above. At 48 h after Mock/Hpa treatment, before cordycepin treatment, reference samples were harvested (0 min). Then, for each genotype/treatment, around 60 plants were suspended in liquid buffer (1 mm PIPES, 1 mm trisodium citrate, 1 mm KCl, and 15 mm sucrose, pH) containing 0.6 mm cordycepin (150 mg/L), and vacuum infiltration was performed for 60 s at 0.04 mPa. Samples were collected 60, 90, and 120 min after cordycepin treatment. For each genotype/treatment, 3 biological replicates were collected, each consisting of leaf tissues from 3 to 4 independent plants. RT-qPCR was performed as described above. The expression levels of MAPK3 and ERD6 at each timepoint were normalized against high-stability transcripts of eukaryotic initiation factor-4A1 (eIF4A-1, AT3G13920) as previously described, and shown together with those of EXPANSIN-LIKE A1 (EXLA1, AT3G45970) as reference for low mRNA stability (Niu et al. 2019; Berthelier et al. 2023). All primers used are listed in Supplementary Table S1.
Accession numbers
Genomic and mRNA sequence data for the genes listed in this article can be found in the GenBank/EMBL data libraries under accession numbers listed in Supplementary Table S1.
Acknowledgments
The authors thank Prof. Rupert G. Fray and associated lab members for kindly providing hakai-2 and mta mutant Arabidopsis seeds. The authors are grateful for the help and support provided by the Sequencing Section (SQC) of Research Support Division at OIST Graduate University for performing Illumina short-read mRNA sequencing.
Author contributions
L.F., J.B., and H.S. designed the research and experiments and wrote and edited the manuscript. L.F. performed pathogen resistance assays and library preparation for Illumina RNA-seq and ONT-DRS and Illumina RNA-seq data analysis. J.B. performed ONT-DRS data analysis.
Supplementary data
The following materials are available in the online version of this article.
Supplementary Figure S1. GO term enrichment (BP) for differentially upregulated and downregulated genes in H. arabidopsidis (Hpa)-treated Wt seedlings compared to Mock-treated ones.
Supplementary Figure S2. Distribution of m6A sites across treatments.
Supplementary Figure S3. Distribution of shared m6A sites across different RRACH motifs.
Supplementary Figure S4. mRNA expression analysis of m6A machinery components in Mock- or H. arabidopsidis-treated Wt A. thaliana plants.
Supplementary Figure S5. Comprehensive overview of all genes showing DTU in each condition (compared to Mock-treated Col-0).
Supplementary Figure S6. RNA degradation analysis over a time course following 3′-deoxyadenosine (cordycepin) treatment for candidate genes MAPK3 (At3G45640) and ERD6 (At1G08930).
Supplementary Table S1. GenBank sequence accession numbers and RT-qPCR primers utilized for each gene listed in this study.
Supplementary File 1. Supplementary information for Fig. 1.
Supplementary File 2. Supplementary information for Fig. 2.
Supplementary File 3. Supplementary information for Fig. 3.
Funding
This work was supported by MEXT Grant-in-Aid for Transformative Research Areas (A) JP20H05913 to H.S. and by JSPS Grant-in-Aid for Early-Career Scientists 23K13957 to L.F.
Data availability
Illumina short-read RNA-seq data (adaptor-trimmed.fastq files) and ONT-DRS raw data (.fast5 files) generated in this study have been deposited in EMB-EBI European Nucleotide Archive database under accession codes PRJEB67534.
Dive Curated Terms
The following phenotypic, genotypic, and functional terms are of significance to the work described in this paper:
References
Author notes
Leonardo Furci and Jérémy Berthelier contributed equally to this work.
The author responsible for distribution of materials integral to the findings presented in this article in accordance with the policy described in the Instructions for Authors (https://dbpia.nl.go.kr/plphys/pages/General-Instructions) is: Leonardo Furci ([email protected]).
Conflict of interest statement. None declared.
