


Abstract
Teosinte branched 1/Cycloidea/Proliferating cell factor (TCP) transcription factors function in abiotic stress responses. However, how TCPs confer salt tolerance is unclear. Here, we characterized a TCP transcription factor, BpTCP20, that responds to salt stress in birch (Betula platyphylla Suk). Plants overexpressing BpTCP20 displayed increased salt tolerance, and Bptcp20 knockout mutants displayed reduced salt tolerance relative to the wild-type (WT) birch. BpTCP20 conferred salt tolerance by mediating stomatal closure and reducing reactive oxygen species (ROS) accumulation. Chromatin immunoprecipitation sequencing showed that BpTCP20 binds to NeuroD1, T-box, and two unknown elements (termed TBS1 and TBS2) to regulate target genes. In birch, salt stress led to acetylation of BpTCP20 acetylation at lysine 259. A mutated BpTCP20 variant (abolished for acetylation, termed BpTCP20259) was overexpressed in birch, which led to decreased salt tolerance compared with plants overexpressing BpTCP20. However, BpTCP20259-overexpressing plants still displayed increased salt tolerance relative to untransformed WT plants. BpTCP20259 showed reduced binding to the promoters of target genes and decreased target gene activation, leading to decreased salt tolerance. In addition, we identified dihydrolipoyllysine-residue acetyltransferase component of pyruvate dehydrogenase complex (BpPDCE23), an acetyltransferase that interacts with and acetylates BpTCP20 to enhance its binding to DNA motifs. Together, these results suggest that BpTCP20 is a transcriptional regulator of salt tolerance, whose activity is modulated by BpPDCE23-mediated acetylation.
Introduction
Teosinte branched 1/Cycloidea/Proliferating cell factor (TCP) is a family of transcription factors (TFs) unique to plants, which was first reported by Cubas et al (1999). TCP family proteins contain an atypical TCP domain and an R domain at their N-terminus, which is involved in regulating protein interactions (Kosugi and Ohashi 1997; Cubas et al. 1999). Based on the differences in their TCP domains, TCP TFs can be classified into two subfamilies: Class I (also known as proliferating cell factor [PCF] or TCP-P class) and Class II (also known as TCP-C class) (Kosugi and Ohashi 2002; Navaud et al. 2007). The differences between the two subclasses are that Class II has four more amino acid residues (CTAK) in the alkaline region than Class I, and the length of helix II domain of Class II is longer than that of Class I. Also, some Class II proteins contain an R domain rich in arginine (KELRAKARERARERTKEK) and an ECE domain with the glutamate–cysteine–glutamate sequence (SECEV) (Cubas et al. 1999; Howarth and Donoghue 2005).
In plants, TCP proteins play multiple roles in the evolution of morphology, the evolutionary diversification of flower form (Baba et al. 2001; Li et al. 2005; Herve et al. 2009; Shen et al. 2021; Viola and Gonzalez 2023), and the control of leaf development via the jasmonate (JA) signaling pathway, based on functional antagonism of Class I and Class II TCP proteins (Danisman et al. 2012). In addition, TCP TFs modulate the reproductive development of plants, such as flower organ morphogenesis, pollen development, flowering time, the inflorescence stem growth, and correction of the growth and development of flower organs (Viola and Gonzalez 2023).
Moreover, TCP TFs modulate plant resistance to biotic and abiotic stresses (Li 2015). For instance, AtTCP17 binds to PIF4 (Phytochrome Interacting Factors 4) to regulate thermal morphogenesis and resist the damage caused by high temperature (Zhou et al. 2019). PeTCP10 from moso bamboo (Phyllostachys edulis) is induced by drought stress, and heterologous expression of PeTCP10 in Arabidopsis (Arabidopsis thaliana) mediated stomatal closure to reduce water loss, leading to improved drought tolerance (Liu et al. 2020; Xu et al. 2021). Heterologous expression of maize (Zea mays) ZmTCP42 or GbTCP4 from sea-island cotton (Gossypium barbadense) could confer drought tolerance to transgenic Arabidopsis (Ding et al. 2019; Wang et al. 2022). The Arabidopsis SUPPRESSOR OF rps4-RLD1 (SRFR1) is a transcriptional repressor of defense genes that can fine-tune the defense response of Arabidopsis by interacting with Class I TCP family proteins, such as TCP20 (Kim et al. 2014).
In addition, TCP20 plays an important role in nitrate signaling, in which it interacts with NIN-like protein 7 (NLP7) to control the primary nitrate response and lateral root development (Gautrat et al. 2021). Low nitrate (0.05 mM) modulates stem cell dynamics in the root meristem, which impacts the root system architecture profoundly (Jia et al. 2020). Therefore, TCP20 is not only involved in the nitrate response but also regulates the root system architecture of stem cell dynamics (Viola et al. 2023). For instance, TCP20 plays a role in nitrate homeostasis by binding DNA in more than 100 nitrate-regulated genes, including the promoter of Arabidopsis response regulators (ARR) ARR5/7, encoding type-A response regulators that are induced by NO3− (Ruffel et al. 2011; Guan et al. 2014; Calatrava et al. 2017). In nitrate signaling, TCP20 serves as a systemic master regulator to modulate cell division and differentiate vascular stem cells, and also regulates the expression of the cell cycle gene CYCB1; 1 (encoding cyclin-dependent protein kinase B1; 1) in the root apical meristem (Guan et al. 2014; Moreno et al. 2020; Wang et al. 2023).
Protein acetylation is an important posttranslational modification (PTM), which is involved in all domains of life (Castaño-Cerezo et al. 2014). Conventionally, acetylation modification has been found to be mainly involved in transcriptional regulation. The increased acetylation of histones will decrease their binding to DNA, leading to decreased nucleosome compactness (Sterner and Berger 2000). Histone acetylation is regulated by histone deacetylases and histone acetyltransferases, which determines the opening or closing of chromatin, thereby playing a role in regulating access of DNA-binding proteins, such as TFs, for transcriptional activation (Li et al. 2019; Xia et al. 2021). Besides histone acetylation, some studies have shown that proteins other than histone could be acetylated. For instance, Hartl et al. (2017) identified 91 acetylated proteins other than histones from Arabidopsis. The Arabidopsis RPD3/HDA1 family not only use histones as a substrate but also uses nuclear substrate proteins for lysine deacetylation, including those involved in transcriptional regulation, nuclear protein import, and chromatin remodeling (Füßl et al. 2018). Previous studies revealed that PTMs of TCPs facilitated their function. For instance, Arabidopsis TCP14 and TCP15 can be modified by O-linked N-acetylglucosamine (O-GlcNAc) in Escherichia coli by the Arabidopsis O-GlcNAc transferase, SECRET AGENT. In addition, both TCP14 and TCP15 can interact with SPINDLY (SPY), and are dependent on SPY to facilitate cytokinin responses in leaves and flowers (Steiner et al. 2012). However, there are few reports about the acetylation of TFs, which is important to further reveal their functions.
Although TCPs play roles in abiotic stress tolerance, their mechanisms of conferring salt tolerance are unknown, including whether PTMs of TCP proteins are induced by abiotic stresses. If so, what are the roles of PTMs in the abiotic stress response? What are the target genes of TCP proteins under abiotic stresses? In addition, what kinds of DNA motifs are mainly bound by TCPs to regulate genes under abiotic stress conditions? Revealing these mechanisms will increase our understanding of the roles of TCP proteins in abiotic stress tolerance.
In the present study, we identified a birch (Betula platyphylla Suk) TCP TF, BpTCP20, which is induced by salt stress and confers salt tolerance. In addition, the DNA motifs bound by BpTCP20 were identified, and the target genes of BpTCP20 were determined on the genome scale. Acetylation of BpTCP20 is induced by salt stress, and acetylated BpTCP20 activates the expression of its target genes, thus contributing to improved salt tolerance.
Results
The expression of BpTCP20 is induced by salt stress
Previously, we screened a TCP gene from birch genome (Chen et al. 2021), termed BpTCP20, and identified that its encoded protein belongs to Class I (PCF subfamily). We first studied the expression profile of BpTCP20 in response to salt stress in roots, stems, and leaves. In stems and leaves, BpTCP20 expression was induced after salt stress for 2 h, but reduced to the level before stress at 4 h, and was then significantly induced from 6 to 48 h, with the peak at 6 h (Supplementary Fig. S1A). This result indicated that the expression of BpTCP20 was altered strongly in the early stress period, but highly induced after stress for 6 h. In roots, the expression of BpTCP20 was significantly induced after salt stress for 6 to 48 h, reaching a peak at 9 h (Supplementary Fig. S1A). These results suggested that the expression of BpTCP20 responds to salt stress and might be involved in salt adaption in birch.
The coding sequence (CDS) of BpTCP20 (GenBank number: OK376636) comprises 804 bp, encoding a protein of 267 amino acids with a predicted molecular weight of 29.5 kDa. Phylogenetic analysis showed that BpTCP20 was most closely phylogenetically related to AtTCP20 and PtrTCP20, suggesting that they might share similar biological functions (Supplementary Fig. S1B). AtTCP20 is involved in plant nitrogen assimilation and participates in biological stress processes (Kim et al. 2014; Guan et al. 2017), suggesting that BpTCP20 might also be involved in abiotic stress. Multiple sequence alignment indicated that BpTCP20 contains a typical bHLH conserved domain, which is composed of a 16 amino acid basic domain and a 28 amino acid α-helical ring-α-helix region, belonging to Class I TCPs (PCF subclass) (Supplementary Fig. S1C).
Overexpression of BpTCP20 confers salt tolerance
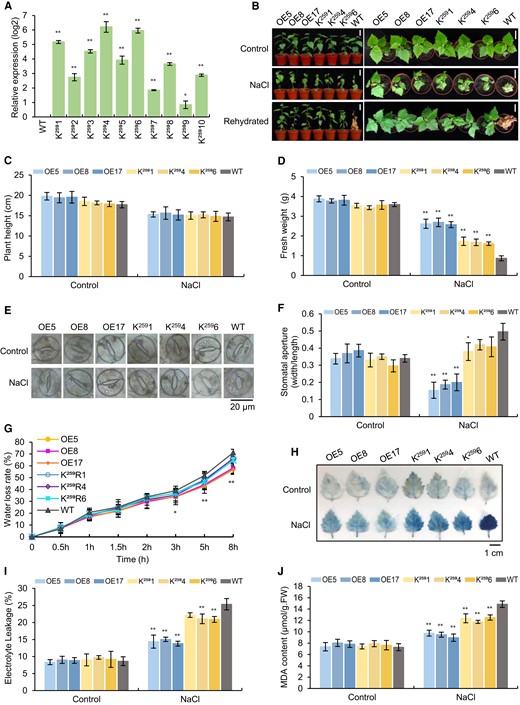
The plant lines with CRISPR-edited BpTCP20 (bptcp20), overexpression of BpTCP20 fused with Flag (OE), and RNAi-silenced BpTCP20 (SE) were generated, respectively. Sanger DNA sequencing was performed on the CRISPR-edited BpTCP20 (bptcp20) lines, and the DNA sequence of BpTCP20 in the bptcp20 lines is shown in Fig. 1A. Three lines were found to be mutated with bases inserted or missing. These mutations caused premature termination of BpTCP20 protein translation. Therefore, these three lines (termed as bptcp20-3, bptcp20-5, and bptcp20-9) were used for further study.
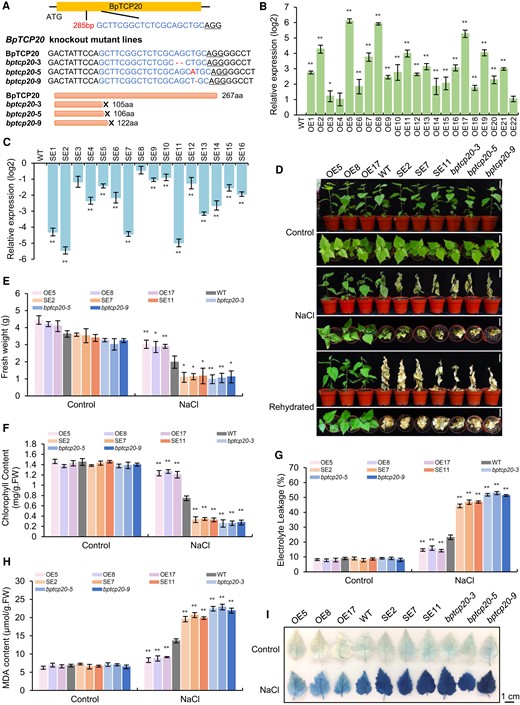
Generation of birch lines with knockout, knockdown, and overexpression of BpTCP20 and analysis of the salt tolerance mediated by BpTCP20. A) Analysis of the mutation of BpTCP20 (bptcp20) induced by CRISPR using Sanger DNA sequencing. The target sequence and insertion nucleotides had been indicated. B and C) The expression of BpTCP20 in different overexpression lines (OE) B) and RNAi-silenced lines (SE) C). The transcript level of BpTCP20 in the WT was set as 0 to calculate the relative expression of BpTCP20 in the OE and SE lines, and the expression was log2 transformed. >0 indicates the expression increased, <0 indicates the expression decreased. D) The growth phenotype of OE, WT, SE, and bptcp20 lines under control and salt stress conditions. Scale bar = 5 cm. E and F) Analysis of fresh weight E) and chlorophyll content F) of the OE, WT, SE, and bptcp20 lines. G–I) Analysis of electrolyte leakage determination G), MDA content H), and Evans blue staining I) of the OE, WT, SE, and bptcp20 lines. Scale bar = 1 cm. OE, birch plant lines overexpressing BpTCP20; SE, birch plant lines with RNAi-silenced BpTCP20; bptcp20, birch plants with mutated BpTCP20 induced by CRISPR/Cas; WT, wild-type plants. Control: the plants were grown under normal growth conditions. NaCl: treated with 200 mM NaCl for 15 d. Rehydration: After salt stress, the plants were watered well for 15 d. The error bar represents the standard deviation (SD) of three biological replicates. Each replicate contains 5 to 10 plantlets. * indicates statistically significant differences at P < 0.05 (t-test), ** indicates statistically significant differences at P < 0.01 (t-test) between the WT and other studied lines.
The expression of BpTCP20 in each OE and SE line were analyzed using RT-qPCR. BpTCP20 expression in the OE lines was significantly increased, while it was significantly reduced in the SE lines (Fig. 1B and C). Therefore, the OE lines with highest expression of BpTCP20 lines, including OE5, OE8, and OE17, and the SE lines with most reduced expression of BpTCP20 (SE2, SE7, and SE11) were selected for further study.
To analyze whether BpTCP20 is involved in salt tolerance, the OE, SE, bptcp20, and WT plants were treated with 200 mM NaCl for 15 days, and the plants from same lines treated with fresh water were used as controls. There was no significant (P-value <0.05) difference in growth phenotype among all the studied plants under normal growth conditions. Under NaCl stress conditions, the OE line plants had the highest fresh weight compared with the other studied plants, followed by the WT plants, with the SE and bptcp20 lines showing lower fresh weights relative to the WT plants (Fig. 1D and E). Moreover, after rehydration, the OE lines all grew well, while the other lines died (Fig. 1D). In addition, under salt stress conditions, the chlorophyll content of the OE lines was highest, followed by WT plants, and lastly by SE and bptcp20 lines; however, no significant difference among the studied lines were observed under control conditions (Fig. 1F). In addition, there was no difference in electrolyte leakage and the malondialdehyde content among the studied plants under control conditions (Fig. 1G and H). When exposed to salt stress conditions, both factors were highly reduced in the OE lines relative to the WT plants; meanwhile, both factors were significantly increased in all SE and bptcp20 lines compared with those in the WT plants. Consistent with the electrolyte leakage determination, Evans blue staining (Fig. 1I) showed that the OE lines had reduced cell membrane damage, whereas the SE and bptcp20 lines suffered increased cell membrane damage when compared with that of the WT plants under salt stress conditions. Together, these results indicated that BpTCP20 confers salt tolerance.
BpTCP20 reduces the stomatal aperture and water loss rate in plants
The water loss rate is closely related to osmotic stress tolerance; therefore, we further studied whether BpTCP20 could regulate the water loss rate. The results showed that the transcript level of BpTCP20 associated negatively with the water loss rate, suggesting that BpTCP20 confers salt tolerance via reduced water loss (Fig. 2A). The opening of the stomatal aperture is closely related to the water loss rate; therefore, we studied the stomatal pore. The results showed that OE lines had the lowest width/length ratio of the stomatal aperture, followed by WT plants, and lastly by all SE and bptcp20 lines (Fig. 2B and C). To study whether BpTCP20 can regulate the genes related to stomatal pore movement, two genes including Resistant to High Carbon Dioxide 1 (BpRHC1) and BpMYB61 that related to stomatal regulation were studied. The results showed that BpTCP20 induced the expression of BpRHC1 and BpMYB61 (Fig. 2D). Furthermore, chromatin immunoprecipitation (ChIP)-PCR indicated that BpTCP20 could bind to the promoters of both BpRHC1 and BpMYB61 (Fig. 2E). These results suggested that BpTCP20 positively regulates the expression of BpRHC1 and BpMYB61 by binding to their promoters to regulate the opening and closing of stomata.
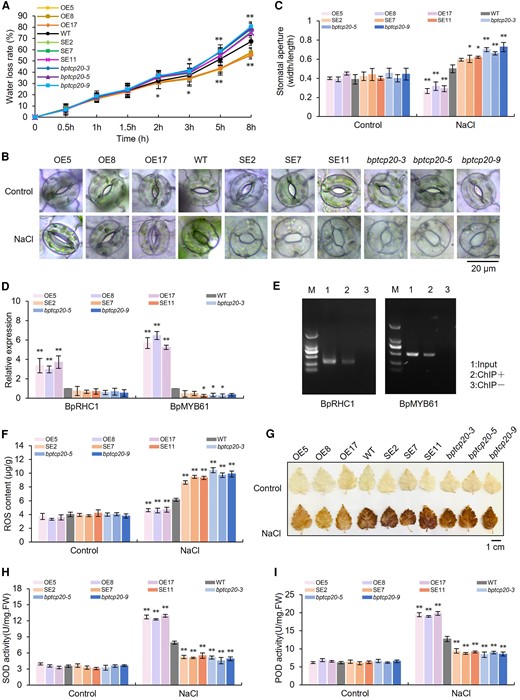
BpTCP20 regulates stomatal movement and ROS scavenging to facilitate salt tolerance. A) Comparison of the water loss rates among OE, SE, bptcp20, and WT plants. B) Stomata observation under control and salt stress condition. Scale bar = 20 μm. C) Determination of stomatal aperture opening by calculating the ratio of the length to the width of the stomatal aperture. D) Determination of the expression of genes related to stomatal regulation. The expression level of genes in WT plants was set as 1 to calculate the relative expression of genes in the other studied lines. E) Analysis of the binding of BpTCP20 to the promoters of BpRHC1 and BpMYB61 using chromatin immunoprecipitation PCR (ChIP-PCR). Input DNA was the positive control. ChIP− stands for negative control without antibodies. ChIP + represents the ChIP product with the Flag antibody. F and G) Analysis of reactive oxygen species (ROS) contents F) and DAB staining G) of the OE, WT, SE, and bptcp20 lines. Scale bar = 1 cm. H and I) Determination of the SOD H) and POD activity I) in the studied lines. OE, birch plant lines overexpressing BpTCP20; SE, birch plant lines with RNAi-silencing of BpTCP20; bptcp20, birch plants with mutated BpTCP20 induced by CRISPR/Cas; WT, wild-type plants. Control: the plants were grown under normal control growth conditions. NaCl: treated with 200 mM NaCl for 15 days. The error bar represents the SD of three biological replicates. Each replicate contains at least five plantlets. * indicates statistically significant differences at P < 0.05 (t-test), ** indicates statistically significant differences at P < 0.01 (t-test) between the WT and other studied lines.
BpTCP20 can mediate reactive oxygen species scavenging
Under control conditions, the reactive oxygen species (ROS) contents (total ROS), H2O2 contents, and 3,3′-diaminobenzidine (DAB) staining in the different studied lines were similar (Fig. 2F and G; Supplementary Fig. S2A). However, when exposed to salt stress conditions, the transcript level of BpTCP20 associated negatively with the ROS and H2O2 contents, suggesting that BpTCP20 can mediate ROS scavenging. In addition, we found that the OE lines had increased superoxide dismutase (SOD) and peroxidase (POD) activities relative to WT plants, while the SE and bptcp20 lines displayed reduced SOD and POD activities compared with those in the WT plants under salt stress condition (Fig. 2H and I). We further studied whether BpTCP20 could regulate the expression of SOD and POD genes. The results showed that the expression levels of SOD and POD genes were increased in the OE lines, whereas the SE and bptcp20 lines showed highly reduced expression levels of SODs and PODs (Supplementary Fig. S2B). These results suggested that BpTCP20 can induce the expression of SODs and PODs to increase the ROS scavenging capability, leading to reduced ROS accumulation under salt stress conditions.
BpTCP20 binds to different DNA motifs to regulate gene expression
We compared the expression of genes between the OE and WT plants using RNA-seq in response to salt stress. A total of 1,103 genes regulated by BpTCP20 were identified, including 375 upregulated genes and 728 downregulated genes (Supplementary Fig. S3A). These differentially expressed genes (DEGs) are shown in Supplementary Table S1. The upregulated genes were highly accumulated in the biological process (BP) category including “mitotic chromosome separation”, “cell cycle”, “organelle fission”, “movement of cell or subcellular component”, and “cellular carbohydrate catabolic process”. In the molecular function (MF) category, the upregulated genes were mainly involved in “DNA binding”, “transferase activity”, and “transferring acyl groups” (Supplementary Fig. S3B and Supplementary Table S2). Meanwhile, the downregulated genes in the BP category were distributed in “galactose”, “glutathione”, “sulfur compound metabolic process”, “cell differentiation”, and “cellular developmental process”. In the MF category, the downregulated genes were mainly involved in “galactosyltransferase activity”, “hexosyl groups transferase activity”, and “channel activity” (Supplementary Fig. S3C and Supplementary Table S2).
ChIP-seq was performed to identify the motifs bound by BpTCP20 and the target genes that are potentially directly regulated by BpTCP20. Input DNA was used as the control to eliminate the background. In total, 22.3% of the peaks were found to be distributed in the promoter region (−3 to 0 kb relative to the transcription start site), which might play important roles in gene expression regulation (Fig. 3A and B). In total, 9,609 genes potentially regulated by BpTCP20 were identified (Supplementary Fig. S4A). The conserved motifs were predicted from peaks using HOMER analysis. The results showed that there were 12 conserved motifs that are potentially bound by BpTCP20.
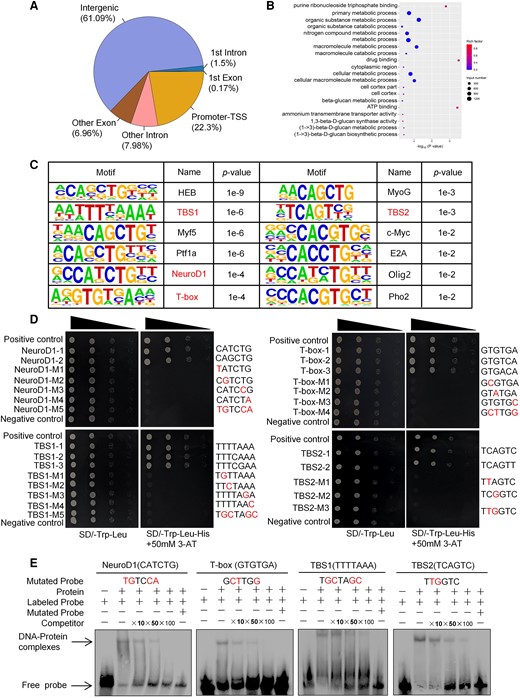
ChIP-seq analysis and determination of the DNA motifs bound by BpTCP20. A) Distribution of the peaks in different regions. Promoter-TSS: promoter transcription start site. B) GO analysis of the genes that were associated with the peaks according to the ChIP-seq data, and the BP annotation is shown. C) The conserved sequences identified using ChIP-seq. The conserved motifs TBS1, TBS2, NeuroD1 and T-box for further verifying their bindings by BpTCP20. D) Verification of the binding of BpTCP20 to the DNA motifs using the yeast one-hybrid assay. Dilutions of the transformed yeast (by 1×, 10−1×, 10−2×, 10−3×) were plated onto synthetic dextrose (SD)/-Leu/-Trp double drop out (DDO) and SD/-Leu/-Trp-His triple drop out medium (TDO) plates with 3-AT. Positive control: p53HIS2 + pGAD-Rec2-53. Negative controls: p53HIS2 + pGAD-BpTCP20. Mutated nucleotides are shown in red. M1-5: Mutation 1 to 5. E) EMSA validation of NeuroD1-1, T-box-1, TBS1-1, and TBS2-1 binding to BpTCP20. Mutated nucleotides are shown in red. + represents addition of the reagent on the same row; − represents absence of the reagent on the same row.
To determine whether the identified conserved motifs can be bound by BpTCP20, we randomly selected four motifs with different P-values for study, including two known motifs, NeuroD1 and T-box, and two unknown motifs that we termed as TCP binding sequence 1 (TBS1) and TCP binding sequence 2 (TBS2) (Fig. 3C). The motif TBS1 has three sequence types including TBS1-1 (TTTTAAA), TBS1-2 (TTTCAAA), and TBS1-3 (TTTCGAA). The other motif TBS2 has two types: TBS2-1 (TCAGTC) and TBS2-2 (TCAGTT). The NeuroD1 motif includes two types: NeuroD1-1 (CAGCTG) and NeuroD1-2 (CATCTG). T-box motif includes three types: T-box-1 (GTGTGA), T-box-2 (GTGTCA), and T-box-3 (GTGACA). Yeast one-hybrid assays were first performed to identify the binding of BpTCP20 to these motifs. The results indicated that BpTCP20 can bind to all of these motifs (Fig. 3D).
Then, the binding of BpTCP20 to these four DNA motifs was further verified using electrophoretic mobility shift assay (EMSA) (Fig. 3E). The probes for TBS1-1, TBS2-1, NeuroD1-1, and T-box-1, were biotin-labeled separately, and the same probes for the motifs without biotin were used as competitors. The EMSA results indicated the presence of retarded bands (DNA–protein complexes), and the signal intensities of the bands were decreased in the presence of increased unlabeled competitor probe. When no BpTCP20 protein interacted with the probe, no retarded band was observed. Together, these results indicated that BpTCP20 can specifically bind to these four motifs.
The genes directly regulated by BpPTC20
To determine the genes whose promoters BpTCP20 binds to differentially regulate them (direct regulation), joint analysis was performed on the RNA-seq and ChIP-seq data. There were 142 and 217 genes that were bound by BpTCP20 in their promoters and were also upregulated or downregulated, suggesting that these genes might be directly regulated by BpTCP20 (Supplementary Fig. S4A). To verify whether these genes were actually regulated by BpTCP20 binding to their promoters, ChIP-PCR and RT-qPCR were performed (Supplementary Fig. S4B and C). We selected 4 out of the 142 upregulated genes, including UDP-galactose flavonoid 3-O-galactosyltransferase 3A (BpUFGT3a), AP2/ERF transcription factor TINY (BpTINY2), Kinesin-like protein KIN-10B (BpKIN10), and Protein IQ-DOMAIN 6 (BpIQD6), and 4 out of the 217 downregulated genes, including UDP-glycosyltransferase (BpUDGP), BON1-associated protein (BpBON1), amino acid permease (BpAAP2), and suppressor of NH1-MEDIATED LESION 6 (BpSNL6) for verification. We designed primers to amplify the promoter regions of these eight genes (containing NeuroD1, TBS1, T-box, and TBS2 motifs), with lengths from 300 to 500 bp. At the same time, RT-qPCR was performed to study whether they can be regulated by BpTCP20 (Supplementary Fig. S4C). Consistent with the ChIP-seq data, BpTCP20 could bind to the promoters of these genes to significantly (P < 0.05) induce or inhibit their expression, which suggested that the ChIP-seq and RNA-seq data are reliable.
Acetylation of BpTCP20 induced by salt stress
To determine whether the function of BpTCP20 is modulated by acetylation modification, western blotting was performed. The OE plants overexpressing BpTCP20 fused with the Flag tag were treated with 200 mM NaCl for 0, 1, 3, 5, and 7 h, and nucleoproteins were isolated for analysis. Acetylation of BpTCP20 was detected using antiacetylation antibodies, and anti-Flag antibodies were used to quantify proteins and as the control (Fig. 4A). The results showed that acetylation of BpTCP20 occurred after stress for 1 h, kept increasing for 1 to 5 h, and then decreased thereafter. At the same time, the proteins were present at the same levels in the analysis. These results suggested that BpTCP20 is acetylated in response to salt stress.
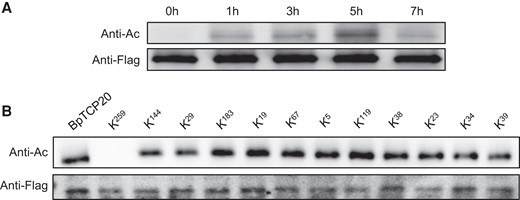
Determination of the acetylation modification of BpTCP20. A) BpTCP20 is acetylated during salt stress. B) Determination of the acetylation sites of BpTCP20. Western blotting was performed using antiacetylation antibodies (anti-Ac) to detect protein acetylation, and using anti-Flag (Anti-Flag) antibodies to determine the quantity of BpTCP20. The mutation constructs (KN) were transiently transformed into birch plants and the transformed plants were treated with 200 mM NaCl for 5 h and used for further study. KN indicates that the lysine (K) at the Nth residue was mutated into arginine.
To determine which amino acid residue is acetylated in BpTCP20, the 12 lysines that are potentially acetylated in BpTCP20 were mutated separately to arginine. These mutated BpTCP20 genes were cloned into vector pROK2 under the control of 35S CaMV promoter, and transiently transformed into birch. The transformed plants were treated with NaCl for 5 h, and then used for acetylation analysis (Fig. 4B). The BpTCP20 protein was used as control. Western blotting analysis showed that acetylation of BpTCP20 was eliminated when lysine at position of 259 (termed K259) was mutated to arginine, and the other lysine mutations failed to eliminate the acetylation modification. These results suggested that the acetylation modification occurred at lysine 259. BpTCP20 mutated at lysine 259 (termed BpTCP20259) was used for further study.
BpTCP20259 significantly reduces the capability of conferring salt tolerance
Ten birch lines overexpressing BpTCP20259 (termed K259 lines) were generated, and the expression levels of BpTCP20259 were detected using RT-qPCR. BpTCP20259 was expressed in all the transgenic lines (Fig. 5A). We selected three lines (K2591, K2594, K2596) with higher expression of BpTCP20259 for further study. The transgenic lines overexpressing K259, overexpressing BpTCP20 (OE), and the wild-type (WT) with the same growth phenotype were treated with 200 mM NaCl followed by rehydration (Fig. 5B). Under control conditions, there were no differences in growth among the studied plants. However, when exposed to salt stress, the OE lines displayed the best growth phenotype, followed by the K259 lines, and lastly by the WT plants. At the same time, there was no significant difference in plant height among all the lines (Fig. 5C). In addition, the OE lines showed significantly increased fresh weight, and a significantly reduced width/length ratio of the stomatal aperture, water loss rate, electrolyte leakage rate, and MDA contents relative to all K259 lines under salt stress. At the same time, the K259 lines displayed significantly fresh weight, and a significantly reduced width/length ratio of the stomatal aperture, water loss rate, electrolyte leakage rate, and MDA contents relative to all WT plants under salt stress (Fig. 5C–J). Further studies indicated that both the OE and K259 lines had significantly reduced ROS accumulation and H2O2 contents (Supplementary Fig. S5A–C), and significantly increased SOD and POD activities relative to the WT plants under salt stress (Supplementary Fig. S5D and E); however, the OE lines also had significantly reduced ROS accumulation and H2O2 content, and significant higher SOD and POD activities compared with those of the K259 lines under salt stress treatment (Supplementary Fig. S5A–E).
Analysis of the salt tolerance of the birch lines overexpressing BpTCP20259 (K259). A) The expression levels of BpTCP20259 in 10 K259 lines. Gene expression data were transformed by log2, and the value of the wild-type (WT) was set as 0: >0 indicates the expression increased compared with that in the WT plants. B) Analysis of the growth of OE (overexpressing BpTCP20), K259 (overexpressing BpTCP20259), and WT plants under control or salt stress conditions. Scale bar = 5 cm. C and D) Comparison of the plant height C) and fresh weight D) of all lines. E) Stomata aperture analysis. Scale bar = 20 μm. F) The ratio of the length of the stomata aperture. G) The water loss rate analysis. H–J) Analysis of Evans blue staining H), scale bar = 1 cm, electrolyte leakage rates I), MDA contents J) of the OE, K259 and WT. OE: birch plants overexpressing BpTCP20; K259: birch plants overexpressing BpTCP20259. WT: wild-type birch. Control: the plants were grown under normal growth conditions. NaCl: treated with 200 mM NaCl. Rehydration: after salt stress, the plants were watered well for 15 d. The error bar represents the SD of three biological replicates. * indicates statistically significant differences at P < 0.05, ** indicates statistically significant differences at P < 0.01 compared with the WT plants.
To study whether JA synthesis is influenced by the acetylation status of BpTCP20, the expression of JA synthesis genes was compared between the plants overexpressing BpTCP20 and plants overexpressing BpTCP20259 using RT-qPCR. The genes potentially involved in JA synthesis were selected from the birch genome for study, including allene oxide cyclase (BpAOC, homologous to At1g13280), lipoxygenase (BpLOX2, homologous to At3g45140), and allene oxide synthase (BpAOS, homologous to At5g42650). The results showed that their expression levels were similar between the plants overexpressing BpTCP20 and the plants overexpressing BpTCP20259 (Supplementary Fig. S6).
BpTCP20259 showed reduced regulation capability toward target genes and decreased binding capability for motifs
The BpTCP20259 mutation induced a decreased capability to confer salt tolerance; therefore, we further studied its regulation of the expression of stomatal regulator genes (BpRHC1 and BpMYB61), SODs, and PODs. The expression levels of these genes in the OE (overexpressing BpTCP20), K259 (overexpressing BpTCP20259), and WT plants were compared (Fig. 6A and B). The results showed that all the genes were highly induced in the OE lines and to a lesser extent in the K259 lines. This could explain why OE lines displayed a significantly reduced width/length ratio of the stomatal aperture and significantly elevated SOD and POD activities (Fig. 5E and F and Supplementary Fig. S5D and E). At the same time, the eight genes (Supplementary Fig. S4B and C) identified by joint analysis of the RNA-seq, and ChIP-PCR data were further studied. The expression levels of these eight regulated genes between K259 and OE lines were compared using RT-qPCR (Fig. 6C). The results indicated that BpTCP20 induced the expression of the eight regulated genes compared with that in BpTCP20259. We further compared the binding capacity with motifs between BpTCP20259 and BpTCP20 using dual luciferase reporter assays (Fig. 6D). The motifs bound by BpTCP20 were fused separately with the 35S minimal promoter to control the Luc gene, and were transiently transformed into plants. The results showed that the induction of Luc expression by BpTCP20259 was significantly reduced compared with that by BpTCP20 when binding to these motifs. In addition, we further compared the binding of the regulated gene promoters between BpTCP20259 and BpTCP20 using ChIP-qPCR (Fig. 6E). The results indicated that BpTCP20259 showed significantly reduced fold enrichment compared with that of BpTCP20.
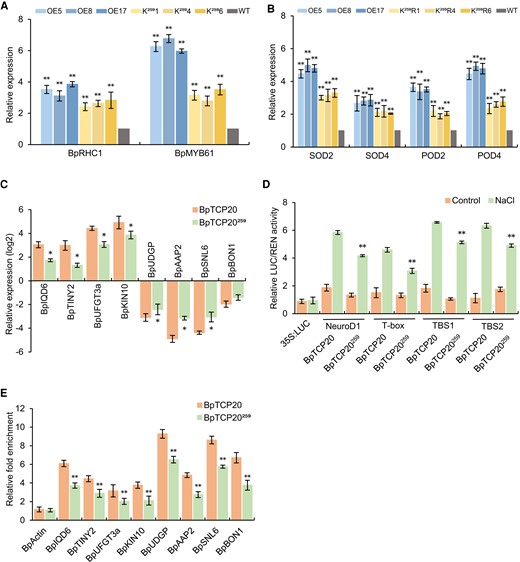
BpTCP20259 showed reduced capability for gene expression regulation and decreased binding to DNA motifs. A) Determination of the expression of genes related to stomatal regulation. B) Analysis of SOD and POD gene expression in transgenic lines under NaCl stress. The expression level of the target gene in the WT was set as 1. C) Comparison of the expression levels of eight regulated genes between BpTCP20259 and BpTCP20. D) Comparison of the transcriptional activation with DNA motifs between BpTCP20259 and BpTCP20 using dual luciferase reporter assays. E) Comparison of the affinity binding to the regulated genes promoters between BpTCP20259 and BpTCP20 using ChIP-qPCR. BpTCP20: birch plants overexpressing BpTCP20. BpTCP20259: Lysine of BpTCP20 at position of 259 was mutated to arginine to eliminate acetylation. OE: birch plants overexpressing BpTCP20; K259: birch plants overexpressing BpTCP20259. WT: wild-type birch. Control: the plants were grown under normal growth conditions. NaCl: treated with 200 mM NaCl. The error bar represents the SD of three biological replicates. * indicates statistically significant differences at P < 0.05, ** indicates statistically significant differences at P < 0.01 between WT and the other studied lines A, B), significant differences between the BpTCP20 and BpTCP20259 lines C, E), or significant differences between NaCl treatment and control D).
BpTCP20 interacts with BpPDCE23
To identify the protein that interacts with BpTCP20, plants overexpressing BpTCP20-Flag were employed, and the anti-Flag antibody was used for immunoprecipitation. After mass spectrometry detection, 88 proteins that potentially interacted with BpTCP20 were identified (Supplementary Table S3). Among the identified proteins, it was speculated that dihydrolipoyllysine-residue acetyltransferase component 3 of pyruvate dehydrogenase complex (BpPDCE23) serves as an acetyltransferase to acetylate proteins. BpTCP20 could be acetylated by salt stress; therefore, we further studied BpPDCE23.
To verify the interaction between BpTCP20 and BpPDCE23, yeast two-hybrid, pull-down, and Co-immunoprecipitation (Co-IP) assays were performed (Fig. 7A–C). These three experiments all indicated that BpTCP20 and BpPDCE23 could interact with each other. These results indicated that the interaction between BpTCP20 and BpPDCE23 actually occurs in birch.
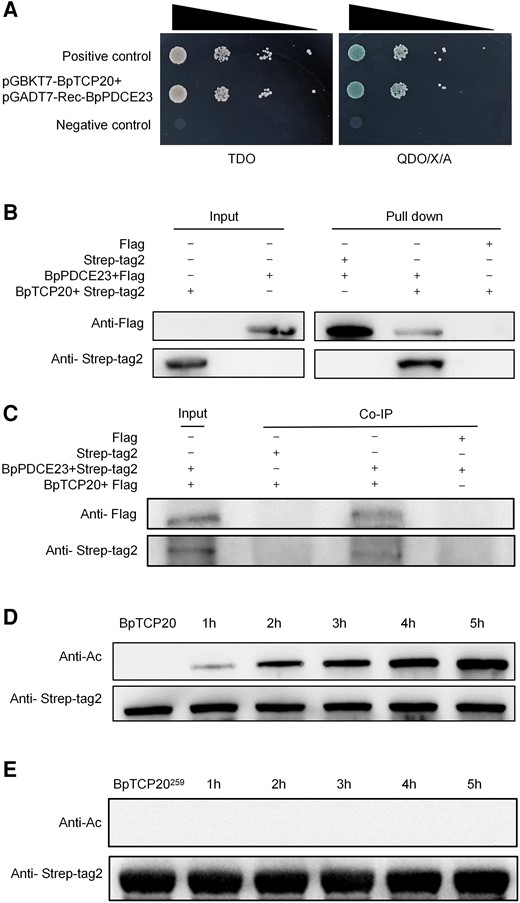
Identification of the BpTCP20 interacting protein. A) Yeast two-hybrid (Y2H) screening of BpTCP20 interactions with BpPDCE23. TDO: synthetic dextrose (SD)/-Leu/-Trp-His triple drop out medium; QDO/X/A: SD medium with -Leu/-Trp/-Ade/-His minimal media quadruple dropouts, and supplied with x-α-gal and Aureobasidin A (AbA) antibiotic. B) Pull-down analysis of the interaction between BpTCP20 and BpPDCE23 proteins. BpPDCE23 fused with a Flag tag (BpPDCE23 + Flag) and BpTCP20 fused with a Strep-tag2 (BpTCP20 + Strep-tag2) were prokaryotically expressed and purified. The two purified proteins were incubated together, and then anti-Flag antibody and anti-Strep-tag2 antibody, respectively, were used to immunoprecipitate their interaction partners. Western blotting was performed to detect the interaction partners using anti-Strep-tag2 antibody (for product immunoprecipitated by the anti-Flag antibody) and anti-Flag antibody (for product isolated by the anti-Strep-tag2 antibody). + represents addition of the reagent on the same row; − represents absence of the reagent on the same row. C) Co-IP experiment verifying the interaction between BpTCP20 and BpPDCE23 in birch. BpPDCE23 fused with a Flag tag (BpPDCE23 + Flag) and BpTCP20 fused with a Strep-tag2 (BpTCP20 + Strep-tag2) were cloned separately into plant expression vector pROK2 and transiently transformed into birch plants simultaneously for Co-IP. Input: the transiently transformed plants were analyzed by western blotting, respectively, using anti-Flag antibody and anti-Strep-tag2 antibody, and the results indicated that both BpPDCE23 + Flag and BpTCP20 + Strep-tag2 were expressed in birch. Co-IP: the transiently transformed plants were immunoprecipitated using anti-Flag or anti-Strep-tag2 antibodies, respectively. Then, western blotting was performed, and the product of immunoprecipitation using the anti-Strep-tag2 antibody was detected using the anti-Flag antibody and vice versa. D) Analysis of the acetylation by BpPDCE23 of BpTCP20. E) BpPDCE23 fails to acetylate BpTCP20259. 1, 2, 3, 4, and 5 h: The purified BpPDCE23 protein were incubated with BpTCP20 or BpTCP20259 for 1, 2, 3, 4, and 5 h, and used for western blotting. Anti-Ac: antiacetylation antibody used to detect protein acetylation by western blotting. Anti-Strep-tag2: anti-Strep-tag2 antibody used to determine the quantity of BpTCP20, which served as a control.
BpPDCE23 can acetylate BpTCP20
The BpPDCE23, BpTCP20, and BpTCP20259 proteins were prokaryotically expressed and purified. Purified BpPDCE23 was incubated with BpTCP20 or BpTCP20259 for 1, 2, 3, 4, and 5 h. After incubation, acetylation modification was detected using an antiacetylation antibody (Fig. 7D and E). Western blotting indicated that the acetylation of BpTCP20 was increased with the increase in incubation time, suggesting that BpPDCE23 can acetylate BpTCP20; however, BpPDCE23 failed to acetylate BpTCP20259. These results suggested that the interaction between BpPDCE23 and BpTCP20 results in BpTCP20 acetylation, and the lysine at position of 259 of BpTCP20 is the acetylation site.
Discussion
BpTCP20 confers salt tolerance
In the current study, we identified a transcription factor, BpTCP20, from birch, which is induced by salt stress, suggesting that it might play a role in salt tolerance. Birch plants overexpressing BpTCP20 displayed improved NaCl tolerance relative to WT plants. Meanwhile, birch plants knocked down and knocked out for BpTCP20 showed increased sensitivity to salt stress compared with the WT plants. In addition, the plants overexpressing BpTCP20, and plants knocked down and knocked out for BpTCP20, showed similar growth phenotypes to the WT plants under normal growth conditions (Fig. 1D), suggesting that alteration of the expression of BpTCP20 did not affect plant growth and BpTCP20 can confer salt tolerance to birch plants. Therefore, BpTCP20 is a good candidate gene for molecular breeding and to investigate salt tolerance mechanisms.
Acetylation of BpTCP20 is involved in its binding to DNA motifs and transcriptional regulation
Protein acetylation plays an important role in all domains of life, being mainly involved in transcriptional regulation (Sterner and Berger 2000). However, previous studies mainly focused on histone acetylation, which is involved in the opening or closing of chromatin to regulate the access of DNA-binding proteins (Chen et al. 2010; Liu et al. 2016; Yamamuro et al. 2016). However, there are few reports about TF acetylation or the function of acetylated TFs.
In the present study, we found that acetylation of BpTCP20 was induced by NaCl stress (Fig. 4A). Acetylated BpTCP20 also displayed increased transcriptional activity (Fig. 6A–D). In addition, we found that acetylated BpTCP20 could increase the enrichment of the truncated promoters bound by BpTCP20 (Fig. 6E). Together, these results suggested that acetylation of BpTCP20 enhances its binding affinity to DNA motifs, which contributes to the increased transcriptional activity of BpTCP20. Furthermore, we demonstrated that BpTCP20 interacts with BpPDCE23 (Fig. 7A–C), resulting in BpTCP20 acetylation (Fig. 7D). These results suggested that BpPDCE23 is a key activator of BpTCP20. Previously, TCP TFs were found to have other PTMs, e.g. TCP14 and TCP15 have O-GlcNAc modifications that facilitate cytokinin responses in leaves and flowers (Steiner et al. 2012). Whether BpTCP20 also has O-GlcNAc modification to facilitate abiotic stress tolerance requires further study.
TCP proteins were found to control leaf development via the JA signaling pathway (Danisman et al. 2012) and JA is also involved in immunity (Caarls et al. 2017). In the present study, the results showed that acetylation of BpTCP20 did not affect the expression of genes involved in JA synthesis (Supplementary Fig. S6), suggesting that acetylation of BpTCP20 does not influence JA synthesis and JA-related plant immunity.
BpTCP20 binds to different DNA motifs and mediates stomatal closure and ROS scavenging to improve salt tolerance
Previous studies showed that TCP proteins can bind to a consensus DNA sequence “G(T/C)GGNCCCAC”, especially to the core motifs “GG(A/T)CCC”, “GCCCR”, and “TGGGCC” (Li et al. 2005; Aggarwal et al. 2010; Viola et al. 2012; Danisman et al. 2013). In the present study, ChIP-seq showed that BpTCP20 might bind to 12 kinds of DNA motifs (Fig. 3C–E), but not to “G(T/C) GGNCCCAC” or its core motifs. In addition, joint analysis of ChIP-seq and RNA-seq data showed that BpUFGT3a, BpTINY2, BpKIN10, BpIQD6, BpUDGP, BpBON1, BpAAP2, and BpSNL6 could be directly regulated by BpTCP20 via binding to these DNA motifs (Supplementary Fig. S4B and C). These results suggested that unlike some previously studied TCP TFs, BpTCP20 mainly binds to NeuroD1, T-box, TBS1, and TBS2 to regulate its target genes, rather than binding to “G(T/C)GGNCCCAC” when mediating salt tolerance.
Plant stomata mediate CO2 influx from the atmosphere and also play a role in transpiration water loss (Kim et al. 2010). Transpiration accounts for most of the water loss in plants, which occurs through the stomatal apertures, and is closely related to drought and osmotic tolerance. Therefore, stomatal aperture control plays an essential role in drought and osmotic stress tolerance (He et al. 2022). In Arabidopsis, both AtRHC1 (At4G22790) and AtMYB61 (At1G09540) positively regulate the closure of the stomata (Liang et al. 2005; Tian et al. 2015). In the present study, we found that the expression levels of birch genes homologous to AtRHC1 and AtMYB61 (BpRHC1 and BpMYB61) were induced by BpTCP20 (Fig. 2D and E). These results suggested that BpTCP20 can positively modulate the closure of stomata, which contributes to improved salt tolerance by reducing water loss (Fig. 2A–C).
When they encounter adverse environments, plants will generate excess ROS. ROS play dual roles in abiotic stress, acting as signaling molecules at a low level, whereas at excess levels, they cause oxidative stress to damage macromolecules, such as proteins, RNA, lipids, and DNAs (Mittler 2017). Therefore, modulation of ROS to a relatively low level is important for plants to adapt to adverse environments (Zhang et al. 2011). Our results showed that BpTCP20 can induce the expression of SOD and POD genes (Supplementary Fig. S2B), correspondingly increasing the activities of SOD and POD (Fig. 2H and I). At the same time, ROS accumulation was reduced because of BpTCP20 overexpression (Fig. 2F and G and Supplementary Fig. S2A). Together, these results suggested that BpTCP20 can induce the expression of SODs and PODs to enhance the corresponding enzyme activities, which will increase the ROS scavenging capability to reduce ROS accumulation, leading to improved NaCl tolerance.
A working model of BpTCP20 in response to salt
Based on our findings and those of previous studies, we proposed a working model for BpTCP20 in the response to salt stress (Fig. 8). BpTCP20 expression is induced by salt stress, and the induced BpTCP20 then interacts with BpPDCE23 to form a complex, which promotes the acetylation of BpTCP20. Acetylation increases the binding affinity of BpTCP20 to DNA motifs, such as TBS1, NeuroD1, TBS2, and T-box, to activate the expression of genes whose promoters contain these motifs, such as BpRHC1, BpMYB61, SODs, and PODs. The induction of these genes contributes to reduced stomatal aperture opening to decrease water loss, and increases the ROS scavenging capability to decrease ROS accumulation, resulting in improved salt tolerance.

Working model of BpTCP20 in modulating salt stress. Salt stress induces the expression of BpTCP20, BpTCP20 then forms a complex with BpPDCE23, leading to acetylation of BpTCP20. Acetylated BpTCP20 binds to DNA motifs, such as NeuroD1, T-box, TBS1 and TBS2, which induces the expression of genes such as Resistant to High Carbon Dioxide 1 (BpRHC1), BpMYB61, SODs, and PODs. The regulation of these genes induces physiological changes, such as reduced stomatal aperture, improved ROS scavenging capability, and reduced cell membrane damage. Ultimately, these changes improve the salt tolerance of birch.
Materials and methods
Plant materials and growth conditions
Birch (B. platyphylla Suk) plantlets were initially grown in 1/2 Murashige and Skoog solid medium (pH 5.8) supplied with 20 g/L sucrose and 6 g/L agar in a tissue culture chamber at 24 °C, and a photoperiod of 12 h light/12 h darkness. The birch plantlets were then grown in a mixture of soil (soil:vermiculite:perlite; 7:2:1) in a greenhouse under the following conditions: a photoperiod of 16 h light/8 h dark, 23 °C, light intensity of 400 μmol/m2/s, and relative humidity of 65% to 75%. To study the expression patterns of BpTCP20, 200 mM NaCl solution was irrigated on the birch roots, and the plant materials (roots, stems, and leaves) were collected at 2, 4, 6, 9, 12, 24, and 48 h, respectively. Seedlings watered with fresh water were used as the control.
Reverse transcription quantitative PCR (RT-qPCR)
The total RNA of birch was extracted using a general plant total RNA extraction kit (Beijing Bioteke Co., Ltd., Beijing, China). Total RNA (2 µg) was reverse transcribed into cDNA using oligo(dT) as the primer with a PrimeScript RT kit (Takara Biomedical Technology, Shiga, Japan), and then diluted 10-fold as a template for the quantitative PCR (qPCR) step of the RT-qPCR protocol. The qPCR system comprised 10 µL of SYBR Premix Ex Taq (Takara), 2 µL of cDNA template, 0.5 µmol/L of each forward and reverse primer, in a total volume of 20 µL. The amplification procedure was as follows: 94 °C for 30 s, followed by 45 cycles of 94 °C for 10 s, 56 °C for 20 s, and 72 °C for 30 s. Three biological replicates were performed, and each replicate contains 5 to 10 plantlets. The relative expression levels were calculated using the 2−ΔΔCT method (Livak and Schmittgen 2001). The tubulin gene was used as the internal control. The GenBank numbers and primers of all genes studied are shown in Supplementary Table S4.
Generation of plants overexpressing, knocked out, and knocked down for BpTCP20
The CDS of BpTCP20 was fused with a Flag tag and constructed into vector pROK2 under the control of the 35S promoter (termed 35S:TCP20-Flag). For clustered regularly interspaced short palindromic repeats (CRISPR) editing (to knockout BpTCP20), the single guide RNAs (sgRNAs) for BpTCP20 were designed online (http://skl.scau.edu.cn). The gRNA sites with high efficiency for CRISPR-associated protein 9 (Cas9) cleavage were determined using the transient CRISPR/Cas editing in plants method (Wang et al. 2021), and cloned into pEgP237-2A-GFP (kanamycin resistance) for CRISPR editing (Osakabe et al. 2016). For RNA interference (RNAi)-mediated silencing of BpTCP20, a specific 200 bp sequence was cloned in the forward and reverse orientations into vector pFGC5941 to form an inverted repeat. The primers used are shown in Supplementary Table S5.
Genetic transformation was performed using Agrobacterium tumefaciens-mediated transformation of birch. In brief, the birch explants were soaked in Agrobacterium (EHA105) solution (OD600 = 0.5) for 5 min, cocultured on woody plant medium [WPM + 1 mg/L 6-benzylaminopurine (6 − BA) + 150 μmol/L acetosyringone + 3% sucrose, pH 5.8] for 3 d, and then transferred to adventitious bud induction medium [WPM + 1 mg/L 6 − BA + 50 mg/L kanamycin (for overexpression or CRISPR) or 2 mg/L glyphosate (for RNAi) + 200 mg/L carbenicillin + 200 mg/L cephalosporin, pH 5.8]. After the antibiotic-resistant adventitious buds grew to more than 1 cm in height, they were transferred to rooting medium for root generation [WPM + 0.2 mg/L 1-naphthylacetic acid + 50 mg/L kanamycin (for overexpression or CRISPR) or 2 mg/L glyphosate (for RNAi), pH 5.8].
The expression levels of BpTCP20 in overexpression lines (OE) and RNAi-silenced lines (SE) were determined using RT-qPCR. The primers used are shown in Supplementary Table S4. For CRISPR editing detection, primers (Supplementary Table S5) were designed to amplify the region containing the gRNA from chromatin, and the PCR products were sequenced using the Sanger method.
Physiological analysis
The studied plantlets grown in pot soil to the same height were classified into two groups, one was subjected to 200 mM NaCl stress for 15 d, and the other group was well watered, serving as the control. The growth of all plantlets was imaged and compared by the plant height and fresh weight. Subsequently, the plants of the stress group were subjected to rehydration treatment for 15 d.
For physiological analysis and RT-qPCR analysis, whole plants were harvested, each experiment had three biological replicates, and each replicate contains 5 to 10 plantlets. DAB staining was performed on detached birch leaves following the method of Bai et al. (2017) and Evans blue staining was performed according to the method of Zhang et al. (2011). The chlorophyll content, POD and SOD activities, MDA content, and electrolyte leakage rate were determined according to the methods of Zang et al. (2015). The ROS and H2O2 contents were determined using kits from the Nanjing Jiancheng Biological Company (Nanking, China). The stomatal observation and water loss measurements were carried out according to the description by Guo et al. (2017).
Yeast one-hybrid (Y1H) and yeast two-hybrid (Y2H) assays
For Y1H, the CDS of BpTCP20 was cloned into vector pGADT7-rec2 (pGADT7-rec2-BpTCP20). Three tandem copies of the studied motif sequences and their mutated versions were separately cloned into the pHIS2 vector. The primers used are shown in Supplementary Table S5. These two constructs were transformed into Saccharomyces cerevisiae strain 187 (Yeast Y187) cells together, according to the manufacturer’s protocol (BD Matchmaker Library Construction & Screening Kits User Manual; Takara Biomedical Technology). The clones were selected on SD/-His/-Leu/-Trp (TDO) medium supplemented with 30 mM 3-AT (3-amino-1, 2, 4-triazole), and grown on SD/-Leu/-Trp (DDO) medium as the control.
For Y2H, the CDS of BpTCP20 was cloned into vector pGBKT7, and the CDS of the interacting protein (BpPDCE23) were cloned into vector pGADT7-Res. The primers used are shown in Supplementary Table S5. Both the pGBKT7 and pGADT7-Rec constructs were cotransformed into yeast strain Y2H Gold yeast cells, and the yeast cells were spread on SD/-Ade/-His/-Leu/-Trp (QDO) medium containing X-α-Gal (40 mg/L) and Aureobasidin A (AbA) (70 ng/mL) at 30 °C and incubated for 3 d.
ChIP and RNA-seq
The OE line (overexpressing BpTCP20 and Flag fusion gene) and WT plants were treated with 200 NaCl for 6 h, and then whole plants were harvested for RNA-seq and ChIP-seq analysis. ChIP experiments were performed according to the method of Zhang et al. (2016) and Zhao et al. (2020). ChIP products were subjected to ChIP-seq analysis, and the input DNA was used to eliminate the background. The reads from ChIP-seq were aligned to the birch genome (Chen et al. 2021) using a local alignment model with the default parameters. The ChIP-seq analysis was carried out by Wuhan Seqhealth Technology Co., Ltd. (Wuhan, China). The ChIP-PCR thermal profile was as follows: 94 °C for 5 min; 35 cycles of 94 °C for 30 s, 58 °C for 30 s, and 72 °C for 30 s; and 72 °C for 10 min. The primers used for ChIP-PCR are shown in Supplementary Table S4. OE lines and BpTCP20259 lines were used for ChIP-qPCR, and the fold enrichment was calculated according to the method described by Haring et al. (2007). The primers used are shown in Supplementary Table S4.
For RNA-seq, the libraries were sequenced on the Illumina Novaseq platform (Illumina Inc., San Diego, CA, USA) to generate paired-end reads. Raw reads were initially processed using in-house Perl scripts to obtain the clean reads. The Q20, Q30, GC-content, and sequence duplication level of the clean reads were then analyzed. DEGs were identified according to an adjusted P-value ≤ 0.05. Gene Ontology (GO) analysis of the DEGs was performed using the GOseq R packages based on Wallenius noncentral hypergeometric distribution (Young et al 2010). The expression of DEGs (including BpUFGT3a, BpTINY2, BpKIN10, BpIQD, BpUDGP, BpBON1, BpAAP2, and BpSNL6) was analyzed using RT-qPCR, and the primers used are shown in Supplementary Table S4.
Binding of BpTCP20 to motifs and promoters
The 35S:BpTCP20 construct was used as an effector. Three tandem copies of the studied motifs were fused with the pGreenII0800-LUC vector as reporters. The primers used are shown in Supplementary Table S5. The different plasmid combinations were cotransformed into birch leaves. The 35S:Luc [luciferase (LUC) gene controlled by 35S promoter] construct was used as a control to normalize the efficiency of transformation. A dual luciferase assay kit (Sangon Biotech Co., Ltd., Shanghai, China) was used to determine the LUC activity, which is shown as a LUC/REN ratio.
For the EMSA, the CDS of BpTCP20 was fused with maltose binding protein in frame in vector PML-C5x [New England Biolabs (NEB), Ipswich, MA, USA]. The primers used are shown in Supplementary Table S5. The construct was transformed into E. coli strain ER2523 and purification of BpTCP20 was performed according to the instructions for the pMAL Protein Fusion & Purification System (NEB). The primers containing three tandem copies of the studied motifs (Supplementary Table S6) were synthesized and labeled with biotin as probes (Sangon Biotech Co., Ltd.). The same primers without biotin labeling amplified unlabeled probes as competitors. The recombinant BpTCP20 protein was incubated with the probes, and their bindings were determined using a Chemiluminescent EMSA kit (Beyotime, Jiangsu, China).
Acetylation of BpTCP20
The plants of the OE line were subjected to 200 mM NaCl treatment for 0, 1, 3, 5, and 7 h, and then harvested. The proteins were isolated using a Plant Western and IP cell lysate kit (Beyotime), and then divided into two aliquots; one was used for western blotting using anti-Flag antibodies (Beyotime), and the other was detected using an antiacetylation antibody (PTM BIO, Jiangsu, China). The proteins were separated using SDS-PAGE, and then transformed to polyvinylidene difluoride membranes (Millipore, Billerica, MA, USA). Five percent of skim milk was used for blocking prior to incubation with antiacetylation antibodies or anti-Flag antibody. Then, the membranes were incubated with horseradish peroxidase-conjugated secondary antibodies, followed by enhanced chemiluminescence (ECL) solution (Beyotime). The signals were detected using ECL prime (GE Healthcare, Chicago, IL, USA).
To determine the acetylation site of BpTCP20, the potentially acetylated sites were predicted. Point mutations of BpTCP20 were generated by gene splicing using overlap extension PCR, and then fused with a Flag tag and cloned into vector pROK2 under the control of the 35S promoter. The primers used are shown in Supplementary Table S7. Transient transformation was performed to generate birch overexpressing these mutated genes. The transient transformed plants were treated with NaCl for 5 h, and then used for acetylation analysis. The stable transformation of the acetylation site-mutated BpTCP20 was performed in the same way as the generation of birch plants overexpressing BpTCP20.
Co-IP analysis
To determine the protein interacting with BpTCP20, Co-IP was performed with the OE line. The plants were treated with 1.5% glutaraldehyde for protein crosslinking. The nuclear proteins were extracted using a CelLytic PN kit (Sigma-Aldrich, St. Louis, MO, USA). After releasing the nucleoprotein, 300 µL of anti-Flag antibody magnetic beads (Beyotime) was added, followed by immunoprecipitated at 4 °C for 6 h. The magnetic beads were washed five times according to the supplier’s instructions. The Co-IP product was eluted according to the supplier’s protocol (Beyotime), digested with trypsin, and analyzed using mass spectrometry [nanoliquid chromatography (LC)–tandem mass spectrometry (MS)] with an Eclipse LC/MS (Thermo Fisher Scientific, Waltham, MA, USA). The MS-identified peptide sequences were screened against a database of birch proteins using Mascot v. 2.2 (Matrix Science, Boston, MA, USA) to determine their CDSs. The CDSs identified by mass spectrometry were retrieved from the birch genome.
The OE line was used for Co-IP using the anti-Flag antibody. The CDS of the interacting protein (BpPDCE23) was fused with Strep-tag2 tag in frame and cloned into vector pROK2 for overexpression. The primers used are shown in Supplementary Table S5. The construct, together with 35S:BpTCP20-Flag, was transiently transformed into birch. After extraction of nuclear proteins, the proteins were divided into two aliquots. One was immunoprecipitated using the anti-Flag antibody, and the other was immunoprecipitated using the anti-Strep-tag2 antibody. For western blotting, the immunoprecipitation product from the anti-Flag antibody sample was detected using the anti-Strep-tag2 antibody; correspondingly, the immunoprecipitation product from the anti-Strep-tag2 antibody sample was detected using the anti-Flag antibody.
Pull-down assays and verification of BpTCP20 acetylation by BpPDCE23
The CDSs of BpTCP20 and BpPDCE23 were fused with a Strep-tag2 tag and Flag tag in frame, respectively, and cloned into the pMAL-c5X vector to generate BpTCP20-Strep-tag2 and BpPDCE23-Flag constructs. The primers used are shown in Supplementary Table S5. The purified proteins were incubated at 4 °C and 13×g for 2 h. Anti-Flag magnetic beads (300 µL) were added and incubated at 4 °C for 1 h. Then, the protein complex was eluted from the magnetic beads and subjected to western blotting using the anti-Flag antibody (Beyotime) and the anti-Strep-tag2 antibody (Abbkine, Wuhan, China) to detect the protein interaction.
To verify the acetylation of BpTCP20 by BpPDCE23, 100 μL of purified BpPDCE23 + Flag and BpTCP20+ Strep-tag2 proteins were taken and mixed with 1× binding buffer [50 mM Tris-HCl (pH 7.5), 100 mM NaCl, 0.25% Triton-X100 and 35 mM DTT], and then the mixture was incubated at 4 °C for 1, 2, 3, 4, and 5 h, respectively. The acetylation of BpTCP20 was detected using western blotting. The anti-Strep-tag2 antibody was used for western blotting to quantify the protein. Incubation of BpPDCE23 together with BpTCP20259 was used as a negative control. The primers used are shown in Supplementary Table S5.
Statistical analysis
SPSS 22 (IBM Corp., Armonk, NY, USA) software was used for the statistical analysis. Data were compared using Student's t-test. P < 0.05 indicates a significant difference and high significance was set at P < 0.01 (* P < 0.05 and ** P < 0.01 in the figures).
Accession numbers
Sequence data from this article can be found in the GenBank/EMBL data libraries under accession numbers shown in Supplementary Table S4.
Acknowledgments
We thank Prof. Vincent L. Chiang for the critical comments and editing.
Author contributions
Y.W. conceived and designed the experiments. Z.L. performed the experiments and wrote the article. X.S., Z.W., and M.Q. helped to collect the data. Y.W. complemented and revised the manuscript. C.G. and C.W. provided the valuable suggestions on the manuscript.
Supplementary data
The following materials are available in the online version of this article.
Supplementary Figure S1. Expression and bioinformatic analysis of the BpTCP20 gene.
Supplementary Figure S2. H2O2 content in all lines and BpTCP20 regulates of superoxide dismutase (SOD) and peroxidase (POD) genes.
Supplementary Figure S3. GO enrichment analysis of the differentially expressed genes (DEGs).
Supplementary Figure S4. Joint analysis of RNA-seq and ChIP-seq data and verification of the direct target genes regulated by BpTCP20.
Supplementary Figure S5. Analysis of the reactive oxygen species (ROS) scavenging capability of BpTCP20259.
Supplementary Figure S6. Analysis of the expression of jasmonic acid (JA) biosynthesis genes between plants overexpressing BpTCP20 and BpTCP20259.
Supplementary Table S1. RNA-seq was performed to determine the differentially expressed genes (DEGs) between the WT and BpTCP20 OE lines under salt stress conditions.
Supplementary Table S2. GO analysis of differentially expressed genes (DEGs) between the WT and BpTCP20 OE lines under salt stress conditions.
Supplementary Table S3. Eighty-eight proteins that potentially interact with BpTCP20 were identified using mass spectrometry.
Supplementary Table S4. The primers used in RT-qPCR, ChIP-PCR and ChIP-qPCR
Supplementary Table S5. The primers used to construct the vectors.
Supplementary Table S6. The probe sequences used in electrophoretic mobility shift assay (EMSA).
Supplementary Table S7. Lysine mutation site primers.
Funding
This work was financially supported by the National Natural Science Foundation of China (No. 31971684).
Data availability
Date available on request. The date underlying this article will be shared on reasonable request to the corresponding author.
Dive Curated Terms
The following phenotypic, genotypic, and functional terms are of significance to the work described in this paper:
References
Author notes
The author responsible for distribution of materials integral to the findings presented in this article in accordance with the policy described in the Instructions for Authors (https://dbpia.nl.go.kr/plphys/pages/General-Instructions) is: Yucheng Wang ([email protected]).
Conflict of interest statement. None declared.
