


Abstract
Revealing the genetic basis for stress-resistant traits in extremophile plants will yield important information for crop improvement. Zygophyllum xanthoxylum, an extant species of the ancient Mediterranean, is a succulent xerophyte that can maintain a favorable water status under desert habitats; however, the genetic basis of this adaptive trait is poorly understood. Furthermore, the phylogenetic position of Zygophyllales, to which Z. xanthoxylum belongs, remains controversial. In this study, we sequenced and assembled the chromosome-level genome of Z. xanthoxylum. Phylogenetic analysis showed that Zygophyllales and Myrtales form a separated taxon as a sister to the clade comprising fabids and malvids, clarifying the phylogenetic position of Zygophyllales at whole-genome scale. Analysis of genomic and transcriptomic data revealed multiple critical mechanisms underlying the efficient osmotic adjustment using Na+ and K+ as “cheap" osmolytes that Z. xanthoxylum has evolved through the expansion and synchronized expression of genes encoding key transporters/channels and their regulators involved in Na+/K+ uptake, transport, and compartmentation. It is worth noting that ZxCNGC1;1 (cyclic nucleotide-gated channels) and ZxCNGC1;2 constituted a previously undiscovered energy-saving pathway for Na+ uptake. Meanwhile, the core genes involved in biosynthesis of cuticular wax also featured an expansion and upregulated expression, contributing to the water retention capacity of Z. xanthoxylum under desert environments. Overall, these findings boost the understanding of evolutionary relationships of eudicots, illustrate the unique water retention mechanism in the succulent xerophyte that is distinct from glycophyte, and thus provide valuable genetic resources for the improvement of stress tolerance in crops and insights into the remediation of sodic lands.
Introduction
The world's population is expected to rise to approximately 9.7 billion by 2050, and global crop production will have to increase substantially to catch up with this population growth (Gupta et al. 2020). While climate patterns resulting from global warming have rapidly deteriorated and imposed frequent stresses, including drought and salinity, that can devastate crop productivity, posing a serious threat to the global food security (Scheelbeek et al. 2018; Gupta et al. 2020). Most varieties of major crops worldwide including rice (Oryza sativa) and wheat (Triticum aestivum) are extremely sensitive to these abiotic stress conditions (Scheelbeek et al. 2018). Achieving enhanced stress tolerance in major crops would present a breakthrough in crop breeding and food security. Exploring the genetic resources for stress tolerance is an important foundation for such breeding practices (Gong et al. 2020; Gupta et al. 2020). Given the limited genetic potential of stress tolerance in traditional crops, extremophile plants, which can survive in harsh environments due to their unique anatomies and/or metabolic pathways to cope with stresses, represent an important gene reservoir that can be applied to the improvement of stress tolerance in crops (Wang et al. 2007; Flavell 2016; Kazachkova et al. 2017; Eshel et al. 2022).
The Zygophyllaceae family represents the predominant group within the order Zygophyllales and mainly inhabits arid regions worldwide (Angiosperm Phylogeny Group IV 2016; Wang et al. 2018; Wu et al. 2018). The typical succulent xerophyte Zygophyllum xanthoxylum, a perennial shrub belonging to Zygophyllaceae, is an extant species of the ancient Mediterranean that colonizes desert areas in northwest China and Central Asia (Fig. 1A, Supplementary Fig. S1; Wang et al. 2004; Wu et al. 2011; Ma et al. 2012). This species plays a crucial role in protecting the fragile desert ecosystems by preventing sand drifts, wind erosion, and the further desertification (Wang et al. 2004), as well as provides fodder for livestock in local regions. In addition, it is one of the hosts for Cynomorium songaricum, a medicinal plant (Supplementary Fig. S2; Cui et al. 2013). Previous investigations demonstrated that Z. xanthoxylum exhibited an enhanced growth under drought conditions when supplied with moderate levels of salinity in the medium (Wu et al. 2011; Ma et al. 2012). This increased drought and salt tolerance can be attributed to an efficient osmotic adjustment closely related to higher Na+ accumulation in leaves for reducing the osmotic potential, and thus enhancing the water uptake and storage capacity in Z. xanthoxylum (Wang et al. 2004; Wu et al. 2011; Ma et al. 2012). As one of the most important mineral nutrients in plants, K+ plays crucial roles in numerous physiological processes, including osmotic adjustment (Wang et al. 2020). In most crop species, excessive accumulation of Na+ is toxic and accompanied by K+ deficiency (Raddatz et al. 2020; Rubio et al. 2020). By contrast, Z. xanthoxylum can maintain K+ homeostasis despite increased levels of Na+, seen as a critical adaptive strategy for surviving in high salinity (Wang et al. 2004; Wu et al. 2011; Ma et al. 2012, 2017; Hu et al. 2016). Another important trait is the well-developed leaf cuticle that protects Z. xanthoxylum from nonstomatal water loss in an arid environment (Zhao and Huang 1981; Liu et al. 2021). Studies on the molecular mechanisms underlying salinity and drought tolerance in Z. xanthoxylum are mainly focused on vacuolar Na+ compartmentation (Wu et al. 2011; Yuan et al. 2015), long-distance transport of Na+ and K+ (Ma et al. 2014; Hu et al. 2016), root K+ uptake (Ma et al. 2017), and cuticular wax accumulation (Liu et al. 2021). While some genes from Z. xanthoxylum have been shown to be involved in stress tolerance and applied in developing the forage cultivars with high yield, good quality and wide adaptability on saline, arid, and nutrient-deprived marginal lands (Bao et al. 2016; Kang et al. 2016; Liu et al. 2023a), a genome-wide study would better illustrate the comprehensive gene network that allows Z. xanthoxylum to cope with adverse environments.
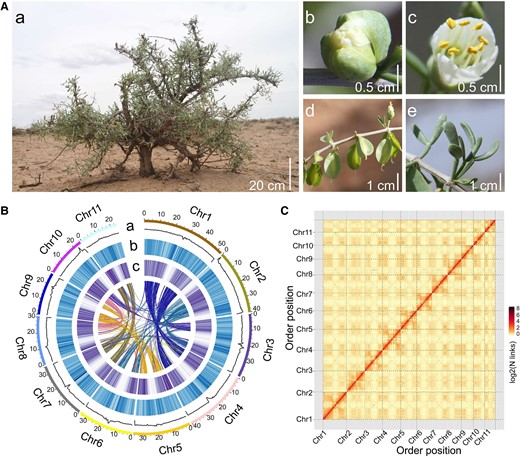
Morphology and genomic features of Z. xanthoxylum. A) The plant (a), bud (b), flower (c), capsule (d) and succulent leaf (e) of Z. xanthoxylum. B) Characteristics of the Z. xanthoxylum genome. The outermost ring of the circos plot represents 11 pseudochromosomes; (a to c) represents the distribution of GC density, repeat density, and gene density, respectively; central lines represent the links between syntenic genes. C) Hi-C interaction heatmap of Z. xanthoxylum. The color key of the heatmap ranging from light yellow to dark brown indicated the frequency of Hi-C interaction links from low to high.
Another important question that can be answered by a genomic analysis of Z. xanthoxylum is the controversial phylogenetic position of Zygophyllales among rosids. As a major clade in the angiosperms, rosids encompasses 17 orders and has been classified into fabids and malvids, except for the Vitales which are sister to the rest of rosids (Angiosperm Phylogeny Group IV 2016). After being recognized as a separate taxon, Zygophyllales was proposed to be the sister to the rest of fabids based on studies using three ribosomal or plastid genes (Soltis et al. 2000). However, Zygophyllales was embedded in Crossosomatales and the combined clade was sister to the remaining of rosids, according to the analysis of four mitochondrial genes (Qiu et al. 2010). While the analysis of 78 protein-coding genes from the plastid genome showed that Zygophyllales, Myrtales, and Geraniales formed a clade within malvids (Ruhfel et al. 2014). The phylogenetic position of Zygophyllales remains incongruent, even based on analyses using nuclear genes derived from transcriptomes of one or two Zygophyllales species. For instance, one study placed Zygophyllales in the malvids (Zhao et al. 2016), while another classified it as a clade that does not belong to either malvids or fabids (Liu et al. 2023b). A genome-wide data set can help resolve these conflicts by providing sufficient resolution to accurately reconstruct the phylogenetic relationships between related groups (Rokas et al. 2003).
In this study, a chromosome-level genome sequence of Z. xanthoxylum was presented. We further use this information to disentangle the phylogenetic position of Zygophyllales at whole-genome scale and dissect the molecular mechanisms that confer a strong water retention capacity in Z. xanthoxylum under desert habitats.
Results
Sequencing and assembly of the Z. xanthoxylum genome
We conducted a karyotype analysis and found 11 chromosome pairs (2n = 22) in Z. xanthoxylum (Supplementary Fig. S3). A k-mer depth frequency distribution analysis revealed a genome size of ∼492.28 Mb, consistent with assessment using flow cytometry (Supplementary Figs. S4 and S5), with an estimated repeat sequence ratio of ∼47.4% and a heterozygosity of 0.65% (Supplementary Fig. S4). By combining Nanopore, Illumina, and high-throughput chromatin conformation capture (Hi-C) technologies (Supplementary Fig. S6), we obtained an integrated assembly of 464.08 Mb with a scaffold N50 of 35.08 Mb and a contig N50 of 5.1 Mb (Supplementary Tables S1 to S4). Approximately 91% of the assembled genome was anchored into 11 pseudo-chromosomes (Fig. 1B and Supplementary Table S5). Hi-C interaction matrices displayed a distinct antidiagonal pattern for the intrachromosomal interactions (Fig. 1C), indicating a high accuracy of the Hi-C scaffolding at the pseudo-chromosome level. Evaluation of genome assembly completeness showed that 97.20% of Illumina short reads (approximately 240× genome coverage) and 96.42% of the RNA-seq data were mapped to the genome (Supplementary Tables S1 and S6). BUSCO (benchmarking universal single-copy orthologs; analyzed using embryophyta_odb10 database) and CEGMA (core eukaryotic genes mapping approach) completion scores were 94.18% and 97.82%, respectively (Supplementary Tables S7 and S8), indicating that the genome assembly of Z. xanthoxylum was of high quality.
Annotation of the Z. xanthoxylum genome
The combination of de novo, homology-based, and transcript-based approaches predicted 27,776 protein-coding genes with an average gene length, exon length, and intron length of 3,997, 1,592, and 2,405 bp, respectively (Supplementary Fig. S7 and Supplementary Table S9). Of these genes, 26,980 (97.13%) were annotated with putative functions (Supplementary Table S10). In total, 51.57% (239.31 Mb) of the genome sequence was identified as repeat sequences, of which about half consisted of Copia and Gypsy groups of long terminal repeats (LTRs) (Supplementary Table S11). The insertion time of LTRs was approximately 1.3 million years ago (Mya) (Supplementary Fig. S8), which is close to the estimated time (∼1.1 Mya) during which the paleoenvironment of the Badain Jaran Desert inhabited by Z. xanthoxylum transitioned from lacustrine phase to desert (Wang et al. 2015). In addition, 1,883 noncoding RNAs were annotated, including 111 microRNAs, 737 ribosomal RNAs, and 1,035 transfer RNAs (Supplementary Table S12).
Evolutionary and comparative genomic analysis
To address the phylogenetic position of the Zygophyllales, a set of 230 single-copy gene families were identified using genome data from plants belonging to 15 out of the 17 orders within rosids (Geraniales and Picramniales were lacked due to the absence of sequenced species in these two orders) (Supplementary Table S13). Since Zygophyllales has been debated as having a close relationship with Myrtales and Crossosomatales (Qiu et al. 2010; Ruhfel et al. 2014), we have chosen two representative species for Zygophyllales (Z. xanthoxylum and Tetraena mongolica) and Myrtales [pomegranate (Punica granatum) and (Rhodomyrtus tomentosa)]; while one representative (Euscaphis japonica) was selected from Crossosomatales as it is currently the only species with available sequencing data in this order. One representative was chosen from each of the other 12 orders. The phylogenetic tree constructed using both amino acid sequences and coding sequences generated consistent topology, which placed Zygophyllales as a sister to Myrtales with 100% bootstrap support, and their divergence time was 83 to 101 Mya (Fig. 2A, Supplementary Figs. S9 and S10). Furthermore, Zygophyllales and Myrtales formed a separated taxon as a sister to the clade comprising fabids and malvids (Fig. 2A, Supplementary Fig. S9). Crossosomatales were phylogenetically sister to all other rosids (Fig. 2A), which is consistent with the findings reported by Liu et al. (2023b). Moreover, Z. xanthoxylum diverged from T. mongolica approximately 28 Mya (Supplementary Fig. S10). There were 2,641 and 2,138 gene families in Z. xanthoxylum that experienced expansion and contraction, respectively, relative to the most recent common ancestor of Z. xanthoxylum and T. mongolica (Fig. 2A). Further, we found that 4,666 gene families commonly existed in these 17 species, and 266 gene families were unique in Z. xanthoxylum (Supplementary Fig. S11). GO analysis further revealed that the expanded and unique orthogroups were significantly enriched in the functional terms “transporter activity” and “transcription regulator activity” (Supplementary Figs. S12 and S13).
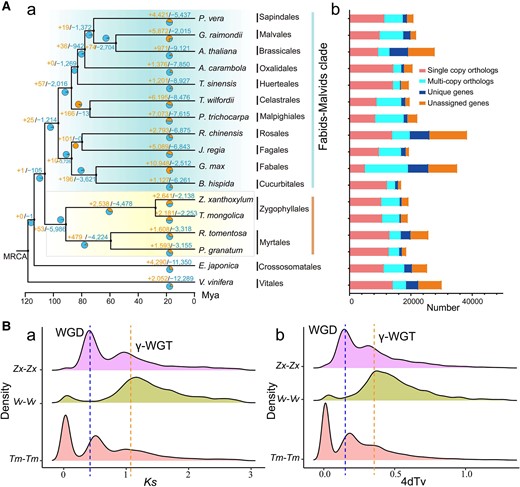
Evolutionary analysis of Z. xanthoxylum. A) A phylogenetic tree based on the amino acid sequences encoded by single-copy gene families from 17 species (a) and comparison of gene families (b). Positive and negative numbers on the branches in (a) represent expansion and contraction gene families, respectively. The stacked-column plots in (b) show the numbers of single-copy, multicopy, unique, and unclustered genes for each species. MRCA, most recent common ancestor; Mya, million years ago. B) WGD event in Z. xanthoxylum. The genome duplication in Z. xanthoxylum (Zx-Zx), V. vinifera (Vv-Vv), and T. mongolica (Tm-Tm) was revealed through synonymous substitution rate (Ks) (a) and 4-fold degenerate site transversion (4dTv) analysis (b). WGD,s whole-genome duplications; γ-WGT, a γ paleohexaploidization event in the core eudicot lineage.
Whole-genome duplications (WGDs) are commonly regarded as a major evolutionary force, and additional genetic material generated by WGD contributes to species diversification and enhances the adaptive plasticity of plants (Wu et al. 2020). Therefore, we analyzed WGD in the Z. xanthoxylum genomes. The 4-fold degenerate site transversion (4dTv) and synonymous substitution rate (Ks) showed that the peaks in Z. xanthoxylum displayed a clear bimodal feature (Fig. 2B), which implied at least two WGD events. The timing of the two WGDs were at Ks ∼ 0.4 and Ks ∼ 1, respectively (Fig. 2B). The latter of these time periods is consistent with the timing of a well-known γ paleohexaploidization (γ-WGT) event in the core eudicot lineage (Wu et al. 2020), the former indicated that Z. xanthoxylum shared a recent WGD event with T. mongolica, which implied that Zygophyllaceae likely undergone a WGD after ancient γ-WGT event. These inferences were confirmed by the synteny between Z. xanthoxylum and two subgenomes of T. mongolica (2n = 4x = 56) (Supplementary Fig. S14), the self-alignment plots of Z. xanthoxylum (Supplementary Fig. S15), and the chromosomal relationship between Z. xanthoxylum and grape (Vitis vinifera) (Supplementary Fig. S16).
Insights into the transport and homeostasis of Na+ and K+ in Z. xanthoxylum
Our previous investigations demonstrate that accumulating a high level of Na+ and K+ in succulent leaves for osmotic adjustment is one of the crucial physiological strategies of Z. xanthoxylum in adaptation to salt and drought stresses (Wang et al. 2004; Wu et al. 2011; Ma et al. 2012). In order to comprehensively understand the relevant molecular mechanisms, we analyzed the genes related to the transport of Na+ and K+ in Z. xanthoxylum by combining comparative genomic and transcriptomic analyses. As for the comparative genomic analysis with Z. xanthoxylum, we chose another Zygophyllales species T. mongolica that exhibits weaker osmotic adjustment capacity and drought tolerance than Z. xanthoxylum (Zhou et al. 2011; Shi et al. 2012), a Myrtales species R. tomentosa that has closer phylogenetic relationship with Z. xanthoxylum but weaker stress tolerance, as well as two halophytes [quinoa (Chenopodium quinoa), alkaligrass (Puccinellia tenuiflora)] and three glycophytes [Arabidopsis (Arabidopsis thaliana), poplar (Populus trichocarpa), V. vinifera] that displayed distant relationships with Z. xanthoxylum.
Using Na+ and K+ for osmotic adjustment is mainly accomplished by vacuolar compartmentation using tonoplast Na+(K+)/H+ antiporter NHXs, which are energized by vacuolar H+-ATPase (V-ATPase) and H+-pyrophosphatase (V-PPase) (Munns and Tester 2008; Raddatz et al. 2020). In Z. xanthoxylum, 10 NHX genes were identified, including seven tonoplast NHXs, which represent a larger family compared to the other seven species we investigated, including the halophytes C. quinoa and P. tenuiflora, and even T. mongolica (Fig. 3, A and B, Supplementary Table S14). Transcriptome analysis showed that the expression of all seven tonoplast NHX genes was induced in leaves by salt or drought treatments (Fig. 3C). Meanwhile, five genes encoding V-PPase were identified in Z. xanthoxylum (Fig. 3D). All but one of these genes were upregulated in leaves under salt treatment for 6 or 24 h (Fig. 3C). In addition, 53 V-ATPase encoding genes were identified in Z. xanthoxylum, a larger group than in the other plants including T. mongolica (Fig. 3, A and E). About 80% of these V-ATPases (43 genes) were induced by salt or drought treatments in leaves (Fig. 3C). These observations indicate an expansion and upregulated expression of genes involved in vacuolar Na+ and K+ compartmentation in Z. xanthoxylum under salt or drought treatments.

Analysis of genes related to vacuolar compartmentation of Na+ and K+ in Z. xanthoxylum. A) Number of genes encoding vacuolar NHX, V-PPase, and V-ATPase in different plants. Species abbreviations: Zx, Z. xanthoxylum; Tm, T. mongolica; Rt, R. tomentosa; Pt, P. trichocarpa; Vv, V. vinifera; Cq, C. quinoa; Pte, P. tenuiflora; At, A. thaliana. B) Phylogenetic relationship of NHXs in Z. xanthoxylum and A. thaliana. C) Expression patterns of genes encoding NHXs, V-PPase, and V-ATPase in leaves of Z. xanthoxylum under salt or drought treatments. The color bar at the bottom represents the normalized Z-score values of FPKMs. D to E) Phylogenetic relationship of V-PPase and V-ATPase subunits in Z. xanthoxylum and A. thaliana.
The K+ transporter HAK/KUP/KT (high-affinity K+/K+ uptake/K+ transporter) and shaker K+ channel families participate in Na+ and/or K+ transport (Raddatz et al. 2020). The HAK/KUP/KT family in Z. xanthoxylum exhibited an equivalent number as that in T. mongolica, and consisted of more members than in A. thaliana but fewer than in R. tomentosa, P. trichocarpa, V. vinifera, C. quinoa, and P. tenuiflora (Supplementary Table S14). Interestingly, all the phylogenetic analysis based on the amino acid or CDS sequences of HAK/KUP/KT family using neighbor-joining or maximum-likelihood method demonstrated that the Zygophyllales species Z. xanthoxylum and T. mongolica have undergone gene loss in cluster I (containing AtHAK5 that plays a crucial role in K+ uptake under low K+ conditions; Wang and Wu 2013) and cluster IV [containing ZmHAK4 from maize (Zea mays), PpHAK13 from spreading earthmoss (Physcomitrium patens), OsHAK17 from rice (O. sativa), and SlHAK20 from tomato (Solanum lycopersicum) that participate in Na+ transport; Wang et al. 2020] of HAK/KUP/KT family in comparison with R. tomentosa (Fig. 4, Supplementary Figs. S17 to S19). This result indicates that the two above clusters have probably lost in Zygophyllales after divergence from its common ancestor with Myrtales during evolution. As for the shaker K+ channel family, Z. xanthoxylum has 11 members (Supplementary Table S14). Among them, AKT1 (Arabidopsis K+ transporter 1) is an essential inward K+ channel that mediates root K+ uptake (Wang and Wu 2013). Notably, compared with one to three AKT1 orthologs in the other plants, including the halophyte P. tenuiflora with a strong selectivity for K+ over Na+ by roots (Wang et al. 2009), five AKT1 orthologs were found in Z. xanthoxylum and T. mongolica, indicating that the expansion of AKT1 may occur in the Zygophyllales. Interestingly, one AKT1 ortholog in chromosome 1 (Zx01G003345) of Z. xanthoxylum displayed intraspecies synteny with two others (Zx03G001136 in chromosome 3 and Zx04G002472 in chromosome 4), with the Ks ∼ 0.47 and Ks ∼ 0.36, respectively (Fig. 5, A and B, Supplementary Fig. S20 and Supplementary Table S15). Meanwhile, tandem duplications of AKT1s were found in chromosome 3 (Zx03G001136 and Zx03G001137) and chromosome 4 (Zx04G002472 and Zx04G002473) (Fig. 5A). These findings demonstrate that expansion of AKT1 can be attributed to the recent WGD and tandem duplication during evolution. Additionally, we identified a conserved motif that is present in four AKT1 orthologs in both Z. xanthoxylum and T. mongolica but is absent in R. tomentosa and the model plant A. thaliana (Supplementary Fig. S21). Furthermore, two AKT1 genes that were tandemly duplicated in chromosome 3 showed highly abundant transcripts in roots, where their expression was induced by salt or drought treatments (Fig. 5, C and D). These results suggest a stronger K+ uptake capacity in Z. xanthoxylum due to gene expansion and synchronized expression of AKT1s.
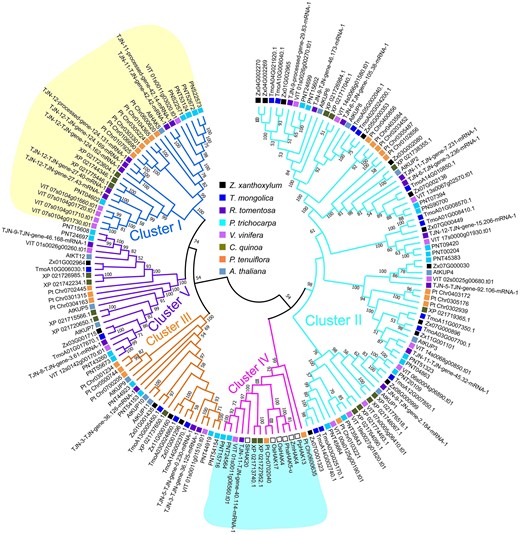
Phylogenetic relationship of HAK/KUP/KT family in different plants. Phylogenetic tree was constructed based on the amino acid sequences using neighbor-joining method. Bootstrap support values ≥50% are shown above the branches. The open square in the cluster IV represents the members involved in Na+ transport in the other plants; species abbreviations in front of genes marked by open square in cluster IV: Pp, P. patens; Pha, Phragmites australis; Zm, Z. mays; Os, O. sativa; Sl, S. lycopersicum.

Analysis of shaker K+ channel and CNGC families in Z. xanthoxylum. A) Phylogenetic relationship of shaker K+ channel gene family in Z. xanthoxylum and A. thaliana. Bootstrap support values ≥50% are shown above the branches. Tandem duplications of AKT1s in chromosome 3 (Zx03G001136 and Zx03G001137) and chromosome 4 (Zx04G002472 and Zx04G002473) were indicated by arrow. B) Number of genes encoding AKT1 and CNGC1 orthologs in different plants. Species abbreviations: Zx, Z. xanthoxylum; Tm, T. mongolica; Rt, R. tomentosa; Pt, P. trichocarpa; Vv, V. vinifera; Cq, C. quinoa; Pte, P. tenuiflora; At, A. thaliana.C) Expression patterns of five ZxAKT1 and nine ZxCNGC1 orthologs in the root, stem, and leaf. D) Expression patterns of three ZxAKT1 and seven ZxCNGC1 orthologs, which showed highly abundant transcripts in roots, under salt or drought treatments. The color bar at the bottom in (C) and (D) represents the normalized Z-score values of FPKMs. E) Phylogenetic relationship of CNGC family in Z. xanthoxylum and A. thaliana. Bootstrap support values ≥50% are shown above the branches. Tandem duplications of three CNGC1s in chromosome 6 were indicated by arrow.
Cyclic nucleotide-gated channels (CNGCs) function in the transport of cations in plants (Jarratt-Barnham et al. 2021). We found that the CNGC family contained 24 orthologs in Z. xanthoxylum, which is more than in other species, including another Zygophyllales species T. mongolica and the halophyte P. tenuiflora (Supplementary Table S14). In particular, nine CNGC1 orthologs were identified in Z. xanthoxylum, whereas only one to three were found in the other seven species we investigated, even T. mongolica (Fig. 5, B and E), indicating the expansion of CNGC1 orthologs only occurs in Z. xanthoxylum. Three CNGC1 orthologs (Zx06G000895, Zx06G000896, and Zx06G000897) showed tandem duplication in chromosome 6 (Fig. 5E), and 1 ortholog (Zx06G000895) displayed intraspecies synteny with another ortholog (Zx02G002526) in chromosome 2, with Ks ∼ 0.55 (Supplementary Fig. S20 and Supplementary Table S15), indicating that expansion of CNGC1s was associated with tandem duplication and the recent WGD event. In addition, all the nine ZxCNGC1s contained similar motifs with orthologs from T. mongolica, R. tomentosa, and A. thaliana (Supplementary Fig. S22). The transcriptome analysis showed that seven of these nine ZxCNGC1s were mainly expressed in roots and induced by salt or drought treatments (Fig. 5, C and D).
We then performed a functional analysis of two ZxCNGC1 orthologs (named ZxCNGC1;1 and ZxCNGC1;2), which showed the higher levels of expression in roots of Z. xanthoxylum (Supplementary Fig. S23). ZxCNGC1;1 was found to be localized to the plasma membrane and its encoding gene was expressed mainly in the epidermis and cortex cells of roots (Supplementary Fig. S24). The transcript abundance of ZxCNGC1;1 in roots peaked at 6 or 24 h under 100 or 50 mM NaCl, respectively (Supplementary Fig. S25). Surprisingly, the Na+-extruding ATPase-deficient yeast strain G19 expressing ZxCNGC1;1 or ZxCNGC1;2 exhibited growth inhibition compared to control cells transformed with empty vector under salt stress, implying that ZxCNGC1;1 and ZxCNGC1;2 may function in Na+ transport (Fig. 6A). In contrast, the expression of rice CNGC1 (OsCNGC1) failed to alter salt tolerance of yeast cells, suggesting that OsCNGC1, like some other CNGC members in Arabidopsis (Pan et al. 2019; Tian et al. 2019), does not mediate Na+ transport (Fig. 6A). While the expression of ZxCNGC1;1 or ZxCNGC1;2 did not complement the K+ transport deficiency of CY162 yeast cells on AP medium containing 0.2 to 5 mM K+ (Fig. 6B), indicating that ZxCNGC1;1 and ZxCNGC1;2 may not transport K+.

Functional analysis of ZxCNGC1;1 and ZxCNGC1; 2 in yeast and HEK 293T cells. A) Na+ transport activity in Na+-sensitive yeast strain G19. B) K+ transport activity in K+-uptake-deficient yeast strain CY162. C) Representative Na+ currents measured in HEK293T cells. D) Current–voltage curves of recordings from HEK293T cells in bath solution containing 140 mM Na-gluconate. E) Representative K+ currents measured in HEK293T cells. F) Current–voltage curves of recordings from HEK293T cells in bath solution containing 14.5 mM KCl. Data in (D) and (F) represent mean ± standard deviation (Sd) of 11 to 18 biological replicates; statistically analyzed using a Student's t test, *P < 0.05 and **P < 0.01.
To confirm the yeast complementation results, we used patch-clamping to directly measure Na+ permeability of ZxCNGC1;1, ZxCNGC1;2, OsCNGC1 and Arabidopsis AtCNGC1 expressed in human embryonic kidney (HEK) 293T cells. AtCNGC1 did not show detectable Na+ current above the mock control, while ZxCNGC1;1, ZxCNGC1;2 and OsCNGC1 were all permeable to Na+ (Fig. 6, C and D). In addition, ZxCNGC1;1, ZxCNGC1;2, OsCNGC1 and AtCNGC1 were all permeable to Ca2+ and Mg2+, but not K+ (Fig. 6, E and F, Supplementary Fig. S26). It is worth noting that ZxCNGC1;1 and ZxCNGC1;2 conducted inward Na+ currents at voltages up to −120 mV (Fig. 6D). However, OsCNGC1 only elicited significant inward Na+ current at more negative voltage (−180 mV) (Fig. 6D). The inward Na+ currents in HEK293T cells expressing ZxCNGC1;1 or ZxCNGC1;2 were two to five times larger than that in OsCNGC1-expressing cells at −180 mV (Fig. 6D), indicating a much higher capacity for ZxCNGC1s to mediate Na+ influx than OsCNGC1. These results reveal a function for ZxCNGC1;1 and ZxCNGC1;2 in root Na+ uptake in Z. xanthoxylum, which possibly contributes to the well-known Na+ accumulation in this desert plant.
The CBL (calcineurin B-like)–CIPK (CBL-interacting protein kinases) signaling pathways are critical for the control of transport activities in plants, including Na+ and K+ transport (Tang et al. 2020). Z. xanthoxylum and T. mongolica contain 16 CBLs (Supplementary Table S14), including four CBL10 orthologs, whose homolog regulates transporters for vacuolar Na+ compartmentation in A. thaliana (Tang et al. 2020); while the other six species we investigated only contain one to two CBL10 orthologs (Supplementary Fig. S27, A and B). The number of CBL2 and CBL4 orthologs, which regulate vacuolar H+-ATPase and the plasma membrane Na+/H+ antiporter SOS1 involved in root-to-shoot transport of Na+ in Z. xanthoxylum (Ma et al. 2014; Tang et al. 2020), respectively, was also larger than in the other plants except for T. mongolica and P. trichocarpa (Supplementary Fig. S27B). As for CIPKs, Z. xanthoxylum contains a much larger number of orthologs compared to the other six plants with exception of T. mongolica (Supplementary Fig. S27C and Supplementary Table S14), and about 70% of them (30 genes) were induced under salt or drought treatments (Supplementary Fig. S28). These findings indicate that Z. xanthoxylum has evolved an elaborate CBL–CIPK network for modulating Na+/K+ transport.
Insights into the abundant formation of cuticular wax in Z. xanthoxylum
In addition to osmotic adjustment for maintaining a strong water storage capacity, the thicker cuticle on the aerial surfaces of Z. xanthoxylum leaves, mainly composed of cuticular wax, acts as a vital barrier against nonstomatal water loss in desert environments (Zhao and Huang 1981; Liu et al. 2021). Therefore, we subsequently analyzed the genes associated with the synthesis of cuticular wax by combining comparative genomic and transcriptomic analyses. Considering the increase in cuticular wax loads during the evolutionary transition from algae to land plants, which results in the formation of cuticles with enhanced moisture retention properties (Kong et al. 2020), we chose three sporophytes (Chara braunii, Marchantia polymorpha, Selaginella moellendorffii), three mesophytes (R. tomentosa, V. vinifera, A. thaliana), and two other xerophytes (T. mongolica and Ammopiptanthus nanus) for the comparative genomic analysis with Z. xanthoxylum.
Cuticular wax is generated by very-long-chain fatty acid elongation and modification in the endoplasmic reticulum, which is then transported to the surface of epidermal cells (Fig. 7A). We found that the LACS (long-chain acyl-CoA synthetase) family, which catalyzes the conversion of C16/C18 fatty acids to C16/C18 acyl-CoAs, only contains 1 ortholog in three sporophytes, but is expanded to seven to nine orthologs in three mesophytes and further to 11 to 14 orthologs in the xerophytes Z. xanthoxylum, T. mongolica, and A. nanus (Fig. 7, B and C). The KCS (β-ketoacyl-CoA synthase) family, a component of FAE (fatty acid elongase) complexes that catalyze the elongation of C16/C18 acyl-CoAs to VLC acyl-CoAs, is expanded to 25 orthologs in Z. xanthoxylum, more than in the other species we investigated, even another Zygophyllales species T. mongolica that possesses thinner cuticle layer on the leaf surfaces than Z. xanthoxylum (Wu et al. 1998; Zhou et al. 2011) (Fig. 7C, Supplementary Fig. S29). Meanwhile, three and two orthologs of HCD (β-hydroxyacyl-CoA dehydratase) and ECR (enoyl-CoA reductase), two other components of FAE complexes, were identified in Z. xanthoxylum, respectively, which are more than in the other plants (Fig. 7C). As well, two to three CER2-LIKE genes involved in the elongation of C28 and beyond VLC acyl-CoAs were identified in six seed plants, but were absent in sporophytes we investigated (Fig. 7C), suggesting that wax biosynthesis genes CER2-LIKE originated in seed plants, which is consistent with a previous report (Kong et al. 2020). In addition, compared with one to seven orthologs in the other seven plants, eight CYTB5 orthologs that participate in the conversion of VLC acyl-CoAs to alkanes were identified in Z. xanthoxylum (Fig. 7, C and D). Among the above expanded gene families, 10 LACSs, 23 KCSs, all the HCDs and ECRs, as well as seven CYTB5s were induced by salt or drought treatments (Fig. 7E, Supplementary Fig. S30). The expression of other core genes involved in the biosynthesis or transport of cuticular wax, including two CER1, three CER3, six FAR, one ABCG12, and two ABCG11 genes in leaves were also upregulated under these treatments (Supplementary Fig. S30).

Characterization of genes or gene families related to biosynthesis or transport of cuticular wax in Z. xanthoxylum. A) Pathway of cuticular wax biosynthesis and transport. B) Phylogenetic relationship of LACS family in different plants. C) The number of LACS, KCS, HCD, ECR, CER2-LIKE, and CYTB5 orthologs in different plants. Species abbreviations: Zx, Z. xanthoxylum; Tm, T. mongolica; An, A. nanus; Rt, R. tomentosa; Vv, V. vinifera; At, A. thaliana; Sm, S. moellendorffii; Mp, M. polymorpha; Cb, C. braunii. D) Phylogenetic relationship of CYTB5 orthologs in different plants. In (B) and (D), bootstrap support values ≥50% are shown above the branches; species abbreviations in front of genes: Zx, Z. xanthoxylum; At, A. thaliana; Sm, S. moellendorffii; Mp, M. polymorpha; Cb, C. braunii. E) Expression patterns of LACS, KCS, and CYTB5 genes in leaves of Z. xanthoxylum under salt or drought treatments. The color bar at the bottom represents the normalized Z-score values of FPKMs.
Discussion
Zygophyllales is a sister taxon to Myrtales rather than a member of fabids or malvids
Clarifying the relationships among major subclades of plants can contribute to a better understanding of plant diversification patterns and the evolution of key traits (Li et al. 2019). The phylogenetic position of Zygophyllales has long been controversial, based on the analyses of a few plastid, mitochondrial and ribosomal genes, or nuclear genes derived from transcriptome data in previous investigations (Soltis et al. 2000; Qiu et al. 2010; Ruhfel et al. 2014; Angiosperm Phylogeny Group IV 2016; Zhao et al. 2016; Liu et al. 2023b). Genome-scale analysis has become a gold standard for clarifying phylogenetic relationships (Rokas et al. 2003), yet the phylogenetic position of Zygophyllales has not been identified at whole-genome scale. In this study, we constructed a high-quality chromosome-scale genome map of a Zygophyllales species Z. xanthoxylum, with the size of 464.08 Mb harboring 27,776 protein-coding genes (Supplementary Tables S4 and S9), and found a specific insertion event of LTR (Supplementary Fig. S8), which play a crucial role in the modification and reorganization of plant genomes (Zhang and Gao 2017). Notably, the phylogenetic analysis based on this whole genome information indicated that Zygophyllales and Myrtales form a separated taxon as a sister to the clade comprising fabids or malvids (Fig. 2A, Supplementary Fig. S9). This finding clarifies the phylogenetic position of Zygophyllales, and thus boosts the understanding of evolutionary relationships of eudicots at the order level and lays an important foundation for the comparative genomics analysis of eudicots in the future.
Z. xanthoxylum has evolved an elaborate system for energy-conserving osmotic adjustment in the succulent leaves
Succulence is one of the most successful adaptative traits in xerophytes for maintaining a favorable water status (Munns and Tester 2008). As a typical succulent xerophyte, Z. xanthoxylum features leaves with enlarged, highly vacuolated cells (Wu et al. 2011; Ma et al. 2012). Previous studies demonstrated that under salt condition, Z. xanthoxylum accumulates a large quantity of Na+ in the vacuoles of mature leaf cells, as a beneficial osmolyte to maintain strong water storage capacity, increase turgor pressure and enhance photosynthesis (Janz and Polle 2012; Ma et al. 2012). Interestingly, water deficit also induces a significant increase in Na+ concentration for osmotic adjustment in leaves of Z. xanthoxylum (Ma et al. 2012). Moreover, distinct from most crop species in which excessive accumulation of Na+ leads to K+ deficiency (Kronzucker et al. 2013; Raddatz et al. 2020), Z. xanthoxylum can maintain K+ homeostasis in leaves despite increased levels of Na+ under salt and drought stresses (Wu et al. 2011; Ma et al. 2012, 2017; Hu et al. 2016). In most crops, a variety of organic solutes are highly accumulated, which contributes to osmotic adjustment in cells under stress conditions (Munns and Tester 2008). Nevertheless, the biosynthesis of organic solutes comes with much higher energy cost (over 10-fold) than the accumulation of Na+ and K+, and diverts carbon and nitrogen from the supply of assimilates for growth processes, potentially imposing limitations on plant growth (Raven 1985; Munns and Tester 2008; Munns et al. 2020a, 2020b). It is worth noting that the accumulation of organic osmolytes has been shown to decrease in response to salinity in Z. xanthoxylum, indicating that high levels of Na+ and K+ serve as “cheap” osmolytes to partially replace organic solutes for osmotic adjustment in leaves (Cai et al. 2011; Janz and Polle 2012; Ma et al. 2012). This feature conserves energy as well as carbon and nitrogen resources in Z. xanthoxylum and prevents a potential growth penalty. The expansion of tonoplast NHX and V-ATPase gene families (Figs. 3 and8, Supplementary Table S14) and their upregulated expression patterns under salt or drought treatments (Fig. 3C) may explain the efficient vacuolar compartmentation of Na+ and K+, two energy-conserving osmolytes, and thereby the strong water storage capacity in succulent tissues of Z. xanthoxylum.
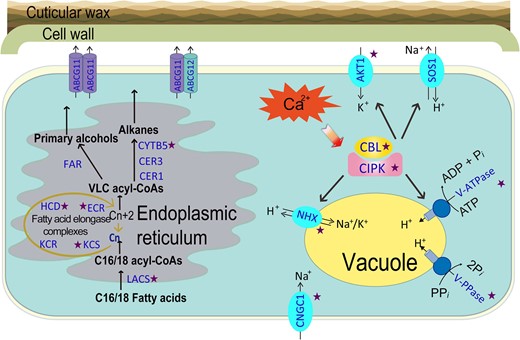
Schematic diagram of the transport and homeostasis of Na+ and K+ and the formation of main components of cuticular wax in the cell of Z. xanthoxylum. The star beside the gene name indicates that the number of orthologs in Z. xanthoxylum was higher than in A. thaliana. The genes are highlighted in blue with capital abbreviations. Refer to the text for an explanation of genes depicted.
The high accumulation of vacuolar Na+ and K+ in succulent leaves is supported by strong root uptake (Yuan et al. 2015). In Z. xanthoxylum, the expansion of ZxCNGC1s with an upregulated expression pattern in roots responding to salt or drought treatments (Figs. 5, B to E and 8) can enhance the Na+ uptake capacity (as discussed in detail below). As for K+ uptake, although cluster I KUP/HAK/KTs containing AtHAK5 was absent, an obvious expansion in AKT1 was observed in Z. xanthoxylum (Figs. 4 and 5A, Supplementary Figs. S17 to S19). One member (Zx03G001136) with induced expression under salt or drought treatments in roots (Fig. 5D) has been proven to be essential for K+ uptake and K+/Na+ homeostasis in Z. xanthoxylum (Ma et al. 2017). It was shown that AKT1 contributes to both high- and low-affinity K+ uptake, while AtHAK5 only operates as a high-affinity K+ uptake system under K+-deficient conditions (Wang and Wu 2013). Therefore, the expansion and synchronized expression of these AKT1s in Z. xanthoxylum might compensate for the lack of HAK5, and moreover, provide a stronger K+ uptake capacity by roots.
In addition to Na+ and K+ transporters/channels, the CBL–CIPK signaling network plays a crucial role in modulating the compartmentation and transport of Na+ and K+ in plants (Tang et al. 2020). A single CBL–CIPK pair is typically present in green algae, with a remarkable expansion of CBLs and CIPKs in early land plants (Kleist et al. 2014). Notably, a substantial expansion in CBLs and CIPKs was observed in the xerophytes Z. xanthoxylum and T. mongolica (Fig. 8, Supplementary Fig. S27 and Supplementary Table S14), consistent with the viewpoint that expansion of the CBL–CIPK system corresponds with the evolution of land plants and adaptation to challenging habitats (Kleist et al. 2014; Tang et al. 2020). Moreover, the expression of most CIPKs in Z. xanthoxylum was induced by salt or drought treatments (Supplementary Fig. S28). These findings demonstrate that Z. xanthoxylum has a sophisticated regulatory network for Na+ and K+ transport and strong osmotic adjustment capacity for coping with saline and desert habitats.
It has been considered that the increased demand of crop production cannot be achieved by merely using the currently available arable lands (Shabala 2013; Li et al. 2018), and an alternative approach is to redistribute croplands to marginal lands (Shabala 2013). Our aforementioned findings provide valuable genes related to the utilization of Na+ and K+ as two energy-conserving osmolytes in Z. xanthoxylum, which would facilitate the cultivation of stress-tolerant crops without yield penalty and ultimately the expansion of food production into marginal lands for ensuring the global food security.
ZxCNGC1;1 and ZxCNGC1;2 constitute an energy-saving pathway for Na+ uptake in Z. xanthoxylum
Up to now, the pathways and relevant mechanisms by which plants take up Na+ in roots have been obscure. Current knowledge largely relies on studies in glycophytes, such as Arabidopsis, wheat, and rice, which have limited capacities for Na+ uptake and vacuolar compartmentation (Wang et al. 2007; Munns and Tester 2008). Z. xanthoxylum is an ideal alternative for exploring Na+ uptake and sequestration because it retains a large quantity of Na+ for osmotic adjustment in its succulent leaves (Wang et al. 2004; Ma et al. 2012). Despite low Na+ contents in its natural soil habitat, Z. xanthoxylum accumulates high levels of Na+ in its leaves comparable to those in typical halophytes such as Suaeda salsa (Wang et al. 2002; 2004), indicating that Z. xanthoxylum has a particularly strong Na+ uptake capacity in roots. Moreover, the lack of HAK/KUP/KT members involved in Na+ transport suggests that Z. xanthoxylum has evolved special pathways for Na+ uptake by roots (Fig. 4; Supplementary Figs. S17 to S19).
The nonselective cation channels CNGCs, in particular CNGC1s, have been enriched in Z. xanthoxylum during evolution, even when compared to another Zygophyllales species T. mongolica (Figs. 5B and 8, Supplementary Table S14). Interestingly, two members (ZxCNGC1;1 and ZxCNGC1;2) with the higher expression levels were shown to mediate Na+ transport in yeast and HEK293T cells (Fig. 6, Supplementary Fig. S23). In this context, ZxCNGC1;1 was expressed in the epidermis and cortex cells of roots (Supplementary Fig. S24), providing a pathway for root Na+ uptake in Z. xanthoxylum. Importantly, distinct from many cation channels that can only be opened upon plasma membrane hyperpolarization at the cost of more H+-ATPases (Wang and Wu 2013; Wu et al. 2021), ZxCNGC1;1 and ZxCNGC1;2 conducted inward Na+ currents at voltages −120 mV, a physiological membrane potential normally supported by the plasma membrane H+-ATPase (Hedrich 2012). Thus, Na+ uptake mediated by the above two ZxCNGC1 members can be achieved at no extra energy cost.
It has been suggested that the expansion of gene families involved in ion transport through tandem duplication or WGD during evolution is closely related to the enhanced stress tolerance in plants (Ma et al. 2013; Zou et al. 2017). For instance, the increased copy number of HKT1 (high-affinity K+ transporter 1), which is responsible for restricting Na+ transport from roots to shoots in the glycophyte Arabidopsis (Sunarpi et al. 2005), achieved through tandem duplication has been proposed to be linked to the salt adaptation of poplar species P. euphratica (Ma et al. 2013). Our findings demonstrate a conspicuous expansion of CNGC1s in Z. xanthoxylum, compared to other plants (Fig. 5B), including another Zygophyllales species T. mongolica with weaker osmotic adjustment capacity than Z. xanthoxylum (Shi et al. 2012). This expansion was associated with tandem duplication and WGD event (Fig. 5E, Supplementary Fig. S20), which could confer an energy-saving Na+ uptake pathway contributing to the adaptation of Z. xanthoxylum to desert environments. Moreover, the upregulated expression patterns of most ZxCNGC1s in roots responding to salt or drought treatments (Figs. 5 and 8) could further facilitate efficient root Na+ uptake for Z. xanthoxylum. Given that K+ is often deficient in the desert habitats of Z. xanthoxylum (Wang et al. 2002, 2004), this energy-saving Na+ uptake pathway might compensate for K+ function in the cellular metabolism and osmotic adjustment (Kronzucker et al. 2013).
Na+ is the predominant cation that restricts crop production in saline soil (Rubio et al. 2020). Z. xanthoxylum and salt-accumulating halophyte, such as S. salsa, could absorb and accumulate large quantities of Na+ in their above-ground tissues for osmotic adjustment, which would contribute to removal of Na+ from the soil by harvesting the plants and eventually reducing soil salinity (Wang et al. 2002, 2004; Manousaki and Kalogerakis 2011). Revealing the function of ZxCNGC1;1 and ZxCNGC1;2 fills the gap in the research field of Na+ uptake in plants, and further provides a targeted approach to enhance the capacity of Na+ uptake in salt-accumulating halophytes or xerophytes, thereby promoting the removal of Na+ from saline soil and accelerating the reclamation of sodic lands.
Z. xanthoxylum has evolved an efficient biosynthetic machinery for thick cuticle
In desert habitats with intense evaporation, when water enters the succulent leaves of Z. xanthoxylum facilitated by the accumulation of abundant Na+ and K+, the retention of water in the leaf tissue is particularly important for survival. The thick cuticle layer on the leaf surfaces is a vital trait that helps Z. xanthoxylum restrict nonstomatal water loss under harsh environments (Zhao and Huang 1981; Liu et al. 2021). Although the enzymes involved cuticle formation are present in algae, canonical cuticles with important barrier functions originated in the last common ancestor of embryophytes (Kong et al. 2020). During the evolutionary transition from bryophytes to seed plants, the amount of cuticular wax, one of the major cuticle components, has increased along with the expansion and emergence of related genes (Kong et al. 2020). In this study, we observed an incremental expansion in the core genes involved in the biosynthesis and transport of cuticular wax during the evolutionary transition from algae to angiosperms (Fig. 7C). Our findings further indicate that this evolutionary innovation is a critical adaptive trait allowing xerophyte plants to colonize extreme arid habitats, since the xerophytes (Z. xanthoxylum, T. mongolica, and A. nanus) have more LACSs than do the mesophytes (R. tomentosa, V. vinifera, and A. thaliana). Notably, an expansion of KCS, HCD, ECR, and CYTB5 orthologs occurs in Z. xanthoxylum compared to another Zygophyllales xerophyte T. mongolica (Fig. 7C), which may account for the thicker cuticle layer found on the leaf surfaces, and thus the stronger drought tolerance of Z. xanthoxylum than that of T. mongolica (Wu et al. 1998; Zhou et al. 2011; Shi et al. 2012). Importantly, a large proportion of these core genes in leaves of Z. xanthoxylum were upregulated by salt or drought treatments (Fig. 7E, Supplementary Fig. S30). The expansion and upregulated expression of these genes could contribute to the formation of a thicker cuticle on the leaf surface, thereby enhancing the water retention capacity of Z. xanthoxylum under desert environments.
The elucidation of the molecular basis underlying the formation of thicker cuticle in Z. xanthoxylum would help to endow crops with a water-retaining “outerwear” through genetic technology. For instance, overexpression of ZxABCG11, which functions in the cuticular wax transport pathway, can enhance tolerance to drought and heat in alfalfa by increasing cuticular wax deposition (Liu et al. 2023a). These findings provide another effective way to facilitate the genetic improvement of crops by using the gene resources from desert plants.
In addition to the formation of a thicker cuticle, the reduction in stomata density could be also another trait for water retention of extremophile plants under harsh environments (Shabala et al. 2013; Sun et al. 2021). Under salt conditions, halophytes exhibit higher succulency with the increased volume of epidermal pavement cells, resulting in a wider spacing between stomata and thus a reduced stomatal density, ultimately minimizing water loss and optimizing water use efficiency (Shabala et al. 2013; Hasanuzzaman et al. 2023). This positive association between reduced stomatal density and strong water retention capacity was also observed in the succulent xerophyte Z. xanthoxylum under saline condition (Xi et al. 2018). The stress-tolerance trait related to stomatal density should be considered as an additional target in crop breeding programs (Hasanuzzaman et al. 2023).
In conclusion, our genome analysis of the succulent xerophyte Z. xanthoxylum clarifies the phylogenetic position of Zygophyllales in flowering plants at whole-genome scale. Our analysis also reveals the genetic basis of energy-conserving osmotic adjustment using Na+ and K+ as “cheap” osmolytes and the biosynthesis of cuticular wax for a strong water retention capacity in desert habitats. In addition, we identify energy-saving pathway of Na+ uptake in Z. xanthoxylum roots, which is previously undiscovered in plants. Our study provides elite gene resources for improving stress tolerance in crops and facilitating the reclamation of sodic lands.
Materials and methods
Plant material
Z. xanthoxylum seeds were collected from the Alxa Left Banner (39°05′N, 105°34′E; elevation 1,360 m asl) in the Inner Mongolia Autonomous Region, China. The mean annual rainfall and temperature of the area are 60 to 150 mm and 8 °C, respectively (Ma et al. 2014). Seedlings were grown in a greenhouse where the temperature was 25/20 °C (day/night), the photoperiod was 16/8 h (light/dark; the light intensity approximately 500 μmol m−2 s−1), and the relative humidity was approximately 50 ± 5%. Plants were irrigated with modified half strength Hoagland nutrient solution containing 2 mM KNO3, 0.5 mM KH2PO4, 0.5 mM MgSO4·7H2O, 0.5 mM Ca(NO3)2·4H2O, 60 μM Fe-citrate, 50 μM H3BO3, 10 μM MnCl2·4H2O, 1.6 μM ZnSO4·7H2O, 0.6 μM CuSO4·5H2O, and 0.05 μM Na2MoO4·2H2O; the pH was adjusted to 5.7 using 1 M Tris base. The nutrient solution was prepared using deionized water and renewed once every 4 d.
Karyotype analysis of Z. xanthoxylum
The young root tips of Z. xanthoxylum were excised when they reached 2 to 3 cm in length, and were then treated with distilled water at 0 to 4 °C for 24 h. The tissue was then fixed in Carnoy's solution (acetic acid:ethanol = 1:3 v/v) for 30 min. The root tips were then squashed in a drop of 45% (v/v) acetic acid and stored at 0 °C. Fluorescence in situ hybridization (FISH) was applied to mitotic chromosomes of Z. xanthoxylum using nuclear rDNA probes for 45S and 5S rDNA sequences. The FISH procedure was described by Lim et al. (2005).
Genome size estimation and heterozygosity
The genome size of Z. xanthoxylum was estimated using flow cytometry (BD FACScalibur) as described by Dolezel et al. (2007). Arabidopsis (A. thaliana) and maize (Z. mays), which have genome sizes of 125 Mb and 2.3 Gb (Arabidopsis Genome Initiative 2000; Schnable et al. 2009), respectively, were used as internal standards. In addition, we estimated the genome size of Z. xanthoxylum using a k-mer-based approach (Marçais and Kingsford 2011). Genomic DNA was extracted using QIAGEN Genomic kit (Hilden, Germany) from young leaves. The concentration and purity of DNA were detected using a NanoDrop D-1000 spectrophotometer (NanoDrop Technologies, DE, USA) and a Qubit fluorometer (Invitrogen, CA, USA). The integrity of the DNA was detected using pulsed field electrophoresis. The purified DNA was fragmented and size-fractionated using g-tube and BluePippin (Sage Science Inc., Beverly, MA, USA), then subjected to paired-end library construction and sequenced on an Illumina HiSeq X-ten platform (Illumina, CA, USA) with a read length of 350 bp. The k-mer distribution was then investigated using Jellyfish (v2.2.10) (Marçais and Kingsford 2011) with the parameters of “-t 10 -C -m 19 -s 4G”14. Genome size (G) was estimated by G = knum/kdepth, where the knum represents the total number of k-mers, and the kdepth denotes the k-mer depth of the peak frequency of k-mer distribution. When the k-mer size was set to be 19, the 121 Gb of sequencing reads from short-insert size libraries generated a total number of 100,650,221,561 k-mers and the peak-depth was about 204. The heterozygosity rate of the Z. xanthoxylum genome was estimated by GenomeScope (Ranallo-Benavidez et al. 2020).
Nanopore sequencing
DNA libraries for Oxford Nanopore sequencing were prepared following Nanopore standard protocols and sequenced on a sequel platform by Biomarker Technologies Corporation (Beijing, China). In brief, genomic DNA was extracted from young leaves of Z. xanthoxylum as described above. The purified DNA was then prepared for sequencing as recommended by the manufacturer of the genomic sequencing kit SQK-LSK109 [Oxford Nanopore Technologies (ONT), Oxford, UK]. Single-molecule real-time sequencing of long reads was conducted on a PromethION platform (ONT, Oxford, UK) with the corresponding R9 cell and ONT sequencing reagents kit (EXP-FLP001.PRO.6).
Hi-C sequencing
Hi-C libraries were created from young leaves of Z. xanthoxylum by Biomarker Technologies Corporation (Beijing, China) according to a previously published method (Xie et al. 2015). Briefly, nuclear DNA was fixed with formaldehyde and then digested with HindIII. Sticky ends were biotinylated, and then diluted and ligated. Biotinylated DNA was enriched and then sheared to ∼350 bp fragment sizes. The Hi-C fragment library was constructed and sequenced using an Illumina X-ten platform (Illumina, San Diego, CA, USA).
Genome assembly
Filtered nanopore long reads were first corrected using Canu (v2.0) (Koren et al. 2017) with the following parameters: correctedErrorRate = 0.035 utgOvlErrorRate = 0.065 trimReadsCoverage = 2 trimReadsOverlap = 500 gridOptions = “–mem-per-cpu = 5 g”. The subreads were then assembled using WTDBG (v1.2.8, https://github.com/ruanjue/wtdbg) (wtdbg-1.2.8 -k 0 -p 17 -S 2; wtdbg-cns -j 500 -c 0 -k 7) and smartdenovo (https://github.com/ruanjue/smartdenovo) to derive a consensus assembly. The assembly results generated by these two algorithms were merged using Quickmerge (v0.3) (Chakraborty et al. 2016), and further polished with the raw Nanopore subreads using Racon (Vaser et al. 2017). Additional polishing was performed by Pilon (v1.22) (Walker et al. 2014) using the Illumina short reads. A preassembly was executed for the error-corrected contigs using Hi-C data.
Assessment of assembly quality
We assessed the completeness of the Z. xanthoxylum genome assembly by following three strategies: (i) after delinking the raw sequencing data and filtering low-quality reads, the Illumina reads obtained from the transcriptomes or genomic DNA were mapped back to the genome assembly by Hisat2 (Kim et al. 2019) and BWA (Li and Durbin 2009) with default parameters, respectively; (ii) calculating BUSCO (v.5.0) score (Manni et al. 2021) with embryophyta_odb10 (1,614 BUSCOs); (iii) we mapped the core eukaryotic genes (CEGs) using CEGMA v2.5 (Parra et al. 2007) with default parameters.
Chromosome-scale assembly using Hi-C
Raw Hi-C data were processed to filter low-quality reads and adapters were trimmed with cutadapt (RRID: SCR 011841). The clean Hi-C reads were then mapped to the genome assembly of Z. xanthoxylum with BWA (Li and Durbin 2009). Only unique mapped read pairs were considered for further analysis. Duplicate removal, sorting, and quality assessment were carried out using HiC-Pro pipeline (default parameters) (Servant et al. 2015). Next, the uniquely mapped data were retained for assembly using LACHESIS (Burton et al. 2013). Hi-C data were used to correct mis-joins in contigs and then to order and orient contigs. Preassembly was performed for contig correction by splitting contigs into segments with an average length of 300 kb, and then the segments were preassembled with Hi-C data. Misassembled points were identified and broken at the likely point of misassembly when split segments could not be placed in the original position. Next, the corrected contigs were assembled using LACHESIS with parameters CLUSTER_MIN_RE_SITES = 34; CLUSTER_MAX_LINK_DENSITY = 2; CLUSTER_NONINFORMATIVE_RATIO = 1.5; ORDER_MIN_N_RES_IN_TRUN = 27; ORDER_MIN_N_RES_IN_SHREDS = 24 with Hi-C valid pairs. Gaps between ordered contigs were filled with 100 N's. To assess the quality of assembly, Hi-C data were mapped to chromosomes using HiC-Pro. The interaction matrix was visualized with a heatmap at a 100 kb resolution.
Annotation and analysis of repeats and noncoding RNAs
To identify other kinds of repeat sequences in the Z. xanthoxylum genome assembly, we first built a nonredundant repeat sequence library by searching for repetitive sequences using LTR-FINDER (v1.07) (Xu and Wang 2007), RepeatScout (v1.0.5) (Price et al. 2005), and PILER-DF (v2.4) (Edgar and Myers 2005) with default parameters. These merged repeat libraries were classified by PASTEClassifier (v1.0) (Hoede et al. 2014) and then combined with Repbase database (http://www.girinst.org/repbase) to create the final repeat library, which was used to identify the repetitive sequences by RepeatMasker (v4.0.5) (Chen 2004). tRNAscan-SE (v2.0) (Chan et al. 2021) was used for detection of tRNA genes and functional prediction with default parameters. rRNA and miRNA sequences were identified by Infernal (v1.1) (Nawrocki and Eddy 2013) using Rfam (Kalvari et al. 2018) and miRBase (Kozomara and Griffiths-Jones 2014), respectively, as a reference. Other noncoding RNAs were predicted by Infernal (v1.1) (Nawrocki and Eddy 2013) using default parameters.
Prediction of protein-encoding genes
We adopted three strategies to predict the protein-coding genes of the Z. xanthoxylum genome, including de novo gene prediction, homology-based gene prediction, and transcript-based approaches. For the de novo gene prediction, Genscan (Burge and Karlin 1997), Augustus (v3.4) (Stanke et al. 2006), GlimmerHMM (v3.0.4) (Majoros et al. 2004), GeneID (v1.4) (Alioto et al. 2018), and SNAP (version 2006-07-28) (Korf 2004) were used to identify candidate protein-encoding genes in the Z. xanthoxylum genome with self-trained model parameters. For homology-based gene prediction, protein sequences from three species [A. thaliana, soybean (Glycine max) and Medicago truncatula] were mapped to Z. xanthoxylum assembly using BLAST with an E-value threshold of ≤1e−5 and homologous genes were identified using GeMoMa (v.1.4.2) (Keilwagen et al. 2019). For RNA-Seq assisted gene prediction, HISAT (v2.0.4) (Kim et al. 2015) and StringTie (v1.2.3) (Pertea et al. 2015) were used to carry out reference-based transcriptome assembly. TransDecoder (v2.0) (http://transdecoder.sourceforge.net/) and GeneMarkS-T (Tang et al. 2015) was used to predict genes based on transcripts. PASA (Haas et al. 2008) was used to predict genes based on unigenes and full-length transcripts from Nanopore sequencing. The gene models obtained using all three prediction methods were integrated using EVidenceModeler (v1.1.1) (Haas et al. 2008) and generated a consensus set. In total, we obtained a final set of 27,776 genes.
Functional annotation
To assign gene functions to protein-coding gene models, they were compared to the Gene Ontology (GO) (http://www.geneontology.org), Kyoto Encyclopedia of Genes and Genomes (KEGG) (http://www.genome.jp/kegg), Eukaryotic Orthologous Groups (KOG) (http://www.ncbi.nlm.nih.gov/COG/), TrEMBL (http://www.ebi.ac.uk/uniprot), and nr databases (https://ftp.ncbi.nlm.nih.gov/blast/db/FASTA/) using BLASTP with an E-value threshold of ≤1e−5.
Gene family clustering
OrthoFinder (v2.3.7) (Emms and Kelly 2015) with the default threshold was used to cluster amino acid sequences across 17 plant species [(Z. xanthoxylum, Tetraena mongolica, G. max), rose (Rosa chinensis), Juglans regia, wax gourd (Benincasa hispida), starfruit (Averrhoa carambola), poplar (P. trichocarpa), Tripterygium wilfordii, pomegranate (P. granatum), Rhodomyrtus tomentosa, E. japonica, cotton (Gossypium raimondii), A. thaliana, Tapiscia sinensis, Pistacia vera and grape (V. vinifera)] to obtain a list of homologous genes and calculate the species distribution of each protein cluster (Supplementary Table S13). The annotation of protein families was performed using PANTHER (v15) database (http://www.pantherdb.org/). Subsequent GO and KEGG enrichment analyses of these genes were performed by clusterProfile (v3.14.0) (Yu et al. 2012).
To infer the phylogeny of Z. xanthoxylum, 230 single-copy gene families from 17 species were identified and used to construct a phylogenetic tree. Amino acid sequences were aligned first using MAFFT software (Katoh and Standley 2013), and the nucleotide sequences were forced to fit the amino acid alignment using PAL2NAL (v14) (Suyama et al. 2006). We also forced nucleotide sequences on the amino acid alignments using a custom Python script to obtain codon-preserving alignments of nucleotide sequences. Finally, we retrieved two different alignments: (i) amino acid (or peptide, pep) alignments; (ii) nucleotide alignment (nucleotides forced to the coding sequence, cds). Quality control of the multiple sequence alignment was then performed using Gblocks software (Castresana 2000). Both pep and cds alignments were then concatenated into supermatrix alignment for the prediction of the best substitution models and maximum-likelihood tree reconstruction using the IQ-TREE (v1.6.11) (Nguyen et al. 2015), and the bootstrap values were calculated from 1,000 iterations using V. vinifera as out-groups. The JTT + F + I + G4 model was selected as the best fitting model. The divergence time was estimated using the MCMCtree program in PAML package (v4.9i) (Yang 2007). The divergence time was gained from the TimeTree database (http://www.timetree.org/). The expansion and contraction of gene families were detected with CAFE (v4.2) (De Bie et al. 2006). This program regards the evolution of a gene family as a stochastic birth-and-death process, where genes are gained and lost independently along each branch of a phylogenetic tree. The expansion or contraction events of gene families were computationally identified by the comparisons of family size differences between the most recent common ancestor (MRCA) and each of the current plant species with a significant P-value of 0.05.
WGD analysis and collinearity analysis
To examine WGD in Z. xanthoxylum, genome syntenic analysis and dotplot display of the orthologous regions were performed using MCScanX (Wang et al. 2012). Syntenic blocks containing were obtained based on the similarity gene pairs (BLASTP: E-value threshold ≤1e−5). The Ks between the syntenic homologous gene pairs were calculated by wgd (v1.1.1) (Zwaenepoel and Van de Peer 2019). We extracted all the duplicated gene pairs from syntenic blocks and calculated the 4dTv distance.
Detection and analysis of intact LTR retrotransposons (LTR-RTs)
Full-length LTR retrotransposons were identified in Z. xanthoxylum genomes using LTR-FINDER (https://github.com/xzhub/LTR_Finder) with default parameters. Then, candidate LTR sequences were filtered. To estimate insertion times, LTR retrotransposon ends were aligned using MUSCLE (Edgar 2004), and nucleotide distance (D) was calculated based on the Kimura two-parameter (K2P) model in distmat program within the EMBOSS package. The insertion time T was calculated according to T = D/2r, where r (∼7 × 10⁻⁹) is the rate of nucleotide substitution (Ossowski et al. 2010).
Transcriptome sequencing of Z. xanthoxylum
Four-week-old seedlings were used for the following treatments. (i) Salt treatment: seedlings were treated with modified half strength Hoagland nutrient solution supplemented with 50 mM NaCl; (ii) Drought stress: seedlings were treated with modified half strength Hoagland nutrient solution supplemented with sorbitol where the osmotic potential was −0.27 MPa. The roots, stems, and leaves of seedlings in each treatment were collected after seedlings were treated for 0 (as control), 6, and 24 h. The samples were frozen immediately in liquid nitrogen and stored at −80 °C until analysis. Sequencing libraries were generated using NEBNext UltraTM RNA Library Prep Kit for Illumina (NEB, USA) following the manufacturer's recommendations. The libraries were then sequenced on an Illumina platform and paired-end reads were generated. Raw sequences were transformed into clean reads after data processing with a bioinformatics pipeline tool, BMKCloud (www.biocloud.net) online platform. The clean reads were then mapped to the reference genome sequenced by HISAT (v2.1.0) (Kim et al. 2015). The quantification of gene expression was conducted using StingTie (v2.1.3) (Pertea et al. 2015) based on the expected number of fragments per kilobase of transcript per million fragments mapped (FPKM) method. Three biological replicates were performed. The heatmap was generated using the TBtools with row scaling (https://github.com/CJ-Chen/TBtools/releases).
Analysis of gene families related to the transport of Na+/K+ and the biosynthesis of cuticular wax
For the identification of gene families related to the transport of Na+/K+ and cuticular wax biosynthesis, we used the protein sequences from A. thaliana as a reference to search the genomes of T. mongolica, R. tomentosa, V. vinifera, alkaligrass (P. tenuiflora), P. trichocarpa, quinoa (C. quinoa), A. nanus, C. braunii, M. polymorpha, S. moellendorffii, and Z. xanthoxylum by BLASTP with an E-value threshold of ≤1e−5 (Supplementary Table S16). Finally, all the candidate protein sequences were analyzed using MEGA11 (Tamura et al. 2021) with repetitive sequences removed manually. The phylogenetic tree was generated using the neighbor-joining method, with bootstrap values based on 1,000 replicates indicated at each branch. The MEME (https://meme-suite.org/meme/tools/meme) was used to search for motifs in AKT1 and CNGC1 orthologs from Z. xanthoxylum, T. mongolica, R. tomentosa, and A. thaliana. TBtools software (Chen et al. 2023) was used to visualize the motif and domain of these proteins.
Isolation of ZxCNGC1;1, ZxCNGC1;2, OsCNGC1, and AtCNGC1
Seedlings of Z. xanthoxylum used for functional analysis of ZxCNGC1;1 and ZxCNGC1;2 were grown in a greenhouse. The growth conditions are described in “Plant material”. Gene-specific primer pairs P1, P2, P3, and P4 (Supplementary Table S17) were used to amplify the full-length sequence of the ZxCNGC1;1, ZxCNGC1;2, OsCNGC1, and AtCNGC1, respectively.
Subcellular localization and tissue-specific expression of ZxCNGC1; 1
To analyze the subcellular localization of ZxCNGC1;1, the coding sequence of ZxCNGC1;1 was amplified by PCR using primer pair P5 with restriction enzyme sites for Xba I (Supplementary Table S17), and then was fused with the GFP in the vector pBI121 (with the cauliflower mosaic virus 35S promoter) using In-Fusion PCR cloning (TaKaRa, Japan). The recombinant plasmid (p35S::ZxCNGC1;1-GFP) was transferred into Agrobacterium tumefaciens (GV3101) competent cells. Before infiltrating, 4-wk-old Nicotiana benthamiana plants were cultivated in the dark and irrigated with sufficient water for 24 h. Subsequently, GV3101 harboring p35S::ZxCNGC1;1-GFP or empty vector (containing GFP) were co-infiltrated into N. benthamiana leaves with GV3101 harboring the plasma membrane marker AtPIP2A-mCherry, respectively. After 2 to 3 d, green fluorescence signal was detected using a confocal laser scanning microscope system (Leica SP8, Leica, Germany) equipped with a 40× water immersion objective. The excitation wavelength was 488 nm (blue argon ion laser) and 552 nm (green HeNe laser) for GFP and mCherry, respectively. For detection, the Leica system used two PMTs (photomultiplier tube). PMT1 detected emission from 505 to 550 nm for GFP and PMT2 detected emission from 600 to 650 nm for mCherry. The gains (800) for PMT1 or PMT2 were identical for all images.
To analyze the tissue-specific expression of ZxCNGC1;1, the promoter sequence of ZxCNGC1;1 was firstly isolated through amplification of genomic DNA using the primer pair P6 (Supplementary Table S17). The resulting PCR products was inserted between Hind III and Sma I sites in the pBIB-Basta-GWR-GUS vector, upstream of GUS (β-glucuronidase) coding sequence, to obtain the pZxCNGC1;1::GUS reporter construct. This construct was transformed into GV3101. Arabidopsis plants were transformed using the floral dip method. Transgenic plants expressing pZxCNGC1;1::GUS were grown on half strength MS medium for 5 d before analysis. The seedlings were incubated with GUS staining solution overnight at 37 °C according to Jefferson et al. (1987). After staining, the green tissue was cleared using an ethanol series and photographed.
Reverse transcription quantitative PCR analysis of ZxCNGC1;1 responding to NaCl treatments
Four-week-old Z. xanthoxylum seedlings were treated with modified half strength Hoagland nutrient solution supplemented with additional 50 or 100 mM NaCl, and then roots were harvested at 0, 1, 3, 6, 12, 24, 48 and 72 h, respectively. The treatment solution was changed every day.
Total RNA was extracted and first strand cDNA was synthesized from 2 μg of total RNA. The quantitative PCR was performed using SYBR Green PCR master mix (Takara, Japan) on a StepOnePlus Real-Time PCR Thermocycler (ABI, USA) using the P7 primer pair (Supplementary Table S17). ZxACTIN (GenBank: EU019550.1) was used for RNA normalization using the P8 primer pair (Supplementary Table S17). The relative expression level was calculated by 2−ΔΔCt method (Schmittgen and Livak 2008). The RT-qPCR analysis was performed in triplicate to ensure reproducibility.
The Na+ and K+ transport activity of ZxCNGC1;1, ZxCNGC1;2, and OsCNGC1 in yeast
The coding sequences of ZxCNGC1;1 and ZxCNGC1;2 and OsCNGC1 amplified by primers pairs P9, P10, and P11 (Supplementary Table S17), respectively, were inserted between Xba I and Sma I sites in vector p416. AtHKT1;1 and AtAKT1 from Arabidopsis were inserted respectively into the same vector by Duan et al. (2015). The above recombinant plasmids were used to transformed K+-uptake-deficient yeast strain CY162 (MATa, Δtrk1, trk2::pCK64, his3, leu2, ura3, trp1, ade2) defective in the K+ transporters TRK1 and TRK2 or into a Na+-sensitive yeast strain G19 (MATa, his3, leu2, ura3, trp1, ade2, ena1::HIS3::ena4) disrupted in the ENA1 to 4 genes encoding Na+ export pumps (Quintero et al. 1996). Yeast transformations and growth experiments were performed as described (Duan et al. 2015).
CY162 strains transformed with plasmids were grown on AP medium supplemented with four concentrations of K+ (0.2, 2, 5 and 100 mM). AP medium with added K+ (1 mM) and supplemented with various concentrations of Na+ (0, 25, 50 and 100 mM) was used for growth assays of G19 transformed with plasmids.
The ion permeability of ZxCNGC1;1, ZxCNGC1;2, OsCNGC1, and AtCNGC1 in HEK 293T cells
The coding sequences of ZxCNGC1;1, ZxCNGC1;2, OsCNGC1, and AtCNGC1 cDNA were inserted between Xba I and EcoR I sites in the pCI-neo vector using the primer pairs P12, P13, P14, and P15, respectively (Supplementary Table S17). HEK cells were maintained in Dulbecco's modified eagle medium supplemented with 10% fetal calf serum. Transient transfection of all constructs was performed using the LipofectAMINE 2000 reagent (Life Technologies, CA, USA) according to the manufacturer's instructions.
Whole-cell patch clamp experiments were performed using an Axopatch-200B patch clamp system (Axon Instruments, CA, USA) with Digitata1440A digitizer attached to an Olympus inverted microscope. pClamp10.2 software (Axon Instruments, CA, USA) was used for data acquisition and analysis.
Cells were kept in the bath solution and the recording pipettes were filled with a solution (Supplementary Table S18). For K+ and Na+ current recording, a step-voltage protocol of 4-s-duration for each voltage from −180 to +100 mV with +20 mV steps was used on HEK293T cells 1 min after accessing a whole-cell configuration.
For Ca2+ and Mg2+ current recordings, a ramp voltage protocol of 2-s-duration from −180 to +20 mV (holding potential 0 mV) was applied 1 min after accessing to a whole-cell configuration. The currents were recorded each 20 s for five times in total for each cell. The five current traces were used for statistical analysis of average current–voltage curves.
Statistical analysis
All data are presented as means ± standard deviation (Sd). Statistical significance was determined by Duncan's multiple range tests and Student's t test using SPSS statistical software (v13.0, SPSS Inc., IL, USA).
Acknowledgments
We thank Prof. Quanwen Dou (Key Laboratory of Adaptation and Evolution of Plateau Biota, Northwest Institute of Plateau Biology, Chinese Academy of Sciences) for assistance in the Karyotype analysis.
Author contributions
S.M.W. and Q.M. conceived and designed this study; Q.M., H.S.L., H.J.L., Q.F.G., Q.Q.C., X.X.Y., T.G.G., and L.L. performed the experiments; H.S.L., H.J.L., W.P.B., Y.Q.S., S.D.W., and Q.F.G. analyzed the data. Q.M., H.S.L., H.J.L., and S.M.W. wrote the manuscript. A.K.B., H.J.Y., S.L., O.W., and S.R.H. revised the manuscript.
Supplementary data
The following materials are available in the online version of this article.
Supplementary Figure S1.Z. xanthoxylum is dominant in the plant community of the Alxa Desert of northwest China.
Supplementary Figure S2.C. songaricum, a root holoparasitic herb, hosted by Z. xanthoxylum.
Supplementary Figure S3. Fluorescence in situ hybridization (FISH) analysis using 5S (green fluorescence) and 45S (red fluorescence) rDNA probes at the metaphase stage of cell division in Z. xanthoxylum.
Supplementary Figure S4. Evaluation of the Z. xanthoxylum genome size by k-mer analysis.
Supplementary Figure S5. The estimation of genome size of Z. xanthoxylum by flow cytometry.
Supplementary Figure S6. The flowchart of assembly for Z. xanthoxylum genome.
Supplementary Figure S7. Three strategies (de novo, homology-based and transcript-based) were used to predict the protein-coding genes of the Z. xanthoxylum genome.
Supplementary Figure S8. LTR insertion time estimation of Z. xanthoxylum.
Supplementary Figure S9. Maximum likelihood phylogenies of 17 species based on CDS sequences of 230 single-copy gene families.
Supplementary Figure S10. The divergence time of 17 species.
Supplementary Figure S11. Venn plot shows the shared and unique gene families of the genomes from 17 species.
Supplementary Figure S12. GO classification of expanded gene families in the Z. xanthoxylum genome.
Supplementary Figure S13. Annotation of Z. xanthoxylum-specific gene families based on GO analysis.
Supplementary Figure S14. Synteny between Z. xanthoxylum genome and two subgenomes of T. mongolica.
Supplementary Figure S15. The syntenic dotplot of intragenomic duplications in Z. xanthoxylum.
Supplementary Figure S16. The syntenic dotplot of intergenomic duplications between Z. xanthoxylum and V. vinifera.
Supplementary Figure S17. Phylogenetic relationship of HAK/KUP/KT family in different plants based on the analysis of the amino acid sequences using maximum-likelihood method.
Supplementary Figure S18. Phylogenetic relationship of HAK/KUP/KT family in different plants based on the analysis of the CDS sequences using neighbor-joining method.
Supplementary Figure S19. Phylogenetic relationship of HAK/KUP/KT family in different plants based on the analysis of the CDS sequences using maximum-likelihood method.
Supplementary Figure S20. Intraspecies synteny analysis of AKT1 and CNGC1 genes in Z. xanthoxylum.
Supplementary Figure S21. Analysis of conserved motifs of AKT1 orthologs from Z. xanthoxylum, T. mongolica, R. tomentosa, and A. thaliana using MEME software.
Supplementary Figure S22. Analysis of conserved motifs of CNGC1 orthologs from Z. xanthoxylum, T. mongolica, R. tomentosa, and A. thaliana using MEME software.
Supplementary Figure S23. Expression levels of 9 ZxCNGC1 orthologs in roots of Z. xanthoxylum.
Supplementary Figure S24. Subcellular localization and tissue-specific expression of ZxCNGC1;1.
Supplementary Figure S25. Time-course analysis of ZxCNGC1;1 expression in roots of Z. xanthoxylum under 50 (yellow line) or 100 (blue line) mM NaCl by RT-qPCR.
Supplementary Figure S26. Ca2+ and Mg2+ permeability in HEK293T cells.
Supplementary Figure S27. Analysis of CBL and CIPK families in Z. xanthoxylum.
Supplementary Figure S28. Expression patterns of CIPK family genes in Z. xanthoxylum.
Supplementary Figure S29. Phylogenetic relationship of the KCS family in Z. xanthoxylum (black circles) and A. thaliana (blue squares).
Supplementary Figure S30. Expression pattern of key genes involved in the synthesis and transport of cuticular wax from leaves of Z. xanthoxylum.
Supplementary Table S1. Summary of Illumina sequencing data for draft assembly and evaluation of the Z. xanthoxylum genome.
Supplementary Table S2. Nanopore sequencing of Z. xanthoxylum.
Supplementary Table S3. Statistics of Hi-C sequencing of Z. xanthoxylum.
Supplementary Table S4. Statistics for the final assembly of the Z. xanthoxylum genome.
Supplementary Table S5. Statistics of pseudochromosomes of Z. xanthoxylum.
Supplementary Table S6. Assessment of genome consistency based on Illumina short reads and RNA-seq data.
Supplementary Table S7. Genome completeness evaluation based on BUSCOs.
Supplementary Table S8. Genome completeness evaluation based on CEGMA.
Supplementary Table S9. Features of predicted genes in the Z. xanthoxylum genome.
Supplementary Table S10. Summary of functional annotation for predicted genes in the Z. xanthoxylum genome.
Supplementary Table S11. Characteristics of repeat sequences in the Z. xanthoxylum genome.
Supplementary Table S12. Numbers of noncoding RNAs in the Z. xanthoxylum genome.
Supplementary Table S13. Plants of rosids used in phylogenetic analysis.
Supplementary Table S14. Number of genes related to Na+ and K+ transport and salt response in Z. xanthoxylum and the other plants.
Supplementary Table S15.Ks value of AKT1 or CNGC1 orthologs that displayed intraspecies synteny.
Supplementary Table S16. Data sources of the plant genomes used in the analysis of genes involved in the ion transport and the formation of cuticular wax.
Supplementary Table S17. Primers used for functional analysis of ZxCNGC1;1, ZxCNGC1;2, OsCNGC1, and AtCNGC1.
Supplementary Table S18. Bath solution and pipette solution used in the functional analysis of ZxCNGC1;1, ZxCNGC1;2, OsCNGC1, and AtCNGC1 in HEK293T cells.
Funding
This work was financially supported by the National Key Research and Development Program of China (2022YFF1003200) and the National Natural Science Foundation of China (31730093, 31971405 and 32271749).
Data availability
Sequence data from this article can be found in the National Centre for Biotechnology Information (NCBI) under accession numbers PRJNA933961. All data are also available from the corresponding author on request.
Dive Curated Terms
The following phenotypic, genotypic, and functional terms are of significance to the work described in this paper:
References
Author notes
Qing Ma, Hai-Shuang Liu and Hu-Jun Li contributed equally to this work.
The author responsible for distribution of materials integral to the findings presented in this article in accordance with the policy described in the Instructions for Authors (https://dbpia.nl.go.kr/plphys/pages/General-Instructions) is Suo-Min Wang ([email protected]).
Conflict of interest statement. The authors declare no potential conflict of interest.
