


Abstract
Phosphorus (P) plays a pivotal role in plant growth and development. Low P stress can greatly hamper plant growth. Here, we identified a QTL (named QPH-9-1), which is associated with P efficiency across multiple environments through linkage analysis and genome-wide association study. Furthermore, we successfully cloned the underlying soybean (Glycine max) gene GmRR1 (a soybean type-B Response Regulator 1) that encodes a type-B response regulator protein. Knockout of GmRR1 resulted in a substantial increase in plant height, biomass, P uptake efficiency, and yield-related traits due to the modification of root structure. In contrast, overexpression of GmRR1 in plants resulted in a decrease in these phenotypes. Further analysis revealed that knockout of GmRR1 substantially increased the levels of auxin and ethylene in roots, thereby promoting root hair formation and growth by promoting the formation of root hair primordium and lengthening the root apical meristem. Yeast two-hybrid, bimolecular fluorescence complementation, and dual-luciferase assays demonstrated an interaction between GmRR1 and Histidine-containing Phosphotransmitter protein 1. Expression analysis suggested that these proteins coparticipated in response to low P stress. Analysis of genomic sequences showed that GmRR1 underwent a selection during soybean domestication. Taken together, this study provides further insights into how plants respond to low P stress by modifying root architecture through phytohormone pathways.
Introduction
Phosphorus (P) is fundamental for plant growth and productivity (Jain et al. 2007). However, P cannot be used effectively because of its inherent chemical properties, which lead to the formation of insoluble mineral complexes in the soil (Bieleski 1973). More than half of the world's agricultural lands are poor in available P (Lynch 2011; Du et al. 2020). The global demand for P fertilizer has been steadily increasing due to the need for sustainable food production for the growing population. However, P fertilizer is produced from Pi rock, which is a nonrenewable resource and will be exhausted in the near future (Van Kauwenbergh 2010). Thus, it is crucial to develop crops with improved P uptake efficiency and reduce fertilizer inputs for environmentally sustainable agriculture.
Under P deficiency conditions, plants show corresponding changes in diverse aspects, such as morphological and physiological characteristics, that enhance their ability to respond to low P availability (Lynch 2011). Among them, root development is highly plastic in reacting to fluctuations in nutrient levels in the environment and is a crucial factor in absorbing nutrients from the soil (Dong et al. 2017). In response to P deficiency, plants can reduce primary root growth and accelerate lateral roots and root hairs (Desnos 2008). However, it has also been reported that light can greatly affect root growth, which is an additive stress for P deficiency stress (Silva-Navas et al. 2019). Furthermore, several studies have demonstrated the crucial role of phytohormone signaling in regulating root development under low P conditions (Nacry et al. 2005; Jiang et al. 2007; Rubio et al. 2009; Chiou and Lin 2011). Specifically, cytokinin can negatively regulate root development. In Arabidopsis (Arabidopsis thaliana), cytokinin regulates primary root elongation (Werner et al. 2003), lateral root initiation (Chang et al. 2013), and the density of lateral roots (Bielach et al. 2012). Cytokinin also regulates root function by changing the expression of nutrient uptake and transport proteins (Werner et al. 2010). Mutation of cytokinin receptor genes resulted in a strongly enhanced root system and increased branching (Riefler et al. 2006). The role of cytokinin in plant response to low phosphorus stress has also been reported. Exogenous application of cytokinin can inhibit the expression of some P starvation-responsive genes (Martín et al. 2000). AtIPS1 (induced by phosphate starvation 1) and other P starvation-responsive genes showed reduced cytokinin sensitivity in the mutants of the cytokinin resistant 1 (Franco-Zorrilla et al. 2002). Additionally, Silva-Navas et al. (2019) proposed that P-starved plants increase the ratio of cis-zeatin to trans-zeatin to maintain basal cytokinin responses and allocate P in the root system to sustain its growth.
Plants perceive and transduce cytokinin signaling through a two-component multistep phosphorelay for its perception and signal transduction, which includes cytokinin receptors, histidine-containing phosphotransfer proteins, and type-B response regulators (Kieber and Schaller 2018). In Arabidopsis, there are two types of response regulators, type-A and type-B (To et al. 2004; Mason et al. 2005). Type-B ARRs (Arabidopsis response regulators) act as transcription factors that can induce type-A ARR transcription. While type-B ARRs are positive regulators of the cytokinin response, type-A ARRs are negative regulators of cytokinin signaling (To et al. 2004). The type-B ARR family member ARR1 has been shown to respond to cytokinin and activate SHY2 (SHORT HYPOCOTYL 2) to regulate the size of the root meristem area, and arr1 loss-of-function mutants showed smaller root meristem sizes than the wild type (Ioio et al. 2008). Loss of ARR1, ARR10, and ARR12 (arr1 arr10 arr12 triple mutant) led to a massive decrease in leaf size and insensitivity to cytokinin, which resulted in a shorter primary root compared to that of the wild type (Zubo et al. 2017). Additionally, the lack of type-B ARR can enhance plant resistance to some abiotic stresses, such as aluminium stress, drought stress, and salinity stress (Nguyen et al. 2016; Yang et al. 2017; Qi et al. 2022). Moreover, recent studies have revealed that type-B ARRs play an important role in regulating the crosstalk between cytokinin and other hormones (Zubo and Schaller 2020). For instance, they can interact with DELLA proteins to regulate cytokinin-gibberellin crosstalk (Marín-de la Rosa et al. 2015) and TGA1A-related gene 3 (TGA3) proteins to regulate cytokinin–salicylic acid crosstalk (Choi et al. 2010). Additionally, cytokinin–auxin antagonistic interactions are fundamental in controlling root development. Postembryonic root growth is sustained by the root meristem, where the rate of cell differentiation must equal the rate of generation of new cells for sustained growth (Ioio et al. 2008; Moubayidin et al. 2010). Interestingly, some type-B ARRs target genes are involved in auxin metabolism, transport, and signal transduction (Zubo and Schaller 2020). Therefore, more research on the mechanism of cytokinin and auxin interactions is necessary to improve nutrient utilization efficiency.
Soybean (Glycine max), a globally important oil crop, is severely limited in growth and yield due to its low P uptake efficiency. However, the molecular mechanism underlying response regulators’ regulation of soybean's response to P starvation remains elusive. In this study, a soybean type-B response regulator (GmRR1) was identified through linkage analysis and genome-wide association study (GWAS) across multiple environments. Knockout of GmRR1 resulted in substantial increases in plant height, biomass, and P uptake efficiency due to notable enhancements in the root length, root tip number, and root surface area under normal and low P conditions. Conversely, overexpression of GmRR1 led to the opposite results. Further analysis revealed that changes in GmRR1 expression substantially affected the levels of auxin, cytokinin, and ethylene in roots while regulating root growth by influencing the formation of root hair primordia and the size of the root apical meristem area. Additionally, we discovered that GmRR1 could interact with GmHP1, a histidine-containing phosphotransmitter protein known to participate in cytokinin signaling pathways. These results provide insights into plant responses to low P stress and reveal that GmRR1 functions as a negative regulator via the hormonal pathway. It simultaneously promotes the formation of root hair primordium to increase the number of root hairs and enhances root apical meristem size to facilitate root elongation, regulating root architecture to absorb more P to cope with low P stress.
Results
Identification of GmRR1, a major gene regulating low P tolerance
Plant height of soybean decreased substantially under low P stress, which was an important agronomic trait closely related to yield potential. To search for the QTLs of low P tolerance, a segregating soybean population consisting of 152 F8:12 RILs derived from a cross between varieties Nannong 94-156 (low P tolerance) and Bogao (low P sensitivity), was used for QTL mapping, and GWAS was performed using a 219-panel of soybean accessions. We evaluated the plant height at the V4 stage in both the normal and low P conditions in five environments. The plant height showed a high degree of genetic variation (Supplemental Fig. S1; Supplemental Tables S1 and S2).
The relative plant height (low P/normal P) of the 152 RILs was used for QTL mapping and fourteen QTLs were found (Supplemental Fig. S2A and Supplemental Table S3). Further analysis of these fourteen QTLs found that three of them could be detected more than two times in different environments. The QTL (QPH-9-1), identified in four environments with the largest logarithm of odds (LOD) explained 7.937% of the phenotypic variation (Supplemental Table S3). This result suggests that important genes associated with phosphorus starvation response might be located within QPH-9-1.
GWAS showed that a stable SNP (AX-93762167) were identified significantly associated with the relative plant height among the five environments (Supplemental Fig. S2B and Supplemental Table S4). Subsequently, we compared the results of linkage analysis and GWAS and found that the SNP was also located within QPH-9-1 (Fig. 1A). Notably, the SNP (AX-93762167) was detected within the 5′-untranslated region (5′-UTR) of Glyma.09g040000 (encoding a type-B response regulator protein). Additionally, we checked the homologous gene in Arabidopsis, ARR1, and found that it had been characterized as a transcription factor that acts as a positive regulator in the two-component cytokinin signaling pathway (Sakai et al. 2001). Type-B ARR mutants of Arabidopsis showed decreased sensitivity to cytokinin and effects on root elongation and lateral root formation (Mason et al. 2005). Phylogenetic analysis revealed that the evolutionary distance between Glyma.09g040000 and ARR1 is the closest (Supplemental Fig. S3A), and both belong to the type-B response regulators, so we designated the gene GmRR1 in this study.

Cloning and expression analysis of candidate genes. A) Identification of P efficiency candidate gene by combining linkage mapping and GWAS. B) Candidate gene haplotypes in the 219-accession panel. C) Natural variations of the candidate gene were associated with low P tolerance in 219 soybean accessions. Analysis of relative plant height of 6 haplotypes (Hap1, n = 109; Hap2, n = 85; Hap3, n = 9; Hap4, n = 7; Hap5, n = 5; Hap6, n = 4) in the 219-accession panel. For all boxplots, center line, median; box limits, upper, and lower quartiles; whiskers, 1.5 × interquartile range; points, outliers. D) Candidate gene (GmRR1) expression analyses in various organs of soybean Nannong94-156, including roots, stems, leaves, flowers, 15d pods, 45d pods, 15d seeds, and 45d seeds. Data are means ± standard error of the mean (n = 3). E) Analysis of relative expression of GmRR1 in transgenic plants and mutants (n = 3). ko-1, ko-2, and ko-3 represent three different knockout lines; OE-1 OE-2, and OE-3 represent three different overexpression lines. Significant differences compared to WT according to two-sided t test (***P < 0.001). Data are means ± standard error of the mean (n = 3).
To verify GmRR1 is associated with low P tolerance in soybean, we extracted the SNPs and indels of this gene from the resequencing data of 219 soybean accessions (Lu et al. 2020; Li et al. 2022) and performed candidate gene association analysis and haplotype analysis (Fig. 1B; Supplemental Fig. S3B). Further sequence comparison analysis revealed thirteen highly linked SNPs and one indel at the genomic and promoter regions of GmRR1. Based on these, GmRR1 was classified into six haplotypes (Hap1–Hap6) (Fig. 1B), and Nannong 94-156 carrying Hap2 showed higher relative plant height than the other five haplotypes (Fig. 1C). We next analyzed the expression patterns of GmRR1 by reverse transcription quantitative PCR (RT-qPCR). The results showed that GmRR1 was expressed in all tissues but had the highest expression in roots (Fig. 1D). Low P induced expression analysis in the representative soybean accessions Bogao (low P sensitivity) and Nannong 94-156 (low P tolerance) showed that the expression of GmRR1 was upregulated compared with the control after low P treatment for 12 h and then significantly downregulated, especially in Nannong 94-156 (Supplemental Fig. S4). All these results suggested that GmRR1 is the target gene for P deficiency tolerance.
Alteration of GmRR1 expression substantially impacts soybean P uptake efficiency and yield in low P conditions
To investigate the function of GmRR1, we constructed GmRR1 overexpression lines and knockout mutants in the genetic background of the “Jack” cultivar (WT, a low P sensitive soybean cultivar) (Yang et al. 2021). Three independent transgenic overexpression lines (OE-1, OE-2, and OE-3) and knockout mutants (ko-1, ko-2, and ko-3) were obtained. Sequencing analysis revealed that the knockout lines all had a 413-bp deletion between target 3 and target 4. Additionally, ko-2 had a 4-bp deletion, while ko-3 had a 1-bp deletion in target 2 (Supplemental Fig. S5A). These mutations resulted in premature termination of gene translation which disrupted the normal function of the protein (Supplemental Fig. S5B).
To elucidate the regulatory roles of GmRR1 in soybean P uptake efficiency, T4 homozygous overexpression transgenic (OE) lines and knockout (ko) mutants were subjected to low P stress and RT-qPCR analysis was conducted after 10 days. OE lines exhibited significantly higher GmRR1 expression while ko mutants displayed markedly reduced expression compared to WT under both normal and low P conditions (Fig. 1E). These results indicate successful manipulation of GmRR1 expression. Subsequently, we investigated the morphological changes in OE plants and ko mutants under normal and low P conditions. As depicted in Fig. 2, for the GmRR1 ko mutants, the plant height increased by 27.0% and 34.3%, the root total length was elongated by 27.6% and 29.1%, the root surface area was expanded by 16.5% and 13.8%, and the root dry weight increased by 23.7% and 19.5% under normal and low P conditions, respectively. In addition to the changes in the root, the shoot dry weight and P uptake efficiency also substantially increased. The tolerance to low P stress was significantly improved compared to the WT. In contrast to the changes observed in the ko mutants, GmRR1 OE lines exhibited inhibited plant height and root development (Fig. 2, A and B), including reduced root total length (Fig. 2C), decreased root surface area (Fig. 2D), and lower root dry weight (Fig. 2F) under both normal and low P conditions, particularly under normal P conditions.

Altering the expression of GmRR1 significantly affected the growth of soybean plants under normal and low P conditions. A) Phenotypic comparison of GmRR1 mutants and overexpression of GmRR1 transgenic soybean seedlings for 15 days in NP and LP conditions, respectively. Images were digitally extracted for comparison. Scale bar, 10 cm. B) Comparison of the transgenic soybean seedlings after planting for 30 days. Images were digitally extracted for comparison. Scale bar, 10 cm. C–K) Statistical comparison of total root length (C), root tip number (D), root surface area (E), root dry weight (F), shoot dry weight (G), total dry weight (H), P content in the root (I), P content in the shoot (J), and P uptake efficiency (P uptake per unit root length) (K) (n = 5). L) Plant height of transgenic soybeans and mutants seedlings after planting for 30 days. NP, normal P condition; LP, low P condition; OE, transgenic plants overexpressing GmRR1; ko, GmRR1 knockout mutants. Significant differences compared to WT according to two-sided t test (*P < 0.05; **P < 0.01; ***P < 0.001). Data are means ± standard error of the mean (n = 5).
As an additional approach to scrutinizing the functions of GmRR1, we also conducted a comparison of yield-related traits after maturity. The findings evince that GmRR1 ko mutants exhibited significantly augmented plant height, along with substantially more branches, more pods, and higher seed weight relative to the WT in both P-deficient and sufficient P conditions (Fig. 3, A to E, and G). In contrast to the alterations in the ko mutants, overexpression of GmRR1 led to a significant reduction in the plant height, pod number, and seed weight under P deficiency conditions. However, there was no difference in the 100-seed weight (Fig. 3F). Taken together, these results further validate the significance of GmRR1 in regulating P uptake efficiency not only in seedling stage but also throughout maturation.
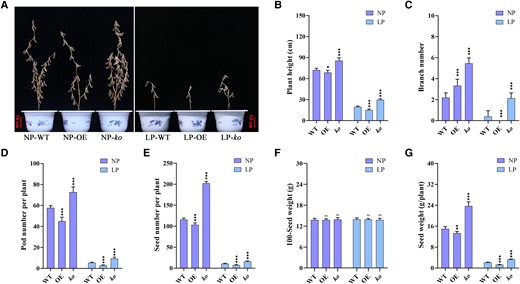
Knockout of GmRR1 increased the seed yield under normal P and low P conditions in soybean. A) Representative images of WT, overexpression lines, and knockout mutants at harvest. Scale bar, 10 cm. (B–G) Comparison of plant height (B), number of branches (C), pod number per plant (D), seed number per plant (E), 100-seed weight (F), and seed weight per plant (G) in transgenic soybean plants under normal P and low P conditions. NP, normal P condition; LP, low P condition; OE, transgenic plants overexpressing GmRR1; ko, GmRR1 knockout mutants. Significant differences according to two-sided t-test (ns represents no significant difference; *P < 0.05; **P < 0.01; ***P < 0.001). Data are means ± standard error of the mean (n = 5).
Functional validation of GmRR1 in regulating the root growth and development in response to P deficiency stress
To further explore the regulatory mechanism of GmRR1 in the root response to low P stress, we observed the epidermis of the root hair and the cortical meristem size of the WT, OE, and ko plant root tips (Fig. 4, A and B). The results of microscopic examinations show that when GmRR1 was knocked out, the number of root hair primordia increased by 80.9%, and the root apical meristem length increased by 30.7% compared with that of the WT with normal P treatment. Meanwhile, under low P conditions, the root hair primordium increased by 109%, and the root apical meristem length increased by 47.3% (Fig. 4, A and C). Overexpression of GmRR1 led to a significant reduction in root hair primordium and root cortical meristem size (Fig. 4, C and D). Then, we measured the contents of cytokinin (including N6-isopentenyl adenine, trans-zeatin, cis-zeatin, and dihydro zeatin) and auxin (indole-3-acetic acid) in the WT, OE, and ko plant roots. Compared with the WT, the content of auxin in the ko lines increased significantly, particularly under P deficiency conditions (Fig. 4E). Conversely, OE lines exhibited a significant reduction in auxin content (Fig. 4E). However, only ko lines showed a significant increase in cytokinin content while overexpression lines experienced a decrease under P deficiency conditions (Fig. 4F). No significant changes were observed under sufficient P conditions. These findings suggest that modifying GmRR1 expression enhanced auxin and cytokinin levels in roots, which promotes increases in root hairs, root length, and root surface area in response to low P stress.
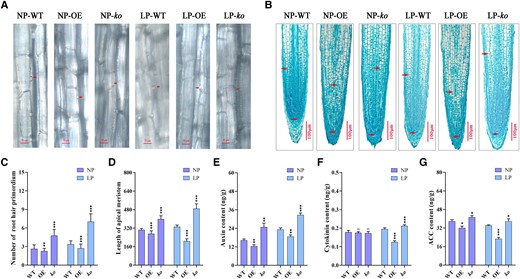
The influences of GmRR1 in root hair primordium, root meristem size, and the content of some phytohormones in root under normal P and low P conditions. A) Root hair primordium initiation in WT, OE, and ko soybean. Scale bars, 50 µm. Arrowhead represents a site of the root hair primordium. B) Root meristem size was expressed from the quiescent center (arrowheads) to the first elongated cortex cell (arrowheads). Scale bars, 100 µm. C) The number of root hair primordium per 100 µm of the lateral root (n ≥ 20). D) The root meristem length in WT, OE, and ko soybean hairy roots (n ≥ 20). E–G) Levels of auxin (E), cytokinin (F), and ACC (G) in the root of GmRR1 overexpression soybean and knockout mutants under normal P and low P conditions (n = 9). NP, normal P condition; LP, low P condition; OE, transgenic plants overexpressing GmRR1; ko, GmRR1 knockout mutants; Significant differences according to two-sided t test (*P < 0.05; **P < 0.01; ***P < 0.001). Data are means ± standard error of the mean (n = 9).
To explore the impact of altering GmRR1 expression on ethylene production, the root level of aminocyclopropane carboxylic acid (ACC, ethylene synthesis precursor) was measured. Interestingly, ACC levels decreased significantly in OE lines and increased significantly in ko lines, particularly under low P conditions (Fig. 4G). These results further support the crucial role of GmRR1 in regulating root responses to low P stress through phytohormone pathways.
GmRR1 interacts with GmHP1 to regulate P uptake efficiency
Subcellular localization analysis showed that GmRR1 was located in the cell nuclei (Fig. 5A). And yeast two-hybrid (Y2H) assay indicated an interaction between GmRR1 and GmHP1 (Glyma.15g099800), which is a histidine-containing phosphotransmitter (Fig. 5B). Furthermore, Bimolecular fluorescence complementation (BiFC) assay and luciferase (LUC) complementation imaging assay in Nicotiana benthamiana leaves indicated that GmRR1 could interact with GmHP1 in vivo (Fig. 5, C and D). Subsequently, RT-qPCR assays were performed to examine whether the expression of GmHP1 was altered in overexpression transgenic soybean roots and mutants. Under low P conditions, the expression level of GmHP1 exhibited a positive association with the transcriptional level of GmRR1 (Fig. 5E), indicating that they may coparticipate in root response to low P stress.
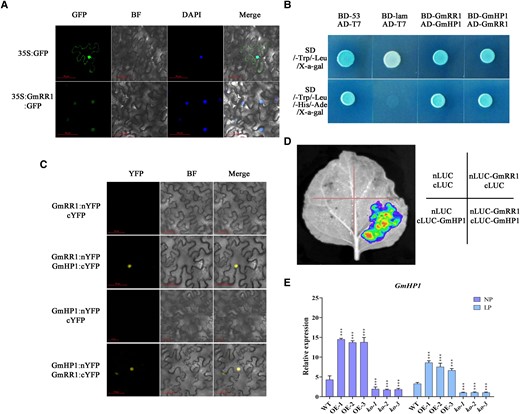
Interaction of GmRR1 and GmHP1. A) Subcellular localization of 35S:GmRR1:GFP fusion protein in cells of Nicotiana benthamiana leaves. GFP, green fluorescence; BF, bright field; DAPI, nuclei were stained with DAPI. Scale bars, 50 µm. B) Yeast two-hybrid assay. Positive control (BD-53 and AD-T7), negative control (BD-lam and AD-T7). Sequences of GmRR1 and GmHP1 were fused to both the pGADT7 activation domain (AD, prey) and the pGBKT7 binding domain (BD, bait). The SD/-Trp/-Leu/X-α-gal (Upper) and SD/-Trp/-Leu/-His/-Ade/X-α-gal (Lower) plates were incubated at 30 °C for 3 days and then visualized. C) Bimolecular fluorescence complementation assay. GmRR1 and GmHP1 were both fused with the N-terminal half of yellow fluorescent protein (nYFP) and the C-terminal half of YFP (cYFP). YFP, yellow fluorescence; BF, bright field. Scale bars, 50 µm. D) Luciferase reporter assay confirmed the interaction between GmRR1 and GmHP1. E) Analysis of relative expression of GmHP1 in transgenic plants and mutants (n = 3). ko-1, ko-2, and ko-3 represent three different knockout GmRR1 lines; OE-1, OE-2, and OE-3 represent three different GmRR1 overexpression lines. Significant differences according to two-sided t test (***P < 0.001). Data are means ± standard error of the mean (n = 3).
GmRR1 influences multiple genes to enhance P uptake efficiency
To further explore the downstream effects of altering the expression of GmRR1, we performed RNA-seq and analyzed the comprehensive gene expression profiles in the roots of the WT, OE, and ko lines. We identified a total of 6,093 differentially expressed genes (DEGs) for the OE lines compared with the WT and 6,239 DEGs for the ko lines compared with the WT (Supplemental Fig. S6, A and B). Among the DEGs, we focused on DEGs that were upregulated or downregulated under both P-deficient and P-sufficient conditions.
Comparing the overexpression lines with the WT, we observed 626 downregulated DEGs, and 526 upregulated DEGs (Supplemental Fig. S6A). To investigate the molecular mechanisms, we conducted gene ontology (GO) and Kyoto Encyclopedia of Genes and Genomes (KEGG) enrichment analysis on these DEGs. The major enriched GO terms included oxidation-reduction process, regulation of nitrogen metabolic process, phosphorelay signal transduction process, defence response process, cellular hormone metabolic process, regulation of hormone levels, and cytokinin metabolic process (Supplemental Fig. S6C). The KEGG pathway analysis showed that plant hormone signal transduction and zeatin biosynthesis were significantly enriched (Supplemental Fig. S7A), indicating the important roles of GmRR1 in regulating low P response by influencing plant hormones. Comparing the ko lines with WT, there were 1,028 downregulated and 449 upregulated DEGs under both normal and low P conditions (Supplemental Fig. S6B). However, the GO and KEGG enrichment analyses show that the main enriched terms included oxidoreductase activity, metal ion binding, thylakoid part, photosynthesis, and phosphorelay signal transduction system (Supplemental Figs. S6D and S7B).
Further analysis demonstrated that the expression levels of many P starvation-responsive genes showed substantial differences in expression in the transgenic lines and mutants, even though the fold change value was not greater than two. For example, the expression of phosphate transporter genes GmPT1, GmPT2, GmPT4, and GmPT7 (Qin et al. 2012) were substantially decreased in the GmRR1 overexpression lines but increased significantly in the GmRR1 knockout lines; GmACP1, which had been identified as a key gene involved in the regulation of P uptake efficiency (Zhang et al. 2014), was also substantially decreased in the GmRR1 OE lines and increased significantly in the GmRR1 ko lines, especially in low P conditions (Fig. 6A). Moreover, the changes in the expression of these genes were determined by RT-qPCR. As shown in Fig. 6B, the expression of GmIPT5 and GmIPT6, which are associated with cytokinin synthesis genes, decreased substantially in the GmRR1 OE lines but increased significantly in the GmRR1 ko mutants. The expression of the auxin transporter gene GmPIN3 and the auxin degrading trigger gene GmGH3 were increased substantially in the GmRR1 OE lines but decreased significantly in the GmRR1 ko mutants. Together, these results indicate that GmRR1 is involved in regulating hormone signal transduction, phosphate transporters, and the expression of acid phosphatase genes to respond to P deficiency stress.
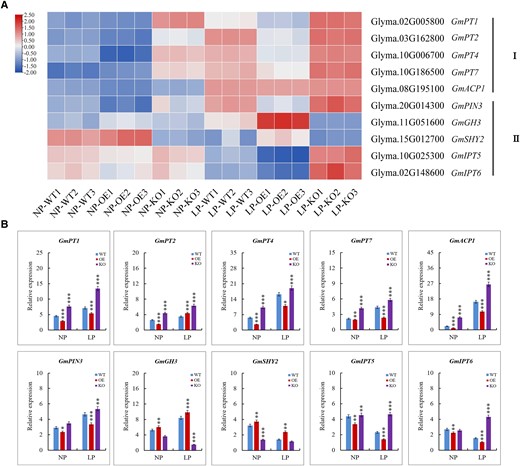
Comparative expression analysis of genes with diverse functions in P efficiency or auxin and cytokinin biosynthesis. A) Expression analysis of the genes in transcriptome data. I, genes related to phosphorus efficiency; II, genes related to auxin and cytokinin biosynthesis. The FPKM values were displayed for gene expression levels and were Log2 normalized to depict the heatmap. The color in each cell represents the value of the Log2 fold change. B) Validation of the gene expression analysis obtained by transcriptome data with RT-qPCR. Significant differences according to two-sided t-test (*P < 0.05; **P < 0.01; ***P < 0.001). Data are means ± standard error of the mean (n = 3). NP, normal P condition; LP, low P condition.
GmRR1 underwent selection during soybean domestication
Generally, wild soybeans (Glycine soja) have better stress resistance. However, various allelic variations in wild soybeans were lost during domestication and artificial selection processes (Lu et al. 2020). To determine whether GmRR1 was selected during soybean domestication, we chose large and more comprehensive soybean material for evolutionary analysis. The genotype data and material information were obtained from the USDA database (Zhang et al. 2022). A total of 934 soybean accessions, including 141 wild accessions, 370 landraces, and 423 cultivated soybeans, were left after removing materials with unclear geographical origins and types and missing genotype accessions from 1,511 soybean accessions. Then, we compared the nucleotide diversity (Fst and π) across the 0.2 mb genomic regions spanning GmRR1 in the 934 soybean accessions. A strong selection signal was identified in GmRR1 between the wild soybeans and landraces (Fig. 7A).
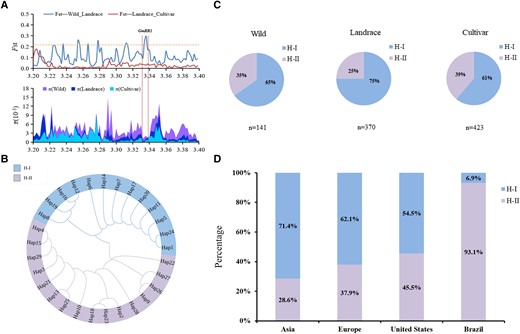
Stepwise selection on GmRR1 during soybean evolution. A)Fst and π in the wild soybeans, landraces, and improved cultivars spanning the promoter and genome regions of GmRR1 using the 934 panels across the world including 141wild soybeans, 370 landraces, and 423 improved cultivars. B) The 29 haplotypes were identified in the 934 panels and grouped into two major groups. C) Haplotype frequencies of GmRR1 in the 934 panels including 141 wild soybeans, 370 landraces, and 423 improved cultivars. D) The distribution percentages of haplotypes (H-I and H-II) across different regions.
According to the nucleotide variation in the GmRR1 promoter and genomic regions, 29 haplotypes were identified and divided into two major groups (H-I and H-II) by phylogenetic analysis (Fig. 7B; Supplemental Fig. S8). The accession Bogao (low P sensitivity) belonged to the H-I group, and Nannong94-156 (low P tolerance) belonged to H-II, which was the elite haplotype group. The frequency of conducive H-II in wild soybean was 35%, which was much higher than that in soybean landraces (26%). However, it greatly increased from landraces to cultivated soybean (Fig. 7C). Soybean accessions harboring conducive H-II are distributed in all major soybean-producing areas worldwide (Fig. 7D). Then, we examined the geographical distribution of the two groups across three distinct types of materials. The analyses revealed that soybean accessions containing conducive H-II are distributed in all major soybean-producing areas in the world (Supplemental Fig. S9). Interestingly, almost all cultivated soybeans in Brazil, a country with high soybean production, belong to the H-II haplotype (Supplemental Fig. S9C). Collectively, these results indicate that full utilization of the H-II haplotype of GmRR1 might be of great importance to increase soybean yield.
Discussion
P is an indispensable nutrient in plant growth and development. However, because most of the annually fertilized P is fixed in organic forms by adsorption, sedimentation, and transformation in the soil (Lu and Tian 2017), plants absorb very little inorganic P which greatly limits crop yields. Plants mainly absorb nutrients from the soil through their roots. Plant breeders are turning their attention to roots to increase yields without causing environmental damage; roots may be the key to a second green revolution (Gewin 2010). In this study, we identified a type-B response regulator 1 (GmRR1). Further functional, cytological, and biochemical studies revealed that GmRR1 could negatively affect P uptake efficiency by redistributing auxin and cytokinin, modifying the size of the root meristem, and adjusting the architecture of the root system in soybean.
GmRR1 is involved in the plant response to low P stress
The response of soybean to low P stress was regulated by multiple quantitative trait loci (QTL) (Zhang et al. 2014; Zhang et al. 2016). At present, QTL mapping and genome-wide association study (GWAS) have been widely used as effective methods for genetic analysis of low P tolerance in a variety of species and several related QTLs have been identified (Gong et al. 2016; Kumar et al. 2021; Liu et al. 2021; Wang et al. 2022). However, few relevant genes within major QTLs have been cloned and functionally identified (Zhang et al. 2014; Yang et al. 2023). In this study, we identified a P starvation-responsive gene (GmRR1) through linkage analysis and GWAS (Fig. 1). Under low P conditions, the expression of GmRR1 was downregulated. Overexpression of GmRR1 in roots resulted in decreased accumulation of auxin and ethylene, which not only inhibited the root hair formation but also suppressed root growth and elongation, thereby, reducing P uptake capacity. Conversely, knockout of GmRR1 led to increased accumulation of auxin and ethylene in roots, promoting root hair formation, as well as enhancing root growth and elongation, ultimately improving the tolerance to P deficiency.
Cytokinins play varying roles in plant development, influencing many important processes, including growth, nutrient responses, and response to biotic and abiotic stresses. The cytokinin pathway in plants contains a two-component system that involves four sequential phosphorylation events alternating between histidine and aspartate residues (Kieber and Schaller 2018). The multistep phosphorelay requires a histidine kinase (HK) receptor that contains both HK and receiver domains, histidine phosphotransmitters (HPs), and separate response regulators (RRs) (Appleby et al. 1996). HPs are downstream of HK receptors in cytokinin signaling and mediate the transfer of a phosphoryl group from the receiver domain of an activated HK receptor to the receiver domain of an RR in the multistep phosphorelay (Hutchison et al. 2006). Type-B RRs, which are activated by phosphorylation of the Asp residue in their receiver domain by AHPs, are critical to the initial transcriptional response to cytokinin (Argyros et al. 2008). Our Y2H, BiFC, and LUC assays also demonstrate that GmRR1 interacts with GmHP1 (Fig. 5, B to D). GmHP1 is homologous to AHP1, which has been reported to form a positive regulatory circuit with type-B RR in cytokinin signal transduction in Arabidopsis (Hwang et al. 2002). The relative expression analysis of GmHP1 in GmRR1 overexpression transgenic and knockout mutant roots also suggests that GmHP1 and GmRR1 co-participate in the response to low P stress in soybean.
Cytokinin functions in the plant root response to low P stress
Phytohormones are implicated in Pi signaling. Ethylene has been demonstrated to mediate the response to low P stress and regulate primary root growth inhibition, lateral root elongation promotion, and root hair formation (Ma et al. 2003; Lei et al. 2011; Song et al. 2016; Yang et al. 2023). Brassinosteroid signaling was shown to be involved in root tip growth inhibition in response to low P stress (Singh et al. 2014). The synthesis of jasmonic acid (JA) was enhanced following exposure to low P stress. The JA signaling-insensitive mutant showed that root inhibition was partially relieved compared with the wild type under low P conditions (Khan et al. 2016). Our research found that the cytokinin signaling pathway negatively regulates soybean roots in response to low P stress. As demonstrated by the transgenic plants treated with low P in assays and RNA-seq reported here, GmRR1 plays important roles in activating root system responses to low P tolerance. Enrichment of hormone-GO terms and cytokinin-GO terms indicates that upregulation of GmRR1 maintains a different hormone level. Under low P conditions, cytokinin signaling was repressed, and auxin signaling was enhanced, which could promote root cell division and hairy root growth. Meanwhile, obstructing cytokinin signaling pathway genes resulted in the elongation and increased number of root hairs as well as increased auxin content in roots. Unexpectedly, we observed that the cytokinin content was significantly reduced in the roots of GmRR1 OE lines and was significantly increased in the roots of GmRR1 ko mutants under low P conditions (Fig. 4F). This may be due to the essential role of GmRR1 in cytokinin signal transduction. After GmRR1 knockout, signal transduction was blocked, causing feedback to promote the continuous synthesis of cytokinin under low P conditions. As levels of cytokinin and auxin increase, the accumulation of other hormones may also be affected, which ultimately influences the modification of root structure. In Arabidopsis, the upregulation of cis-zeatin:trans-zeatin ratio can enhance root hair differentiation and elongation in response to low phosphorus stress (Silva-Navas et al. 2019). Our study also revealed that cis-zeatin content increased and trans-zeatin content decreased in WT plants under low phosphorus conditions. These findings further support the important role of cis-zeatin in regulation of P nutrient utilization and emphasize its conservation across different plant species, or at least in Arabidopsis and soybean. However, this change was disrupted when the expression of GmRR1 was altered (Supplemental Fig. S10), further demonstrating the crucial role of GmRR1 in responding to low phosphorus stress.
Cytokinin often acts in concert with auxin to regulate cell division and differentiation (Kieber and Schaller 2018). A previous study showed that OsAUX1 participates in the response to low P stress by mobilizing auxin from the root apex to the differentiation zone and promoting root hair elongation when roots encounter low P stress in rice (Oryza sativa) (Giri et al. 2018). Our studies found that GmRR1 also participates in the response to P deficiency not only by promoting auxin and cytokinin redistribution and modifying the architecture of the root system but also by affecting the expression of P transporter genes in soybean.
Type-B RRs reveal interplay between auxin and cytokinin signaling pathways under P deficiency conditions
In plants, root growth is sustained by the root meristem (Ioio et al. 2008). The balance between cell division and differentiation in the root apical meristem leads to root growth (Müller and Sheen 2008; Moubayidin et al. 2010; Perilli et al. 2012). However, the antagonism of auxin and cytokinin determines the boundaries of cell division and differentiation in the root tip (Ioio et al. 2007). The interaction between auxin and cytokinin plays a central role in regulating the size of the meristem. Genetic and molecular analyses proved that ARR1 and ARR12 directly activate transcription of the SHORT HYPOCOTYL 2 (SHY2) gene, a repressor of auxin signaling that negatively regulates PIN genes. In contrast, auxin mediates the degradation of the SHY2 protein, sustaining PIN activities and cell division (Ioio et al. 2008). Recently, genome-wide chromatin immunoprecipitation-based microarray experiments (ChIP-chip) demonstrated that the GH3.3 and GH3.17 genes, which mediate auxin degradation, are positively regulated by ARR1 (Di Mambro et al. 2017). In soybean, the expression of GmRR1 was restrained when exposed to low P stress, which promoted auxin and cytokinin redistribution and modified the architecture of the root system. Moreover, overexpression of GmRR1 in the roots decreased the root meristem size, and knockout of GmRR1 in the roots conversely increased the root meristem size both in normal and low P conditions (Fig. 4). These results suggest that type-B RRs play a central role in plant root responses to low P stress in the crosstalk of the auxin and cytokinin signaling pathways.
Full utilization of the GmRR1 elite haplotype will enhance soybean yield
The domestication of legumes was one of the earliest technological innovations in agricultural history (Sedivy et al. 2017). It is believed that cultivated soybean was domesticated from wild soybean in East Asia 6,000–9,000 years ago (Sedivy et al. 2017). The domestication of crops is accomplished through long-term natural selection and artificial selection, which not only leads to the accumulation of beneficial mutations in various landraces and cultivars but also leads to the neglect or even loss of some elite mutations that are difficult to find. Our analysis of the natural variant selection for GmRR1 provides ample evidence that it is a domestication gene. However, the distributions of the elite haplotype show that it was fully utilized in high-yielding soybean countries such as the United States and Brazil (Supplemental Fig. S9C). This observation proposes an approach that utilizes elite alleles to enhance nutrient-efficient utilization and augment yield.
On this basis, we proposed a model in which type-B RRs might be involved in the plant root response to low P stress through crosstalk among auxin, ethylene, and cytokinin signaling pathways, or at least in soybean (Fig. 8). In summary, we identified a P uptake efficiency-related gene, GmRR1, and demonstrated its function as a negative regulator in the regulation of P uptake efficiency. Regulating the changes in hormone content promotes the differentiation of root hair primordium and increases the formation of root hairs. Additionally, it lengthens the apical meristem and promotes root elongation in response to low P stress. Our findings provide insight into the genetic basis for P uptake efficiency as well as a theoretical basis for improving plant nutrient use efficiency, reducing the use of chemical fertilizers, and achieving sustainable agricultural development by adjusting root structure.
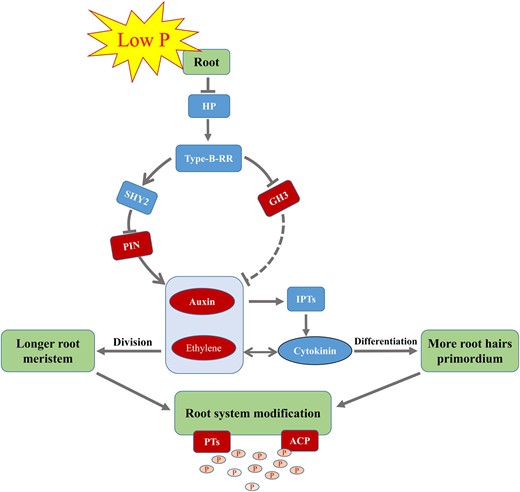
Proposed model of the type-B RR in regulating the response of plant roots to low P stress in soybean. The antagonism of auxin and cytokinin in roots maintains the balance of cell division and cell differentiation of roots. When suffering low P stress, expression of HP and type-B RR are downregulated. On the one hand, it can inhibit the activation of SHY2 (a repressor of auxin signaling that can negatively regulates the PIN gene), promote the accumulation of auxin and ethylene, hinder the transcription of IPTs, and reduce the synthesis of cytokinin. On the other hand, it can also promote the transcription of GH3, mediating auxin degradation. These hormones may reach new relative levels, facilitate root elongation and root hair differentiation, promote the transcription of PT and ACP genes, and ultimately increase P absorption in response to low P stress. HP, histidine-containing phosphotransmitter protein; Type-B-RR, type-B response regulator; SHY2, SHORT HYPOCOTYL 2; GH3, GRETCHEN HAGEN 3; PIN, auxin efflux carrier protein; IPTs, isopentenyltransferases; PTs, phosphorus transporters; ACP, acid phosphatase; P, free phosphorus. The solid arrows and the solid blunt ended arrows represent the stimulation and inhibition effect on downstream gene or substances, respectively. The dashed blunt ended arrow represents the inhibition effect, which remains to be further experimentally confirmed.
Materials and methods
Materials and field experiments
A recombinant inbred line (RIL) F8:12 population consisting of 152 soybean (Glycine max) materials derived from Bogao (female parent, low P sensitive genotype) and Nannong94-156 (male parent, low P tolerant genotype) was used for linkage analysis, with a high-density genetic map containing 6,159 SNPs used as previously described (Zhang et al. 2016). The soybean population for GWAS consisted of a diverse collection of 219 accessions originating from six different ecological regions of Chinese soybean growing areas ranging from 53 to 24°N latitude and 134 to 97°E longitude (Wang et al. 2016).
The field experiments were performed in 2016 and 2017 at the Jiangpu Experimental Station of Nanjing Agricultural University (32.1°N 118.4°E) in Nanjing, China. The soybean materials were planted in the greenhouse in plastic pots (240 × 185 cm) filled with sand from the Yangtze River. The planting dates were April 15, 2016, June 15, 2016, August 15, 2016, April 15, 2017, and June 15, 2017 (designated E1, E2, E3, E4, and E5, respectively). Seeds with different genotypes were sown in different pots. Every pot was planted with 10 seeds, and each genotype had 6 pots (three pots each for normal P and low P). Two seedlings were kept in each pot, and the remaining seedlings were removed after the first pair of true leaves was completely grown. Meanwhile, water with low P Hoagland's nutrient solution (5 µM P) was used as the low P solution, and Hoagland's nutrient solution (1,000 µM P) was added every 4 days (pH = 5.8) to maintain the nutritional levels. Other nutrients were at the levels described in Li et al. (2016). In the low P nutrient solution, there was a lack of KH2PO4, which was replaced with an equimolar amount of KCl to keep the potassium equal. Irrigation with sufficient water was performed once a week to wash away excessive nutrients. The plant height (from the cotyledonary node to the tip of the plants) was measured at the V4 stage (approximately 40 days after being planted), and five samples were randomly selected for both normal P and low P for each genotype.
Phenotypic data analysis
Analysis of variance (ANOVA) and broad heritability of the phenotypic data were performed using R software (Team 2013). The calculation of broad-sense heritability (h2) was performed based on the report by Knapp et al. (1985).
Linkage mapping
The genetic linkage map was constructed from the 152 F8:12 lines of RILs using 6,159 SNP markers on 20 chromosomes, with an average distance of 0.49 cM between adjacent markers (Zhang et al. 2016). Inclusive composite interval mapping (ICIM) was performed for QTL mapping with IciMapping v4.2 (Meng et al. 2015). The scanning step was 1 cM, and the P values for input variables (PIN) were set at 0.01. The LOD thresholds for each QTL index were determined by 1,000 permutation tests at a 95% confidence level (Churchill and Doerge 1994). Linkage mapping circle diagrams were drawn using TBtools software (Chen et al. 2020).
Association mapping
In this study, a total of 207,608 SNPs with MAF ≥ 0.05 acquired from the NJAU 355 K SoySNP array were used to perform GWAS (Wang et al. 2016). A compressed mixed linear model of the GAPIT package (Version 2.0) was selected (Tang et al. 2016). The population structure was accounted for by principal component analysis (PCA), and the relatedness was calculated by the VanRaden method (VanRaden 2008) using GAPIT. The threshold for significant association was set to 1/n [n is the marker number, P value < 1/n, (P < 4.82 × 10⁻⁶)] (Yang et al. 2014). Manhattan plots and QQ plots were generated using the R packages qqman (Turner 2014) and CMplot (Yin et al. 2020). For candidate regional association analysis, SNPs in the candidate intervals were extracted from the resequencing data of 219 accessions (Lu et al. 2020). A total of 766 SNPs in the candidate region (240 kb) were used. The regional association analysis was performed as described above.
Determination of transcript levels by RT-qPCR
First, we cloned the candidate gene from the root of soybean accession Nannong94-156. Subsequently, soybean accession Nannong94-156 was used to analyze the expression of GmRR1 in various organs, such as roots, stems, leaves, flowers, green pods, mature pods, green seeds, and mature seeds. The roots of WT, OE, and ko seedlings were sampled after 15 days of growth under normal and low P treatment conditions to analyze the expression of GmRR1, GmHP1, and some P starvation-responsive genes. All samples were quickly frozen in liquid nitrogen and stored in an ultralow temperature freezer for RNA extraction. See Supplemental Method S1 in the supplementary data for details of total RNA extraction and RT-qPCR. The specific primer sequences are listed in Supplemental Table S5.
Phylogenetic relationship and structure of GmRR1
To explore the classification and structure of the GmRRs, we performed an evolutionary relationship and structural analysis of GmRR1 and all AtRRs previously reported in Arabidopsis (D'Agostino et al. 2000). The coding sequence (CDS) and DNA sequences of the genes required for this experiment were downloaded from the website Phytozome v12.1 (https://phytozome.jgi.doe.gov/pz/portal.html). Multiple sequence alignments were performed using Clustal X, and the neighbor-joining phylogenetic tree was completed by MEGA6.0, with bootstrapping set at 1,000 replications. The structure of genes was analyzed using the Gene Structure Display Server site (http://gsds.cbi.pku.edu.cn/).
Subcellular localization
The CDS region of GmRR1 without stop codon was amplified using specific primers listed in the table and cloned into the pFGC5941 vector, including a GFP expression cassette for subcellular localization analysis of GmRR1. The plasmid containing GmRR1 and the pFGC5941 empty vector as control were transferred into Agrobacterium tumefaciens strain EHA105 and then transferred into Nicotiana benthamiana leaves for transient expression. After 3 days, transformed N. benthamiana leaf epidermal cells were observed using an LSM780 Exciter confocal laser scanning microscope (Zeiss, Germany). The GFP was excited at 488 nm, 110-nm collection bandwidth, and gain was 1.
Vector construction and soybean transformation
The coding DNA sequence of GmRR1 was inserted into the overexpression vector pBA002 between the MluI and SacI sites by homologous recombination method to generate GmRR1 OE construct. To generate the CRISPR/Cas9-engineered GmRR1 mutations, four target sequence adapters for GmRR1 were designed using the CRISPR-P website (http://crispr.hzau.edu.cn/cgi-bin/CRISPR2/CRISPR), and the four target sequence were combined into the multiplex CRISPR/Cas9 system (Zhang et al. 2020). The successfully generated plasmids were transformed into soybean cultivar Jack by Agrobacterium-mediated method (Paz et al. 2006). To identify positive soybean plants, PCR amplification (primers are listed in Supplemental Table S5) and QuickStix Kit for PAT/bar (Envirologix, USA) identification were performed at each generation. DNA sequencing was required to determine whether the target gene was edited and the edited types.
Root structure analysis and phytohormone level determination of transgenic plants
Five T4 transgenic plant roots were chosen randomly to analyze the root length, root surface area, and root tips with an automatic root scan apparatus (WinRHIZO STD4800 LA2400 + scanner, Canada) equipped with WinRHIZO software after 15 days of normal and low P treatment from the WT, OE, and ko line seedlings.
Phytohormone levels were quantified by Wuhan Metware Biotechnology Co., Ltd. (Wuhan, China). Roots were collected after 15 days of normal and low P treatment from the WT, OE, and ko line seedlings. Three biological replicates were used for each genotype. Fifty milligrams of plant sample was weighed into a 2 ml plastic microtube, frozen in liquid nitrogen, and dissolved in 1 ml methanol/water/formic acid (15:4:1, v/v/v). Ten microlitres of internal standard mixed solution (100 ng/ml) was added to the extract as an internal standard (IS) for quantization. The mixture was vortexed for 10 min and then centrifuged for 5 min (12,000 rpm/min and 4°C). The supernatant was transferred to clean plastic microtubes, evaporated to dryness, dissolved in 100 μl 80% methanol (v/v), and filtered through a 0.22-μm membrane filter for further LC‒MS/MS analysis.
The sample extracts were analyzed using a UPLC‒ESI‒MS/MS system (UPLC, ExionLC AD, https://sciex.com.cn/; MS, Applied Biosystems 6500 Triple Quadrupole, https://sciex.com.cn/). The analytical conditions were as follows: LC: column, Waters ACQUITY UPLC HSS T3 C18 (100 mm × 2.1 mm i.d., 1.8 µm); solvent system, water with 0.04% (v/v) acetic acid (A), acetonitrile with 0.04% (v/v) acetic acid (B); gradient program, started at 5% (v/v) B (0–1 min), increased to 95% (v/v) B (1–8 min), 95% (v/v) B (8–9 min), then ramped back to 5% (v/v) B (9–12 min); flow rate, 0.35 ml/min; temperature, 40°C; injection volume: 2 μl. The samples were analyzed via HPLC‒ESI‒MS/MS (high-performance liquid chromatography, HPLC; Shim-pack UFLC SHIMADZU CBM30A system www.shimadzu.com.cn; MS, Applied Biosystems 6500 Triple Quadrupole).
Y2H assay
The 3′ and 5′ ends of the full-length cDNA of GmRR1 were truncated by 99 bp to obtain the nonself-activating and full functional structure domain special fragment, which was then cloned into the pGBKT7 vector [bait vector (BD)]. After the BD recombinant plasmid containing GmRR1 was obtained, the BD recombinant plasmid and soybean root cDNA library plasmid from our laboratory were cotransferred into the yeast strain Y2H-Gold using the Matchmaker Gold Yeast Two-Hybrid System (Clontech, USA) according to the protocol. The transformants were grown on SD/-Trp-Leu, SD/-Trp-Leu-His-Ade agar plates at 30°C for 3–5 days. The clones were potential positive prey plasmids if they can grow normally on both media. Subsequently, the prey plasmids were briefly extracted from putatively positive and transformed into Escherichia coli DH5α competent cells and purified from transformants growing on selected LB/Amp agar plates by using the SPARKeasy plasmid kit (Sparkjade, China). To verify positive clones, the prey plasmids were sequenced using the activation domain (Ad) primers. The sequencing results were analyzed by BLAST in the SoyBase database. The GmHP1 (Glyma.15g099800, histidine-containing phosphotransmitter 1) was the target interacting protein, which had 100% sequence identity.
BiFC assay
The full-length cDNA of GmRR1 and GmHP1 without stop codons were amplified and cloned into the vectors SPYNE173 and 35SSPYCE (M), respectively. The recombinant vectors were named GmRR1:cYFP, GmRR1:nYFP, GmHP1:cYFP, and GmHP1:nYFP. The recombinant vectors were transformed into A. tumefaciens (strain EHA105). Then, the two strains of EHA105 were transiently expressed in the leaves of N. benthamiana (GmRR1:cYFP and GmHP1:nYFP, GmRR1:nYFP and GmHP1:cYFP). All samples were detected using a Zeiss LSM710 confocal microscope system (Zeiss, Jena, Germany) 48 h after infection. The YFP was excited at 488 nm, 110-nm collection bandwidth, and gain was 1.
LUC complementation assay
The CDSs of GmRR1 and GmHP1 were inserted into pCAMBIA1300-nLUC and pCAMBIA1300-nLUC to form recombination plasmids. 4-week-old N. benthamiana leaves coinfiltrated with Agrobacterium expressing GmRR1-nLUC and GmHP1-cLUC, GmRR1-nLUC and cLUC, nLUC and GmHP1-cLUC, cLUC and nLUC were used as negative controls. Luminescence images were captured using a plant living imaging system (Berthold, NightShade LB 985).
RNA-seq analysis
Total RNA was extracted from roots collected from 15-day-old WT, three OE lines, and three ko lines using a Total RNA Kit (AC0103, Sparkjade Biotechnology Co, Shandong, China) according to the manufacturer's instructions. The library for RNA sequencing was generated using 1 μg RNA and NEBNext Ultra Directional RNA Library Prep Kit for Illumina (New England Biolabs, Beverly, MA, USA) and sequenced using Illumina NovaSeq 6000 sequencing (150 bp*2, Shanghai BIOZERON Co., Ltd). The expression level for each gene was calculated using the fragments per kilobase of exon per million mapped reads (FPKM) method. And the differential expression genes (DEGs) were identified using R statistical package edgeR (transcripts with a false discovery rate <0.05 and fold change ≥2 or ≤0.5). The DEGs were subjected to GO and KEGG pathway enrichment analysis, respectively.
Preparation of paraffin section
The root tips (5–8 mm long) of root hairs treated with normal and low P were taken for the paraffin section at the seedling stage. The characteristics of root tip cells were observed by microscope (Axio Scope A1, Carl Zeiss, Germany). See Supplemental Method S2 in the Supplemental data for details.
Accession numbers
Sequence data from this article can be found in the GenBank/EMBL data libraries under accession numbers: GmRR1 (Glyma.09G040000), GmHP1 (Glyma.15G099800), GmPT1 (Glyma.02G005800), GmPT2 (Glyma.03G162800), GmPT4 (Glyma.10G006700), GmPT7 (Glyma.10G186500), GmACP1 (Glyma.08G195100), GmIPT5 (Glyma.10G025300), GmIPT6 (Glyma.02G148600), GmPIN3 (Glyma.20G014300), GmGH3 (Glyma.11G051600), and GmSHY2 (Glyma.15G012700).
Acknowledgments
We acknowledge Mr Deyuan Ma for his assistance in collecting phenotypic data at the Jiangpu Experimental Station of Nanjing Agricultural University.
Author contributions
D.Y., Y.Y., H.C., and F.H. conceived and designed the project; Y.Y. and L.W. conducted the phenotypic data collection. Y.Y., H.Z., and D.Z. analyzed the phenotypic data. L.W., Q.W., and Z.C. assisted in genetic transformation; R.C. and W.Z. conducted the RT-qPCR analysis. Y.Y. and L.W. performed the lab hydroponics experiments, Y2H assay, and BiFC assay, L.W. assisted in the data analysis and figure drawing. Y.Y., L.W., and D.Y. wrote and revised the manuscript.
Supplemental data
The following materials are available in the online version of this article.
Supplemental Figure S1. Histogram of the frequency distribution of plant height of soybean RILs population and natural population under normal and low P concentrations across five environments.
Supplemental Figure S2. Genetic analysis of the loci associated with low phosphorus tolerance.
Supplemental Figure S3. Phylogenetic analysis and GmRR1-based association mapping and pairwise LD analysis.
Supplemental Figure S4. Relative expression (LP/NP) analysis of GmRR1 in response to low P stress.
Supplemental Figure S5. Mutations in the knockout lines generated by CRISPR/Cas9-mediated gene editing.
Supplemental Figure S6. Statistical analysis of transcriptomic comparison and GO term analysis.
Supplemental Figure S7. KEGG term enrichment analysis.
Supplemental Figure S8. Natural variation of GmRR1 in the 934 soybean accessions.
Supplemental Figure S9. Distribution percentages of haplotypes (H-I and H-II) in soybean wild accessions, landraces, and cultivars across different regions.
Supplemental Figure S10. The content of cis-zeatin and trans-zeatin in roots under normal P and low P conditions.
Supplemental Table S1. Descriptive statistics and ANOVA of plant height of RILs population under low P and normal P conditions.
Supplemental Table S2. Descriptive statistics and ANOVA of plant height under low P and normal P conditions in the natural population.
Supplemental Table S3. QTLs for the ratio of plant height under low P and normal P conditions in soybean seedlings of RILs population.
Supplemental Table S4. Details of SNPs significantly associated with the ratio of low P and normal P plant height of soybean.
Supplemental Table S5. Primers used in this study.
Supplemental Method S1. RNA extraction and RT-qPCR.
Supplemental Method S2. Preparation of paraffin section.
Funding
The work was supported in part by the National Key Research and Development Program of China (2021YFF1001204), the National Natural Science Foundation of China (32090065, 32201867, and 32072088), the Horizon 2020 of European Union (EUCLEG/727312), and Jiangsu Agriculture Science and Technology Innovation Fund (CX(22)2003), and the Fundamental Research Funds for the Central Universities.
Data availability
The datasets generated during and/or analyzed during the current study are available from the corresponding author on reasonable request.
Dive Curated Terms
The following phenotypic, genotypic, and functional terms are of significance to the work described in this paper:
References
Author notes
These authors contributed equally to this article.
The author responsible for distribution of materials integral to the findings presented in this article in accordance with the policy described in the Instructions for Authors (https://dbpia.nl.go.kr/plphys/pages/General-Instructions) is Deyue Yu ([email protected]).
Conflict of interest statement. The authors declare that they have no conflict of interest.
