


Abstract
Cyanobacteria have been promoted as a biomass resource that can contribute to carbon neutrality. Synechocystis sp. PCC 6803 is a model cyanobacterium that is widely used in various studies. NADP+ and NAD+ are electron receptors involved in energy metabolism. The NADP+/NAD+ ratio in Synechocystis sp. PCC 6803 is markedly higher than that in the heterotrophic bacterium Escherichia coli. In Synechocystis sp. PCC 6803, NADP+ primarily functions as an electron receptor during the light reaction of photosynthesis, and NADP+ biosynthesis is essential for photoautotrophic growth. Generally, the regulatory enzyme of NADP+ biosynthesis is NAD kinase, which catalyzes the phosphorylation of NAD+. However, a previous study suggested that the regulation of another enzyme contributes to NADP+ biosynthesis in Synechocystis sp. PCC 6803 under photoautotrophic conditions. L-Aspartate oxidase is the first enzyme in NAD(P)+ biosynthesis. In this study, we biochemically characterized Synechocystis sp. PCC 6803 L-aspartate oxidase and determined the phenotype of a Synechocystis sp. PCC 6803 mutant overexpressing L-aspartate oxidase. The catalytic efficiency of L-aspartate oxidase from Synechocystis sp. PCC 6803 was lower than that of L-aspartate oxidases and NAD kinases from other organisms. L-Aspartate oxidase activity was affected by different metabolites such as NADP+ and ATP. The L-aspartate oxidase–overexpressing strain grew faster than the wild-type strain under photoautotrophic conditions. The L-aspartate oxidase–overexpressing strain accumulated NADP+ under photoautotrophic conditions. These results indicate that the regulation of L-aspartate oxidase contributes to NADP+ biosynthesis in Synechocystis sp. PCC 6803 under photoautotrophic conditions. These findings provide insight into the regulatory mechanism of cyanobacterial NADP+ biosynthesis.
Introduction
Cyanobacteria are a group of bacteria that perform oxygenic photosynthesis. Synechocystis sp. PCC 6803 (hereafter Synechocystis 6803) is a freshwater, unicellular cyanobacterium, and its entire genome has been sequenced (Kaneko et al. 1996). Because Synechocystis 6803 has many properties suitable for a model organism, such as natural transformation capability (Yu et al. 2013) and tolerance for cryopreservation, it is widely used for basic and applied studies. In recent years, Synechocystis 6803 has been considered a source of biofuel and chemical production to promote carbon neutrality (Oliver et al. 2016). Several studies have described methods that increase the amount of biomass produced by Synechocystis 6803 (Zhou et al. 2016; Liang et al. 2018).
L-Aspartate oxidase encoded by an nadB gene (NadB, EC 1.4.3.16) is a flavo-oxidase that includes one molecule of FAD. NadB catalyzes the first reaction in NAD(P)+ biosynthesis from L-aspartate under aerobic conditions: L-aspartate + O2 → iminoaspartate + H2O2 (aerobic reaction). NadB enzymes from some bacteria and land plants catalyze the oxidation of L-aspartate using fumarate instead of oxygen as an electron receptor for FADH2 reoxidation under anaerobic conditions: L-aspartate + fumarate → iminoaspartate + succinate (anaerobic reaction) (Tedeschi et al. 1996; Marinoni et al. 2008; Hao et al. 2018). Synechocystis 6803 NadB (SyNadB) also catalyzes both aerobic and anaerobic reactions (Fig. 1; Kukil et al. 2022). A product of the reactions, iminoaspartate, is converted into NAD+ through 4 enzymatic reactions, and NAD+ is phosphorylated to NADP+ in a reaction catalyzed by NAD kinase (Fig. 1). Previous analysis of the Synechocystis 6803 mutant exhibiting low NAD kinase activity indicated that NADP+ biosynthesis affects the NADP+ concentration and growth rate of Synechocystis 6803 (Ishikawa et al. 2019). Also, iminoaspartate is unstable and is nonenzymatically hydrolyzed to oxaloacetate immediately (Fig. 1; Hao et al. 2018). Thus, the reaction catalyzed by NadB may be related to not only NAD(P)+ biosynthesis but also succinate (only under anaerobic conditions) and oxaloacetate generation (Fig. 1).
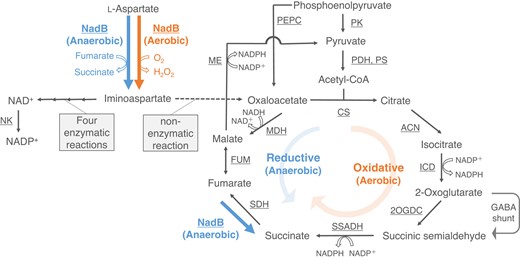
Schematic model of metabolic pathways around the reaction catalyzed by NadB in Synechocystis 6803. The reactions in the TCA cycle are based on the results of previous studies (Muro-Pastor and Florencio 1992; Zhang and Bryant 2011; Xiong et al. 2014; Ito and Osanai 2020; Katayama et al. 2022). The solid and dotted lines indicate enzymatic and nonenzymatic reactions, respectively. The orange and blue arrows represent the reactions in aerobic and anaerobic conditions, respectively. NK, NAD kinase; PEPC, phosphoenolpyruvate carboxylase; PK, pyruvate kinase; PDH, pyruvate dehydrogenase; PS, pyruvate synthase; CS, citrate synthase; ACN, aconitase; ICD, isocitrate dehydrogenase; 2OGDC, 2-oxoglutarate decarboxylase; SSADH, succinic semialdehyde dehydrogenase; SDH, succinate dehydrogenase; FUM, fumarase; ME, malic enzyme; MDH, malate dehydrogenase.
NAD+ and NADP+ are coenzymes for metabolic enzymes that are involved in energy metabolism. Unlike heterotrophic bacteria, cyanobacteria require a large amount of NADP+ for the light reaction of photosynthesis. The NADP+/NAD+ ratio in Synechocystis 6803 is markedly higher than that in Escherichia coli (Bennett et al. 2009; Ishikawa et al. 2016). Previous metabolic flux analysis in Synechocystis 6803 revealed that >70% of NADPH is produced by the light reaction of photosynthesis (Ueda et al. 2018). In general, NAD kinase is the regulatory enzyme of NADP+ biosynthesis (Magni et al. 2006; Love et al. 2015). Although the Synechocystis 6803 mutant whose 1 of 2 NAD kinase isozymes is deleted shows lower NAD kinase activity than the wild-type Synechocystis 6803, the intracellular NADP+ concentration of the mutant is similar to that of the wild type under photoautotrophic conditions (Ishikawa et al. 2016). This result indicates that the reaction catalyzed by NAD kinases is not the rate-limiting step in NADP+ biosynthesis under photoautotrophic conditions, suggesting that another enzyme is the regulatory enzyme of NADP+ biosynthesis under photoautotrophic conditions in Synechocystis 6803.
Oxaloacetate and succinate are intermediates of the tricarboxylic acid (TCA) cycle. In Synechocystis 6803, the TCA cycle proceeds in an oxidative (the oxidative TCA cycle) and reductive (the reductive TCA cycle) direction under aerobic and anaerobic conditions, respectively (Fig. 1; Hasunuma et al. 2016; Nakajima et al. 2017). The oxidative TCA cycle in Synechocystis 6803 is related to aerobic respiration and generates NADPH and not NADH as a reducing power (Fig. 1; Muro-Pastor and Florencio 1992; Ito and Osanai 2020; Katayama et al. 2022). In the oxidative TCA cycle in Synechocystis 6803, oxaloacetate is hardly regenerated because malate is primarily converted to pyruvate (Fig. 1; Katayama et al. 2022). Therefore, the anaplerotic reaction that supplies oxaloacetate is essential for the oxidative TCA cycle in Synechocystis 6803. The reductive TCA cycle in Synechocystis 6803 consists of 3 enzymatic reactions from oxaloacetate to succinate (Fig. 1) and contributes to fermentation to regenerate NAD+ during dark, anaerobic conditions (Hasunuma et al. 2016). A previous study using Synechocystis 6803 mutants suggested that fumarate reduction is catalyzed by NadB rather than succinate dehydrogenase under dark, anaerobic conditions in Synechocystis 6803 (Fig. 1; Kukil et al. 2022). Succinate, which is the final product in the reductive TCA cycle, is a commodity chemical, and Synechocystis 6803 produces and excretes succinate outside the cell under dark, anaerobic conditions (Osanai et al. 2015).
In summary, NadB has been thought to catalyze various reactions in central metabolism in Synechocystis 6803; however, it is unclear whether the regulation of SyNadB contributes to NAD(P)+, oxaloacetate, and succinate generation. In this study, we characterized SyNadB biochemically and examined the effect of SyNadB overexpression on Synechocystis 6803.
Results
The catalytic efficiency of SyNadB in the aerobic reaction was similar to that in the anaerobic reaction
We purified SyNadB as a glutathione-S-transferase (GST)-fusion protein (Fig. 2A) and examined its biochemical properties. SyNadB exhibited enzymatic activity for both aerobic and anaerobic reactions and did not show enzymatic activity in the absence of oxygen and fumarate (Fig. 2B). The activity for aerobic reaction per 1 mg of SyNadB (0.19 units/mg; Fig. 2B) corresponded to the reaction velocity per 1 molecule of SyNadB (17 min−1). Its reaction velocity was not much different from that detected by another research team (∼14 min−1) that purified SyNadB by Strep-Tactin affinity chromatography (Kukil et al. 2022). Also, we attempted to excise the GST tag from GST-tagged SyNadB (Supplemental Fig. S1A). Although the purification after the excision of the GST tag decreased the concentration of SyNadB, we succeeded in purifying SyNadB without the GST tag (Supplemental Fig. S1A). Both aerobic and anaerobic activities of SyNadB without the GST tag were similar to those of GST-tagged SyNadB (Supplemental Fig. S1B). Therefore, we used GST-tagged SyNadB in subsequent biochemical analyses. With respect to the temperature dependence of SyNadB, it showed a consistently high activity (above 85% activity when the highest activity was set at 100%) for the aerobic and anaerobic reactions under 40°C to 50°C (Fig. 2C). For pH dependence, SyNadB showed a consistently high activity in both reactions under pH 7.0 to 7.5 (Fig. 2C). We performed kinetic analyses of SyNadB based on its saturation curves under 40°C and pH 7.0 (Fig. 3) and compared the catalytic efficiency of SyNadB between aerobic and anaerobic reactions (Table 1). For the aerobic reaction, the Km (the substrate concentration at 50% Vmax calculated by using the Michaelis–Menten equation) and kcat (turnover number) of SyNadB for L-aspartate were 33.2 mM and 0.47 s−1, respectively (Table 1). For the anaerobic reaction, the S0.5 (the substrate concentration at 50% Vmax calculated by using the Hill equation) and kcat of SyNadB for L-aspartate were 39.5 mM and 0.51 s−1, respectively (Table 1). The kcat/Km (catalytic efficiency) of SyNadB for L-aspartate in the aerobic reaction (0.014 s−1 mM−1) was similar to that in the anaerobic reaction (0.013 s−1 mM−1; Table 1). We also determined the kinetic parameters of SyNadB for fumarate in the anaerobic reaction (Table 1). The Km, kcat, and kcat/Km of SyNadB for fumarate were 0.22 mM, 0.47 s−1, and 2.36 s−1 mM−1, respectively (Table 1).
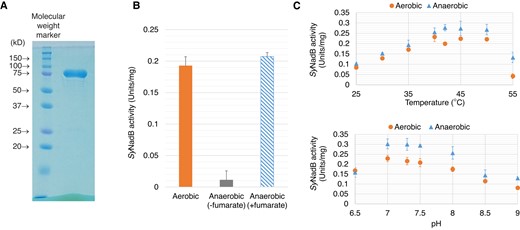
Effect of temperature and pH on SyNadB activities for the aerobic and anaerobic reactions. A) SDS–PAGE after purification of GST-tagged SyNadB. The left and right bands indicate the molecular weight marker and the protein after purification, respectively. B) Confirmation of SyNadB activities for the aerobic and anaerobic reactions. The concentration of L-aspartate was fixed at 100 mM. To confirm SyNadB activity for the anaerobic reaction in the presence of fumarate (the blue bar), 1 mM fumarate was added to the assay solution. C) Temperature (top) and pH (bottom) dependence of SyNadB activities for the aerobic and anaerobic reactions. The concentration of L-aspartate was fixed at 100 mM. For the measurement of SyNadB activity for the anaerobic reaction, the concentration of fumarate was fixed at 2 mM. All the data in Fig. 2 represent the mean ± Sd based on 3 independent measurements.
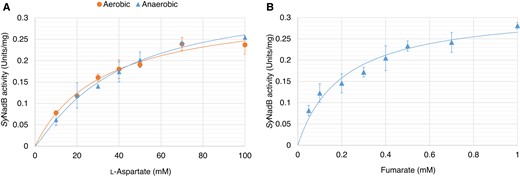
Saturation curves of SyNadB for L-aspartate and fumarate. A) Saturation curves of SyNadB for L-aspartate under aerobic and anaerobic reactions. For the measurement of SyNadB activity for the anaerobic reaction, the concentration of fumarate was fixed at 2 mM. The coefficients of determination (R2) of curve fitting in the aerobic and anaerobic reactions were 0.97819 and 0.98876, respectively. The χ2 values of curve fitting in the aerobic and anaerobic reactions were 0.00046 and 0.00032, respectively. B) Saturation curve of SyNadB for fumarate in the anaerobic reaction. The concentration of L-aspartate was fixed at 100 mM. The R2 and χ2 of curve fitting were 0.95209 and 0.00151, respectively. The data in Fig. 3 represent the mean ± Sd based on 3 independent measurements.
Kinetic parameters of NadBs in the aerobic and anaerobic reactions
| Organism | Substrate or electron receptor | Km (S0.5) (mM) | kcat (s−1) | kcat/Km (s−1 mM−1) | Reference |
|---|---|---|---|---|---|
| Aerobic reaction | |||||
| Synechocystis sp. PCC 6803 | L-Aspartate | 33.2 ± 5.1 | 0.47 ± 0.03 | 0.014 ± 0.002 | This study |
| Escherichia coli | 5.2 | 2.60 | 0.50 | Tedeschi et al. (1996) | |
| Pseudomonas putida | 2.3 | 10.60 | 4.69 | Leese et al. (2013) | |
| Bacillus subtilis | 1.0 ± 0.5 | 0.18 ± 0.02 | 0.18 | Marinoni et al. (2008) | |
| Thermococcus litoralis | 7.5 | 4.26 | 0.57 | Washio and Oikawa (2018) | |
| Arabidopsis thaliana | 0.79 ± 0.12 | 0.25 ± 0.02 | 0.32 | Hao et al. (2018) | |
| Anaerobic reaction | |||||
| Synechocystis sp. PCC 6803 | L-Aspartate | 39.5 ± 8.0 | 0.51 ± 0.04 | 0.013 ± 0.002 | This study |
| Escherichia coli | 2.7 | 5.55 | 2.06 | Tedeschi et al. (1996) | |
| Bacillus subtilis | 20.0 ± 3.0 | 0.50 ± 0.30 | 0.025 | Marinoni et al. (2008) | |
| Arabidopsis thaliana | 0.92 ± 0.05 | 0.38 ± 0.005 | 0.41 | Hao et al. (2018) | |
| Synechocystis sp. PCC 6803 | Fumarate | 0.22 ± 0.08 | 0.47 ± 0.04 | 2.36 ± 0.84 | This study |
| Escherichia coli | 2.5 | 5.55 | 2.22 | Tedeschi et al. (1996) | |
| Bacillus subtilis | 1.4 ± 0.9 | 0.50 ± 0.30 | 0.35 | Marinoni et al. (2008) | |
| Arabidopsis thaliana | N.R. | N.R. | N.R. | Hao et al. (2018) | |
The concentration of L-aspartate or fumarate during the measurement of SyNadB activity was described in the legend of Fig. 3. The kinetic parameters of SyNadB for L-aspartate in anaerobic conditions were calculated using the Hill equation, and the Hill coefficient (nH) was 1.2 ± 0.1. The other kinetic parameters of SyNadB were calculated using the Michaelis–Menten equation. All the kinetic parameters of SyNadB represent the mean ± Sd based on 3 independent saturation curves. N.R. indicates the kinetic parameters that were not reported. The Km (S0.5), kcat, and kcat/Km mean the substrate concentration at 50% Vmax, turnover number, and catalytic efficiency, respectively.
Aerobic and anaerobic SyNadB activities were inhibited by different metabolites
We measured SyNadB activity in the presence of different metabolites (Fig. 4). Absolute molar concentrations of metabolites such as organic acids and nucleotides in cyanobacteria are not reported. To consider the effects of all modes of inhibition, the concentrations of L-aspartate and effectors were fixed at the same concentration (5 mM) below Km of SyNadB for L-aspartate (Fig. 4). Four nucleotides (NAD+, NADP+, ATP, and ADP) and citrate decreased SyNadB activity in the aerobic reaction (Fig. 4). Similarly, these 5 metabolites decreased SyNadB activity in the anaerobic reaction (Fig. 4). Surprisingly, the effects of malate and succinate on SyNadB activity were different between the aerobic and the anaerobic reactions (Fig. 4). Although malate and succinate did not decrease SyNadB activity in the aerobic reaction, these 2 metabolites decreased SyNadB activity during the anaerobic reaction (Fig. 4).
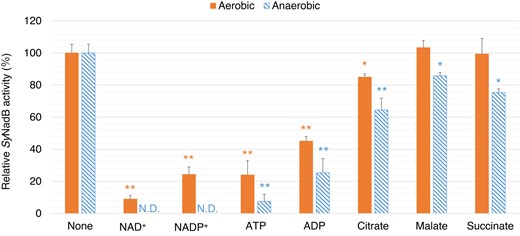
SyNadB activities for the aerobic and anaerobic reactions in the presence of effectors. The data represent the relative activity of SyNadB, and the activity in the absence of effectors represents 100%. The concentrations of L-aspartate and effectors were fixed at 5 mM. For the measurement of SyNadB activity in the anaerobic reaction, the concentration of fumarate was fixed at 0.5 mM. All data represent the mean ± Sd based on 3 independent measurements. Statistically significant differences between the activities in the absence and presence of effectors were examined by performing Welch's t-test and these are represented by asterisks (*P < 0.05, **P < 0.005). N.D. indicates SyNadB activities that were not detected.
Overexpression of SyNadB increased the intracellular NADP+ level in Synechocystis 6803 under photoautotrophic conditions
To clarify whether the regulation of SyNadB contributes to NAD(P)+, oxaloacetate, and succinate generation, we established a Synechocystis 6803 strain that overexpressed the SyNadB gene (designated as NadBox strain; Fig. 5, A and B). The expression level of the gene encoding SyNadB in the NadBox strain was 2.2-fold higher than that in the wild-type glucose-tolerant (GT) strain of Synechocystis 6803 (Fig. 5B). Although we also attempted to measure the SyNadB activities in cell extracts of these strains, the activities were not detected because of their extremely low activities. The growth of the NadBox strain was faster than that of the GT strain under photoautotrophic conditions, where photon flux density is 120 μmol photons m−2 s−1 (Fig. 5C). The OD730 (cell density) of the NadBox was higher than that of the GT strain after dark, anaerobic cultivation (Fig. 5D). We quantified intracellular NAD(P)+ and organic acids in the NadBox and GT strains following photoautotrophic (aerobic) cultivation (Photon flux density: 120 μmol photons m−2 s−1) and dark, anaerobic cultivation (Fig. 6A). The intracellular levels of NAD+ after aerobic and anaerobic cultivations in the NadBox strain were similar to those in the GT strain (Fig. 6B). The intracellular level of NADP+ after aerobic cultivation in the NadBox strain was 1.8-fold higher than that in the GT strain (Fig. 6B). In addition, the intracellular level of NADP+ in the NadBox strain after aerobic cultivation was higher than that after anaerobic cultivation (Fig. 6B). The NADP+/NAD+ ratios of the GT and NadBox strains after aerobic cultivation were 0.54 and 0.87, respectively. The NADP+/NAD+ ratios of the GT and NadBox strains after anaerobic cultivation were 0.34 and 0.33, respectively. As for the quantification of intracellular organic acids, citrate, malate, and succinate were quantified (Fig. 6C). We quantified citrate and malate generated from oxaloacetate because oxaloacetate is undetectable in Synechocystis 6803 due to its low abundance (Hasunuma et al. 2016, 2018). The intracellular levels of citrate and malate after aerobic and anaerobic cultivations in the NadBox strain were similar to those in the GT strain (Fig. 6C). The intracellular levels of succinate following aerobic and anaerobic cultivations in the NadBox strain were similar to those in the GT strain (Fig. 6C). As for the NadBox strain, the intracellular level of succinate after anaerobic cultivation was higher than that after aerobic cultivation (Fig. 6C).
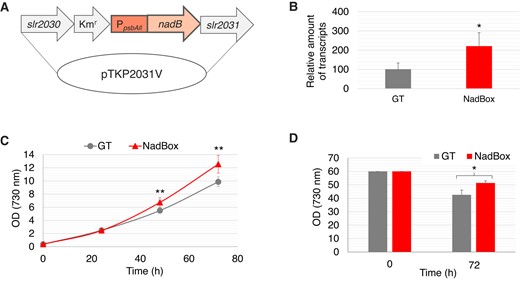
Construction of the NadBox strain. A) Vector for producing the NadBox strain. B) Expression levels of a gene encoding SyNadB in the GT and NadBox strains. The data represent the relative amount of transcripts, and the amount in the GT strain was designated as 100%. The data represent the mean ± Sd based on 4 independent measurements. Statistically significant differences between the expression levels in the GT and NadBox strains were examined by performing Welch's t-test and these are represented by an asterisk (*P < 0.05). C) Growth curves of the GT and NadBox strains under photoautotrophic conditions where photon flux density is 120 μmol photons m−2 s−1. The data represent the mean ± Sd based on 5 to 11 independent measurements. Statistically significant differences between OD730 (cell density) of the GT and NadBox strains were examined by performing Welch's t-test and these are represented by asterisks (**P < 0.005). D) The cell density of the GT and NadBox strains after dark, anaerobic cultivation for 3 d. The data represent the mean ± Sd based on 4 independent measurements. The statistically significant difference between OD730 of the GT and NadBox strains was examined by performing Welch's t-test and this is represented by an asterisk (*P < 0.05).
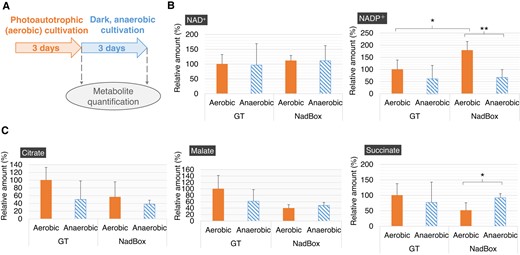
Quantification of metabolites in the GT and NadBox strains after photoautotrophic and dark, anaerobic cultivations. A) Scheme of metabolite quantification. With regard to the photoautotrophic cultivations, the photon flux density was set at 120 μmol photons m−2 s−1. B) Intracellular NAD(P)+ levels in the GT and NadBox strains. The data represent relative values, and the values in the GT strain after photoautotrophic cultivation represent 100%. Statistically significant differences were examined by performing Welch's t-test and are represented by asterisks (*P < 0.05, **P < 0.005). C) Intracellular levels of organic acids in the GT and NadBox strains. The data represent relative values, and the values in the GT strain after photoautotrophic cultivation were designated as 100%. Statistically significant differences were examined by performing Welch's t-test and are represented by an asterisk (*P < 0.05). All data in Fig. 6 represent the mean ± Sd based on 4 independent measurements.
To confirm the fast growth and high intracellular NADP+ level in the NadBox strain under photoautotrophic conditions, we also cultivated the NadBox strain under photoautotrophic conditions where photon flux density is 50 μmol photons m−2 s−1 (Fig. 7). The NadBox strain grew faster than the GT strain (Fig. 7A). The intracellular level of NADP+ in the NadBox strain was 1.5-fold higher than that in the GT strain (Fig. 7B).
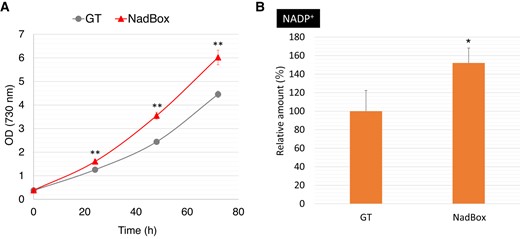
The growth rates and intracellular NADP+ levels in the GT and NadBox strains under photoautotrophic conditions where photon flux density is 50 μmol photons m−2 s−1. A) Growth curves of the GT and NadBox strains. Statistically significant differences between OD730 of the GT and NadBox strains were examined by performing Welch's t-test and these are represented by asterisks (**P < 0.005). B) Intracellular NADP+ levels in the GT and NadBox strains. The data represent relative values, and the values in the GT strain after photoautotrophic cultivation represent 100%. Statistically significant difference was examined by performing Welch's t-test and is represented by an asterisk (*P < 0.05). All data in Fig. 7 represent the mean ± Sd based on 4 independent measurements.
Discussion
We revealed the biochemical properties of SyNadB and the phenotype of the NadBox strain, including the growth rate and intracellular metabolite levels.
Kinetic parameters such as the kcat/Km of other NadBs in the aerobic reaction were reported in bacteria (E. coli, Pseudomonas putida, Bacillus subtilis; Tedeschi et al. 1996; Marinoni et al. 2008; Leese et al. 2013), archaea (Thermococcus litoralis; Washio and Oikawa 2018), and land plant [Arabidopsis (Arabidopsis thaliana)] (Hao et al. 2018; Table 1). The kcat/Km of SyNadB for L-aspartate in the aerobic reaction (0.014 s−1 mM−1) was lower than that of NadBs from the other 5 species (0.18 to 4.69 s−1 mM−1; Table 1), indicating that SyNadB is a low-activity NadB for the aerobic reaction. On the basis of the results of previous analyses (Bennett et al. 2009; Dempo et al. 2014; Wan et al. 2017), we estimated the intracellular concentrations of metabolites in Synechocystis 6803 to discuss SyNadB activity in vivo (Supplemental Table S1). The estimated aspartate concentration in Synechocystis 6803 (32 mM; Supplemental Table S1) was similar to the Km of SyNadB for L-aspartate in the aerobic reaction (33.2 mM; Table 1). Also, the optimum pH of SyNadB (pH 7.0 to 7.5; Fig. 2C) was lower than the intracellular pH of Synechocystis 6803 (∼pH 7.8 at both light and dark conditions; Nakamura et al. 2021). These results suggest that SyNadB cannot exhibit high activity in vivo. Under photoautotrophic (aerobic) conditions, the NadBox strain grew faster than the GT strain (Figs. 5C and 7A) and accumulated intracellular NADP+ (Figs. 6B and 7B). In general, NAD kinase is the regulatory enzyme of NADP+ biosynthesis (Magni et al. 2006; Love et al. 2015). The kcat/Km of SyNadB for a substrate in the aerobic reaction (0.014 s−1 mM−1) was markedly lower than that of all NAD kinases biochemically analyzed (NAD+: 0.39 to 142 s−1 mM−1, ATP: 0.24 to 968 s−1 mM−1; Table 2). These results indicate that the regulation of SyNadB contributes to NADP+ biosynthesis under photoautotrophic conditions. Synechocystis 6803 generates most NADPH in cells through ferredoxin-NADP+ reductase in photosynthesis under both low- and high-light conditions (Ueda et al. 2018). The decrease in the supply of NADP+ results in the generation of active oxygen instead of NADPH in photosynthesis (Baker 1996). These results suggest that the regulation of SyNadB activity is one of the key factors in maintaining photosynthesis. In E. coli, NAD+ acts as an inhibitor of NadB (Nasu et al. 1982). SyNadB activity was inhibited by not only NAD+ but also NADP+ in vitro (Fig. 4). In E. coli, the intracellular concentration of NADP (0.12 mM) is drastically lower than that of NAD (2.7 mM; Bennett et al. 2009). On the other hand, in Synechocystis 6803, the estimated concentration of NADP (2.8 mM), is similar to that of NAD (2.3 mM; Supplemental Table S1). Therefore, we presume that NADP+ also acts as a feedback inhibitor of SyNadB in vivo. ATP and ADP (particularly ATP), which have not been reported as inhibitors of other NadBs, also inhibited SyNadB activity (Fig. 4). The estimated ATP concentration in Synechocystis 6803 (9.6 mM; Supplemental Table S1) was higher than the ATP concentration decreasing 76% of SyNadB activity (5 mM; Fig. 4). This suggests that ATP has a great inhibitory effect on SyNadB activity in vivo. In the light reaction of photosynthesis, ATP generation is closely linked to NADPH production (Kramer and Evans 2011). Overproduction of NADPH via the light reaction of photosynthesis results in a decrease in the photosynthetic efficiency of Synechocystis 6803 (Zhou et al. 2016). Also, in Synechocystis 6803, the oxidative TCA cycle enzymes utilize NADP+ rather than NAD+ as a coenzyme and generate NADPH for aerobic respiration (Fig. 1; Muro-Pastor and Florencio 1992; Ito and Osanai 2020; Katayama et al. 2022). These results suggest that SyNadB activity is inhibited by ATP to avoid the overproduction of NADPH when ATP is sufficiently supplied by photosynthesis and aerobic respiration. Also, citrate slightly inhibited SyNadB activity in the aerobic reaction in vitro (Fig. 4). The estimated citrate concentration in Synechocystis 6803 (9.7 mM; Supplemental Table S1) was higher than the citrate concentration decreasing SyNadB activity (5 mM; Fig. 4). However, the NadBox strain did not accumulate citrate under photoautotrophic conditions (Fig. 6C). Therefore, we presume that the regulation of SyNadB does not contribute to citrate generation from oxaloacetate, and the feedback inhibition of SyNadB by citrate is not critical in vivo under photoautotrophic conditions.
Kinetic parameters of NAD kinases in different organisms
| Organism | Substrate | Km (S0.5) (mM) | kcat (s−1) | kcat/Km (s−1 mM−1) | Reference |
|---|---|---|---|---|---|
| Escherichia coli | NAD+ | 2.00 | 125.0 | 38.0 | Kawai et al. (2001) |
| Sphingomonas sp. A1 | 0.43 | 2.95 | 6.86 | Ochiai et al. (2004) | |
| Corynebacterium glutamicum ssp. lactofermentum JHI3-156 | 4.02 | 3.80 | 0.94 | Shi et al. (2012) | |
| Corynebacterium glutamicum ssp. lactofermentum ATCC 13869 | 1.40 | 0.54 | 0.39 | Shi et al. (2012) | |
| Bacillus subtilis | 1.0 | 5.46 | 5.46 | Garavaglia et al. (2003) | |
| Listeria monocytogenes | 1.11 | 13.12 | 11.8 | Poncet-Montange et al. (2007) | |
| Methanococcus jannaschii | 3.00 | 424 | 142 | Kawai et al. (2005) | |
| Entamoeba histolytica | 1.59 | 1.90 | 1.20 | Jeelani et al. (2013) | |
| Escherichia coli | ATP | 2.50 | 55.0 | 22.0 | Kawai et al. (2001) |
| Sphingomonas sp. A1 | 1.92 | 30.33 | 15.80 | Ochiai et al. (2004) | |
| Corynebacterium glutamicum ssp. lactofermentum JHI3-156 | 1.95 | 2.54 | 1.30 | Shi et al. (2012) | |
| Corynebacterium glutamicum ssp. lactofermentum ATCC 13869 | 2.15 | 0.52 | 0.24 | Shi et al. (2012) | |
| Bacillus subtilis | 1.1 | 1.36 | 1.24 | Garavaglia et al. (2003) | |
| Listeria monocytogenes | 2.8 | 13.78 | 4.92 | Poncet-Montange et al. (2007) | |
| Methanococcus jannaschii | 0.35 | 399 | 968 | Kawai et al. (2005) | |
| Entamoeba histolytica | 1.74 | 2.02 | 1.16 | Jeelani et al. (2013) |
The kinetic parameters of cyanobacterial NAD kinases are not reported. The Km (S0.5), kcat, and kcat/Km mean the substrate concentration at 50% Vmax, turnover number, and catalytic efficiency, respectively.
Kinetic parameters such as the kcat/Km of other NadBs in the anaerobic reaction have been reported in E. coli (Tedeschi et al. 1996), B. subtilis (Marinoni et al. 2008), and Arabidopsis (Hao et al. 2018; Table 1). The kcat/Km of SyNadB for L-aspartate in the anaerobic reaction (0.013 s−1 mM−1) was lower than those of NadBs from the other 3 species (0.025 to 2.06 s−1 mM−1; Table 1). The kcat/Km of SyNadB for fumarate in the anaerobic reaction (2.36 s−1 mM−1) was similar to that of E. coli NadB (2.22 s−1 mM−1) and higher than that of B. subtilis NadB (0.35 s−1 mM−1; Table 1). A comparison of catalytic efficiency among NadBs suggests that the activity for the anaerobic reaction of SyNadB is not much different from those of NadBs from other organisms. A previous study suggested that instead of succinate dehydrogenase, SyNadB catalyzes fumarate reduction under dark, anaerobic conditions in Synechocystis 6803 (Kukil et al. 2022). The estimated fumarate concentration of Synechocystis 6803 (0.73 mM; Supplemental Table S1) was higher than the Km of SyNadB for fumarate (0.22 mM; Table 1). This high affinity of SyNadB for fumarate may enable SyNadB to catalyze fumarate reduction. In the NadBox strain, the intracellular succinate concentration under dark, anaerobic conditions was higher than that under photoautotrophic conditions (Fig. 6C). The kcat/Km of SyNadB for the substrate (0.013 s−1 mM−1) was markedly lower than that of the other reductive TCA cycle enzymes [malate dehydrogenase (MDH): 59.5 s−1 mM−1, fumarase: 90.3 s−1 mM−1] (Takeya et al. 2018; Katayama et al. 2019). These results suggest that the regulation of SyNadB contributes to succinate generation via the reductive TCA cycle. As for the production of succinate under dark, anaerobic conditions in Synechocystis 6803, malate and fumarate (precursors to succinate in the reductive TCA cycle) are also produced as by-products and excreted from the cells (Hasunuma et al. 2016; Iijima et al. 2021; Hidese et al. 2022). The regulation of SyNadB activity may be a useful approach to increase carbon flux from malate and fumarate to succinate under dark, anaerobic conditions. Unlike SyNadB activity in the aerobic reaction, SyNadB activity in the anaerobic reaction was slightly inhibited by malate and succinate in vitro (Fig. 4). However, the estimated concentrations of malate (0.82 mM) and succinate (1.4 mM) in Synechocystis 6803 were lower than their concentrations decreasing SyNadB activity (5 mM; Fig. 4). This suggests that malate and succinate hardly inhibit SyNadB activity in vivo.
In this study, we revealed that the regulation of NadB contributes to NADP+ biosynthesis in Synechocystis sp. PCC 6803 under photoautotrophic conditions. This finding provides insight into the role of NadB in the central metabolism of cyanobacteria. Also, the NadBox strain grew faster than the GT strain under photoautotrophic conditions (Figs. 5C and 7A). Therefore, the regulation of the expression level of the gene encoding NadB is a breakthrough method, which will increase the biomass production of Synechocystis 6803.
Materials and methods
Preparation of an expression vector containing the gene encoding SyNadB transformed into E. coli cells
The nucleotide sequence of the gene encoding SyNadB (sll0631) was obtained from the KEGG database (https://www.genome.jp/kegg/kegg_ja.html) and synthesized by Eurofins Genomics Japan (Tokyo, Japan). The sequence was inserted into the BamHI-XhoI site of the pGEX6P-1 vector (GE Healthcare, Little Chalfont, UK).
Expression of recombinant SyNadB in E. coli cells and affinity purification of recombinant SyNadB
The constructed GST-tagged SyNadB vector was transformed into E. coli BL21 (DE3) competent cells (BioDynamics Laboratory Inc., Tokyo, Japan). A shaking culture (150 rpm) of 4 L of the transformed E. coli cells was performed in a LB medium overnight at 30°C, and protein expression was induced by 20 μM isopropyl β-D-1-thiogalactopyranoside. Thereafter, E. coli cells were suspended in 30 mL of PBS-T [0.137 M NaCl, 2.7 mM KCl, 8.1 mM Na2HPO4·12H2O, 1.47 mM KH2PO4, 0.005% (w/v) Tween-20] containing 200 μM FAD. The FAD concentration was set at a range that was drastically higher than that of the dissociation constant (Kd) of NadBs (0.4 to 0.6 μM; Tedeschi et al. 1999; Hao et al. 2018). Then, the mixture was sonicated using a model VC-750 sonicator (EYELA, Tokyo, Japan) in the dark. Sonication (20 s at 20% intensity) was repeated 10 times. After centrifugation (5,800 × g for 2 min at 4°C), 560 μL of glutathione-Sepharose 4B resin (Cytiva, Tokyo, Japan) and 100 μM FAD were added to the supernatant (soluble fraction). To combine GST-tagged SyNadB with resin, the soluble fraction containing the resin was shaken for 30 min on ice. After centrifugation (5,800 × g for 2 min at 4°C), the resin containing the GST-tagged SyNadB was washed with 700 μL of PBS-T containing 200 μM FAD. This wash was repeated 10 times. The GST-tagged SyNadB was eluted in 700 μL of GST elution buffer [50 mM Tris-HCl (pH 8.0) and 10 mM reduced glutathione] containing 200 μM FAD. The elution was repeated 4 times. To enhance the purity of GST-tagged SyNadB, the eluted proteins were concentrated using a Vivaspin 500 MWCO 50,000 device (Sartorius, Göttingen, Germany). The purity of GST-tagged SyNadB was confirmed by SDS–PAGE [12% (w/v) polyacrylamide] and staining with QuickBlue Staining Solution (BioDynamics Inc.). GST-tagged SyNadB with 100 μM FAD was stored as a 50% (v/v) glycerol stock in the dark at −80°C.
Excision of the GST tag from GST-tagged SyNadB
Excision of the GST tag from GST-tagged protein was performed in accordance with the previously described method (Ito and Osanai 2020) with few alterations. After the purification of GST-tagged SyNadB, 35 units of PreScission Protease (GE Healthcare Japan, Tokyo, Japan) were added to the purified GST-tagged SyNadB. The sample was incubated for 24 h at 4°C. Thereafter, to eliminate the GST tag and PreScission Protease from the sample, 500 μL of Glutathione-Sepharose 4B resin was added to the sample. The mixture was gently rotated for 1 h at room temperature (27°C). After the Glutathione-Sepharose 4B resin was removed by centrifugation (5,800 × g for 2 min at 4°C), the protein concentrations were measured by using a Pierce BCA Protein Assay Kit (Thermo Fisher Scientific, Rockford, IL, USA). The purity of SyNadB without the GST tag was confirmed by SDS–PAGE [12% (w/v) polyacrylamide] and staining with QuickBlue Staining Solution.
Enzyme assay for SyNadB
SyNadB activity was measured by using the coupled assay with MDH, as described previously (Tedeschi et al. 1996). NADH consumption via the reaction catalyzed by MDH was monitored as a decrease in absorbance at 340 nm by using a Hitachi U-3310 spectrophotometer (Hitachi High-Tech., Tokyo, Japan). The aerobic reaction catalyzed by SyNadB was performed in a 1 mL assay solution [50 mM Tris-HCl (pH 7.0), various concentrations of sodium L-aspartate, 0.1 mM NADH, 100 U MDH (Oriental Yeast, Tokyo, Japan), 40 μM FAD, and 200 to 1,200 pmol SyNadB]. The oxygen concentration at 40°C in the assay solution containing 100 mM sodium L-aspartate was measured by using an Oxytherm Clark-type oxygen electrode (Hansatech Instruments, King's Lynn, UK) and was 0.21 mM. After incubation of the assay solution without SyNadB at 40°C for 5 min, SyNadB was added to the solution to initiate the reaction. For the measurement of the anaerobic reaction catalyzed by SyNadB, the assay solution was converted to anaerobic conditions by using a glucose oxidase/catalase system (Mueller et al. 2009). The anaerobic reaction was performed in a 1 mL assay solution [50 mM Tris-HCl (pH 7.0), various concentrations of sodium L-aspartate, 0.1 mM NADH, 100 U MDH, 40 μM FAD, various concentrations of disodium fumarate, 500 U glucose oxidase (Fujifilm Wako, Ltd., Osaka, Japan), 500 U catalase (Tokyo Chemical Industry Co., Ltd., Tokyo, Japan), and 200 to 2,000 pmol SyNadB]. After incubation of the assay solution without SyNadB at 40°C for 5 min, SyNadB was added to the solution to initiate the reaction. For the anaerobic reaction, the surface of the assay solution was covered with 100 μL of water-saturated 1-butanol to prevent oxygen access. One unit of SyNadB activity was defined as the amount of enzyme that converts 1 μmol of substrate per min.
Calculation of the kinetic parameters of SyNadB
Calculation of the kinetic parameters, except kcat, was done by curve fitting using Kaleida Graph ver. 4.5. The Hill equation (Equation 1; Dixon and Webb 1979) was used for curve fitting when the cooperativity to the substrate or electron receptor was confirmed. The Michaelis–Menten equation (Equation 2) was used for curve fitting when the cooperativity was not confirmed.
The kcat was calculated from the maximum reaction velocity (Vmax).
Preparation of a vector for producing the NadBox strain
The nucleotide sequence of the gene encoding SyNadB (sll0631) was synthesized and introduced into the NdeI-HpaI sites of the pTKP2031V vector containing the psbAII promoter by Eurofins Genomics Japan. The pTKP2031V vector was constructed by Satoh et al. (2001). The gene encoding SyNadB and the psbAII promoter were integrated between 2 genes (slr2030 and slr2031) in Synechocystis sp. PCC 6803 (Synechocystis 6803) along with a kanamycin resistance cassette (Fig. 5A). The transformation of Synechocystis 6803 cells was performed by homologous recombination, as described previously (Osanai et al. 2011).
Cyanobacterial strains and photoautotrophic cultivation
The GT strain isolated in 1988 (Williams 1988) was cultivated in 70 mL of a modified BG-11 medium consisting of a BG-110 liquid medium (Rippka 1988) containing 20 mM HEPES-KOH (pH 7.8) as a wild-type strain of Synechocystis 6803. For the cultivation of the NadBox strain, 70 mL of the modified BG-11 medium containing 0.8 μg/mL of kanamycin was used. The diameter and height of the culture tubes containing the cyanobacterial cultures was 3.0 and 20.0 cm, respectively. The cyanobacterial cultures were incubated at 30°C under continuous white light. With regard to the experiments shown in Figs. 5 and 6, the photon flux density was set at 120 μmol photons m−2 s−1. As for the experiments in Fig. 7, the photon flux density was set at 50 μmol photons m−2 s−1. For the incubation, the cultures were bubbled with 1% (v/v) CO2 in the air. The OD730 (cell density) of cyanobacterial cultures was measured every 24 h using a Hitachi U-3900H spectrophotometer (Hitachi High-Tech.). The OD730 was set at 0.4 when the photoautotrophic cultivation was started.
Dark, anaerobic cultivation
After photoautotrophic cultivation for 3 d, Synechocystis 6803 cells were collected by centrifugation at 5,800 × g for 2 min at 25°C. The collected cells were resuspended in a modified BG-11 medium in a 20 mL GC vial. To create anaerobic conditions, N2 gas was introduced into the vials for 1 min via syringes. The vials were then sealed with butyl rubber and covered with aluminum foil. The vials were incubated at 30°C and gently shaken for 3 d. The OD730 was set at 60 when the dark, anaerobic cultivation was initiated.
RNA extraction and reverse transcription-quantitative PCR
The Synechocystis 6803 cells after photoautotrophic cultivation (photon flux density: 120 μmol photons m−2 s−1) for 1 d [OD730 × culture volume (mL) = 15] were suspended in 1 mL of ISOGEN (Nippon Gene, Tokyo, Japan). After the mixture was left for 30 min, 200 μL of chloroform was added. The mixture was then vigorously shaken and centrifuged at 17,900 × g for 15 min at 4°C. Thereafter, 500 μL of phenol/chloroform/isoamyl alcohol (25:24:1) was added to 500 μL of the supernatant, and the mixture was vigorously shaken. After centrifugation at 17,900 × g for 10 min at 4°C, 400 μL of isopropanol was added to 400 μL of the supernatant, and the solution was left for 15 min on ice. After centrifugation at 17,900 × g for 25 min at 4°C to remove the supernatant, 200 μL of ice-cold 70% (v/v) ethanol was added to the residue. After centrifugation at 17,900 × g for 3 min at 4°C to remove the supernatant, the residue was dried by using a centrifugal evaporator CVE-2000 (EYELA). The residue containing 20 μg RNA was treated by using TURBO DNase (Thermo Fisher Scientific) for 1 h at 37°C to eliminate residual DNA. After the reaction, 500 μL of sterilized water and 600 μL of phenol/chloroform/isoamyl alcohol (25:24:1) were added to the solution. The solution was vigorously shaken and centrifuged at 17,900 × g for 5 min at 4°C. Thereafter, 480 μL of the supernatant was transferred to another tube, and 480 μL of isopropanol and 48 μL of 3 M sodium acetate were added to the supernatant. After the solution was gently shaken, it was left for 15 min on ice. The solution was centrifuged at 17,900 × g for 25 min at 4°C, and the supernatant was removed. Thereafter, 200 μL of ice-cold 70% (v/v) ethanol was added to the residue. After centrifugation at 17,900 × g for 3 min at 4°C to remove the supernatant, the residue was dried by using a centrifugal evaporator CVE-2000. The cDNAs were then synthesized using the SuperScript III First-Strand Synthesis System (Thermo Fisher Scientific) from 2 μg of extracted RNAs. RT-qPCR was performed using StepOne Plus (Life Technologies), with rnpB (encoding RNaseP subunit B) used as an internal standard, as described previously (Schlebusch and Forchhammer 2010). The base sequences of the primers for cDNA amplification are as follows: forward primer of rnpB: 5′-AAAGGGTAAGGGTGCAAAGG-3′, reverse primer of rnpB: 5′-AATTCCTCAAGCGGTTCCAC-3′, forward primer of nadB: 5′-TTGTCGCCAAGCTGAAACTC-3′, reverse primer of nadB: 5′-CCGAAAGAGGGCACTAGTCA-3′.
Analysis of the SyNadB activity in cell extracts
The analysis of enzymatic activity in cell extracts was performed in accordance with the previously described method (Osanai et al. 2011) but with some alterations. The Synechocystis 6803 cells after photoautotrophic cultivation (photon flux density: 120 μmol photons m−2 s−1) for 3 d [OD730 × culture volume (mL) = 300] were suspended in PBS-T containing 100 μM FAD. Then, the mixture was sonicated on ice using a model VC-750 in the dark. Sonication (10 s at 20% intensity) was repeated 5 times. After centrifugation (17,400 × g for 5 min at 4°C), 800 μL of the supernatant was collected. Researchers in previous studies have used 40 to 420 μg of total proteins for the analysis of enzymatic activity in cell extracts (Osanai et al. 2011; Takeya et al. 2018). Therefore, 40, 200, and 400 μg of total proteins in the supernatant were used for the enzyme assay. The reaction catalyzed by SyNadB was performed in a 1 mL assay solution [50 mM Tris-HCl (pH 7.0), 100 mM sodium L-aspartate, 0.1 mM NADH, 100 U MDH, 40 μM FAD, and 40 to 400 μg of total proteins]. After incubation of the assay solution without sodium L-aspartate at 40°C for 5 min, sodium L-aspartate was added to the solution to initiate the reaction. NADH consumption via the reaction catalyzed by MDH was monitored as a decrease in absorbance at 340 nm by using a Hitachi U-3310 spectrophotometer. As a control, we also monitored the change in absorbance at 340 nm in the absence of sodium L-aspartate and subtracted this value from the value in the presence of sodium L-aspartate.
Extraction and quantification of NAD(P)+
As for the quantification of NAD+, Synechocystis 6803 cells [OD730 × culture volume (mL) = 10] were collected by centrifugation (5,800 × g for 2 min at 25°C) after cultivation for 3 d. As for the quantification of NADP+, Synechocystis 6803 cells [OD730 × culture volume (mL) = 50] were collected by centrifugation (5,800 × g for 2 min at 25°C) after cultivation for 3 d. The extraction and quantification of NAD+ and NADP+ from Synechocystis 6803 cells were performed using the NAD/NADH Assay Kit-WST (Dojindo Laboratories, Kumamoto, Japan) and NADP/NADPH Assay Kit-WST (Dojindo Laboratories), respectively. The NADP+/NAD+ ratio was calculated by dividing the NADP+ level per OD730 by the NAD+ level per OD730.
Extraction and quantification of organic acids
The extraction of organic acids from Synechocystis 6803 was performed, as described previously, but with a slight modification (Katayama et al. 2022). Synechocystis 6803 cells [OD730 × culture volume (mL) = 300] after cultivation for 3 d were collected by centrifugation (5,800 × g for 2 min at 25°C). The collected cells were resuspended in 600 μL of 60% (v/v) methanol. The mixture was shaken and centrifuged (20,400 × g for 5 min at 4°C). Thereafter, to remove proteins from the supernatant, 500 μL of the supernatant was added to an Amicon Ultra 3 kD cutoff filter (Merck, Billerica, MA, USA). After centrifugation at 20,400 × g for 60 min at 4°C, 350 μL of the filtrate was collected and dried in a centrifugal evaporator CVE-2000. The dried residue was dissolved in 40 μL of 100 mM Tris-HCl buffer (pH 8.0). The quantification of citrate, malate, and succinate was performed using E-kit citrate (J. K. International, Tokyo, Japan), E-kit liquid L-malate (J. K. International), and F-kit succinate (J. K. International), respectively.
Statistical analysis
We performed 2-tailed Welch's t-tests to calculate the P-values with Microsoft Excel for Windows (Redmond, WA, USA).
Accession numbers
Sequence data from this article can be found in the GenBank/EMBL data libraries under accession numbers SyNadB: BAA18669 and two NAD kinase isozymes from Synechocystis 6803: BAA18022 and BAA18530.
Author contributions
S.I. designed the study, performed the experiments, analyzed the data, and wrote the paper. A.W. performed the experiments. T.O. wrote the paper. All authors approved the final version of the manuscript.
Supplemental data
The following materials are available in the online version of this article.
Supplemental Figure S1. Biochemical analysis of SyNadB without a GST tag.
Supplemental Table S1. Estimated molar concentrations of metabolites in Synechocystis 6803.
Funding
This work was supported by the Ministry of Education, Culture, Sports, Science, and Technology, Japan, a grant to T.O. from ALCA from the Japan Science and Technology Agency (grant number JPMJAL1306), and the Asahi Glass Foundation. Also, this work was supported by a grant to S.I. from the Institute for Fermentation, Osaka, Japan (grant number Y-2023-2-010).
Data availability
Data in this manuscript will be shared on reasonable request to corresponding author.
Dive Curated Terms
The following phenotypic, genotypic, and functional terms are of significance to the work described in this paper:
References
Author notes
The author responsible for distribution of materials integral to the findings presented in this article in accordance with the policy described in the Instructions for Authors (https://dbpia.nl.go.kr/plphys/pages/General-Instructions) is Shoki Ito.
Conflict of interest statement. None declared.
