


Abstract
Touch induces marked morphological changes in plants, including reduced rosette diameters and delayed flowering, a process called thigmomorphogenesis. Previous studies have revealed that thigmomorphogenesis in Arabidopsis (Arabidopsis thaliana) results from touch-induced accumulation of jasmonic acid (JA) and GIBBERELLIN 2-OXIDASE7 (GA2ox7) transcripts, which encode a gibberellin (GA) catabolism enzyme, leading to reduced levels of active GAs. However, the mechanisms underlying thigmomorphogenesis remain uncharacterized. Here, we showed that touch induces ethylene (ET) production in Arabidopsis. After touch treatment, ET biosynthesis and signaling mutants exhibited even greater thigmomorphogenic changes and more decreased GA4 contents than did wild-type (WT) plants. Biochemical analysis indicated that the transcription factor ETHYLENE INSENSITIVE3 (EIN3) of the ET pathway binds to the promoter of GA2ox8 (encoding another GA 2-oxidase performing the same GA modification as GA2ox7) and represses GA2ox8 transcription. Moreover, MYC2, the master regulator of JA signaling, directly promoted GA2ox7 expression by binding the G-box motif on GA2ox7 promoter. Further genetic analysis suggested that the ET and JA pathways independently control the expression of GA2ox8 and GA2ox7, respectively. This study reveals that the ET pathway is a novel repressor of touch-induced thigmomorphogenesis and highlights that the ET and JA pathways converge on GA catabolism but play opposite roles to fine-tune GA4 content during thigmomorphogenesis.
Introduction
Plants have evolved sophisticated mechanisms to respond to mechanical stimuli, including touch. Although touch induces rapid movement of the traps of Venus flytrap (Dionaea muscipula) and the leaflets of Mimosa (Mimosa pudica), most plants react to touch gradually over time by altering their morphology, growth rate, and even flowering times. For example, compared with the untreated Arabidopsis (Arabidopsis thaliana) plants, those treated with touch 2 times daily had reduced rosette diameters and darkened leaves, shorter inflorescences, and delayed flowering (Chehab et al. 2009, 2012; Braam and Chehab 2017). These touch-induced morphological alteration is a process called thigmomorphogenesis (Jaffe 1973).
Although multiple touch treatment is required to for thigmomorphogenesis, a single touch treatment can rapidly change gene expression patterns. As early as in 1990, the transcripts of 5 genes were found to be dramatically induced by spraying water to plants within 30 min (Braam and Davis 1990), which were named the touch-induced (TCH) genes. Later, Lee et al. (2005) treated Arabidopsis with touch by gently bending the rosette leaves back and forth 10 times and found that 760 genes exhibited altered expression patterns 30 min after the treatment. Using RNA-seq, Van Moerkercke et al. (2019) found 2,612 differentially expressed genes (DEGs) after 3 h of water spray treatment.
Ca2+ was the first identified signaling molecule involved in touch responses. Among the 5 TCH genes, TCH1 encodes a calmodulin, and TCH2 and TCH3 encode calmodulin-related genes (Braam and Davis 1990). Because calmodulins are primary intercellular Ca2+ receptors, Ca2+ has been proposed as a second messenger in the touch-induced signaling pathways (Braam and Davis 1990). Later, touch-induced Ca2+ increase was indeed detected in transgenic plants expressing aequorin, a Ca2+-dependent luminescent protein (Knight et al. 1991). Using the Foerster Resonance Energy Transfer-based Ca2+ sensor YC3.6, Monshausen et al. (2009) demonstrated that touching a single root epidermal cell with a glass micropipette rapidly (within 1 to 18 s) elicited an increase in cytosolic Ca2+, and the Ca2+ elevation spread throughout the cytoplasm over the course of 2 to 10 s and subsequently dissipated. Recently, it was shown that a calmodulin-binding transcription activator, CALMODULIN-BINDING TRANSCRIPTION ACTIVATOR 3 (CAMTA3), is required for thigmomorphogenesis (Darwish et al. 2022). Touch also triggers apoplastic alkalinization and cytoplasmic acidification, as well as production of apoplastic reactive oxygen species (ROS) (Monshausen et al. 2009). The changes of pH and ROS are Ca2+ dependent, as both are inhibited by the blockers of Ca2+ influx (Monshausen et al. 2009).
Protein phosphorylation is also involved in touch-induced signal transduction. Touch-induced TCH3 gene expression was inhibited by the protein kinase inhibitor staurosporine (Wright et al. 2002). Among the 760 touch-responsive genes identified by microarray, 72 genes encode kinases (Lee et al. 2005). Recently, using a high-throughput stable isotope labeling in Arabidopsis-based quantitative phosphoproteomics approach, Wang et al. (2018) identified 4,895 touch-responsive phosphopeptides, and many were derived from kinases, phosphatases, cytoskeleton proteins, membrane proteins, and ion transporters; remarkably, a soluble, likely cytosolic phosphoprotein, TOUCH-REGULATED PHOSPHOPROTEIN1 (TREPH1), was found to be required for the touch-induced delay of bolting and transcription of many previously identified touch-inducible genes, including CALMODULIN-LIKE38 (CML38), 39, ETHYLENE RESPONSE FACTOR11 (ERF11), JASMONATE-ZIM-DOMAIN PROTEIN7 (JAZ7), and an unknown touch-inducible gene (TCH2K1, TAIR AT1G56660).
Phytohormones also play essential roles in plant response to touch. Previous studies have demonstrated that jasmonate (JA) and gibberellin (GA) pathways are required for touch-mediated growth alteration. Touch induces JA accumulation, and the JA biosynthetic mutant allene oxide synthase (aos), the JA-isoleucine-deficient mutant jasmonate resistant1 (jar1), and the JA perception mutant coronatine insensitive1 (coi1) did not exhibit delayed flowering and reduced rosette diameter as the WT plants after touch treatment (Chehab et al. 2012). Consistently, the receptor-like kinase FERONIA (FER), which represses the JA signaling, is a strong negative regulator of touch-induced gene expression (Darwish et al. 2022). Touch-induced morphological changes appeared to be resulted from the reduction of bioactive GA levels. GIBBERELLIN 2-OXIDASE7 (GA2ox7), which encodes a GA catabolism enzyme, is the key gene for touch-induced GA reduction, as the ga2ox7 mutants did not show shortened stem and delayed flowering after touch treatment; furthermore, supplementation of the bioactive GA4 to touch-treated Arabidopsis could reverse the retarded growth phenotype (Lange and Lange 2015). The transcript accumulation of GA2ox7 seemed to be independent of the JA signaling, because in the aos and myc234 mutants, GA2ox7 transcript levels still increased after touching (Lange and Lange 2015). However, whether there is an interaction between the JA and GA signaling in thigmomorphogenesis remains unclear.
The gaseous phytohormone ethylene (ET) regulates various aspects of plant growth and development, and ET is also involved in plant response to multiple environmental cues such as flooding, drought, chilling, wounding, and pathogen attack (Wang et al. 2013). ET is biosynthesized from S-adenosyl methionine by 2 enzyme families: 1-aminocyclopropane-1-carboxylate (ACC) synthases (ACSs) and ACC oxidases (ACOs) (Wang et al. 2002). The ET signaling components include several endoplasmic reticulum-localized receptors such as ETHYLENE RESISTANT1 (ETR1), the CONSTITUTIVE TRIPLE RESPONSE1 (CTR1), the ETHYLENE INSENSITIVE2 (EIN2), and transcription factors such as ETHYLENE INSENSITIVE3 (EIN3), EIN3-LIKE (EIL), and ETHYLENE RESPONSE FACTORs (ERFs). Some evidence has pointed to the possibility that the ET pathway may play a role in plant response to touch. First, in Arabidopsis, touch highly induced the transcription of 1-AMINOCYCLOPROPANE-1-CARBOXYLATE SYNTHASE 6 (ACS6), which encodes a key enzyme in the ET biosynthetic pathway (Lee et al. 2005). Second, ET release following rubbing has been detected in bean (Phaseolus vulgar) (Biro and Jaffe 1984; Takahashi and Jaffe 1984). Third, it was demonstrated that ET is involved in touch-induced seedling morphological changes during soil emergence (Wu et al. 2020). However, ET was considered to be nonessential for thigmomorphogenesis, as the etr1 and ein2 mutants grown under constant light responded to wind similarly as the WT plants, exhibiting delayed flowering, decreased inflorescence elongation rate, shortened mature primary inflorescences, and more rosette paraclades (Johnson et al. 1998).
Here, we show that the ET pathway suppresses thigmomorphogenesis. After touch treatment, the key transcription factor EIN3 of the ET pathway binds to the promoter of GA2ox8, which encode another GA 2-oxidase performing the same GA modification as GA2ox7 and functions in GA catabolism as well, and represses the transcription of GA2ox8. Furthermore, we provide evidence that MYC2 promotes the transcription of GA2ox7, linking JA signaling with GA catabolism. This study reveals that JA and ET converge on GA catabolism to regulate touch-induced thigmomorphogenesis.
Results
Touch induces transcriptional changes of ET pathway-related genes
To obtain a global transcriptome profile of genes that respond to touch, we performed an RNA-seq experiment with 3 biological replicates harvested 5, 20, and 60 min after a single touch treatment (naïve Arabidopsis leaves were gently flipped up and down 20 times with a soft paintbrush). Untouched plants served as the controls. The numbers of total reads, mapped reads, and the percentage of mapped reads in each replicate are shown in Supplemental Table S1. In total, 24,546 genes were detected in all samples combined (Supplemental Table S2), among which, 3,095 genes (2,503 up- and 592 downregulated) were found to be responsive to touch (Fig. 1A;Supplemental Table S3).
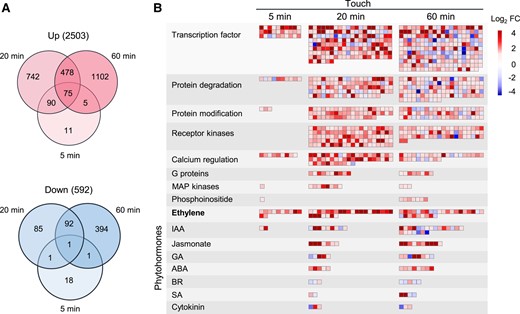
Touch changes the expression of various genes. Naïve Arabidopsis Col-0 plants were treated with a single touch, and the leaves were harvested 5, 20, and 60 min after treatment. A) Venn diagrams indicating the numbers of up- and downregulated genes after touch treatment. The numbers in the brackets indicate the total numbers of up- or down-regulated genes. B) MapMan analysis of the strongly regulated pathways after touch. FC values were log2 transformed. IAA, indole-3-acetic acid; GA, gibberellins; ABA, abscisic acid; BR, brassinosteroid: SA, salicylic acid.
As early as 5 min after touch, 202 genes were up- or downregulated, and 1,564 and 2,148 genes were found to have altered transcript levels at 20 and 60 min, respectively (Fig. 1A; Supplemental Table S3). Many more genes were upregulated than downregulated by touch at all time points (Fig. 1A). To explore the key pathways in touch responses, we used the MapMan software (Thimm et al. 2004) to enrich the main pathways involved in plant response to touch. Regulation overview clearly showed that calcium regulation, transcription factors, protein degradation, and the ET pathway were quickly induced 5 min after touching (Fig. 1B). Twenty minutes after touch, more pathways were enriched, including receptor kinases, MAP kinases, G proteins, protein modification, protein degradation, and various phytohormone pathways (Fig. 1B). One hour after touch, calcium regulation, receptor kinases, transcription factors, protein modification, and protein degradation were the top 5 most important pathways, indicated by the responsive gene numbers in these pathways (Fig. 1B; Supplemental Table S4). Remarkably, we noticed that the touch-regulated gene number in the ET pathway was the highest among all the touch-induced phytohormone pathways, even greater than the gene numbers in the JA and GA pathway, which are well known for their functions in thigmomorphogenesis (Chehab et al. 2012; Lange and Lange 2015; Van Moerkercke et al. 2019) (Fig. 1B; Supplemental Table S4).
We further inspected the transcriptional changes of all the genes in ET pathway. Touch greatly induced the transcription of several ET biosynthesis as well as signaling transduction genes. Among the 8 functional ACS isoforms (ACS2, 4, 5, 6, 7, 8, 9, and 11) (Yoon 2015; Lee et al. 2021), 6 (ACS2, 4, 6, 7, 8, and 11) were strongly upregulated by touch, and 14 ERF transcription factor genes were greatly induced by touch as well (Fig. 2A).
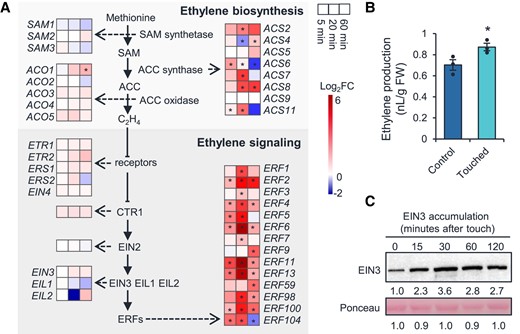
Touch activates ethylene pathways. A) Heatmaps showing the differential expression levels of genes in the ethylene biosynthesis and signaling pathways at 5, 20, and 60 min after touch treatment. Asterisks indicate statistical significance compared to untouched control group (Student's t-test; *P < 0.05). B) Touch-induced ethylene release. Four-week-old naïve Arabidopsis Col-0 plants were treated with a single touch treatment and the touched rosette leaves were immediately transferred into sealed vials. After 6 h, 1 ml of the headspace was collected for ET quantification on a gas chromatograph. FW, fresh weight. Data are means ± Se. n = 3. Asterisks indicate statistical significance between the touched and control group (Student's t-test; *P < 0.05). C) Touch-induced EIN3 protein accumulation. Four-week-old naïve Arabidopsis Col-0 plants were treated with a single touch treatment, and the leaves were harvested 15, 30, 60, and 120 min after treatment. Each sample was a pool of leaves from 3 replicated plants. Ponceau S staining of RbcL served as the loading control. An anti-EIN3 antibody was used for immunoblotting. The numbers below the images represent the relative protein levels, which were determined from the band intensities using ImageJ, and normalized relative to the untouched control samples.
Touch induces ET biosynthesis and EIN3 accumulation
To examine whether touch induces ET release, we treated 4-wk-old naïve Col-0 rosette leaves with a single touch treatment, and measured the touch-induced ET production as well as EIN3 protein accumulation, which is a key transcription factor for the ET response (Guo and Ecker 2003). Compared to the control (untouched) plants, touched plants produced 25% more ET (Fig. 2B). Touch also increased the EIN3 protein level: 15 min after touch, the EIN3 protein started to accumulate; at 120 min, the EIN3 protein abundance increased at least 1-fold (Fig. 2C) and similar results were obtained in a repeated experiment as well (Supplemental Fig. S1). Collectively, these results imply that ET pathway may be involved in thigmomorphogenesis.
ET pathway negatively regulates thigmomorphogenesis by inhibiting touch-induced GA4 reduction
To genetically examine whether ET plays a role in thigmomorphogenesis, the ET-insensitive mutants ein2 and ein3 eil1 were treated with touch, and their rosette diameters and flowering times were recorded. Remarkably, ein2 and ein3 eil1 exhibited hypersensitivity to touch with highly reduced rosette diameters and greatly delayed flowering times: after 2 wk of touch treatment, compared to the respective control plants which were untouched, the rosette diameters of Col-0 plant were 16% decreased, whereas the ein2 and ein3 eil1 plants were at least 30% decreased (Fig. 3, A and B), and the flowering time of Col-0 plants was 4.7 d delayed, while those of the ein2 and ein3 eil1 plants were, respectively, 8.4 and 7.4 d delayed (Fig. 3, A and C).
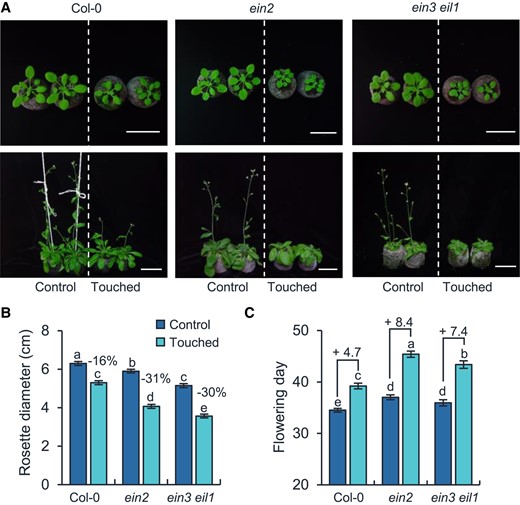
Ethylene pathway negatively regulates thigmomorphogenesis. Photographs (A), rosette diameters (B), and flowering days (C) of Col-0, ein2, and ein3 eil1 plants after touch treatment. For (A), photos in the top and bottom panels were taken on Day 28 (top) and 42 (bottom) after germination, respectively. Bar = 5 cm. For (B), the rosette diameters were measured when the plants were 28-d-old, and the percentage values indicate the touch-induced relative decreases in rosette diameters. The touch-induced flowering time changes (day) are denoted after “+” signs in (C). All data are means ± Se. Different letters indicate statistical differences (1-way ANOVA followed by Duncan's test; P < 0.05, n = 15 to 20). Statistically significant effect of genotype and treatment was determined by 2-way ANOVA (Supplemental Table S6).
Touch strongly reduces GA4, which is the major form of active GAs in Arabidopsis (Yamaguchi 2008), resulting in retarded growth and late flowering (Lange and Lange 2015). To explore whether the levels of GA4 are reduced in the touch-hypersensitive ET signaling mutants, the leaves of Col-0, ein2, and ein3 eil1 were collected for GA4 quantification after 2 wk of touch treatment. As expected, after touch, the GA4 levels in the Col-0 plants were 33% reduced (Fig. 4A), whereas the GA4 concentrations in the ein2 and ein3 eil1 plants were, respectively, 59% and 56% reduced (Fig. 4A). Importantly, application of exogenous GA4 completely restored the rosette diameters (Fig. 4, B and C) and flowering times of the ein2 and ein3 eil1 plants (Fig. 4, B and D).
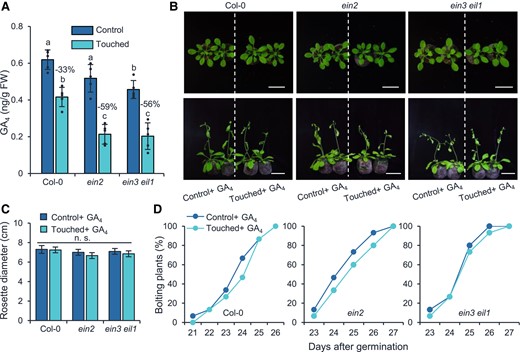
The touch-hypersensitive phenotype of ein2 and ein3 eil1 mutants is caused by GA4 deficiency. A) The endogenous GA4 levels in control and touch-treated Col-0, ein2, and ein3 eil1 plants. Touch treatments were initiated when the plants were 14-d-old and were conducted 2 times a day with 8 h interval for 2 wk. Two hours after the last touch treatment, the aboveground part was harvested for GA4 quantification. The percentages of GA4 decreases in response to touching treatment are shown. Different letters indicate statistical differences (1-way ANOVA followed by Duncan's test; P < 0.05, n = 5). Statistically significant effect of genotype and treatment was determined by 2-way ANOVA (Supplemental Table S6). GA, gibberellin; FW, fresh weight. Photographs (B), rosette diameters (C), and bolting rates (D) of Col-0, ein2, and ein3 eil1 plants after touch and supplementation of GA4. For (B) to (C), touch treatments were conducted as above described, and the touched as well as the control plants were sprayed with GA4 (10 µM) after each treatment. The rosette diameters were measured when the plants were 21-d-old. Photos were taken when the plants were 21 (top) and 28 d (bottom) old. Bar = 5 cm. All data are means ±Se, n.s., not significant (1-way ANOVA followed by Duncan's test, P ≥ 0.05, n = 15 to 20).
Similar results were obtained from the ET biosynthesis mutant octuple acs, which expresses artificial miRNAs targeting ASC8 and ASC11 in a sextuple mutant asc2-1 acs4-1 acs5-2 acs6-1 acs7-1 acs9-1 background (Tsuchisaka et al. 2009), and in the ET-insensitive mutants etr1 (Guzman and Ecker 1990) (Supplemental Figs S2 and S3). These results indicate that the ET pathway modulates touch-induced thigmomorphogenesis by inhibiting touch-triggered GA4 reduction.
ET pathway inhibits the transcription of GA2ox8
To further explore the mechanism underlying touch-induced GA4 reduction in these ET mutants, we analyzed the transcriptional profiles of 23 GA biosynthesis or catabolism genes in Col-0, ein2, and ein3 eil1 at 0, 0.5, 1, 2, and 4 h after a single touch treatment. Among these genes, only GA2ox8, which encodes a gibberellin 2-oxidase (Class III of gibberellin 2-oxidases, degrades the GA12 and GA53 for subsequent formation of active GAs) (Schomburg et al. 2003), displayed over-accumulated transcripts in both ein2 and ein3 eil1 mutants (Fig. 5A; Supplemental Fig. S4). To further confirm that the touch-hypersensitive phenotypes of ET mutants are caused by over-accumulation of GA2ox8 transcripts, we silenced GA2ox8 using RNA interference (RNAi) in the ein3 eil1 background (named ein3 eil1 RNAi-GA2ox8; Supplemental Fig. S5). Indeed, compared with ein3 eil1 plants, 2 lines of ein3 eil1 RNAi-GA2ox8 plants both exhibited reduced sensitivity to touch with less-reduced rosette diameters (Fig. 5, B and C) and less-delayed flowering (Fig. 5D). Consistently, the GA4 levels in ein3 eil1 RNAi-GA2ox8 were highly increased compared to ein3 eil1 (Fig. 5E). Thus, we inferred that touch-induced ET signaling suppresses the accumulation of GA2ox8 transcripts, and thus promotes the level of GA4. Importantly, we noticed that ein3 eil1 RNAi-GA2ox8 plants still displayed reduced GA4 levels after touch, compared with their respective untouched controls (Fig. 5E); given that GA2ox7 was still induced by touch in the ein3 eil1 RNAi-GA2ox8 plants (Supplemental Fig. S5), it is likely that GA2ox7 functions independently of the ET pathway in touch-induced thigmomorphogenesis.
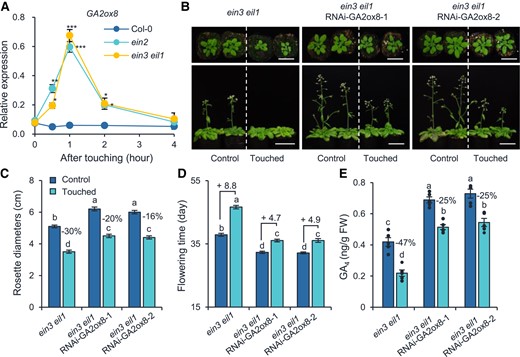
Ethylene pathway represses the transcript levels of gibberellin catabolic gene GA2ox8 after touch treatment. A) The relative expression levels of GA2ox8 in Col-0, ein2, ein3 eil1 plants. Samples were collected 0, 0.5, 1, 2, and 4 h after a single touch treatment of 28-d-old naïve plants. Asterisks indicate statistical significance compared to Col-0 (Student's t-test; *P < 0.05; **P < 0.01, ***P < 0.001, n = 5). Photographs (B), rosette diameters (C), flowering times (D), and GA4 levels (E) of ein3 eil1 RNAi-GA2ox8 plants and ein3 eil1 plants. ein3 eil1 RNAi-GA2ox8-1 and ein3 eil1 RNAi-GA2ox8-2 are 2 independent lines. Photos were taken when the plants were 28 (top) and 42 d (bottom) old. Bar = 5 cm. Plants were treated with touch as described in Fig. 4. The rosette diameters were measured when the plants were 28 d old. Two hours after the last touch treatment, the aboveground part of each plant was harvested for GA4 quantification. The percentages of rosette diameter and GA4 decreases in response to touching treatment are shown in (C) and (E). The touch-induced flowering time changes (day) are denoted after “+” signs in (D). Different letters indicate statistical differences (1-way ANOVA followed by Duncan's test; P < 0.05, for (C) and (D), n = 15 to 20; for (E), n = 5). Statistically significant effect of genotype and treatment was determined by 2-way ANOVA (Supplemental Table S6). All data are means ±Se.
EIN3 binds to the promoter of GA2ox8 and directly represses the transcription of GA2ox8
To study how the ET pathway regulates the transcription of GA2ox8, we first analyzed the putative cis-elements in the promoter region of GA2ox8, and found that this region contains 3 possible EIN3-binding (EB) sites (Itzhaki et al. 1994; Li et al. 2013) (Fig. 6A). Next, chromatin immunoprecipitation (ChIP)-qPCR was performed to examine the binding activity in vivo. We found marked enrichment of EIN3 at the 3 EIN3-binding sites after touch treatment (Fig. 6B). Among the 3 EIN3-binding sites, EB1 showed much higher enrichment of EIN3 than did EB2 and EB3, indicating that EIN3 mainly binds to the EB1 site in vivo (Fig. 6B). Subsequently, an electrophoretic mobility shift assay (EMSA) was performed to determine whether EIN3 binds to EB1 site. EB1 site contains 2 ATGCAT motifs and a ATGTA motif (Fig. 6A), which are putative EIN3-binding motifs. To elucidate which motif is the binding site of EIN3, we designed 4 biotin-labeled probes, P1 to P4, which contain different motifs (Fig. 6A). As expected, the truncated N-terminal of EIN3 fragment (amino acids 141 to 352) with the DNA-binding domain (Feng et al. 2017) was capable of binding the biotin-labeled P1 probe, which contains a ATGTA and 2 ATGCAT motifs (Fig. 6C), and excessive unlabeled P1 cold competitor effectively abolished the binding between EIN3 and the labeled probe in a dose-dependent manner (Fig. 6C). Furthermore, the P2 probe with a mutated ATGTA motif could bind with the EIN3 recombinant protein, while the P3 and P4 probes which contain mutated ATGCAT motif could not (Fig. 6C), indicating that the ATGCAT motif is the binding site of EIN3. Finally, to confirm EIN3 negatively affects the transcriptional activity of GA2ox8, we performed a transient activation assay. The EIN3 gene driven by the constitutive cauliflower mosaic virus (CaMV) 35S promoter was used as the effector, and a construct containing both a 2-kb GA2ox8 promoter fused with luciferase (LUC) gene and a CaMV 35S promoter-driven Renilla LUC (REN) was used as the reporter (Fig. 6D). Indeed, expression of EIN3 decreased the LUC/REN ratio 66% (Fig. 6D), suggesting that EIN3 represses the transcription of GA2ox8.
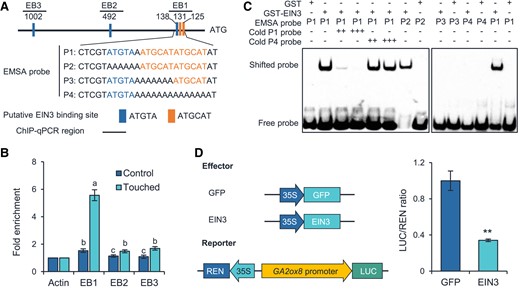
EIN3 directly represses the transcription of GA2ox8 by binding to its promoter. A) Schematic presentation of the putative-binding sites of EIN3 in the promoter of GA2ox8. Orange and blue bars indicate the putative EIN3-binding motifs. Sequences of EMSA probes are shown (P1 to P4). B) ChIP-qPCR analysis of the binding of EIN3 to the promoter region of GA2ox8. Ten-day-old Col-0 seedlings were treated with a single touch and harvested 0 and 120 min later for ChIP-qPCR. Different letters indicate statistical differences (1-way ANOVA followed by Duncan's test; P < 0.05, n = 3). Statistically significant effect of genotype and treatment was determined by 2-way ANOVA (Supplemental Table S6). C) EMSA assay of the binding of GST-EIN3 to the promoter of GA2ox8. The GST protein was incubated with the labeled probe in the first lane to serve as a negative control; 40- and 80-fold excess of unlabeled competitor (cold) and mutated (P2 to P4) probes were, respectively, used. D) Assays on the transactivation activity of EIN3 to the GA2ox8 promoter. The schematic diagram shows the constructs used in the transient transcriptional activity assays. Asterisks indicate statistical significance between groups (Student's t-test; **P < 0.01, n = 3). For © and (D), data are means ±Se.
JA pathway controls touch-induced GA2ox7 expression
The JA pathway positively modulates thigmomorphogenesis. Arabidopsis plants with mutations in JA biosynthesis or perception genes are hyposensitive to touch (Chehab et al. 2012). Our results also show that the JA-deficient dde2 and the JA-insensitive myc234 did not response to touch. After 14 d of touch treatment, the average rosette diameters and flowering times of dde2 and myc234 did not show significant differences compared with their respective untouched controls (Supplemental Fig. S6; Fig. 7, A and B). Remarkably, touch did not reduce the GA4 levels of dde2 and myc234 plants (Fig. 7C). To address this, we quantified the transcription levels of GA2ox7 and GA2ox8 in the 4-wk-old Col-0, dde2, and myc234 plants at 0, 0.5, 1, 2, and 4 h after a single touch treatment. Intriguingly, the transcription levels of GA2ox7 in the dde2 and myc234 plants were much lower than that in Col-0 (Fig. 7D), indicating that the touch-induced transcriptional change of GA2ox7 is dependent on JA. However, in the Col-0, dde2, and myc234 plants, touch did not induce transcriptional changes of GA2ox8 (Fig. 7D), indicating that GA2ox8 is independent of the JA pathway.
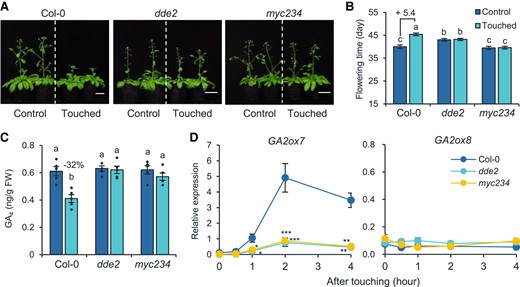
Touch-induced GA2ox7 transcript upregulation is dependent on the JA pathway. Photographs (A), flowering times (B), and GA4 levels (C) of touched and untouched Col-0, dde2, and myc234 plants. Plants were treated with touch as described in Fig. 4. For (A), photos were taken when the plants were 42 d old. Bar = 2 cm. The touch-induced flowering time changes (day) are denoted after “+” signs in (B). The percentage of GA4 decrease in response to touching treatment is shown in (C). Different letters indicate statistical differences (1-way ANOVA followed by Duncan's test; P < 0.05, for (B), n = 15; for (C), n = 5). Statistically significant effect of genotype and treatment was determined by 2-way ANOVA (Supplemental Table S6). GA, gibberellin; FW, fresh weight. D) The relative expression levels of GA2ox7 and GA2ox8 in Col-0, dde2, and myc234 plants. Samples were collected 0, 0.5, 1, 2, and 4 h after a single touch treatment on 28-d-old naïve plants. Asterisks indicate statistical significance compared to Col-0 (Student's t-test; *P < 0.05; **P < 0.01; ***P < 0.001, n = 5). All data are means ±Se.
MYC2 directly regulates transcription of GA2ox7
To further study how the JA pathway regulates the transcription of GA2ox7, we first analyzed the touch-induced MYC2 protein accumulation pattern, which is the master transcription factor of the JA pathway. MYC2 protein reached peak level at 2 h after touch (Fig. 8A). Next, we analyzed the putative cis-elements in the promoter region of GA2ox7, and found that this region contains 3 possible MYC2-binding (MB) sites (CACGTG or CACATG) (Fernandez-Calvo et al. 2011; Godoy et al. 2011) (Fig. 8B). Subsequently, ChIP-qPCR was performed using the pMYC2:MYC2-FLAG (MYC2-FLAG fusion gene under the control of MYC2 native promoter, in the jin1-8 background) plants (Hou et al. 2010) to determine the physical association of MYC2 protein with the putative MB sites. Indeed, we found significant enrichment of MYC2-FLAG at the 3 MB sites after touch (Fig. 8C). Among the 3 MB sites, MB3 showed much higher enrichment levels than did the other 2 MB sites, indicating that MYC2 mainly binds to the G-box motif at the MB3 site in vivo (Fig. 8C). We then performed transient activation assay to examine whether MYC2 positively transactivates the promoter of GA2ox7. The MYC2 gene driven by the 35S promoter was used as the effector, and a construct containing both a 2-kb GA2ox7 promoter fused with the LUC gene and an REN gene driven by a CaMV 35S promoter was employed as the reporter (Fig. 8D). Indeed, the expression of MYC2 strongly increased the LUC/REN ratio (Fig. 8D). Thus, the MYC2 transcription factor can directly regulate the expression of GA2ox7 by binding to its promoter.
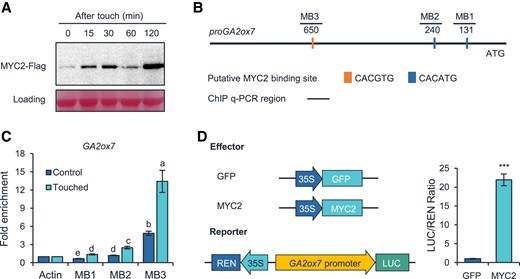
MYC2 directly regulates the transcription of GA2ox7. A) Accumulation of MYC2-FLAG protein in response to touch. Ten-day-old jin1-8 pMYC2:MYC2-FLAG seedlings were touch-treated and harvested 0, 15, 30, 60, and 120 min later for protein extraction and western blotting analysis. B) Schematic presentation of the putative-binding sites of MYC2 in the promoter GA2ox7. Orange and blue bars indicate the putative MYC2-binding motifs. C) ChIP-qPCR indicates binding of MYC2 to the promoter region of GA2ox7. Ten-day-old jin1-8 pMYC2:MYC2-FLAG seedlings were touch-treated and harvested 0 and 120 min later for ChIP-qPCR. Data are means ±Se. Different letters indicate statistical differences (1-way ANOVA followed by Duncan's test; P < 0.05, n = 3). Statistically significant effect of genotype and treatment was determined by 2-way ANOVA (Supplemental Table S6). D) Transient transcriptional activity assay showing that the GA2ox7 promoter is activated by MYC2. The schematic diagram shows the constructs used in the transient transcriptional activity assays. Data are means ±Se, n = 3. Asterisks indicate statistical significance between the control and touched group (Student's t-test; ***P < 0.001).
ET and JA pathway independently regulate touch-induced thigmomorphogenesis
To examine whether JA and ET genetically interact in touch-induced thigmomorphogenesis, the ein2 dde2 double mutant was phenotyped for touch-induced responses. Similar to what was found previously (Chehab et al. 2012), the JA-deficient dde2 mutants exhibited a touch-hyposensitive phenotype: their rosette diameters were not reduced by touch (Supplemental Fig. S7, A and B), and their flowering time was not delayed after touch treatment (Fig. 9, A and B). Correspondingly, the GA4 levels in dde2 mutants were not significantly reduced after touch (Fig. 9C). In contrast to the dde2 mutants, the ein2 mutants were hypersensitive to touch: they flowered 9.1 d later after touch treatment (Fig. 9, A and B), and their GA4 levels were 52% reduced after touch (Fig. 9C). Remarkably, ein2 dde2 exhibited a neither dde2-like or ein2-like, but WT-like phenotype: the rosette diameters of ein2 dde2 and Col-0 were 26% and 30% reduced by touch, respectively (Supplemental Fig. S7, A and B), and they both flowered 5.5 d later after touch treatment (Fig. 9, A and B). Consistently, the GA4 levels in ein2 dde2 and Col-0 were 34% and 37% reduced after touch, respectively (Fig. 9C). The transcription analysis of GA2ox7 and GA2ox8 further confirm that the 2 GA catabolic genes are independently regulated by JA and ET. Touch-induced GA2ox7's expression is dependent on the JA pathway but independent of the ET pathway, since the transcript levels of GA2ox7 only reduced in dde2 and ein2 dde2 mutants, but not in the Col-0 and ein2 plants (Fig. 9D). Touch induced the transcripts of GA2ox8 only in the ein2 and ein2 dde2 plants, but not in in the Col-0 and dde2 plants (Fig. 9D). These results provide genetic evidence that the function of the ET pathway in thigmomorphogenesis is independent of the JA pathway.
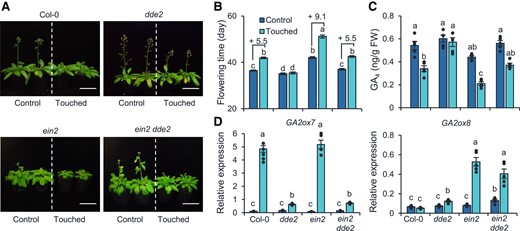
ET and JA pathway independently regulate thigmomorphogenesis. Photographs (A), flowering times (B), and GA4 levels (C). For (A) to (C), plants were treated with touch as described in Fig. 4. Two hours after the last touch treatment, the aboveground part of each plant was harvested for GA4 quantification. Photos were taken when the plants were 42 d old. Bar = 5 cm. GA, gibberellin; FW, fresh weight. D) Relative transcript levels of GA2ox7 and GA2ox8 in Col-0, dde2, ein2, and ein2 dde2 plants. Twenty-eight-day-old plants were treated with a single touch treatment, and the aboveground part of each plant was harvest 1 h (GA2ox8) and 2 h (GA2ox7) later for RT-qPCR. All data are means ±Se. Different letters indicate statistical differences (1-way ANOVA followed by Duncan's test; P < 0.05, for (B), n = 17; for (C) and (D), n = 5). Statistically significant effect of genotype and treatment was determined by 2-way ANOVA (Supplemental Table S6).
To further corroborate this scenario, we generated myc234 RNAi-EIN3EIL1 plants by expressing an RNAi construct targeting a fragment of EIN3 and a fragment of EIL1 in the myc2 myc3 myc4 triple mutant (myc234) background (Supplemental Fig. S8), which are impaired in both JA and ET signaling. Consistent with what was observed in the ein2 dde2 plants, the 2 independent lines of myc234 RNAi-EIN3EIL1 plants exhibited a touch-sensitive phenotype, and their responses to touch were similar to the Col-0 plants, but not the touch-hyposensitive myc234 plants (Supplemental Figs S9 and S10).
Discussion
Thigmomorphogenesis is regulated by a complex signaling network. Here, we found that more than 3,000 genes were transcriptionally regulated (over 11% of Arabidopsis genes) within 60 min by touch. The large number of touch-responsive genes is consistent with the strong morphological and developmental changes in touch-treated plants, including decreased rosette size and delayed flowering time. Importantly, the very early touch-responsive genes were identified: even 5 min after touch, around 200 genes showed changes in transcript levels. In addition to the previously described pathways such as calcium regulation, receptor kinases, and transcription factors (Monshausen et al. 2009; Van Moerkercke et al. 2019; Darwish et al. 2022), our RNA-seq data further suggested that protein degradation, protein modification, G proteins, MAP kinase, and phosphoinositide might also play important roles in touch-induced responses.
Our transcriptome data also suggested that almost all the phytohormones are likely to be involved in modulating plant responses to touch. Especially, we found that the touch-regulated gene number in the ET pathway was the highest among all the touch-induced phytohormone pathways, even greater than the gene numbers in the JA and GA pathway. Whether ET is involved in plant response to mechanical stimulation has long been debated. ET was speculated to play roles in thigmomorphogenesis because mechanical perturbation induces ET production (Biro and Jaffe 1984; Takahashi and Jaffe 1984). However, the ein2-1 and etr1-3 mutants grown under constant light responded to wind similarly to the WT plants in terms of both morphological changes and induction of the TCH genes. The study from Wu et al. (2020) also supported that ET is involved in mechanical responses of seedlings during soil emergence. In this study, we provide several lines of evidence indicating that ET is involved in touch-induced growth retardation. First, touch induces ET release and EIN3 protein accumulation (Fig. 2, B and C). Second, genetic analyses strongly indicated the negative role of ET in thigmomorphogenesis. Compared with Col-0, all the ET pathway-related mutants including the ET-deficient octuple acs and ET-insensitive etr1, ein2, and ein3 eil1 exhibited enhanced growth retardation (Fig. 3; Supplemental Fig. S2). Third, the touch-induced GA4 reduction was aggravated in the ET pathway mutants (Fig. 4A; Supplemental Fig. S3A). The discrepancy between our study and Johnson et al. (1998) may have resulted from different treatments and growth conditions. We treated the plants with a soft paintbrush but Johnson et al. (1998) treated the plant with wind from oscillating fans. Possibly plants have evolved mechanisms to optimize their growth and development to different mechanical stimuli. Moreover, the wind-treated plants were grown under constant light (Johnson et al. 1998), which may have had certain unexpected effects on the plant growth and development (Velez-Ramirez et al. 2011).
Like many other physiological processes, touch-induced thigmomorphogenesis is finely controlled by positive and negative signaling network. Although many positive regulators of thigmomorphogenesis have been identified, little is known about the negative regulator of thigmomorphogenesis. In this study, we showed that the ET pathway functions as an important repressor of thigmomorphogenesis by inhibiting touch-induced GA4 reduction. The EIN3 transcription factor binds to the promoter of a GA catabolic enzyme GA2ox8 gene and represses its transcription. Recently, it was reported that the receptor-like kinase Feronia acts as a strong negative regulator of touch-induced gene expression (Darwish et al. 2022) by repressing the transcriptions of a wide range of genes in the JA pathway including LIPOXYGENASE3, LIPOXYGENASE4, ALLENE OXIDE CYCLASE3, OXOPHYTODIENOATE-REDUCTASE3, MYC2, and 5 JAZ genes (Darwish et al. 2022). It is not surprising that Feronia play negative role in thigmomorphogenesis, given that Feronia represses JA signaling (Guo et al. 2018), which is well-known for its positive function in thigmomorphogenesis (Chehab et al. 2012).
In this study, we demonstrate that during touch-induced thigmomorphogenesis, JA and ET converge on GA catabolism by activating GA2ox7 and repressing GA2ox8, respectively. Both GA2ox7 and GA2ox8 are GA 2-oxidases converting the C20-GA precursor GA12 to GA110 and GA53 to GA97, among which GA12 and GA53 are the precursors of the active GAs, GA4 and GA1, respectively (Schomburg et al. 2003). GA2ox7's function in thigmomorphogenesis was determined by Lange and Lange (2015). However, whether the JA pathway and GA2ox7 interact was not resolved: Lange and Lange (2015) proposed that touch-induced GA2ox7 transcript elevation is independent of the JA/MYC2 pathway, because in the aos and myc234 mutants, the transcript levels of GA2ox7 still increased after touching. Conversely, our transcriptional analysis supports that JA/MYC2 is upstream of GA2ox7. The highest transcription level of GA2ox7 was 2 h after touch (Fig. 7), while Lange and Lange (2015) conducted transcriptional analysis with samples harvested 30 to 60 min after the last touch treatment, and according to our time-course data, during 30 to 60 min after touch, transcription of GA2ox7 was not fully induced (Fig. 7). This might be the reason why Lange and Lange (2015) did not observed the transcriptional differences of GA2ox7 between the JA pathway mutants and WT plants. Recently, Jin et al. (2023) also found that MYC2 directly binds to the G-boxes in the promoters of GA2ox3 and GA2ox7 to promote their expression in rice (Oryza sativa).
Previous studies indicated that the JA and ET pathway may function synergistically or antagonistically. For example, JA and ET synergistically regulate plant immunity against necrotrophic fungi (Penninckx et al. 1998; Norman-Setterblad et al. 2000) and root hair development (Zhu et al. 2006), and these pathways antagonistically regulate the expression of wound-responsive genes (Lorenzo et al. 2004), apical hook curvature (Turner et al. 2002), and plant defense against insect attack (Bodenhausen and Reymond 2007). MYC2 and EIN3 proteins interact, and the interaction represses EIN3's transcriptional activation of HOOKLESS1 and ERF1 (Song et al. 2014; Zhang et al. 2014) and MYC2's transcriptional activation of wound-responsive and herbivore-inducible genes (Song et al. 2014). Our results also demonstrated that JA and ET signaling antagonistically regulate thigmomorphogenesis (Fig. 10). However, ET and JA pathway are not epistatic in this process: the ein2 dde2 and myc234 RNAi-EIN3EIL1 exhibited a WT-like phenotype, but not a JA- or ET-mutant like phenotype (Fig. 9; Supplemental Fig. S9). Thus, we proposed that JA and ET independently regulate touch-induced GA4 accumulation with opposite effects (Fig. 10). This hypothesis was further supported by the findings that EIN3, but not MYC2, can bind to the promoter of GA2ox8 and directly represses its expression, while MYC2, but not EIN3, activates the transcription of GA2ox7. Although MYC2 and EIN3 protein coaccumulated, the MYC2–EIN3 interaction does not likely play an important role in touch-induced thigmomorphogenesis, even if they do physically interact. The antagonistic mode of action of JA and ET pathway well illustrates how plants fine-tune the signaling events to control touch-induced thigmomorphogenesis (Fig. 10). The mutants of ET pathway exhibit severely stunted growth and delayed flowering (Fig. 3; Supplemental Fig. S2), while the mutans of JA pathway are hyposensitive to touch (Chehab et al. 2012; Lange and Lange 2015). Touch-induced thigmomorphogenesis is considered to be essential for plant adaptation to harsh environmental factors, such as frequent wind (Chehab et al. 2009; Braam and Chehab 2017). It is plausible that the balance between the JA and ET pathway plays important roles in controlling thigmomorphogenesis: the JA pathway promotes thigmomorphogenesis allowing plants to adapt to adverse environments, whereas the ET pathway prevents plants from overacting.
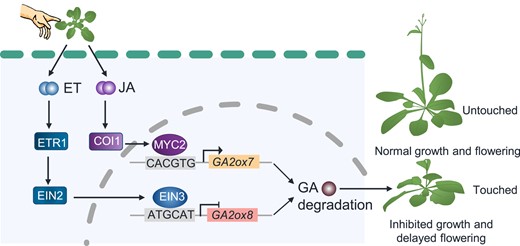
A working model showing the involvement of JA and ET pathways in touch-induced thigmomorphogenesis by, respectively, regulating the GA catabolic genes GA2ox7 and GA2ox8. Under normal conditions, GA2ox8 and GA2ox7 are kept in low levels, and thus GA4 levels remain high enough to maintain normal growth and flowering. Touch induces ET release, activating the transcription factor EIN3, which subsequently directly binds to the promoter of GA2ox8 and represses its transcription. Touch also increases activity of the transcription factors MYC2, which directly activates GA2ox7. Thus, the JA and ET pathway, respectively, promote and suppress the transcript levels of GA2ox7 and GA2ox8 in an independent manner, finally resulting in reduction of the bioactive GA4, which in turn causes thigmomorphogenesis. ET, ethylene; GA, gibberellin; JA, jasmonic acid. Arrows show activation, short perpendicular bars show inhibition. The components of ET, JA, and GA pathways are shown in blue, purple, and brown, respectively.
In summary, this study demonstrates that the ET pathway functions as an important negative regulator of thigmomorphogenesis: ET controls the GA4 levels mainly by transcriptionally repressing the GA catabolic gene GA2ox8. We also show that the touch-induced JA pathway positively regulates another GA catabolic gene GA2ox7. JA and ET thus antagonistically and independently fine-tune touch-induced thigmomorphogenesis (see the working model in Fig. 10).
Materials and methods
Plant materials and growth conditions
Arabidopsis (A. thaliana) seeds were sown on agar plates containing 1/2 Murashige and Skoog medium. Plates were kept at 4 °C for 3 d and then transferred to a growth chamber with light-emitting diode (LED) light under a 16 h/8 h light/dark photoperiod at 22 °C with a relative humidity of 60%. The spectral distribution was measured by a spectrometer (PG100N, UPRtek): photosynthetic photon flux density 400 to 700 nm, 57.7 ± 0.8 μmol/m2/s; photon flux density-blue, 15.0 ± 0.5 μmol/m2/s; photon flux density-green, 7.0 ± 0.3 μmol/m2/s; photon flux density-red: 35.8 ± 0.6 μmol/m2/s. Ten days after germination, the seedlings were transferred to pots (8 cm diameter) with soil or 42-mm-diameter Jiffy-7 peat pellets (Jiffy; www.jiffygroup.com).
The ein2-1 (CS3071), etr1-3 (CS3070), dde2-2 (CS65993), and ein2-1 dde2-2 (CS65997) mutants were obtained from Arabidopsis Biological Resource Center (www.arabidopsis.org). The octuple acs (N16651) was from the European Arabidopsis Stock Centre (www.arabidopsis.org.uk). The ein3-1 eil1-3 double mutant (Song et al. 2014) and the myc2-2 myc3 myc4 triple mutant (Song et al. 2014) were kindly provided by Drs. Hongwei Guo (Southern University of Science and Technology) and Jinyong Hu (Kunming Institute of Botany, CAS), respectively. Seeds of Arabidopsis jin1-8 mutant expressing pMYC2:MYC2-FLAG were a gift from Dr. Xingliang Hou (South China Botanical Garden, Chinese Academy of Sciences) (Hou et al. 2010).
Plasmid constructions and plant transformation
To silence GA2ox8 in ein3 eil1 backgrounds, the GA2ox8 fragment was amplified with the primer pair RNAi-GA2ox8 (Supplemental Table S5). The PCR product was cloned into the binary vector pHELLSGATE12 to generate the RNAi-GA2ox8 construct using the Gateway cloning technology (ThermoFisher Scientific). The construct was then transformed into Agrobacterium tumefaciens strain GV3101 (pMP90), which was used for independently transformation of ein3 eil1 plants by floral dipping (Bechtold and Pelletier 1998). After 2 generation of kanamycin resistance screening, at least 2 homozygous lines for each transformation were used for experiments.
To generate myc234 RNAi-EIN3EIL1 plants, the EIN3 and EIL1 fragments were amplified with the primer pairs RNAi-EIN3-1 and RNAi-EIL1-1, respectively (Supplemental Table S5), and then cloned into BamHI/EcoRI-linearized pUC18 with the infusion cloning method (Vazyme) to generate a EIN3EIL1-fused fragment. EIN3EIL1 fused fragments in sense and antisense direction were then amplified with the primer pairs EIN3EIL1-F and EIN3EIL1-R (Supplemental Table S5), and cloned into pKANNIBAL successively. The whole RNAi fragment was then cloned into NcoI/BstEII-linearized pCAMBIA3301.The construct was then transformed into myc234 plants. After 2 generation of BASTA resistance screening, 2 homozygous lines for each transformation were used for experiments.
Touch treatments
Touch treatments were initiated when the first 4 leaves had developed (14-d-old). The leaves were flipped up and down 20 times with a soft paintbrush twice daily, with an approximate 8-h interval, and this was repeated for 14 d. Flowering time was scored when the first flower opened. Two hours after the last touch treatment, the aboveground part was harvested for GA4 quantification. For a single touch treatment, the leaves of 4-wk-old naïve plants were flipped up and down 20 times with a soft paintbrush, and the samples were harvested at the designated times for transcriptional analysis.
Supplementation of GA4 to plants
For the GA4 supplementation experiments, plants were sprayed with 10 µM GA4 (in 0.01% [v/v] methanol) after every touch treatment.
Quantification of ET and GA4
For touch-induced ET measurement, 4-wk-old naïve Col-0 plants were treated with a single touch treatment, and the touched rosette leaves (∼ 4 g) were immediately transferred into 20-ml sealed vials. After 6 h, 1 ml of the headspace was injected into a gas chromatograph (Agilent GC System 7890A) and the quantification of ET followed a method previously described (Li et al. 2018).
For extraction and quantification of endogenous GA4, we followed the published method (Liu et al. 2019) with modifications. About 200 mg of plant tissue were ground into a fine powder in liquid nitrogen, and 500 μl of extraction solution was immediately added. The extraction solution (75% [v/v] methanol, 20% [v/v] H2O, and 5% [v/v] formic acid) contains 10 ng of D2-GA4 (Olchemim, Czech Republic), which were used as the internal standard. The mixtures were shaken on a shaker at 750 rpm for 2 h, and then kept at 4 °C overnight. After centrifugation (10,000 × g, 10 min) at 4 °C, the supernatant was collected, and the residue was washed 2 times with 200 μl of methanol. The combined extracts were evaporated to dryness and redissolved in 200 μl of H2O at pH 2 to 3 (adjusted with HCl), which were sequentially extracted with 200 μl of ethyl acetate 3 times. The ethyl acetate extracts were combined and dried in an evaporator for the further derivatization. To derivatize GA4, 200 μl of 20 mmol/l N-(3-dimethylaminopropyl)-Nʹ-ethylcarbodiimide in ethanol was added and reacted at 40 °C for 5 h. The resulting solution was centrifuged (8,000 × g, 2 min) to remove insoluble particles, and the supernatant was dried in an evaporator and reconstituted in 50 μl of H2O for HPLC–ESI–MS/MS analysis. Quantification was done on a Shimadzu LCMS-8040 system, and the multi-reaction-monitoring parameters was according to the published method (Liu et al. 2019).
Immunoblotting
Total protein or nuclear proteins were extracted as described previously (Xu and Copeland 2012; Zhang et al. 2020). For immunoblotting, 20 μg of total or nuclear protein were loaded for each sample, run on SDS-PAGE gels, and blotted onto PVDF membranes. Primary antibodies used in this study include anti-EIN3 (1:1,000 [v/v], catalog no. AS194273; Agrisera), anti-FLAG (1:1,000 [v/v], catalog no. F7425; Sigma), anti-actin (1:2,000 [v/v], catalog no. M20009; Abmart), and anti-histone H3 (1:5,000 [v/v], catalog no. E-AB-40488; Elabscience). Secondary antibodies used in this study are Peroxidase Conjugated Goat anti-Rabbit IgG (H + L) (1:10,000 [v/v], catalog no. 31460; Sigma-Aldrich) and HRP-labeled Goat Anti-Mouse IgG (H + L) (1:1,000 [v/v], catalog no. A0216; Beyotime). The BeyoECL Moon Kit (catalog no. P0018FS; Beyotime) was used for detection. The band intensities were measured using ImageJ (https://imagej.nih.gov/ij/). The relative levels of target proteins in the control samples were set to 1.
RNA extraction, RT-qPCR, and RNA-Seq analysis
Total RNA extraction and reverse transcription quantitative PCR (RT-qPCR) were performed as described previously (Luo et al. 2016). PHOSPHOPROTEIN PHOSPHATASE 2A-A3 (PP2AA3, AT1G13320) was used as the internal control reference for normalization, due to its stable expression across Arabidopsis tissues (Czechowski et al. 2005). The sequences of the primers used are listed in Supplemental Table S5.
RNA extraction was done using the TRIzol reagent (ThermoFisher Scientific). RNA-seq performed at 5 G depth for each sample on a HiSeq2500-PE125 platform (Illumina). The resulting sequences were trimmed based on quality scores and mapped to the Arabidopsis reference genome sequences using TopHat (v2.1.1). The expression levels of genes were estimated using Cufflinks (v2.2.1) and were normalized using the numbers of reads per kilobase pair of exon sequence in a gene per million mapped reads (FPKM, fragments per kilo base per million mapped reads). Differential expression analysis was performed using Cuffdiff (v2.2.1) with a cutoff of 2-fold changes (FC) relative to control levels. The raw data of RNA-seq can be accessed at the NCBI SRA database under the project ID PRJNA532506. We selected genes whose transcript levels were up- or downregulated by at least 2-fold with statistical significance (q < 0.05) to identify DEGs.
DEGs were evaluated for relevance to canonical pathways and biological functions using the MapMan software (Usadel et al. 2009). The list of DEGs obtained was imported into the MapMan gene ontology program to organize them into various functional categories and pathways (“Bins” and “sub-Bins”) using the TAIR 10 (August 2012) as the reference genome database. Differential fold-change values were displayed via a false color code in diagrams. Transcripts that increase and decrease are shown in red and blue, respectively.
ChIP-qPCR assay
For ChIP-qPCR analysis, 1 g of 10-d-old Col-0 (for EIN3 binding) or jin1-8 pMYC2:MYC2-FLAG (for MYC2 binding) seedling was touch-treated and harvested 2 h later in liquid nitrogen. The anti-EIN3 rabbit polyclonal antibody (Agrisera AS194273, www.agrisera.com) and the anti-FLAG antibody (Sigma-Aldrich) were used for enrichment of EIN3 and MYC2 target sites, respectively. ChIP was performed following a method previously described (Gendrel et al. 2005). The enrichment of DNA fragments was determined by quantitative PCR, for which ACTIN7 (At5g09810) was used as the internal standard. The ChIP-qPCR primers are listed in Supplemental Table S5.
Electrophoretic mobility shift assay
For EIN3-GST (glutathione S-transferase) recombinant protein, the truncated cDNA fragment of EIN3 containing the DNA-binding domain (AA141-352) was cloned into the pGEX-4T-1 vector via BamHI/XhoI restriction sites. The construction primers were shown in Supplemental Table S5. The construct was transformed into Escherichia coli (BL21). The empty vector pGEX-4T-1 was used to express GST protein as the negative control. GST-EIN3 recombinant protein and GST were expressed at 37°C for 6 h with 1 mM IPTG in the culture medium. Both the expressed GST-EIN3 and GST protein were purified with a GST-tag Protein Purification Kit (Beyotime). EMSA was performed using an EMSA/Gel-Shift kit (Beyotime).
Protoplast transfection assay
For transient transcriptional activity assay, we firstly generated a construct harboring the firefly luciferase (LUC) gene as well as the 35S promoter-driven renilla luciferase (REN) gene in the pM999 vector to generate pM999-DLUC. Briefly, the REN gene were amplified by RLUC primer pairs from pRL-TK (Promega) and cloned into the XbaI/BamHI sites of pM999. LUC gene were amplified from FHRE-LUC (Addgene) by LUC primer pairs and cloned into the NcoI/BstEII sites of pCAMBIA3301. Then, the fragment containing 35S promoter, LUC gene, and NOS terminate was amplified by 35S-LUC-NOS primer pairs and cloned into the HindIII/PstI sites of pM999. Next, the 1,424- and 2,080-bp promoter sequences of GA2ox7 and GA2ox8 were, respectively, inserted before the LUC gene as reporters. The CDS sequences of EIN3 and MYC2 were cloned into the pM999 vector under the control of the 35S promoter and were used as effectors. All primers used for making these constructs are listed in Supplemental Table S5. Arabidopsis mesophyll protoplast was prepared and transfected as previously described (Yoo et al. 2007). The LUC and REN activity were measured using the Dual-Luciferase Reporter Assay System (Promega).
Statistical analyses
The significance analysis performed by 1-way ANOVA and 2-way ANOVA were conducted by Statistical Program for Social Science software. The result for 2-way ANOVA analysis was shown in Supplemental Table S6. In case of comparing significant differences between 2 samples, the 2-tailed Student's t-test was applied.
Accession numbers
Sequence data from this article can be found in the GenBank/EMBL data libraries under accession numbers_ SAM1 (AT1G02500), SAM2 (AT4G01850), SAM3 (At2G36880), ACS2 (AT1G01480), ACS4 (At2G22810), ACS5 (At5G65800), ACS6 (AT4G11280), ACS7 (AT4G26200), ACS8 (At4G37770), ACS9 (AT3G49700), ACS11 (AT4G08040), ACO1 (AT2G19590), ACO2 (At1G62380), ACO3 (At1G12010), ACO4 (At1G05010), ACO5 (AT1G77330), ETR1 (AT1G66340), ETR2 (AT3G23150), ERS1 (AT2G40940), ERS2 (AT1G04310), EIN4 (AT3G04580), CTR1 (AT5G03730), EIN2 (AT5G03280), EIN3 (AT3G20770), EIL1 (At2G27050), EIL2 (AT5G21120), ERF1 (AT3G23240), ERF2 (AT5G47220), ERF3 (AT2G50640), ERF4 (AT3G15210), ERF5 (AT5G47230), ERF6 (AT4G17490), ERF7 (AT3G20310), ERF9 (AT5G44210), ERF11 (AT1G28370), ERF13 (AT2G44840), ERF59 (AT1G06160), ERF98 (AT3G23230), ERF100 (AT4G17500), ERF104 (AT5G61600), LOX3 (AT1G17420), LOX4 (AT1G72520), AOS (AT5G42650), AOC3 (AT3G25780), OPR3 (AT2G06050), MYC2 (AT1G32640), MYC3 (AT5G46760), MYC4 (AT4G17880), JAR1 (AT2G46370), COI1 (At2G39940), CPS (At4G02780), KS (At1G79460), KO (At5G25900), KOA1 (At1G05160), KAO2 (At2G32440), GA20ox1 (At4G25420), GA20ox2 (At5G51810), GA20ox3 (At5G07200), GA20ox4 (At1G60980), GA20ox5 (At1G44090), GA3ox1 (At1G15550), GA3ox2 (At1G80340), GA3ox3 (At4G21690), GA3ox4 (At1G80330), GA2ox1 (At1G78440), GA2ox2 (At1G30040), GA2ox3 (At2G34555), GA2ox4 (At1G47990), GA2ox6 (At1G02400), GA2ox7 (At1G50960), GA2ox8 (At4G21200), GA13ox1 (AT5G24910), GA13ox2 (At5G24900), HLS1 (AT4G37580), FER (AT3G51500), TCH2K1 (AT1G56660), CAMTA3 (AT2G22300), TCH3 (AT2G41100), TREPH1 (AT5G55860), CML38 (AT1G76650), CML39 (AT1G76640), JAZ7 (AT2G34600), and PP2AA3 (AT1G13320).
Acknowledgments
We thank Drs Hongwei Guo (Southern University of Science and Technology), Jinyong Hu (Kunming Institute of Botany, CAS), and Xingliang Hou (South China Botanical Garden, CAS) for kindly providing Arabidopsis seeds. The authors declare no conflict of interest.
Author contributions
These authors made the following contributions to the manuscript: L.W. and J.W. planned and designed the research. L.W. performed phytohormone measurement, EMSA, ChIP-qPCR, ethylene measurement, and analyzed the RNA-seq data. C.M. touch-treated the plants and recorded the thigmomorphogenic phenotypes. S.W. performed RT-qPCR. F.Y., J.T., and Y.S. generated and screened ein3 eil1 RNAi-GA2ox8 and myc234 RNAi-EIN3EIL1 lines. J.L. initially set up the touch treatment protocol. L.W. and J.W. wrote the manuscript.
Supplemental data
The following materials are available in the online version of this article.
Supplemental Figure S1. Immunoblot analysis of EIN3 protein levels after a single touch treatment.
Supplemental Figure S2. Ethylene pathway controls touch-induced reduction of rosette size and delay of flowering time.
Supplemental Figure S3. GA4 supplement recovered the touch-hypersensitive phenotype of octuple acs and etr1 mutants.
Supplemental Figure S4. Transcription changes of GA metabolic genes in Col-0, ein2, and ein3 eil1 plants after a single touch treatment.
Supplemental Figure S5. Silencing of GA2ox8 in ein3 eil1 RNAi-GA2ox8 plants.
Supplemental Figure S6. Mutants impaired in the JA pathway do not respond to touch with reduction of rosette sizes.
Supplemental Figure S7. ET and JA pathways independently regulate touch-induced reduction of rosette size.
Supplemental Figure S8. The silencing efficiency of EIN3 and EIL1 in myc234 RNAi-EIN3EIL1 plants.
Supplemental Figure S9. Silencing EIN3 and EIL1 in myc234 recovered the sensitivity of myc234 to touch treatment.
Supplemental Figure S10. ET and JA pathway independently regulate GA4 accumulation during touch-induced thigmomorphogenesis.
Supplemental Table S1. Overview of RNA-seq data
Supplemental Table S2. Genes detected in all samples
Supplemental Table S3. Genes significantly up- or downregulated by touch
Supplemental Table S4. Lists of genes based on regulation analysis among touch-regulated genes in MapMan
Supplemental Table S5. List of primers for RT-qPCR, ChIP-qPCR, and plasmid construction
Supplemental Table S6.P values obtained by 2-way ANOVA analyses
Funding
This work was supported by the National Natural Science Foundation of China (Nos 31770301 and 31470382).
Data availability
The data underlying this article are available in this article and in its online supplementary material.
Dive Curated Terms
The following phenotypic, genotypic, and functional terms are of significance to the work described in this paper:
References
Author notes
Conflict of interest statement. The authors declare that they have no conflict of interests.
