


Abstract
Sugarcane mosaic virus (SCMV), one of the main pathogens causing sugarcane mosaic disease, is widespread in sugarcane (Saccharum spp. hybrid) planting areas and causes heavy yield losses. RESPIRATORY BURST OXIDASE HOMOLOG (RBOH) NADPH oxidases and plasma membrane intrinsic proteins (PIPs) have been associated with the response to SCMV infection. However, the underlying mechanism is barely known. In the present study, we demonstrated that SCMV infection upregulates the expression of ScRBOHs and the accumulation of hydrogen peroxide (H2O2), which inhibits SCMV replication. All eight sugarcane PIPs (ScPIPs) interacted with SCMV-encoded protein 6K2, whereby two PIP2s (ScPIP2;1 and ScPIP2;4) were verified as capable of H2O2 transport. Furthermore, we revealed that SCMV-6K2 interacts with ScPIP2;4 via transmembrane domain 5 to interfere with the oligomerization of ScPIP2;4, subsequently impairing ScPIP2;4 transport of H2O2. This study highlights a mechanism adopted by SCMV to employ 6K2 to counteract the host resistance mediated by H2O2 to facilitate virus infection and provides potential molecular targets for engineering sugarcane resistance against SCMV.
Introduction
Hydrogen peroxide (H2O2) is the most stable component of reactive oxygen species (ROS), with a long half-life, and serves as a secondary messenger in plant signaling pathways, thereby playing key roles in plant growth and development (Maurel et al. 2015, 2021; Mittler 2017; Jiménez et al. 2021; Considine and Foyer 2021a; Martin et al. 2022) and responses to abiotic or biotic stresses (Gill and Tuteja 2010; Wrzaczek et al. 2013; Choudhury et al. 2017; Qi et al. 2017, 2018; Rodrigues et al 2017; Zhang et al. 2018a; Considine and Foyer 2021b; Dumanovi et al. 2021; Bi et al. 2022; Mittler et al. 2022; Jin et al. 2023). H2O2 can be produced in multiple subcellular compartments, like the cell wall, plasma membrane (PM), chloroplast, mitochondria, and peroxisome; however, it is primarily produced in the apoplast by PM-localized RESPIRATORY BURST OXIDASE HOMOLOG (RBOH) NADPH oxidases during plant–pathogen interactions (Mignolet-Spruyt et al. 2016; Choudhury et al. 2017; Qi et al. 2017, 2018; Zhang et al. 2018b). RBOHs transfer electrons from the cytoplasmic NADPH to O2 to generate O2•−, which is then catalyzed into H2O2 by superoxide dismutase (SOD) (Qi et al. 2017, 2018; Qureshi et al. 2022). ROS burst, especially the generation of H2O2, hallmarks one of the early events in plant response to stress, which has been extensively studied in plants upon infection by bacterial or fungal pathogens (Levine et al. 1994; Daudi et al. 2012; Kadota et al. 2015; Tian et al. 2016; Qi et al. 2017, 2018; Balint-Kurti 2019; Yu et al. 2020; Mittler et al. 2022; Qureshi et al. 2022; Jin et al. 2023). However, the mechanism through which apoplastic H2O2 regulates intracellular immunity in plants has been a long-standing question, which was recently answered by a series of studies demonstrating that PM intrinsic proteins (PIPs) conduct apoplastic H2O2 across the PM into the cytoplasm to regulate immunity (Tian et al. 2016; Zhang et al. 2019a, 2022a; Ai et al. 2021; Lu et al. 2022). PIPs are composed of two groups, i.e. PIP1 and PIP2, and they constitute the largest subfamily of aquaporins (AQPs) capable of transporting water, H2O2, carbon dioxide (CO2), ions, and small solutes across biological membranes (Maurel et al. 2015, 2021; Groszmann et al. 2017; Qiu et al. 2020). In Arabidopsis (Arabidopsis thaliana), upon bacterial pathogen Pst DC3000 infection, AtPIP1;4 transports apoplastic H2O2 into the cytoplasm to regulate systemic acquired resistance, the MAPK pathway, and the deposition of callose to enhance resistance (Tian et al. 2016; Zhang et al. 2019a). In wheat (Triticum aestivum), TaPIP2;10 transports CO2 and H2O2 into the cytoplasm, and this dependents on the phosphorylation of serine at different sites and influences photosynthesis or defense against the aphid Sitobion avenae and fungal pathogens Blumeria graminis and Fusarium graminearum (Wang et al. 2021a; Lu et al. 2022). Increasing numbers of reports suggest that PIP transport of H2O2 regulates plant interactions with bacterial or fungal pathogens, thereby resulting in resistance or susceptibility (Maurel et al. 2015, 2021; Rodrigues et al. 2017, 2022; Wang et al. 2018, 2021a; Li et al. 2019; Zhang et al. 2019b, 2022a; Ai et al. 2021; Lu et al. 2022). Several studies evidenced that the generation of H2O2 mediated by RBOHs contributes to the resistance to several plant viruses, like Potato virus Y (PVY), Turnip mosaic virus (TuMV), Tobacco mosaic virus (TMV), Potato virus X (PVX), and Wheat yellow mosaic virus (WYMV) (Doke and Ohashi 1988; Moeder et al. 2005; Király et al. 2008, 2021; Deng et al. 2016; Lukan et al. 2020; Otulak-Kozieł et al. 2020; Zhang et al. 2023). However, whether or how plant viruses interfere with the apoplastic H2O2 transport into cytoplasm via PIPs to establish infection remains elusive.
SCMV is one of the main viral pathogens causing mosaic disease in sugarcane (Saccharum spp. hybrid) (Wu et al. 2012; Akbar et al. 2021b). SCMV is widespread in sugarcane-growing countries, and it causes heavy yield losses and poses a constant threat to the sugar industry (Lam et al. 2009; Wu et al. 2012; Li et al. 2013; Sabatier et al. 2015; Yao et al. 2017). SCMV belongs to the Potyvirus genus, the members of which have a single-stranded positive-sense ∼10 kb RNA genome encoding 2 polyproteins that are then proteolytically processed into 11 mature proteins: P1, HC-Pro, P3, P3N-PIPO, 6K1, CI, 6K2, VPg, NIa, NIb, and CP (Urcuqui-Inchima et al. 2001; Olspert et al. 2016; Cheng et al. 2017, 2020), in which 6K2 plays key roles in viral replication and cell-to-cell movement (Cotton et al. 2009; Wei et al. 2010, 2013; Grangeon et al. 2013; Wang 2015, 2021; Movahed et al. 2017, 2019; Hafrén et al. 2018; Li et al. 2018, 2020; Zhang et al. 2019a; Chai et al. 2020; Xie et al. 2021; Wu et al. 2022; Jiang et al. 2023). SCMV infection transcriptionally upregulated RBOH genes and enhanced H2O2 accumulation in a resistant line compared with the control (Akbar et al. 2020), which indicates that H2O2 is involved in the intracellular immune response to SCMV. However, the underlying mechanism is largely unknown. In our previous study, we screened the sugarcane cDNA yeast (Saccharomyces cerevisiae) library with SCMV-6K2 as bait and discovered that two PIPs, ScPIP1;2 and ScPIP2;7, interact with SCMV-6K2 (Zhang et al. 2019b). These results prompted us to speculate that SCMV might interfere with apoplastic H2O2 transport into the cytoplasm through the interaction of SCMV-6K2 with ScPIPs.
In the present study, eight ScPIPs were evaluated for their H2O2 transport capability, among which ScPIP2;1 and ScPIP2;4 are capable of H2O2 transport in yeast. SCMV-6K2 was found to interact with ScPIP2;4 to impair the transmembrane transport of H2O2, thereby facilitating SCMV infection. We also found that TuMV-6K2 interacts with seven AtPIPs from Arabidopsis, in which 2 PIPs, AtPIP1;4 and AtPIP2;2 are capable of transporting H2O2 (Bienert and Chaumont 2014; Tian et al. 2016). This study indicates a general mechanism employed by potyviruses to counteract host H2O2 to establish infection and might benefit breeding efforts against potyviruses.
Results
Sugarcane PIP gene cloning and expression profiles upon SCMV infection
To obtain a global view of the PIP genes in sugarcane, we screened the genome of Ap85-441 (Saccharum spontaneum) (Zhang et al. 2018c, 2022b) by BLASTp and NCBI CD-Search. Ten SsPIP genes containing 42 alleles were identified in AP85-441 (Supplemental Table S1). To confirm the classification of these PIPs, SsPIPs, and PIPs from Arabidopsis, rice (Oryza sativa), sorghum (Sorghum bicolor), and maize (Zea mays) (Supplemental Table S2) were subjected to phylogenetic tree analysis by Neighbor-joining with bootstrap 1,000 times. The results showed that 10 SsPIPs were classified into two subgroups with four members in group PIP1 (SsPIP1;1, SsPIP1;2, SsPIP1;5, and SsPIP1;6), and six members in group PIP2 (SsPIP2;1, SsPIP2;4, SsPIP2;5, SsPIP2;6, SsPIP2;7, and SsPIP2;8) (Supplemental Fig. S1). Special PCR primers (Supplemental Table S3) based on the SsPIPs were used to clone the PIP genes from the leaves of sugarcane cultivar ROC22, which is susceptible to SCMV. Eight PIP genes, i.e. ScPIP1;1, ScPIP1;2, ScPIP1;5, ScPIP2;1, ScPIP2;4, ScPIP2;5, ScPIP2;6, and ScPIP2;7, were successfully cloned, while the ScPIP1;6 and ScPIP2;8 could not be cloned, which may be attributed to their low expression levels in leaves. The phylogenetic tree analysis yielded similar results for eight ScPIPs compared with those for 10 SsPIPs (Supplemental Fig. S1).
Reverse transcription quantitative PCR (RT-qPCR) was performed to determine the expression patterns of the eight ScPIP genes. For the tissue-specific expression analysis, the leaf roll, the +1 leaf (the first leaf with a visible dewlap from the top to the bottom of the sugarcane plant), the seventh leaf, the third internode, the seventh internode, and the roots were sampled. As shown in Fig. 1A, the expression levels of ScPIPs significantly varied in different tissues. For the expression profiles of ScPIPs upon SCMV infection, tissue-cultured sugarcane plantlets were sampled at 0, 1, and 8 d after SCMV inoculation. The CP gene of SCMV was detected to confirm successful SCMV infection (Supplemental Fig. S2). The results showed that the expression levels of ScPIP1;2 and ScPIP2;6 were downregulated after infection, while the expression levels of ScPIP1;1 and ScPIP1;5 were upregulated at day 1 but downregulated at day 8. The expression levels of ScPIP2;1, ScPIP2;4, ScPIP2;5, and ScPIP2;7 were upregulated after infection, with ScPIP2;4 displaying the highest expression level among these four genes (Fig. 1B).
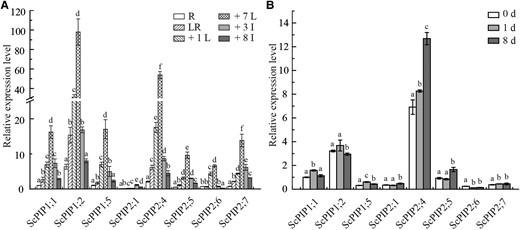
Relative expression of eight ScPIP genes in different sugarcane tissues or leaves. challenged by SCMV. A) Tissue-specific expression analysis of ScPIP1;1, ScPIP1;2, ScPIP1;5, ScPIP2;1, ScPIP2;4, ScPIP2;5, ScPIP2;6, and ScPIP2;7 in the elongating stage of sugarcane ROC22 plants. Data were normalized to the expression level of the eukaryotic elongation factor 1-alpha (eEF-1α) gene and D-glyceraldehyde-3-phosphate dehydrogenase (GADPH) gene. R, root; LR, leaf roll; +1 L, the first leaf; +7 L, the 7th leaf; +3 I, the 3rd internode; +8 I: the 8th internode. The different letters above each bar indicate statistically significant differences as determined by a one-way ANOVA followed by Tukey's multiple test (P < 0.05). Each bar represents mean ± SEM (standard error of the mean) from three independent biological replicates (n = 3). B) The expression profiles of eight ScPIP genes in sugarcane ROC22 leaves challenged by SCMV. Mock inoculated plants with 0.01 M phosphate buffer (pH = 7.0) were used as the negative controls. The y axis indicates the relative expression of ScPIPs at 0, 1, and 8 d post-inoculation. The x axis indicates the time point of material collection. The different letters above each bar indicate statistically significant differences as determined by a one-way ANOVA followed by Tukey's multiple test (P < 0.05), Each bar represents mean ± SEM from three independent biological replicates (n = 3).
Expression profiles of the ScRBOHs and H2O2 induction in sugarcane plants upon SCMV infection
Considering that RBOHD and RBOHF are involved in the response to pathogen infection (Kadota et al. 2015; Morales et al. 2016; Otulak-Kozieł et al. 2020), we investigated the expression profiles of the ScRBOHD, ScRBOHF1, and ScRBOHF2 genes in sugarcane plantlets infected by SCMV. The results showed that ScRBOHD and ScRBOHF1 were significantly upregulated at 2 h post-inoculation, with the ScRBOHD expression upregulated approximately 10-fold whereas ScRBOHF2 showed no obvious difference (Fig. 2A). We also found the upregulated expression of RBOH and SOD genes in sugarcane plants upon Sugarcane streak mosaic virus (SCSMV, another mosaic pathogen of sugarcane) infection in our previous work (Dong et al. 2017). These combined results indicate that H2O2 induction occurs in the early stage of mosaic pathogen infection on sugarcane plants.
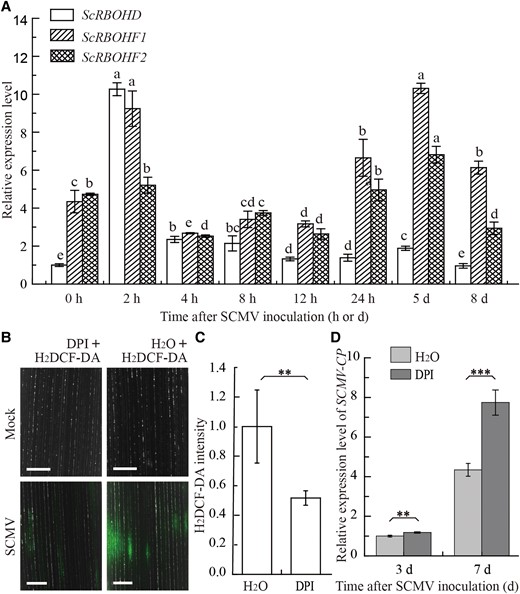
Relative expression of ScRBOHs and ROS production in sugarcane leaves upon SCMV infection. A) Relative expression of ScRBOHD, ScRBOHF1, and ScRBOHF2 in sugarcane leaves upon SCMV infection. The data were normalized to the expression level of eEF-1α and GADPH. The different letters above each bar indicate statistically significant differences as determined by a one-way ANOVA followed by Tukey's multiple test (P < 0.05), Each bar represents mean ± SEM from three independent biological replicates (n = 3). B) H2DCFDA (2′,7′-dichlorofluorescin diacetate) staining (green fluorescence) alone or supplemented with DPI in the leaves of tissue-cultured sugarcane ROC22 plantlets 48 h post-SCMV inoculation. H2O was used as a blank control. Intracellular oxidized H2DCF-DA was excited at 488 nm, and the emitted light was captured at 543 nm. Bars = 500 μm. C) Intensity quantification of fluorescence based on the assay in (B) by using ImageJ. Each bar represents mean ± SEM from four independent biological replicates (n = 4). **, P < 0.01 by Student's t test. D) RT-qPCR detection of the relative expression of SCMV-CP in the leaves of sugarcane cultivar ROC22 with or without DPI treatments at 3 and 7 d post-SCMV inoculation. H2O was used as a blank control. Each bar represents the mean ± SEM from three independent experiments (n = 3). Statistical significance between the two treatments was determined by Student's t test. **, P < 0.01; ***, P < 0.001.
SCMV infection caused increase in H2O2 in sugarcane plants (Akbar et al. 2020). To further verify the role of RBOH in ROS generation upon SCMV infection, 2′,7′-dichlorofluorescin diacetate (H2DCF-DA) was used to probe the ROS in the SCMV-inoculated leaves. Confocal observation showed obvious green fluorescence in the leaves of sugarcane plants at 48 h post-SCMV inoculation (Fig. 2B). However, green fluorescence was significantly reduced when the plants were treated with diphenyleneiodonium (DPI) (Fig. 2, B and C), a chemical agent that efficiently inhibits RBOH oxidase activity to nullify H2O2 generation in plant apoplasts (Cortés-Ríos et al. 2017). DPI treatments promoted the replication of SCMV as indicated by the detection of the CP gene of SCMV by RT-qPCR (Fig. 2D). The accumulation of SCMV was significantly, although slightly, enhanced at 3 d after DPI treatment, while almost doubled at 7 d after DPI treatment compared with control (Fig. 2D). These results indicate that SCMV infection induces the generation of RBOH-mediated apoplastic H2O2, which negatively regulates SCMV accumulation.
ScPIP2;1 and ScPIP2;4 mediate extracellular H2O2 translocation in yeast
To investigate the H2O2 transport activity of ScPIPs, eight ScPIP genes were individually cloned into the pPPR3-N vector to generate Cub-ScPIP1;1, Cub-ScPIP1;2, Cub-ScPIP1;5, Cub-ScPIP2;1, Cub-ScPIP2;4, Cub-ScPIP2;5, Cub-ScPIP2;6 and Cub-ScPIP2;7. Then, these constructs were individually transformed into yeast NMY51 cells. The yeast transformants were grown on SD-Trp medium plates containing different concentrations of H2O2. Yeast cells transformed with the empty vector pPPR3-N were used as a transgenic control. After 3 d of incubation, the yeast cells transformed with Cub-ScPIP2;1 or Cub-ScPIP2;4 showed obvious growth inhibition under 0.8 mM H2O2 and impaired growth under 1.2 mM H2O2 compared with the control or the yeast cells transformed with other ScPIPs (Fig. 3A). Western blot assays were performed to confirm the expression of each ScPIP in yeast cells (Fig. 3A). Clearly, the decreased viability of yeast transformants was due to the toxicity of the imported extracellular H2O2.
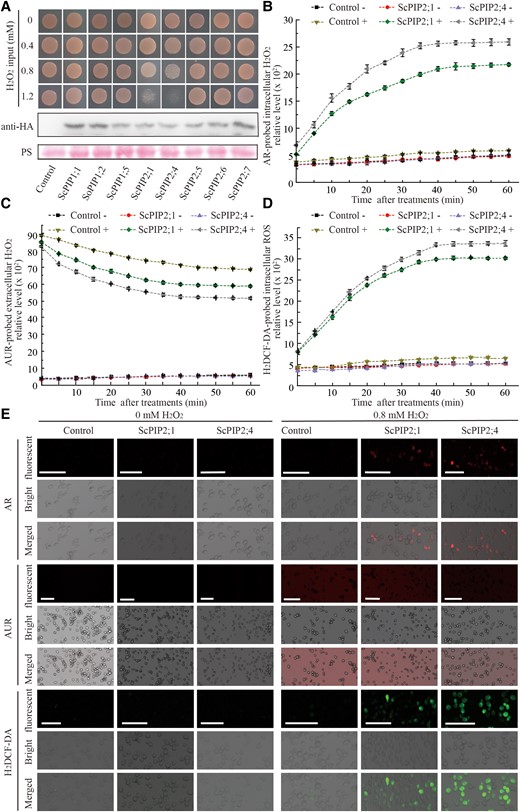
Expression of ScPIP2;1 or ScPIP2;4 mediates H2O2 transport in yeast. A) Yeast transformant cells expressing ScPIP1;1, ScPIP1;2, ScPIP1;5, ScPIP2;1, ScPIP2;4, ScPIP2;5, ScPIP2;6, or ScPIP2;7 were grown on SD/-Trp medium 2 d after treatment with 0, 0.4, 0.8 or 1.2 mM H2O2. The expression levels of ScPIPs in yeast cells were evaluated by Western blot using an antibody against HA (hemagglutinin) tag, and PS (Ponceau S) staining was used to show protein loading. “Control” indicates the empty yeast binary vector without any insert of tested genes, in contrast to the recombinant vector carrying each of the ScPIPs. B–D) Chronological changes of H2O2 content in yeast transformant cells expressing ScPIP2;1 or ScPIP2;4 after treatment with 0 or 0.8 mM H2O2 detected by AR (Amplex Red), AUR (Amplex Ultra Red), and H2DCF-DA (2′,7′-dichlorofluorescin diacetate) probes, respectively. The symbol “+” indicates supplied with 0.8 mM H2O2, and “−” indicates supplied with H2O as control. Each bar represents the mean ± SEM from three independent experiments (n = 3). E) Fluorescent probes AR, AUR, and H2DCF-DA were used to visualize the yeast transformant cells expressing ScPIP2;1 or ScPIP2;4 40 min after treatment with 0.8 mM H2O2. Scale bar = 25 μm.
To confirm the abilities of ScPIP2;1 or ScPIP2;4 to transport H2O2, the fluorescent probes Amplex Red (AR), Amplex Ultra Red (AUR), and H2DCF-DA were used to monitor the chronological changes of the relative levels of extracellular or intracellular H2O2 or ROS in the yeast transformants at 5-min intervals for 60 min after treatment with 0 or 0.8 mM H2O2. H2DCF-DA and AR are able to penetrate the PM, with H2DCF-DA probing the total intracellular ROS and AR probing only intracellular H2O2. AUR is impermeable to PM and only detects extracellular H2O2 (Ashtamker et al. 2007; Deng et al. 2016; Tian et al. 2016; Cortés-Ríos et al. 2017; Zhang et al. 2022a). As indicated by AR, the relative level of intracellular H2O2 increased within 60 min, with the ScPIP2;4 yeast transformants being higher in these levels than the ScPIP2;1 yeast transformants (Fig. 3B). The quantities of intracellular H2O2 increased to 9.0- or 7.8-fold in the ScPIP2;4 or ScPIP2;1 yeast transformants compared with the null treatments or transgenic controls at 60 min, respectively, with the H2O2 quantities in ScPIP2;4 yeast transformants significantly higher than that in ScPIP2;1 yeast transformants at other tested time points (Fig. 3B; Supplemental Fig. S3A). However, the relative level of extracellular H2O2 indicated by AUR within 60 min in the ScPIP2;4 yeast transformants was lower than that in the ScPIP2;1 yeast transformants (Fig. 3C). The quantities of extracellular H2O2 decreased 1.5- or 1.3-fold in the ScPIP2;4 or ScPIP2;1 yeast transformants compared with the null treatments or transgenic controls at 60 min, respectively, with the extracellular H2O2 quantities in ScPIP2;4 yeast transformants clearly being lower than those in ScPIP2;1 yeast transformants at other tested time points (Fig. 3C; Supplemental Fig. S3B). The total intracellular ROS indicated by H2DCF-DA yielded the same results in Fig. 3D and Supplemental Fig. S3C as the H2O2 indicated by AR (Fig. 3B; Supplemental Fig. S3A).
To visualize H2O2 transport, confocal microscopy was conducted with AR, AUR, and H2DCF-DA probes 40 min after transformant yeast cells were treated with H2O or 0.8 mM H2O2. The results showed that the yeast cells transformed with ScPIP2;4 developed stronger intracellular red or green fluorescence signals, indicated by AR or H2DCF-DA, respectively, than those transformed with ScPIP2;1. Weaker extracellular red fluorescence signals indicated by AUR were observed in yeast cells transformed with ScPIP2;4 than those transformed with ScPIP2;1 whereas the null treatment or yeast cells transformed with empty vector developed no fluorescence (Fig. 3E). These combined results showed that H2O2 can be efficiently transported into yeast cells by ScPIP2;1 or ScPIP2;4 expression, with the H2O2 transport capability of ScPIP2;4 being substantially stronger than that of ScPIP2;1.
SCMV-6K2 interacts with and impairs ScPIP2;4 transport of H2O2
In our previous study, ScPIP1;2 and ScPIP2;7 were found to interact with SCMV-6K2 by Y2H assays (Zhang et al. 2019b). To test the possible interactions of other ScPIPs with SCMV-6K2, Y2H assays were performed. All the ScPIPs interact with SCMV-6K2 (Supplemental Fig. S4). Considering that the expression level of ScPIP2;4 is significantly higher than that of ScPIP2;1 in sugarcane plants with or without SCMV inoculation (Fig. 1, A and B), we focused on ScPIP2;4 to investigate the potential influence of interaction with SCMV-6K2 on H2O2 transport. First, bimolecular fluorescence complementation (BiFC) and Co-IP assays were performed to confirm the interaction of ScPIP2;4 with SCMV-6K2. For the BiFC assays, ScPIP2;4 was fused in frame to the N-terminal half or the C-terminal half of yellow fluorescence protein (YFP) to generate ScPIP2;4-YN or ScPIP2;4-YC constructs, respectively. SCMV-6K2 was fused in frame to the C-terminal half of YFP to generate the SCMV-6K2-YC construct. ScPIP2;4-YN was co-agroinfiltrated with SCMV-6K2-YC or ScPIP2;4-YC into Nicotiana benthamiana leaves. The endoplasmic reticulum (ER) marker mCherry-HDEL and the PM marker REM1.2-mCherry (Cheng et al. 2020) were used to localize the interaction of ScPIP2;4-YN with SCMV-6K2-YC or ScPIP2;4-YC, respectively. The combination of ScPIP2;4-YN plus -YC or the combination of ScPIP2;4-YC plus -YN served as negative controls. By 48 h post-agroinfiltration (hpa), the fluorescence of the YFP was observed by confocal microscopy in leaf cells co-expressing ScPIP2;4-YN and SCMV-6K2-YC and merged with the fluorescence of mCherry-HDEL (Fig. 4A). As PIPs are characterized by self-interaction, the combination of ScPIP2;4-YN with ScPIP2;4-YC was used as positive controls and also yielded fluorescence, which merged with REM1.2-mCherry (Fig. 4A), reminiscent of AtPIP2;1 from Arabidopsis (Yoo et al. 2016). As expected, the negative controls yielded no fluorescence (Fig. 4A). Then, the interaction of ScPIP2;4 with SCMV-6K2 was further confirmed by Co-IP assays (Fig. 4B). To further investigate the subcellular localization of the self-interaction of ScPIP2;4, protoplast experiments were performed. ScPIP2;4-YFP was localized to PM or ER (Supplemental Fig. S5A), reminiscent of the HvPIP2;2 and HvPIP2;7 from barley (Besse et al. 2011), while the self-interaction of ScPIP2;4 mainly occurred on PM (Supplemental Fig. S5B). Y2H and BiFC assays were also performed to investigate the interaction of TuMV-6K2 with the 13 PIPs from Arabidopsis. The results showed that TuMV-6K2 selectively interacts with all five AtPIP1s, AtPIP2;2, and AtPIP2;3 (Supplemental Fig. S6), in which AtPIP1;4 and AtPIP2;2 are capable of H2O2 transport (Bienert and Chaumont 2014; Tian et al. 2016).
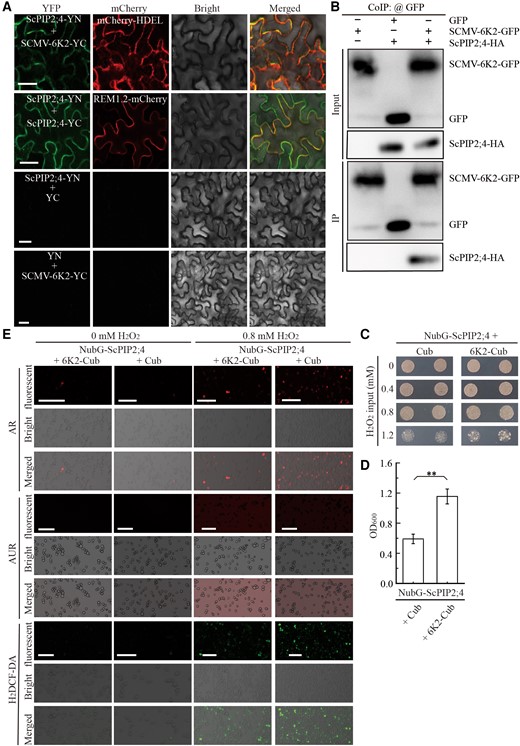
Interaction of ScPIP2;4 with SCMV-6K2 interferes the transport of H2O2. A) Self-interaction of ScPIP2;4 or its interaction with SCMV-6K2 by BiFC assays. ScPIP2;4-YN was co-agroinfiltrated into N. benthamiana leaves with ScPIP2;4-YC or 6K2-YC, respectively, and observed at 2 d post-agroinfiltration. The leaf epidermal cells pairwise co-transformed with ScPIP2;4-YN and YC were used as negative controls. All images are single confocal sections. Scale bar = 25 μm. B) Interaction of ScPIP2;4 with SCMV-6K2 by Co-IP (Co-Immunoprecipitation) assays with antibodies against GFP or HA at 2 d post-agroinfiltration. C) Yeast cells cotransformed with NubG-ScPIP2;4 plus SCMV-6K2-Cub or NubG-ScPIP2;4 plus Cub (blank control) were grown on SD/-Trp medium 4 d after treatment with 0, 0.4, 0.8 or 1.2 mM H2O2. D) Yeast transformant cells in (C) were grown in SD/-Trp liquid medium 1 d after treatment with 1.2 mM H2O2. Then, the value of OD600 (optical density at 600 nm) was measured to quantify the viability of yeast transformed cells in (C). Each bar represents the mean ± SEM from three independent experiments (n = 3). Statistical significance between the two treatments was determined by Student's t test. **, P < 0.01. E) Fluorescent probes AR, AUR, and H2DCF-DA were used to visualize the yeast transformants in (C) 40 min after treatment with 0.8 mM H2O2. Scale bar = 25 μm.
Then, the impact of the interaction of ScPIP2;4 with SCMV-6K2 on H2O2 transport was evaluated by yeast assays. Yeast strain NMY51 cells were co-transformed with NubG-ScPIP2;4 plus Cub (blank control) or NubG-ScPIP2;4 plus SCMV-6K2-Cub and then cultured on SD-Trp plates supplied with H2O2 at different concentrations. The yeast cells co-transformed with NubG-ScPIP2;4 plus SCMV-6K2-Cub showed increased viability compared with the control 4 d after treatment with 1.2 mM H2O2 (Fig. 4C), which was further confirmed by the yeast growth assays in liquid culture medium (Fig. 4D). To visualize the impact of SCMV-6K2 on H2O2 transport by ScPIP2;4, confocal microscopy assays were conducted by using AR, AUR or H2DCF-DA to monitor the extracellular or intracellular H2O2 or total ROS of yeast cells transformed with NubG-ScPIP2;4 plus Cub (blank control) or NubG-ScPIP2;4 plus SCMV-6K2-Cub, respectively. As shown in Fig. 4E, the red fluorescence of AR or the green fluorescence of H2DCF-DA in the NubG-ScPIP2;4 plus Cub co-transformed yeast cells yielded stronger signals compared with the NubG-ScPIP2;4 plus SCMV-6K2-Cub co-transformed yeast cells, respectively, whereas the intensities of red fluorescence signals of AUR were opposite. These combined results demonstrated that SCMV-6K2 impairs ScPIP2;4 transport of H2O2.
SCMV-6K2 inhibits the oligomerization of ScPIP2;4 by interacting with TM5
AQPs generally function as homo or heterotetramers, and the formation of tetramers is pivotal for the transport of H2O or other small molecules (Sorieul et al. 2011; Berny et al. 2016; Jozefkowicz et al. 2016; Yoo et al. 2016; Bienert et al. 2018; Vajpai et al. 2018; Wang et al. 2020). PIPs usually possess six transmembrane domains (TMs) in which TM2 or TM5 have been identified to play crucial roles in tetramer formation (Yoo et al. 2016; Vajpai et al. 2018). SCMV-6K2 is a single transmembrane protein (Zhang et al. 2019b), and the interaction between membrane proteins is usually mediated by the TMs. Therefore, we speculate that SCMV-6K2 interacts with ScPIP2;4 through TM2 or TM5, thereby inhibiting the oligomerization of ScPIP2;4. To test our hypothesis, we identified the TMs in ScPIP2;4 by TMHMM (Supplemental Fig. S7) and deleted TM2 (79 to 101) or TM5 (204 to 226) to generate two truncated mutants, ScPIP2;4Δ79-101 and ScPIP2;4Δ204-226, respectively. As demonstrated by the Y2H assays, ScPIP2;4 could self-interact, and SCMV-6K2 interacted with ScPIP2;4Δ79-101, but not ScPIP2;4Δ204-226 (Fig. 5A). The viability of yeast cells co-transformed with ScPIP2;4-Cub plus NubG-ScPIP2;4Δ79-101 or ScPIP2;4-Cub plus NubG-ScPIP2;4Δ204-226 was significantly lower than that of yeast cells co-transformed with ScPIP2;4-Cub plus NubG-ScPIP2;4 (Fig. 5B), indicating that the interaction strength of ScPIP2;4Δ79-101 or ScPIP2;4Δ204-226 with ScPIP2;4 was significantly decreased compared with that of ScPIP2;4 self-interaction. The BiFC assays yielded similar results (Fig. 5C) as demonstrated by the Y2H assays (Fig. 5A). The intensity of YFP fluorescence normalized to that of mCherry based on the BiFC assay (Fig. 5C) showed that the interaction strength of ScPIP2;4-YN with ScPIP2;4-YC was significantly higher than that with ScPIP2;4Δ79-101-YC or ScPIP2;4Δ204-226-YC (Fig. 5D). These results indicated that the TM5 of ScPIP2;4 mediates the interaction with SCMV-6K2 and that TM2 or TM5 plays key roles in the oligomerization of ScPIP2;4. The H2O2 transport capability of ScPIP2;4Δ79-101 or ScPIP2;4Δ204-226 was investigated by yeast growth assays. As expected, the viability of ScPIP2;4Δ79-101-transformed yeast cells or ScPIP2;4Δ204-226-transformed yeast cells was significantly higher than that of ScPIP2;4 transformed yeast cells under 1.2 mM H2O2 (Supplemental Fig. S8).
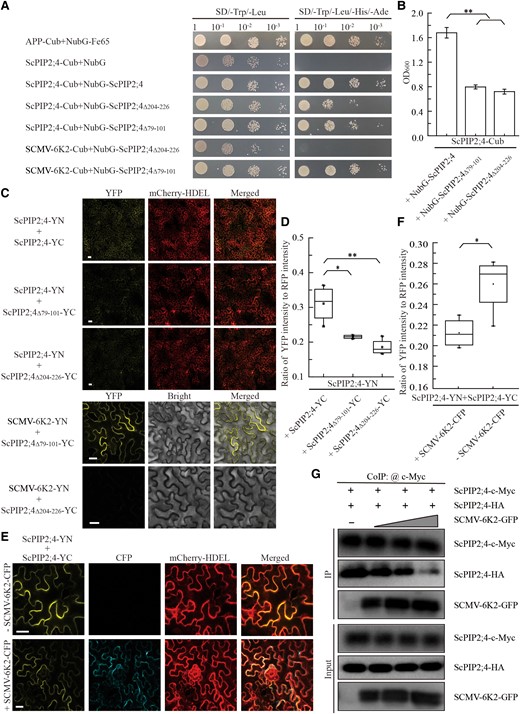
SCMV-6K2 interacts with and impairs the oligomerization of ScPIP2;4 via TM5. A) Verification of protein interaction by yeast two-hybrid assays. Yeast NMY51 cells co-transformed of ScPIP2;4-Cub (C-terminal ubiquitin) with NubG-ScPIP2;4, NubG-ScPIP2;4Δ79-101 or NubG-ScPIP2;4Δ204-226 in a 10× dilution series of 10-μl aliquots were cultured on SD/-Leu/-Trp or SD/-Leu/-Trp/-His/-Ade plates for 2 d. Yeast cells co-transformed with APP (amyloid A4 precursor protein)-Cub and NubG-Fe65 were used as positive controls, ScPIP2;4-Cub and NubG (N-terminal ubiquitin with the isoleucine at position 3 being exchanged for a glycine) were used as negative controls. B) Yeast transformant cells in (A) were cultured in the SD/-Leu/-Trp/-His/-Ade liquid medium for 2 d. Then the value of OD600 (optical density at 600 nm) was measured to quantify the interaction strength. Each bar represents the mean ± SEM from three independent experiments (n = 3). Statistical significance between the two treatments was determined by Student's t test. **, P < 0.01. C) Verification of protein interaction by BiFC assays. Agrobacteria harboring YC/YN fusion proteins were co-agroinfiltrated into N. benthamiana leaves, respectively. The images were captured at 48 h post-agroinfiltration by using a confocal laser scanning microscope. Scale bar = 25 μm. D) Intensity quantification of YFP fluorescence generated by the interaction of ScPIP2;4-YN with ScPIP2;4-YC, ScPIP2;4Δ79-101-YC or ScPIP2;4Δ204-226-YC, respectively, based on the BiFC assay in (C) by using ImageJ software. The relative intensity of YFP fluorescence was normalized to that of the fluorescence of mCherry-HDEL. Datasets are graphically presented as box and whisker plots. Box limits represent the 25th and 75th percentiles; the horizontal line represents the median; whiskers extend to the minimal and maximal values. The quantitative results were statistical analysis from three independent biological replicates (n = 3) by Student's t test. *, P < 0.05; **, P < 0.01. E) Self-interaction of ScPIP2;4 by BiFC assays in the present or absent of SCMV-6K2 as described in (C). F) Intensity quantification of YFP fluorescence generated by the interaction of ScPIP2;4-YN with ScPIP2;4-YC in (E) as described in (D). Datasets are graphically presented as box and whisker plots. Box limits represent the 25th and 75th percentiles; the horizontal line represents the median; whiskers extend to the minimal and maximal values. The quantitative results were statistical analysis from three independent biological replicates (n = 3) by Student's t test. *, P < 0.05. G) Co-IP (Co-Immunoprecipitation) assays showing the impact of SCMV-6K2 on the self-interaction of ScPIP2;4. ScPIP2;4-c-Myc and ScPIP2;4-HA were co-agroinfiltrated into N. benthamiana leaves with SCMV-6K2-GFP in different concentrations (OD600 = 0, 0.1, 0.2, 0.3). After 72 h post-agroinfiltration, total proteins were extracted and incubated with anti-GFP agarose. Input and IP proteins were analyzed by protein gel blot analysis with anti-GFP, HA, or c-Myc antibodies, respectively.
To visualize the interference of SCMV-6K2 on the oligomerization of ScPIP2;4, BiFC assays were conducted. ScPIP2;4-YN and ScPIP2;4-YC were co-agroinfiltrated into the leaves of N. benthamiana with or without SCMV-6K2-CFP. Confocal microscopy revealed the yellow fluorescence signal resulting from the interaction of ScPIP2;4-YN with ScPIP2;4-YC (Fig. 5E). However, the ratio of the yellow fluorescence signal to the red fluorescence signal of HDEL-mCherry was significantly decreased in the presence of SCMV-6K2-CFP compared with that without SCMV-6K2-CFP (Fig. 5, E and F). To investigate the influence of SCMV-6K2 on the oligomerization of ScPIP2;4 at the protein level, we performed Co-IP assays. ScPIP2;4-c-Myc and ScPIP2;4-HA supplemented with SCMV-6K2-GFP at increasing concentrations (OD600 = 0, 0.1, 0.2, 0.3) were co-agroinfiltrated into N. benthamiana leaves. The total proteins were extracted after 72 hpa and then incubated with anti-GFP agarose. Input and IP proteins were analyzed by protein gel blot analysis with anti-GFP, HA, or c-Myc antibodies. The results showed that ScPIP2;4-HA clearly decreased with increasing SCMV-6K2-GFP (Fig. 5G). The pull-down assays were also conducted to further confirm the interference of SCMV-6K2 on the self-interaction of ScPIP2;4. The results showed that ScPIP2;4-c-Myc obviously decreased with increasing SCMV-6K2-GST (Supplemental Fig. S9). These combined results demonstrated that SCMV-6K2 interfered with the oligomerization of ScPIP2;4 in a dose-dependent manner by interacting with the TM5 of ScPIP2;4.
Discussion
ROS are generated in two phases in plants upon pathogens infection (Herrera-Vásquez et al. 2015; Qi et al. 2017, 2018; Zhang et al. 2018b). The ROS generated in the early phase is apoplastic and generally mediated by RBOH (Sagi and Fluhr 2006; Qi et al. 2017, 2018; Zhang et al. 2018a, 2018b). Silencing RBOHs inhibits the accumulation of apoplastic H2O2 and impairs the resistance to several plant viruses, such as PVY, TuMV, TMV, PVX, WYMV, and Barley stripe mosaic virus (BSMV) (Doke and Ohashi 1988; Moeder et al. 2005; Király et al. 2008, 2021; Deng et al. 2016; Yang et al. 2018; Lukan et al. 2020; Otulak-Kozieł et al. 2020; Zhang et al. 2023). In some virus-plant pathogenic systems, the apoplastic ROS mediated the symptomless, extreme resistance to viruses conditioned by R genes, such as Soybean mosaic virus-soybean (Glycine max) RN-9 Rsc15 and PVX-tobacco NN Rx1 (Rui et al. 2017; Király et al. 2021). In the present study, we showed that SCMV infection significantly upregulated the expression of ScRBOHs in 2 h (Fig. 2A), while DPI treatment significantly impaired ROS generation and promoted the replication of SCMV (Fig. 2, C and D). These results indicate that apoplastic H2O2 mediates the resistance to SCMV, as demonstrated by Akbar et al. (2021a). However, the DPI treatment not fully inhibited the generation of apoplastic H2O2 (Fig. 2B). We speculated that the cell-wall peroxidase might contribute to the generation of apoplastic H2O2.
In general, the apoplastic ROS mediates resistance to pathogens, while the ROS generated in cytoplasm in the second phase show complicated roles in virus infection. For example, Brome mosaic virus (BMV) and Maize chlorotic mottle virus (MCMV) utilize ROS to establish infection (Hyodo et al. 2017; Liu et al. 2022). Cucumber mosaic virus (CMV) uses 2b to increase ROS accumulation to enhance its acquisition and transmission by vector insects (Guo et al. 2019). SCMV infection on maize induces mitochondrial H2O2 to manifest mosaic symptom (Jiang et al. 2023), which might attract aphids for virus transmission. Red clover necrotic mosaic virus (RCNMV) deploys replication protein P27 to interact with and internalize RBOHB into cytoplasm to generate ROS for infection (Hyodo et al. 2017). The detailed investigation of BSMV infection shows that silencing of RBOHB decreases the accumulation of H2O2 and O2•−, thereby promoting BSMV infection in N. benthamiana (Yang et al. 2018). BSMV employs γb to interact with glycolate oxidase to inhibit the induction of ROS in peroxisomes to enhance infection (Yang et al. 2018). However, BSMV employs γb to interact with NADPH-dependent thioredoxin reductase C to disrupt chloroplast antioxidant defenses, thereby creating an oxidative microenvironment conducive to viral replication (Wang et al. 2021b). Therefore, the roles of ROS in virus infection should be spatiotemporally dissected in the pathogenesis. It is undoubted that SCMV infection could induce the second-phase generation of ROS. We speculate that the apoplastic H2O2 might be sensed by the PM receptor HCPA1 (Wu et al. 2020) and cooperate with the intracellular ROS to manipulate SCMV infection on sugarcane plants.
Bacterial or fungal pathogens were found to target PIP to interfere with apoplastic H2O2 transport into cytoplasm to establish infection (Tian et al. 2016; Wang et al. 2018, 2021a; Li et al. 2019; Zhang et al. 2019a, 2022a; Ai et al. 2021; Lu et al. 2022). The NIa of Tobacco etch potyvirus (TEV) was shown to interact with AtPIP2;7 by AP-MS (Martínez et al. 2016); however, no further study reported. In the present study, we demonstrated that ScPIPs were differentially expressed upon SCMV infection (Fig. 1), and only ScPIP2;1 and ScPIP2;4 among the eight ScPIPs are capable of H2O2 transport (Fig. 3), indicating their roles in signal transduction or the immune response mediated by H2O2. We also demonstrated that TM2 and TM5 are required in the oligomerization of ScPIP2;4 (Fig. 5), subsequently the activity of ScPIP2;4 in H2O2 transport (Supplemental Fig. S6), which is similar to previous reports (Yoo et al. 2016; Bienert et al. 2018; Wang et al. 2020). PIP oligomerization generally occurs in the ER (Zelazny et al. 2007; Sorieul et al. 2011), which is a prerequisite for PIP tetramers trafficking to the PM and water permeability (Yoo et al. 2016). Here, we showed that ScPIP2;4 self-interaction mainly occurred on the PM (Fig. 4A; Supplemental Fig. S5B). Because the transport efficiency of PIP1–PIP2 heterotetramers is higher than that of PIP2 homotetramers (Jozefkowicz et al. 2016), we speculate that ScPIP2;4 might tetramerize with some ScPIP1 to gain higher efficiency in H2O2 transport. We further demonstrated that SCMV-6K2 interacted with ScPIP2;4 via TM5 and impaired the oligomerization of ScPIP2;4 in a dose-dependent manner (Fig. 5). Thus, the tetramerization of ScPIP2;4 was inhibited, thereby the transport of extracellular H2O2 into the cytoplasm was significantly impaired (Fig. 4, C and D). Considering these findings, we propose a hypothetical model for SCMV infection (Fig. 6). In this model, SCMV infection in sugarcane induces the immune response, including the upregulated expression of RBOHD and the subsequent production of apoplastic H2O2. The expression of ScPIP2;4 is also induced, and the homo or heterotetramerization of ScPIP2;4 occurs. The ScPIP2;4 tetramers translocate to the PM to transport apoplastic H2O2 into the cytoplasm and thus inhibits the replication of the SCMV genome. To counteract the host immune response, SCMV employs 6K2 to interact with the TM5 of ScPIP2;4, thereby impairing oligomerization, i.e. tetramerization of ScPIP2;4, or the PM localization of oligomerized ScPIP2;4, subsequently impairing the import of apoplastic H2O2 to facilitate virus infection.
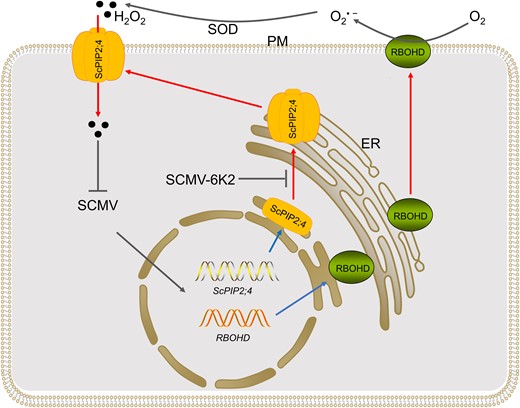
Schematic diagram of SCMV antagonises host resistance by employing 6K2 to impair ScPIP2;4 transport of H2O2 to facilitate virus infection. SCMV infection induces the expression of RBOHD and ScPIP2;4. Apoplastic H2O2 is generated by the RBOHD coupled with SOD. The homo- or hetero-tetramerization of ScPIP2;4 occurred in ER. Then the ScPIP2;4 tetramer translocates to PM to transport apoplastic H2O2 into the cytoplasm to inhibit the replication of SCMV genome. To antagonise the host resistance mediated by H2O2, SCMV employs 6K2 to interact with ScPIP2;4 via the TM5, thereby interfering with the oligomerization and or the PM localization of ScPIP2;4, subsequently impairing the transport of apoplastic H2O2 into cytoplasm. Black arrows indicate promoting effects. Blue arrows indicate transcription or translation. Red arrows indicate translocation. Curved arrows indicate the direction of electrons transfer. Blunt arrows indicate inhibiting effects. Abbreviations: ER, endoplasmic reticulum; PM, plasma membrane; RBOH, RESPIRATORY BURST OXIDASE HOMOLOG; SCMV, Sugarcane mosaic virus; SOD, superoxide dismutase.
SCMV-6K2 interacts with all ScPIPs (Supplemental Fig. S3). The structure of 6K2 protein is conserved among the viruses in Potyviriade. All 6K2 proteins are 53 amino acids in length and are single transmembrane proteins (Zhang et al. 2019b). We demonstrated that the 6K2 of TuMV could interact with AtPIP1;4 and AtPIP2;2 (Supplemental Fig. S5), which have been evidenced to be capable of H2O2 transport (Bienert and Chaumont 2014; Tian et al. 2016). As silencing of RBOHD in Arabidopsis contributes to TuMV infection (Otulak-Kozieł et al. 2020), which indicates the apoplastic ROS are involved in resistance to TuMV, we speculate that the interaction of TuMV-6K2 with AtPIP1;4 or AtPIP2;2 might interfere the transmembrane import of apoplastic H2O2 to facilitate infection. Silencing of RBOHD in potato also contributes to PYV infection (Lukan et al. 2020). Therefore, we speculate that the interaction of 6K2 with PIPs might be a general mechanism adopted by potyviruses to counteract host resistance mediated by ROS to facilitate virus infection, illuminating the long-term arms-race and coevolution between pathogens with hosts (Fraile and García-Arenal 2010; Wang 2015). Because PIPs are involved in the transport of H2O, CO2, ions, and small solutes, besides H2O2, across biological membranes (Maurel et al. 2015, 2021; Groszmann et al. 2017; Qiu et al. 2020), the extensive interaction of potyviral 6K2 with PIPs might extensively disturb the growth and development of host plants, thereby causing symptoms such as mosaic leaves, inhibited photosynthesis and retarded growth, during potyviruses infection. Manipulating the expression of PIP genes in wheat, rice, soybean, and N. benthamiana conferred the mutant plants resistance to pathogens or increases in grain yield (Zhang et al. 2018d; Li et al. 2019; Ai et al. 2021; Wang et al. 2021a; Lu et al. 2022), indicating that ScPIP2;4 might be a potential molecular target for engineering sugarcane resistance against SCMV.
Materials and methods
Plant materials, virus, and treatments
SCMV isolate was provided by the Key Laboratory of Sugarcane Biology and Genetic Breeding, Ministry of Agriculture and Rural Affairs, P. R. China. Healthy tissue-cultured plantlets were propagated from the axillary bud of Saccharum hybrid ROC22 (susceptible to SCMV) and exposed to a 14/10-h light/dark cycle at 28 °C in the greenhouse. ROC22 plantlets were individually inoculated with SCMV at the 5 to 6 leaf stage, as described previously (Xu et al. 2019; Yang et al. 2021). Mock-inoculated ROC22 plantlets with 0.01 M phosphate buffer (pH = 7.0) were used as controls. The SCMV inoculated or mock inoculated leaves were sampled at 0, 1, and 8 d post-inoculation. To verify the role of RBOHs in ROS generation upon SCMV infection, ROC22 plantlets were sprayed with 50 μmol/L DPI containing the surfactant Silwet77 (0.02%, v/v) three times per day for 9 d, with water as a control. Two days later, these plantlets were inoculated with SCMV. The SCMV inoculated or mock inoculated leaves were sampled at 3 and 7 d post-inoculation. For tissue-specific expression analysis, 10-mo-old healthy sugarcane ROC22 plants were selected. The samples included the leaf roll, +1 leaf (the youngest fully expanded leaf with a visible dewlap), +7 leaf, +3 internode, +8 internode, and root. All the plant materials were collected in triplicate, immediately frozen in liquid nitrogen, and then stored in a −80 °C refrigerator for RNA isolation. N. benthamiana plants were grown at 22 ± 0.5 °C and 70% relative humidity under a 16-h day/8-h night photoperiod in climate-controlled cabinets with illumination of 90 μmol/s/m2 generated by a fluorescent lamp.
Identification of PIPs in S. spontaneum
PIP sequences of rice and Arabidopsis were obtained from the rice genome annotation project (http://rice.plantbiology.msu.edu/) (Kawahara et al. 2013) and TAIR (The Arabidopsis Information Resource) (http://www.arabidopsis.org/), respectively. The genomic data of maize and sorghum were downloaded from the Phytozome (https://phytozome.jgi.doe.gov/pz/portal.html). The genomic data of S. spontaneum (accession number in GenBank: QVOL00000000) (Zhang et al. 2018c, 2022b) was obtained from NCBI (https://www.ncbi.nlm.nih.gov/).
An HMM profile of the MIP motif (PF00230) was obtained from the Pfam protein family database (http://pfam.xfam.org/) and used to identify putative PIPs from the maize and sorghum genome sequences through the BLASTP program with default parameters (Chaumont et al. 2001; Lawrence et al. 2013). Next, the selected sorghum PIPs were used as query sequences to perform BLASTP searches against the predicted genome database of S. spontaneum, Arabidopsis, rice, sorghum, and maize. The sequences with values <1e−5 were selected for further analysis, and the HMM profile of MIP domains was applied as the query to survey all potential proteins. The domains of all obtained MIPs were further confirmed by using the NCBI Conserved Domain Database (CDD, https://www.ncbi.nlm.nih.gov/cdd/) and manual examination.
Gene cloning and plasmid construction
Specific PCR primers of ScPIPs (Supplemental Table S3) were designed and synthesized based on the genome of S. spontaneum for cloning the ScPIP genes from sugarcane cultivar ROC22. Thirteen AtPIPs were also cloned from Arabidopsis. All primers used for plasmid construction are listed in Supplemental Table S3. For the Y2H assays, TuMV-6K2 was cloned into bait vector pBT3-STE via SfiI sites, while the PIPs from sugarcane or Arabidopsis were individually cloned into the prey vector pPPR3-N via SfiI sites. The ScPIP gene-fused prey vectors were used for the H2O2 transport assays. The pBT3-STE fused SCMV-6K2 plasmid was from our previous research (Zhang et al. 2019b). For transient protein expression and BiFC assays, all plasmids were generated using the Gateway technology, as described previously (Cheng et al. 2020). All the constructs were sequenced to ensure that they were correctly constructed.
RT-qPCR analysis
Plant samples were ground into powder in liquid nitrogen. Total RNA was extracted by using TriPure reagent (Roche, Basel, Switzerland) according to the manufacturer's instructions. The RNA concentration and quality were determined using an ND-1000 spectrophotometer (NanoVue Plus, GE, Chicago, IN, USA) and gel electrophoresis. The cDNA was synthesized by using a PrimeScript RT-PCR kit (TaKaRa, Dalian, China) according to the manufacturer's instructions. RT-qPCR was performed by using Fast Universal SYBR Green Master mix (ROX; Roche, Hercules, CA, USA) on an ABI7500 real-time PCR system (Applied Biosystems, Foster City, CA, USA). GAPDH (Iskandar et al. 2007) and eEF-1α were used as internal references (Ling et al. 2014) and three replicates were completed for each sample. A melting curve analysis was conducted to confirm the PCR specificity for each primer pair. The 2−ΔΔCt method was applied to analyze the data to determine the altered gene expression, and the results are shown as the means of three biological replicates with the corresponding standard error.
H2O2 transport
To evaluate the H2O2 transport activity of ScPIPs, the ScPIP gene constructs were individually transformed into yeast strain NMY51. The yeast transformants were cultured on SD/-Trp agar plates at 30 °C for 2 to 3 d. Then, the colonies were suspended in SD/-Trp liquid medium to an OD600 of 0.6. The yeast transformants (OD600 = 0.01) were spotted onto SD/-Trp solid medium containing different concentrations of H2O2, and the viability of the yeast cells was scored 2 to 4 d later. While the yeast transformants (OD600 = 0.1) were cultured in the SD/-Trp liquid medium containing 1.2 mM H2O2, and the viability of the yeast cells was scored 1 to 2 d later. The fluorescent probes H2DCF-DA, AR, and AUR were used to visualize and quantify the total ROS or H2O2 in yeast cells, respectively, as described previously (Tian et al. 2016).
Histochemical staining of ROS
Tissue-cultured ROC22 plantlets approximately 15 cm in height were sprayed with 50 μmol/L DPI containing the surfactant Silwet77 (0.02%, v/v) three times per day, with water as a control. Two days later, these plantlets were inoculated with SCMV, while 0.01 M phosphate buffer (pH = 7.0) mock-inoculated plantlets were used as controls. The leaves of SCMV- or mock-inoculated plantlets were sampled and incubated in the MES/KCl buffer (10 mM MES, 0.1 mM KCl, 0.1 mM CaCl2) supplemented with 0.1 mM H2DCF-DA for 30 to 40 min and were then subjected to confocal observation after rinses with MES/KCl buffer.
Transient protein expression
Agrobacterium tumefaciens strain GV3101 was used in the transient protein expression assays in N. benthamiana leaves as described previously (Cheng et al. 2020). For the co-agroinfiltration and BiFC experiments, the A. tumefaciens GV3101 suspensions were mixed at a 1:1 ratio. For the immunoblot and immunoprecipitation assays, A. tumefaciens GV1301 cells at an OD600 of 0.6 to 0.8 were used for fusion protein expression.
Protoplast experiments
N. benthamiana protoplast from the young expanded leaves of 5- to 6-wk-old plants and transfected as previously described (Yoo et al., 2007). mCherry-HDEL was used as ER marker. FM4-64 was used to stain the PM as previously described (Fischer-Parton et al. 2000).
Confocal microscopy
For confocal microscopy analysis, the plant samples or yeast cells expressing recombinant proteins or yeast cells visualized by H2DCF-DA, AR or AUR were imaged using a Leica SP8 confocal laser scanning microscope (Leica Microsystems, Germany) with an argon laser. The intensity value was set at 5% for the fluorescence excitation. YFP was excited at 514 nm, and the emitted light was captured at 530 to 590 nm with a 200 to 300 gain. CFP was excited at 442 nm, and the emitted light was captured at 450 to 500 nm with a 350 gain. mCherry was excited at 552 nm, and the emitted light was captured at 590 to 630 nm with a 350 gain. FM4-64 was excited at 550 nm, and the emitted light was captured at 610 to 650 nm with a 300 gain. In the yeast transformants, oxidized AR or AUR was excited at 543 nm, and the emitted light was captured at 585 to 610 nm with a 300 gain, while oxidized H2DCF-DA was excited at 488 nm, and the emitted light was captured at 505 to 525 nm with a 150 gain (Ashtamker et al. 2007). Images were captured digitally and processed with LSM software. The fluorescence intensity of the images was quantified using ImageJ software (http://rsbweb.nih.gov/ij/).
Y2H and BiFC assays
For Y2H assays, the split-ubiquitin DUALmembrane system (Clontech, Mountain View, CA, USA) was used as described previously (Cheng et al. 2017; Zhang et al. 2019b). Bait vector pBT3-STE and prey vector pPR3-N harboring test genes were co-transformed pairwise into the S. cerevisiae NMY51 strain. SD double dropout, SD/-Trp/-Leu, agar plates and SD quadruple dropout, SD/-Trp/-Leu/-His/-Ade, agar plates were used for the yeast cultures.
For the BiFC assays, complementary vectors containing target genes for interaction identification were co-agroinfiltrated into N. benthamiana leaves as described previously (Cheng et al. 2017, 2020). The agroinfiltrated plants were maintained under normal growth conditions for 48 to 72 h and then subjected to confocal microscopy observation.
Western blot and Co-IP assays
The infiltrated N. benthamiana leaf tissues were ground into powder in liquid nitrogen, then total proteins were extracted in protein extraction buffer (50 mM Tris-HCl, pH7.5, 150 mM NaCl, 1 mM EDTA, 0.1% (v/v) Tween 20, and 10% (v/v) glycerol) as described previously (Cheng et al. 2020). Yeast cell protein extraction was performed by using a yeast total protein extraction kit (Sangon, Shanghai, China) according to the manufacturer's instructions. Western blot assays and Co-IP assays were conducted as described previously (Cheng et al. 2020). Band density was analyzed using ImageJ software.
Pull-down assays
Equal amounts of pEarleyGate301-ScPIP2;4-c-Myc and pEarleyGate303-ScPIP2;4-HA were coagroinfiltrated into the leaves of N. benthamiana, and total protein was extracted after 48 h. The supernatant was immunoprecipitated with anti-c-Myc antibody in Protein G beads for 4 h at 4 °C. The precipitates were washed three times with IP buffer at 4 °C. Then the purified SCMV-6K2-GST protein with various amounts (0, 10, 20, and 30 μg) was added to the precipitates. After a 4-h incubation, the pull-down products were analyzed by protein gel blot analysis with anti-c-Myc, GST, and HA antibodies.
Accession numbers
Sequence data from this article can be found in the GenBank/EMBL data libraries under accession numbers (Supplemental Table S2).
Author contributions
J.X. designed the research; H.Z., Z.Y., G.C., T.L., K.A., W.J., Y.Z., G.H., and J.Z. performed the experiments; J.X., J.Z., and H.Z. analyzed data. J.X. wrote the paper.
Supplemental data
The following materials are available in the online version of this article.
Supplemental Figure S1. Phylogenetic tree analysis of PIP proteins from S. spontaneum, A. thaliana, O. sativa, S. bicolor, and Z. Mays.
Supplemental Figure S2. Relative expression of SCMV-CP in sugarcane leaves challenged by SCMV.
Supplemental Figure S3. Statistical analysis of the changes of H2O2 or ROS contents.
Supplemental Figure S4. Interaction of SCMV-6K2 with eight ScPIPs by Y2H assays.
Supplemental Figure S5. Subcellular localization of ScPIP2;4 or the interacting ScPIP2;4 s in the protoplast of N. benthamiana.
Supplemental Figure S6. Interaction of TuMV-encoded protein 6K2 (TuMV-6K2) with 13 AtPIPs from A. thaliana by Y2H and BiFC assays.
Supplemental Figure S7. Structural diagram of ScPIP2;4.
Supplemental Figure S8. Deletion of TM2 and TM5 of ScPIP2;4 impairs its capability of H2O2 transport.
Supplemental Figure S9. The dose-dependent interference of SCMV-6K2 on the self-interaction of ScPIP2;4 by the pull-down assays.
Supplemental Table S1. Primers used in this study.
Supplemental Table S2. Accession numbers of ScPIP proteins and PIP proteins from other plant species.
Supplemental Table S3. Results of allelic information prediction of PIP genes in S. spontaneum AP85-441.
Funding
This work was supported by funding from the National Key Research and Development Program of China (2021YFF1000103-8), the National Natural Science Foundation of China (31971991), and the Science and Technology Innovation Project of Fujian Agriculture and Forestry University (CXZX2018026).
References
Author notes
The author responsible for distribution of materials integral to the findings presented in this article in accordance with the policy described in the Instructions for Authors (https://dbpia.nl.go.kr/plphys/pages/General-Instructions) is Jingsheng Xu.
Conflict of interest statement. The authors declare no conflict of interest.
