


Abstract
Lysine acetylation is a conserved regulatory posttranslational protein modification that is performed by lysine acetyltransferases (KATs). By catalyzing the transfer of acetyl groups to substrate proteins, KATs play critical regulatory roles in all domains of life; however, no KATs have yet been identified in cyanobacteria. Here, we tested all predicted KATs in the cyanobacterium Synechococcus sp. PCC 7002 (Syn7002) and demonstrated that A1596, which we named cyanobacterial Gcn5-related N-acetyltransferase (cGNAT2), can catalyze lysine acetylation in vivo and in vitro. Eight amino acid residues were identified as the key residues in the putative active site of cGNAT2, as indicated by structural simulation and site-directed mutagenesis. The loss of cGNAT2 altered both growth and photosynthetic electron transport in Syn7002. In addition, quantitative analysis of the lysine acetylome identified 548 endogenous substrates of cGNAT2 in Syn7002. We further demonstrated that cGNAT2 can acetylate NAD(P)H dehydrogenase J (NdhJ) in vivo and in vitro, with the inability to acetylate K89 residues, thus decreasing NdhJ activity and affecting both growth and electron transport in Syn7002. In summary, this study identified a KAT in cyanobacteria and revealed that cGNAT2 regulates growth and photosynthesis in Syn7002 through an acetylation-mediated mechanism.
Introduction
Cyanobacteria (blue–green algae) are a diverse group of gram-negative bacteria that can conduct plant-like oxygenic photosynthesis (Johnson 2006; Nozzi et al. 2013) and exist in almost every habitat due to their ability to survive in extreme environments (Bullerjahn and Post 2014). Cyanobacteria are thought to be the evolutionary ancestors of chloroplasts in land plants and contribute to more than half of all global biomass (Martin et al. 2002; Deusch et al. 2008; Hofer 2013). Recently, cyanobacteria have attracted considerable interest due to their potential as an environmentally sustainable resource for producing clean and renewable biofuels (Nozzi et al. 2013). Synechococcus PCC 7002 (hereafter referred to as Syn7002) is a fully sequenced unicellular cyanobacterium that has been used extensively as a model organism for studying photosynthesis and biofuel development (Frigaard 2004). Consequently, the mechanisms governing photosynthetic processes and stress responses in Syn7002 have been an area of intense investigation in the past decade.
Increasing evidence has indicated that protein posttranslational modifications (PTMs) play crucial roles in regulating photosynthetic processes in cyanobacteria (Xiong et al. 2017) and plants (Grabsztunowicz et al. 2017). Lysine acetylation is an important regulatory PTM that controls photosynthesis, metabolic processes, and stress responses (Xiong and Guan 2012; Xie et al. 2018; Hu et al. 2019). In eukaryotes, lysine acetylation has been studied intensively and is known to regulate diverse cellular processes (Zhao et al. 2010; Verdin and Ott 2015). Increasing evidence shows that lysine acetylation plays critical roles in regulating key metabolic enzymes in Arabidopsis (Arabidopsis thaliana) (Finkemeier et al. 2011; Wu et al. 2011; Gao et al. 2016). Recent studies have provided insights into the functions and mechanisms of lysine acetylation in bacteria (Macek et al. 2019). For instance, a global survey of lysine acetylation in several model bacteria demonstrated diverse functional roles (Christensen et al. 2019; Macek et al. 2019). Previously, we identified 802 acetylated proteins in Syn7002 and demonstrated that the acetylation of the photosystem II (PSII) manganese–stabilizing protein (PsbO) can negatively regulate oxygen evolution in Syn7002 (Chen et al. 2017); however, the enzymes that govern reversible lysine acetylation remain largely unknown.
Lysine acetylation occurs either chemically (nonenzymatically) or enzymatically (Christensen et al. 2019). Chemical acetylation occurs via an autocatalytic mechanism involving the nonenzymatic donation of an acetyl group from acetyl phosphate (AcP) or acetyl coenzyme A (AcCoA) to a protein substrate (Wang et al. 2017; Burckhardt and Escalante-Semerena 2020), whereas during enzymatic acetylation, lysine acetyltransferases (KATs) transfer an acetyl group from AcCoA to a target protein (AbouElfetouh et al. 2015; Dash and Modak 2021). The KATs can be divided into 3 major families: p300/CBP (CREB-binding protein), GNAT (Gcn5-related N-acetyltransferase), and MYST (named after founding members MOZ, Ybf2, Sas2, and Tip60), all of which acetylate histone and nonhistone substrates (Drazic et al. 2016; Christensen et al. 2019). The p300/CBP and MYST families are found only in eukaryotes, whereas the GNAT family is highly conserved in all domains of life (Starai and Escalante-Semerena 2004; Marsh et al. 2005; Vetting et al. 2005). Most of the known prokaryotic KATs so far belong to the GNAT family (Christensen et al. 2019). A prokaryotic KAT, known as Pat, was discovered in Salmonella enterica, where it inactivates AcCoA synthetase (ACS) by acetylating a conserved lysine residue in its active site (Starai and Escalante-Semerena 2004), thereby modulating the virulence of bacterial pathogens (Ren et al. 2017; Sang et al. 2017). Pat is also conserved in many other bacterial species and plays functional roles in enzyme activity (Vergnolle et al. 2016; Burckhardt and Escalante-Semerena 2020), protein stability (Liang et al. 2011; Song et al. 2016), stress responses (Lima et al. 2011; Ma and Wood 2011), and cellular metabolism (Carabetta and Cristea 2017; Narita et al. 2019). In Escherichia coli, YfiQ (peptidyl-lysine N-acetyltransferase) has been the only known KAT for a long time (Castano-Cerezo et al. 2011); however, 4 enzymes with robust KAT activity (RimI, YiaC, YjaB, and PhnO) were recently identified using an acetylation-deficient E. coli strain devoid of an acetyl donor (AcP), a KAT (YfiQ), and a deacetylase (CobB, protein–lysine deacetylase) (Christensen et al. 2018). In land plants, several putative KATs have been reported (Pandey et al. 2002; Wang et al. 2021), and the functions of KATs in Arabidopsis have been well characterized (Giglione and Meinnel 2021; Zheng et al. 2021a, b; Wang et al. 2022; Xia et al. 2022). In Arabidopsis, 8 plastid-associated GNAT enzymes were identified, and 6 of which exhibited both N-terminal acetylation and lysine acetylation activities (Bienvenut et al. 2020). Among them, the Arabidopsis GNAT2 can regulate the acetylation level of several specific chloroplast proteins and dynamically reorganize the photosynthetic state transitions (Koskela et al. 2018; Giglione and Meinnel 2021; Saura-Sanchez et al. 2023). In addition, the histone acetyltransferase has been shown to be a potential mechanism responsible for stress response in plants (Hu et al. 2015; Zheng et al. 2019, 2021a, b; Wang et al. 2022). Although we identified a lysine deacetylase (KDAC; cddA) in Syn7002 and revealed its function in the regulation of metabolic processes (Liu et al. 2020), KATs remain poorly characterized in prokaryotes, and no KATs have been reported in cyanobacteria.
In this study, we identified 16 predicted KATs in the Syn7002 genome using bioinformatic analyses and tested these KATs using an acetylation-deficient E. coli strain devoid of all known acetylation mechanisms (Christensen et al. 2018). We demonstrated that A1596 can catalyze lysine acetylation in NAD(P)H dehydrogenase J (NdhJ) to regulate its enzymatic activity in vivo and in vitro, which may underlie changes in cell growth and photosynthetic electron transport (PET). The discovery of a KAT in cyanobacteria will improve our understanding of the mechanisms underlying extensive lysine acetylation in cyanobacteria, as well as the mechanisms that regulate photosynthesis in photosynthetic organisms.
Results
Characterization of KATs in Syn7002
Lysine acetylation is a dynamic PTM that is regulated by KAT and KDAC (Fig. 1A). Previously, we identified and functionally characterized a cyanobacterial KDAC (cddA) (Liu et al. 2020). To identify potential KATs responsible for protein acetylation in cyanobacteria, we performed genome analysis and demonstrated that acetyltransferases are widely distributed and evolutionarily conserved across representative cyanobacteria (Fig. 1B; Supplemental Fig. S1 and Data Set 1). The Synechococcus genus accounted for a large proportion of these enzymes, and 16 putative acetyltransferases were discovered in Syn7002, most of which contained highly conserved acetyltransferase domains (Fig. 1C) (Vetting et al. 2005; Favrot et al. 2016). By performing domain analysis, we classified these enzymes into 3 protein families: GNAT family, bacterial transferase hexapeptides, and other uncharacterized transferases (Supplemental Table S1). Since GNAT family acetyltransferases represent the largest group of protein acetyltransferases in prokaryotes (Christensen et al. 2019), it is unsurprising that they also constitute the largest group of acetyltransferases (11) in cyanobacteria.
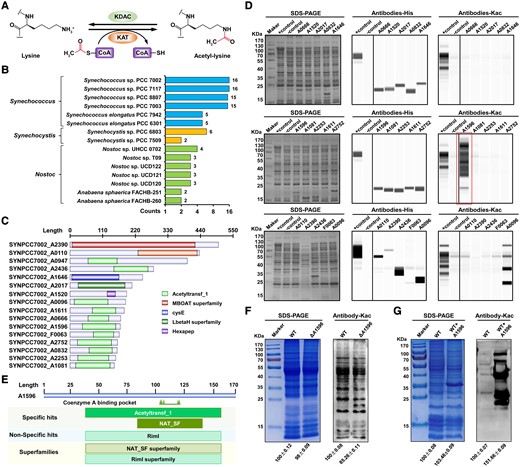
Identification of putative acetyltransferases in Syn7002. A) Protein lysine acetylation and deacetylation reactions catalyzed by KAT and KDAC. B) Comparison of putative KATs in Syn7002 with other representative cyanobacterial homologs. C) Domain analysis of putative KATs. D) Lysine acetylation levels in acetylation-deficient E. coli strains overexpressing predicted KATs in Syn7002. As a negative control, the E. coli strain was transformed with the pCA24n vector control. As a positive control, an isogenic strain retaining the WT acs allele (Δpta yfiQ cobB) was transformed with pCA24n containing yfiQ. Coomassie blue–stained SDS–PAGE gels were used to ensure equivalent loading (left panels). Protein expression of potential KATs and global lysine acetylation were analyzed using automated western blotting with anti-His (middle panels) or antiacetyl lysine antibodies (right panels). The same control (+, −) was used for the upper and middle rows of both anti-His (middle panel) and antiacetyl lysine antibodies (right panel). The box indicates that A1596 has a strong acetyltransferase signal. E) Structural alignment of A1596 in Syn7002. F) Lysine acetylation levels of protein lysates from WT and ΔA1596 strains analyzed using antiacetyl lysine antibody. G) Lysine acetylation levels of protein lysates after incubation with purified A1596 protein analyzed using antiacetyl lysine antibody. Densitometry analysis was performed using ImageJ software. Samples were standardized by comparison with Coomassie blue–stained gels.
To investigate whether these predicted enzymes possessed KAT activity, we constructed acetylation-deficient E. coli strains overexpressing each of the predicted enzymes (Christensen et al. 2018). Because the construction of the A0947-expressing strain was unsuccessful, we disrupted this gene by inserting a kanamycin resistance gene and confirmed the ΔA0947 mutant using PCR (Supplemental Fig. S2A). Western blot analysis showed that ΔA0947 exhibited a similar acetylation abundance to the wild-type (WT) strain, suggesting that A0947 did not possess KAT activity (Supplemental Fig. S2B). As shown in Fig. 1D, western blot analysis using anti-His-tag antibody confirmed that the remaining 15 predicted enzymes were overexpressed in E. coli. When we compared the lysine acetylation levels of whole cell lysates from these strains to negative and positive controls using antiacetyl lysine antibody (Fig. 1D), A1596 showed the strongest acetylation, suggesting that A1596 is a potential KAT. Therefore, we performed conserved domain and amino acid sequence alignment analysis to explore the structural features of A1596. Interestingly, A1596 exhibited poor sequence similarity with known prokaryotic KATs (Supplemental Fig. S3A and Data Set 1) despite containing multiple substrate binding sites and belonging to multiple acetyltransferase superfamilies (Fig. 1E). As expected, A1596 showed homologous to plant GNAT family acetyltransferases (Supplemental Fig. S3B and Data Set 1), and evolutionary analysis suggested that A1596 was conserved in plants, showing 48% sequence similarity with Arabidopsis GNAT2 (Supplemental Fig. S4 and Data Set 1).
To confirm whether A1596 acts as a KAT in Syn7002, we disrupted A1596 by inserting a chloramphenicol resistance gene (Supplemental Fig. S5A), and the generated ΔA1596 mutant was confirmed using PCR (Supplemental Fig. S5B). We then compared global lysine acetylation levels between WT and ΔA1596 strains using pan antiacetyl lysine antibody, finding that the acetylation levels of all proteins were substantially decreased in the ΔA1596 strain (Fig. 1F). Next, we overexpressed and purified the A1596 protein and incubated it with whole cell lysates from Syn7002. Western blot analysis revealed that lysine acetylation signals increased in numerous protein bands, confirming that A1596 can catalyze lysine acetylation in different Syn7002 proteins in vitro (Fig. 1G). Together, these in vivo and in vitro analyses demonstrate that A1596 is an enzyme with KAT activity in Syn7002. We therefore used the nomenclature (GNAT1-10) which has been recently introduced in Arabidopsis to name A1596 as cyanobacterial GNAT (cGNAT2) (Bienvenut et al. 2020).
Structural and mutational analysis of cGNAT2
To elucidate the potential catalytic mechanism of cGNAT2, we choose to use AlphaFold2 for structure prediction (Liao et al. 2021), which has been widely used to accurately predict protein structures (Varadi et al. 2022). We obtained a high-confidence homodimeric structure for cGNAT2, consisting of 7 β-sheets and 4 α-helices (Fig. 2A). Within the core cGNAT2 fold, 5-stranded parallel β-sheets (1 to 5) formed a twisted plain surrounded by 4 α-helices (Supplemental Fig. S6A). In particular, β-sheets 4 and 5 create a cleft with the surrounding α-helices 3 and 4 on one side of the generated plain, which could form a tube-like pocket for binding AcCoA.
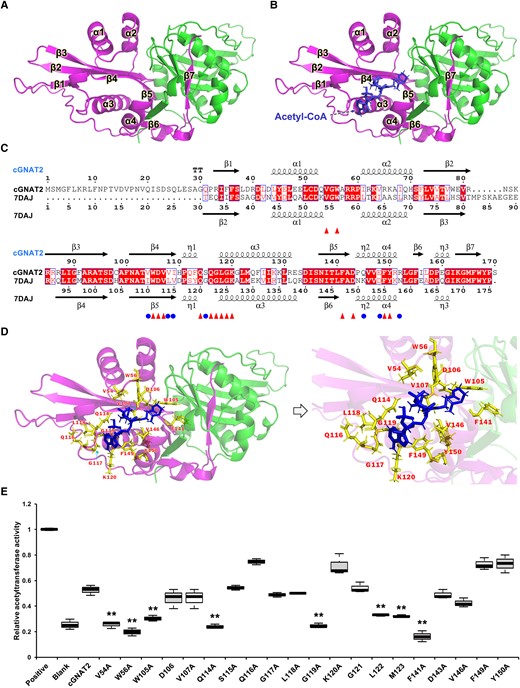
Structural simulation and catalytic activity of cGNAT2. A) Overall structure of cGNAT2 protein. Structural simulation was performed using AlphaFold2 software. The homodimeric structure is colored in magenta and green. B) Overall structure of cGNAT2 with the AcCoA ligand. The possible AcCoA binding region in cGNAT2 was predicted using MOE MD software. AcCoA was shown as a stick model. C) Structure-based sequence alignment of cGNAT2 with O. sativa acetyltransferase (7DAJ). Catalytic sites in 7DAJ are shown as circles. Identical residues between the 2 proteins are shown as triangle symbols. Alignment was performed using ESPript 3. Secondary structural elements are indicated as α, β, and η (310 helix). D) Putative catalytic residues in cGNAT2. Potential key residues are shown as sticks. E) In vitro enzymatic activity of cGNAT2. The catalytic activities of WT and mutant cGNAT2 were measured using KAT activity assays. In the boxplots, the bottom and top of the plot represent the lower and upper quartiles, respectively. The box limits inside represent the interquartile range, with the median indicated by a line. The whiskers on both ends represent the minimum and maximum values of the data. Data represent the mean ± Sd of 3 independent experiments. Statistical significance was determined using 2-sample Student's t tests (**P < 0.01).
To test this hypothesis, molecular docking (MD) simulations were performed to identify the binding region between cGNAT2 and AcCoA. First, we performed structural alignment by submitting the 3D structure of cGNAT2 to the Protein Data Bank (PDB) data set to identify a structural homolog using the Dali server (Holm 2022). Consistent with the conservation analysis findings, the best aligned hit was serotonin N-acetyltransferase (SNAT) from Oryza sativa (O. sativa), which had 5 crystal structures (7DAI, 7DAJ, 7DAK, 7DAL, and 6K5M; Supplemental Data Set 2). After filtering the structure without the AcCoA ligand, we found that cGNAT2 had a similar structure to 7DAJ, which possesses an AcCoA binding pocket (Supplemental Fig. S6B) (Liao et al. 2021). To exclude false positives in the MD simulation, the AcCoA binding region was restricted within the twisted plain and the surrounding α-helices (3 and 4) of the cGNAT2 structure by comparing its 3D structure with the obtained complex (7DAJ). As expected, the best simulated regions were formed by β4–β5 and α3–α4, which showed structural similarities to the O. sativa SNAT complexed with its AcCoA ligand (Fig. 2B). Additionally, the plastid-localized GNATs (GANT1-10) have also been identified in Arabidopsis. Sequence alignment analysis revealed that a number of residues were conserved across all Arabidopsis GNATs, forming an acetyl-CoA binding domain, called “P-loop like” sequence pattern (Bienvenut et al. 2020). Although the Arabidopsis GNATs possessed 2 AcCoA binding domains, the most conserved one was typically located at the N-terminus of the α3-helix, with a conserved consensus pattern: [RQ]xxG[LIMV][AG]xx[LIMVF][LIMV] (Bienvenut et al. 2020). It is noteworthy that this similar consensus pattern can also be found in cGNAT2, which is located at the N-terminus of the α3-helix (Supplemental Fig. S7A). Together, these observations indicate that the cGNAT2 binding pocket may be required for AcCoA recruitment to acetylate substrate lysine residues.
Considering the similar positioning and binding modes of AcCoA in cGNAT2 and 7DAJ, we performed structure-guided sequence alignment to assess potential binding sites and observed a number of conserved amino acid residues that have been reported to be involved in recognizing AcCoA in 7DAJ (Fig. 2C) (Liao et al. 2021). Two conserved amino acid residues (V54 and W56) were located in the coil regions between helices α1 and α2, while the remaining 14 were primarily located in the potential binding pocket, which includes β4–β5 and α3–α4 (Fig. 2C). Tertiary structure analysis revealed that these amino acid residues could form a cave region adjacent to AcCoA (Fig. 2D). Since sequence alignment analysis suggested that several amino acid residues are highly conserved in Arabidopsis GNATs and other plants (Supplemental Fig. S7), indicating a potential functional role in AcCoA binding, we constructed site-specific mutations by substituting these amino acids with alanine (A) in purified WT cGNAT2. Mutations in residues V54, W56, W105, Q114, G119, L122, M123, and F141 resulted in a clear decrease in KAT activity compared to WT cGNAT2 (Fig. 2E). Six of these residues (V54, W56, W105, L122, M123, and F141) are nonpolar hydrophobic amino acids, suggesting the existence of hydrophobic interactions between these residues and AcCoA, as described previously (Liao et al. 2021). Together, our findings indicate that cGNAT2 possesses a large active pocket for AcCoA binding and 8 residues (V54, W56, W105, Q114, G119, L122, M123, and F141) that are essential for its catalytic activity.
cGNAT2 deletion affects Syn7002 growth and AcCoA content
To explore the functions of cGNAT2 in Syn7002, we examined the growth of WT and ΔcGNAT2 strains under different photoautotrophic conditions. As shown in Fig. 3A, the loss of cGNAT2 decreased the growth rate under normal light (NL, 250 μmol photons/m2/s), and the ΔcGNAT2 strain grew much more slowly than the WT strain under continuous low light (LL, 50 μmol photons/m2/s) and high light (HL, 2,000 μmol photons/m2/s) conditions (Supplemental Fig. S8, A and B). Thus, cGNAT2 may play an important role in light acclimation in Syn7002.
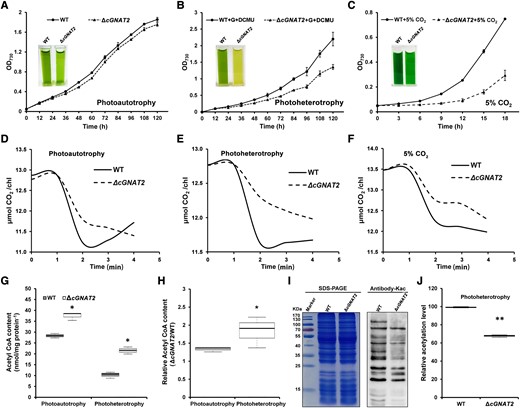
Effects of cGNAT2 deletion on growth and AcCoA content in Syn7002. Growth curves of WT and ΔcGNAT2 strains under photoautotrophy A), photoheterotrophy (G represents glycerol) B), and high CO2C) conditions. Data represent the mean ± Sd of 3 independent experiments. D to F) CO2 exchange profiles of the WT and ΔcGNAT2 strains under different growth conditions. Cells were suspended in 15 mL of 50 mM HEPES–NaOH buffer (pH 7.5) to final concentration 5.5 μg Chl/mL, and measurements were performed at 20 °C with light intensity of 950 μmol photons/m2/s. Data represent the mean ± Sd of 3 independent experiments. G, H) AcCoA content in WT and ΔcGNAT2 strains under photoautotrophy and photoheterotrophy conditions. I, J) Lysine acetylation in WT and ΔcGNAT2 strains under photoheterotrophy. Densitometry analysis was performed using ImageJ software. Samples were standardized by comparison with Coomassie blue–stained gels. In the boxplots, the bottom and top of the plot represent the lower and upper quartiles, respectively. The box limits inside represent the interquartile range, with the median indicated by a line. The whiskers on both ends represent the minimum and maximum values of the data. Data represent the mean ± Sd of 3 independent experiments. Statistical significance was determined using 2-sample Student's t tests (*P < 0.05; **P < 0.01).
Since Syn7002 can utilize glycerol as an organic carbon source to support photoheterotrophic growth in the presence of DCMU, which blocks PET from PSII to the plastoquinone pool (Hendry et al. 2016), we measured the growth of Syn7002 cells under photoheterotrophic growth conditions. The ΔcGNAT2 strain grew slower than the WT strain under photoheterotrophic growth conditions compared to photoautotrophic conditions (Fig. 3B), suggesting that cGNAT2 loss renders Syn7002 unable to utilize glycerol as an exogenous carbon source and may impair glycerol transport or catabolism. To further determine whether changes in CO2 concentration may affect photoautotrophic growth, we measured the growth of WT and ΔcGNAT2 strains under high CO2 conditions. As expected, cGNAT2 inactivation caused Syn7002 growth defects (Fig. 3C). We next sought to determine the efficiency of CO2 assimilation using gas exchange assays and demonstrated that ΔcGNAT2 strain exhibited a lower CO2 assimilation efficiency than WT strain under different growth conditions (Fig. 3, D to F). These observations suggested that the lack of cGNAT2 in Syn7002 may result in inefficient CO2 capture and fixation. Together, the inability of the ΔcGNAT2 strains to utilize a carbon source (exogenous glycerol or high CO2 concentration) indicates that cGNAT2 plays a critical role in maintaining growth under different culture conditions.
AcCoA is a metabolic intermediate that acts as an acetyl donor for protein acetylation (Wang et al. 2017; Burckhardt and Escalante-Semerena 2020); therefore, we measured AcCoA content in both WT and ΔcGNAT2 strains. The ΔcGNAT2 strain showed a remarkable increase in AcCoA content under photoautotrophic and photoheterotrophic growth conditions (Fig. 3G), while more relative AcCoA accumulation (ΔcGNAT2/WT) was observed under glycerol photoheterotrophy than under photoautotrophy (Fig. 3H). Western blot analysis further revealed that global lysine acetylation levels were clearly decreased in whole cell lysates from ΔcGNAT2 (Fig. 3, I and J), consistent with the findings under photoautotrophy. Together, these findings suggest that cGNAT2 deletion may reduce acetylation abundance and carbon source utilization while increasing excess AcCoA accumulation in Syn7002, which may explain the observed decrease in acetylation levels and defective growth of the ΔcGNAT2 strain under different culture conditions.
cGNAT2 regulates electron transport in Syn7002
Previous studies have demonstrated that the plastid KAT, located in the chloroplast, exhibited both N-terminal acetyltransferase and KAT activities (Dinh et al. 2015). It is also an essential component for the dynamic reorganization of thylakoid protein complexes during photosynthetic state transitions (Koskela et al. 2018). Since our findings suggested that photosynthesis and other metabolic processes could be impaired in the ΔcGNAT2 strain, we measured photosynthetic phenotypes to determine the potential biological roles of cGNAT2 in Syn7002. We found that oxygen evolution rates were lower in the ΔcGNAT2 strain than in the WT strain under LL, NL, HL, and high CO2 conditions (Fig. 4A; Supplemental Fig. S8C) and were dramatically lower in the ΔcGNAT2 strain under photoheterotrophy compared to the WT strain (Fig. 4A). When we assessed the maximal PSII photochemical efficiency (Fv/Fm), effective quantum yield of PSII (Y(II)), PSII-mediated electron transport rate (ETR(II)), and postillumination increase in chlorophyll fluorescence under these conditions, we observed the same Fv/Fm for the WT and ΔcGNAT2 strains under LL growth conditions (Supplemental Fig. S8D). However, the efficiency of the ΔcGNAT2 strain was substantially lower than that of the WT strain under NL, HL, high CO2 concentration, and photoheterotrophic growth conditions (Fig. 4B; Supplemental Figs. S8, D to F, and S9A). Similarly, the light response curves for the ETR(II) of the ΔcGNAT2 strain were markedly lower than those of the WT strain under different growth conditions (Fig. 4C). Together, these data suggest that cGNAT1 plays an important regulatory role in the oxygen evolution reaction, Fv/Fm, Y(II), and ETR(II) in Syn7002 under different culture conditions. Due to the decreased efficiency of photosynthesis in ΔcGNAT2 strain, we hypothesized that the excess electrons might be released through heat dissipation to prevent or minimize excessive damage from light energy exposure (Tsai et al. 2019; Ren et al. 2023). To test this hypothesis, we measured the nonphotochemical quenching (qN and NPQ) for the WT and ΔcGNAT2 strains under different conditions. However, we found that the qN and NPQ values, which mainly reflect the level of excess heat dissipation, were substantially higher in WT strain than those of the ΔcGNAT2 strain under photoautotrophy, photoheterotrophy, and high CO2 conditions (Supplemental Fig. S9, B and C). These data indicated that the ability of ΔcGNAT2 strain to dissipate excess light energy was weakened compared to the WT strain. Since the photosynthetic organisms, such as plants and algae, have the ability to balance energy allocation between growth and light stress response by regulating photoinhibition and photoprotection (Ruban 2016), we thus speculated that the ΔcGNAT2 strain failed to activate the photoprotection mechanism, leading to photoinhibition due to the damage to photosystem, as previously described (Ruban 2016; Zhao et al. 2022; Chen et al. 2023). To further verify this, we measured the nonphotochemical quenching for the WT and ΔcGNAT2 strains under LL and HL conditions. As expected, ΔcGNAT2 strain exhibited similar qN and NPQ values compared to the WT strain under LL condition (Supplemental Fig. S10, A and B). However, the qN and NPQ values were markedly lower in the ΔcGNAT2 strain than those of the WT strain under HL condition (Supplemental Fig. S10, C and D), suggesting the presence of photoinhibition. Based on these results, it is conceivable that loss of cGNAT2 resulted in the photoinhibition of Syn7002 under different culture conditions, owing to the dysfunction of lysine acetylation of photosynthetic proteins.
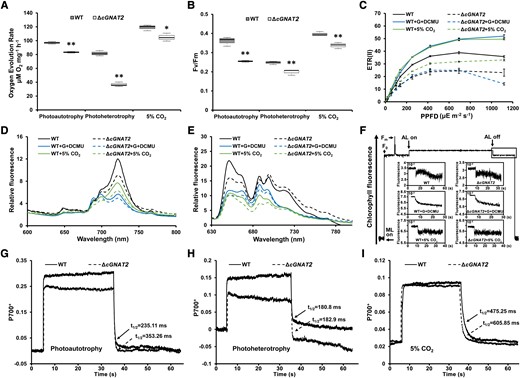
Effects of cGNAT2 deletion on electron transport in Syn7002. A, B) Oxygen evolution rates A) and Fv/Fm (maximum quantum yield) B) for WT and ΔcGNAT2 strains under different growth conditions. Data represent the mean ± Sd of 3 independent experiments. Statistical significance was determined using 2-sample Student's t tests (*P < 0.05; **P < 0.01). In the boxplots, the bottom and top of the plot represent the lower and upper quartiles, respectively. The box limits inside represent the interquartile range, with the median indicated by a line. The whiskers on both ends represent the minimum and maximum values of the data. C) ETR(II) for WT and ΔcGNAT2 strains under different growth conditions. Data represent the mean ± Sd of 3 independent experiments. D, E) Fluorescence emission spectra at 77 K for WT and ΔcGNAT2 strains under different growth conditions. Spectra were recorded at 77 K with dark-adapted whole cells excited at 430 nm D) and 590 nm E). All depicted spectra represent averages of 3 biological replicates. F) Analysis of cyclic electron flow around PSI based on transient increases in chlorophyll fluorescence detected under different growth conditions (G represents glycerol). Experiments were repeated with 3 biological replicates. G to I) P700+ oxidation–reduction kinetics for WT and ΔcGNAT2 strains in the presence of 10 μM DCMU under photoautotrophy G), photoheterotrophy H), and high CO2I) conditions. Experiments were repeated with 3 biological replicates, which gave nearly identical results. The spectrum of each P700+ redox curve represented a biological replicate per genotype.
To further investigate whether PET was affected in the ΔcGNAT2 strain, we measured low-temperature fluorescence emission spectra for each strain under different culture conditions. Clear emission peaks were observed at approximately 685 to 695 nm (related to PSII) and 720 nm (related to PSI), with an excitation wavelength of 430 nm to excite chlorophyll. All emission peaks were substantially lower in the ΔcGNAT2 strain than in the WT strain (Fig. 4D). When we excited the phycobilisome (PBS), large differences were detected between the WT and ΔcGNAT2 strains, with markedly decreased PBS (650 to 660 nm) and PSII (685 to 695 nm) emission peaks in the ΔcGNAT2 strain (Fig. 4E). These findings indicate that cGNAT2 deletion could affect PET efficiency in Syn7002.
Postillumination increases in chlorophyll fluorescence are reported to be primarily involved in PSI–cyclic electron transport (CET) (Asada 1993). Interestingly, we detected clearer chlorophyll fluorescence enhancement in the WT strain than in the ΔcGNAT2 strain under NL growth conditions after turning off the actinic light source (Fig. 4F). Under high CO2 conditions, a slight difference in chlorophyll fluorescence was observed between the WT and ΔcGNAT2 strains; however, they did not differ under other conditions (Fig. 4F; Supplemental Fig. S11), suggesting that ΔcGNAT2 may affect PSI–CET. To confirm this theory, we assessed CET activity under different growth conditions by monitoring P700+ oxidation–reduction kinetics. When dark-adaptive cells are illuminated using actinic light, P700 oxidation rapidly reaches a plateau within a few seconds. Here, we found that P700 oxidation was much faster in the WT strain and rapidly reached a higher level than in the ΔcGNAT2 strain under photoautotrophy and photoheterotrophy (Fig. 4, G and H; Supplemental Fig. S12, A to D) when treated with 10 μM DCMU, which blocks electron transfer from PSII and maintains cyclic electron flow around PSI (Huang et al. 2003; Xu et al. 2005). No substantial differences in P700 oxidation were observed between the WT and ΔcGNAT2 strains under high CO2 conditions (Fig. 4I; Supplemental Fig. S12, E and F). After switching off the light source, the P700+ reduction rate was measured using its half-life (t1/2) in the presence of DCMU. As expected, the ΔcGNAT2 strain exhibited a much slower reduction rate than the WT strain under photoautotrophic and high CO2 conditions, whereas no substantial differences were observed between the 2 strains under photoheterotrophy (Fig. 4, G to I; Supplemental Fig. S12, A to F). Thus, these data suggest that cGNAT2 plays a critical role in maintaining cyclic electron flow around PSI under photoautotrophic and high CO2 conditions.
Identification of endogenous cGNAT2 substrates using MS
Given the important functions of cGNAT2 in Syn7002, we sought to identify its endogenous substrates and acetylation sites by comparing relative lysine acetylation abundance between the WT and ΔcGNAT2 strains using acetyl lysine enrichment and a label-free quantitative (LFQ) acetylome strategy (Fig. 5A). Of the 2,623 proteins detected using proteome analysis, 2,508 were identified with at least 2 unique peptides, representing over 79% of the putative Syn7002 proteome (Supplemental Fig. S13A and Data Set 3). A total of 2,418 proteins were quantified based on the presence of at least 3 biological replicates for one comparison with a high degree of correlation (average r = 0.974; Supplemental Fig. S13B and Data Set 4). Enrichment-based LFQ acetylome analysis identified 5,114 acetylation sites within 1,580 proteins (49.6% of the putative proteome), implying that many proteins contained multiple acetylation sites (Fig. 5B; Supplemental Data Set 5). A total of 5,097 sites with a localization probability value ≥ 0.75 were identified as class I acetylation sites, while 4,911 sites were quantified in at least 3 biological replicates for one comparison with a high reproducibility (average r = 0.898; Fig. 5B; Supplemental Fig. S14A and Data Set 6). The average acetylated site score for the localization was 113.95, and median score was 105.09, indicating that the peptides identified from the MS data were of high quality (Supplemental Fig. S14B). Further analysis of the distribution of acetylation sites per identified protein revealed that the majority of the identified proteins (1,037) contained at least 2 acetylation sites (Supplemental Fig. S14C). To clarify which acetylation sites were regulated by cGNAT2, we applied stringent filters to quantitatively compare the WT and ΔcGNAT2 strains (P < 0.05 and 1.2-fold decrease) after normalization to protein abundance, resulting in 813 acetylation sites on 548 proteins whose acetylation was decreased in the ΔcGNAT2 strain (Fig. 5C; Supplemental Fig. S14D and Data Set 7). The MS data and annotated spectra for the detected acetylated peptides were deposited in the publicly accessible iProX database (https://www.iprox.cn/) under the identifier IPX0005265000.
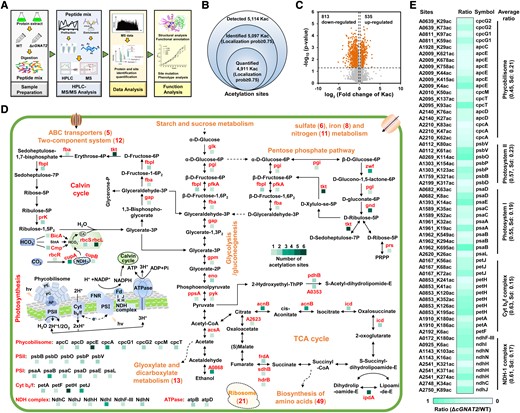
Identification of endogenous cGNAT2 substrates in Syn7002. A) Flowchart illustrating the analytical procedure for LFQ analysis of the proteome and acetylome in Syn7002. B) Venn diagram showing the number of identified acetylation sites in Syn7002. C) Volcano plot showing P values (-log10) versus the fold changes (log2) for all quantified acetylation sites between WT and ΔcGNAT2 strains. Acetylation sites with P < 0.05 and fold change > 1.2 were considered differentially expressed. D) Schematic illustration of cGNAT2-regulated lysine acetylation events involved in photosynthesis and metabolism in Syn7002. E) Heatmap showing cGNAT2-regulated acetylation sites involved in photosynthesis in Syn7002. Statistical was determined using 2-sample Student's t tests (*P < 0.05; **P < 0.01).
Functional characterization of cGNAT2 substrates
To explore the functions of the identified cGNAT2-acetylated proteins, we performed gene ontology (GO) functional annotations. The majority of the hypoacetylated proteins were associated with metabolic processes (357; Supplemental Fig. S15 and Data Set 8A), consistent with increasing evidence that lysine acetylation is an important mechanism for regulating cellular metabolism in photosynthetic organisms (Wu et al. 2011; Mo et al. 2015; Xiong et al. 2016; Chen et al. 2017; Xie et al. 2018). Since Syn7002 is a model organism for photosynthesis studies, 43 proteins were classified as electron transport proteins (Supplemental Fig. S15 and Data Set 8A). In addition, we observed that several hypoacetylated proteins were involved in biological regulation, response to stimuli, and signaling, suggesting that they may play a role in stress responses (Supplemental Fig. S15 and Data Set 8A). Molecular function analysis showed that more than half of the hypoacetylated proteins were related to catalytic activity and binding to various targets (Supplemental Fig. S15 and Data Set 8A), indicating that they may act as enzymes in metabolic pathways and be involved in the recruitment of target proteins. With respect to subcellular localization, most annotated proteins (∼63%) resided in the cytoplasm (Supplemental Fig. S15 and Data Set 8B), consistent with the finding that many of these proteins were involved in metabolism.
GO and pathway enrichment analysis revealed that the most overrepresented biological process GO term was metabolic processes (P = 2.34E−06; Supplemental Fig. S16 and Data Set 9), in accordance with the functional classification. Since excess AcCoA was observed in the ΔcGNAT2 strain, it is unsurprising that many hypoacetylated proteins were significantly enriched in AcCoA metabolism (P = 7.32E−04; Supplemental Fig. S16 and Data Set 9). Further enrichment was observed in biological processes associated with the metabolic processes of glucose (P = 7.58E−04), hexose (P = 1.02E−03), pyruvate (P = 2.40E−02), TCA cycle (P = 2.40E−02), and oxidation reduction (Supplemental Fig. S16 and Data Set 9). Thus, the substrates regulated by cGNAT2 may regulate metabolic pathways in Syn7002. The hypoacetylated proteins were also overrepresented in molecular function GO terms including oxidoreductase activity (P = 2.12E−02), cofactor binding (P = 4.53E−03), and coenzyme binding (P = 2.40E−02) (Supplemental Fig. S17 and Data Set 9), further indicating that they may act as enzymes in metabolic processes. Many proteins were enriched in photosynthetic components such as the thylakoid (P = 1.97E−02), photosynthetic membrane (P = 2.15E−02), thylakoid membrane (P = 2.55E−02), and ribulose bisphosphate carboxylase complex (P = 3.00E−02), suggesting a role in photosynthesis regulation. KEGG pathway enrichment analysis showed that the most overrepresented pathway was the metabolic pathway (P = 3.71E−16; Supplemental Fig. S18 and Data Set 10). Proteins were also enriched in the ribosome (P = 7.15E−03) and carbon fixation in photosynthetic organisms (P = 3.35E−02), suggesting that cGNAT2 substrates may play important roles in protein synthesis and photosynthesis.
To obtain a global view of the cGNAT2 regulatory networks, we mapped the proteins acetylated by cGNAT2 to KEGG pathways (Supplemental Data Set 11). As expected, most of the proteins involved in metabolic pathways were hypoacetylated (Fig. 5D), consistent with previous findings in other organisms (Choudhary et al. 2014; Xia et al. 2022). For instance, a subset of enzymes related to glycolysis/gluconeogenesis, TCA cycle, pentose phosphate pathway, oxidative phosphorylation, pyruvate metabolism, glyoxylate, and dicarboxylate metabolism were found to be hypoacetylated. This may explain why the loss of cGNAT2 led to less efficient carbon source utilization, excess AcCoA accumulation, and slower growth. In addition, 25 proteins involved in sulfate (7), iron (8), and nitrogen (13) metabolism were identified as hypoacetylated (Fig. 5D; Supplemental Data Set 11), suggesting important roles in the uptake of diverse substances. Seventeen hypoacetylated proteins were involved in ABC transporters (5) and the 2-component system (12), which are crucial for environmental adaptation (Fig. 5D; Supplemental Data Set 11), indicating that these hypoacetylated proteins may mediate adaptive cellular responses, such as LL or HL adaptation (Supplemental Fig. S8). Many acetylated proteins were also associated with the biosynthesis of amino acids and ribosomes (Fig. 5D; Supplemental Data Set 11), suggesting that lysine acetylation catalyzed by cGNAT2 may regulate protein synthesis.
Proteins participating in photosynthesis accounted for a large proportion of the hypoacetylated proteins, including those related to PET, CO2 concentration, and the Calvin–Benson cycle (Fig. 5D). Therefore, it is tempting to speculate that these cGNAT2 substrates could play important regulatory roles in photosynthesis in Syn7002, consistent with previous reports that reversible lysine acetylation may be involved in photosynthesis regulation in organisms ranging from cyanobacteria to land plants (Mo et al. 2015; Chen et al. 2017; Liu et al. 2020; Xia et al. 2022). In the ΔcGNAT2 strain, lysine acetylation sites were significantly decreased in photosynthetic proteins, including the PBS, PSI complex, PSII complex, cytochrome b6/f complex, and NDH-1 complex (Fig. 5E). GO annotation analysis revealed that many of these substrates were related to the NDH-1 complex (Supplemental Data Set 8), which plays critical roles in respiration, cyclic electron flow around PSI, and CO2 uptake (Battchikova et al. 2011). Indeed, 6 NDH-1 subunits were identified as cGNAT2 substrates with a small Sd (0.17), suggesting a similar distribution of lysine acetylation in this complex. Thus, we propose that the observed biological effects of cGNAT2 may be mediated by regulating the acetylation of metabolic and photosynthetic proteins.
Analysis of cGNAT2-regulated lysine acetylation sites
The recognition of target lysine residues by the KAT is believed to be based on the position-specific sequence preference for the surrounding amino acid residues of the acetylated lysine residues (Feller 2014; Marchand and Caflisch 2015; Manickavinayaham 2019). We analyzed the local sequence context around the lysine acetylation sites by extracting 6 amino acids upstream and downstream of acetylation site. Several amino acids were substantially overrepresented at +1 position among the 5,114 identified acetylation sites, such as glycine (G), histidine (H), asparagine (N), serine (S), threonine (T), and tyrosine (Y) (Supplemental Fig. S19A). Apart from these residues, a heatmap representing the position-specific intensity against the entire proteome showed that a preference for the polar uncharged amino acid of cysteine (C) was found at multiple positions, including −5, −3, −2, and +2 to +5 positions (Supplemental Fig. S19B). Consistently, when comparing the sequence context surrounding the cGNAT2-regulated lysine acetylation sites, we detected the similar residue preferred pattern, where these amino acids were evident enriched at the same positions, especially the cysteine (C) (Supplemental Fig. S19, C and D). As a result, these data suggested that substrate recognition by cGNAT2 in the acetylation process was based upon the unique motifs.
Confirmation of cGNAT2 substrates in vivo and in vitro
By comparing the known functions of the NDH-1 complex (He and Mi 2016) with those of cGNAT2, we speculated that some physiological functions of cGNAT2 may be achieved by regulating the acetylation of the NDH-1 complex. Among the subunits of NDH-1 complex, we identified multiple subunits that underwent acetylation, and 2 specific lysine residues (K89 and K145) were identified to be acetylated in NdhJ subunit (encoded by A2750) as our previous study (Chen et al. 2017). In the present study, we identified the same lysine acetylation sites on NdhJ, and the acetylation level of K89 was significantly decreased in the absence of cGNAT2 (Fig. 5E). Previous studies have demonstrated that NdhJ is located on the hydrophilic arm of NDH-1 complex (Fig. 6A), and that the absence of NdhJ destabilizes the NDH-1 complex, thereby impairing the CET around PSI, respiratory electron transport, and CO2 uptake (He and Mi 2016). As a result, it is likely that cGNAT2 may affect photosynthesis by regulating the acetylation status of NdhJ subunit. Figure 6B shows a representative MS/MS spectrum of the acetylated peptide [ELVSFYHLLK(ac)VGDNVTDPEEVR] containing continuous b- or y-type ionic sequences, demonstrating the high quality of our MS data. Subsequent LFQ acetylation analysis revealed a substantial decrease in NdhJ lysine acetylation on K89 (0.767-fold change) in ΔcGNAT2 compared to the WT strain (Fig. 6C). To confirm whether NdhJ is a cGNAT2 substrate, we first performed in vitro lysine acetylation assays using purified NdhJ and cGNAT2 proteins. Western blot analysis revealed a strong lysine acetylation signal in the NdhJ protein after incubation with purified cGNAT2 but not in other samples (Fig. 6D), suggesting that cGNAT2 has strong KAT activity and can efficiently catalyze lysine acetylation in NdhJ.
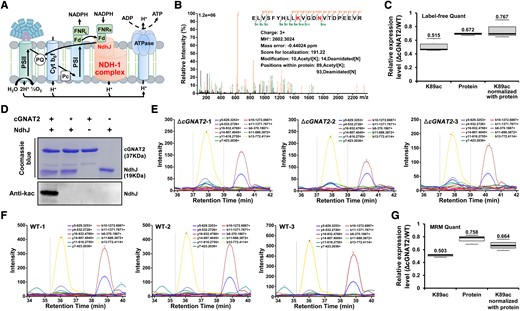
cGNAT2 catalyzes NdhJ lysine acetylation in vitro and in vivo. A) Schematic illustration of the photosynthetic electron transfer pathway catalyzed by NdhJ. B) Representative MS/MS spectrum of acetylated NdhJ peptide from quantitative acetylation data. A series of b-ions and y-ions were labeled; red letters represent modified amino acids. C) Quantification analysis of NdhJ lysine acetylation levels using LFQ acetylation data. In the boxplots, the bottom and top of the plot represent the lower and upper quartiles, respectively. The box limits inside represent the interquartile range, with the median indicated by a line. The whiskers on both ends represent the minimum and maximum values of the data. Data represent the mean ± Sd of 3 independent experiments. D) Western blot analysis of NdhJ acetylation levels after incubation with cGNAT2 analyzed using antiacetyl lysine antibody. Purified NdhJ was incubated with cGNAT2 or heat-inactivated cGNAT2 (*) in vitro at 37 °C for 2 h. Proteins were separated using SDS–PAGE and visualized using Coomassie brilliant blue staining or transferred to PVDF membranes for immunoblotting. E, F) Chromatograms representing the extracted ion chromatograms (XICs) for the representative acetylated NdhJ peptides from ΔcGNAT2E) and WT F) strains. G) Quantification analysis of NdhJ lysine acetylation levels using MRM-HR data. In the boxplots, the bottom and top of the plot represent the lower and upper quartiles, respectively. The box limits inside represent the interquartile range, with the median indicated by a line. The whiskers on both ends represent the minimum and maximum values of the data. Data represent the mean ± Sd of 3 independent experiments.
Next, we investigated whether cGNAT2 could acetylate NdhJ in vivo by measuring the endogenous acetylation status of NdhJ using high-resolution multiple reaction monitoring (MRM-HR) assays in exponentially growing WT and ΔcGNAT2 strains. The MRM-HR assay was used as it is sufficiently sensitive to quantify low-abundance peptides and accurately validate target proteins (Zhang et al. 2021) and PTMs (Dong et al. 2019). In addition to the peptide bearing the K89 acetylation site [ELVSFYHLLK(ac)VGDNVTDPEEVR], 3 other peptides without acetylation were included in the target list to quantify protein abundance using the MRM-HR assay. Although NdhJ without acetylation (ELVSFYHLLKVGDNVTDPEEVR) was not detected in our LFQ proteome analysis (Supplemental Data Set 3), we added it to our target list to estimate acetylation stoichiometry in the MRM-HR assay. Therefore, the full target list consisted of 5 peptides corresponding to NdhJ. Using this approach, we detected acetylated peptides bearing K89 acetylation sites in both the WT and ΔcGNAT2 strains, thus confirming endogenous protein acetylation. As illustrated in Fig. 6, E and F, which shows the extracted transition of the acetylated NdhJ peptide in WT and ΔcGNAT2 strains, intensity was sufficient for reliable quantification. The retention times in our MRM assay are 38, 37.8, and 37.9 min for the acetylated peptides in ΔcGNAT1 and 36, 36.1, and 36.1 min for the acetylated peptides in WT, respectively. The retention time is shifted about 0.2 min in 3 biological replicates, suggesting a high level of reproducibility between replicate data sets. Supplemental Fig. S20 depicted the peak areas and dot product (dotp) values for the identified acetylated peptide in each replicate. The dotp values for 5 acetylated peptides were more than 0.8, while one was 0.79, suggesting that the extracted ion chromatogram of acetylated peptide in our analysis is highly reliable as previously described (Roux-Dalvai et al. 2019; Han et al. 2021). After normalization, we detected a clear reduction in lysine acetylation levels in ΔcGNAT2 compared to the WT strain, indicating NdhJ hypoacetylation in the strain lacking cGNAT2 (0.664-fold change; Fig. 6G; Supplemental Data Set 12). These findings are consistent with the changes in acetylation detected using LFQ acetylation analysis (Fig. 6C) and confirm that cGNAT2 can acetylate NdhJ both in vivo and in vitro.
Based on quantitative acetylome analysis, we identified 2 hypoacetylated proteins in the carbon fixation pathway: the large subunit of the Rubisco (rbcL) and glyceraldehyde-3-phosphate dehydrogenase (GAPDH; Supplemental Fig. S21A). Representative MS/MS spectra for hypoacetylated GAPDH and rbcL peptides are shown in Supplemental Fig. S21, B to H. It is well documented that GAPDH and rbcL play crucial roles in the carbon metabolic pathway and is involved in CO2 assimilation (Douchi et al. 2019). Previous studies have demonstrated that acetylation status of rbcL may affect the Rubisco tertiary structure formation and catalytic function in Arabidopsis. Similarly, the acetylated lysine residues of GAPDH were exposed on the protein surface, affecting protein interactions and regulating enzyme activity in Arabidopsis (Finkemeier et al. 2011; Yu et al. 2011; Gao et al. 2016). Since the ΔcGNAT2 strain had less efficient carbon source utilization, we anticipated that cGNAT2 may also regulate the lysine acetylation of enzymes in the carbon fixation pathway. Therefore, we performed a series of in vitro acetylation assays and observed substantially increased rbcL and GAPDH acetylation levels after incubation with cGNAT2 compared to the heat-inactivated cGNAT2 group (Supplemental Fig. S22, A and B). Immunoprecipitation (IP) assays and western blot analysis revealed that the ΔcGNAT2 strain exhibited decreased rbcL and GAPDH lysine acetylation levels compared to the WT strain (Supplemental Fig. S22C). The functional importance of lysine acetylation in these proteins was confirmed by measuring their enzymatic activities in WT and ΔcGNAT2 strains. As shown in Supplemental Fig. S22D, Rubisco and GAPDH had significantly lower enzymatic activities in the ΔcGNAT2 strain compared to the WT strain. Taken together, these findings suggest that cGNAT2 can acetylate the rbcL and GAPDH proteins to regulate their enzyme activities in Syn7002.
cGNAT2 regulates NdhJ activity and influences photosynthesis through acetylation
To investigate the function of cGNAT2-catalyzed NdhJ acetylation, we disrupted the ndhJ gene through interposon mutagenesis and introduced site-directed mutations. Modified lysine was substituted with arginine (R) or glutamine (Q) to mimic an unacetylated (K89R) or acetylated (K89Q) status, respectively, as described previously (Chen et al. 2017). First, we assessed the effect of lysine acetylation on the enzymatic activity of NdhJ in WT and mutant strains. As shown in Fig. 7A, the ΔcGNAT2 strain exhibited significantly decreased NdhJ activity compared to the WT strain. Similarly, the K89R mutant, which mimicked an unacetylated state, had reduced enzymatic activity compared to the WT strain, whereas the K89Q mutant had identical activity to the WT strain (Fig. 7A). Due to the similar NdhJ protein expression observed in all strains (Fig. 7A), we hypothesized that cGNAT2 may regulate the enzymatic activity of NdhJ through K89 acetylation in vivo.
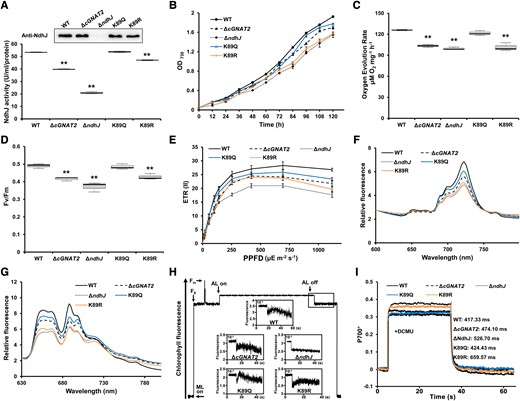
Effects of NdhJ acetylation on growth and electron transport under photoautotrophy. A) Measurement of NdhJ enzymatic activity in whole cell extracts from WT, ΔcGNAT2, and NdhJ mutant strains (ΔndhJ, K89Q, and K89R). Data represent the mean ± Sd of 3 independent experiments. Statistical significance was determined using 2-sample Student's t tests (**P < 0.01). In the boxplots, the bottom and top of the plot represent the lower and upper quartiles, respectively. The box limits inside represent the interquartile range, with the median indicated by a line. The whiskers on both ends represent the minimum and maximum values of the data. Protein expression was detected using western blot analysis with NdhJ-specific antibody. B) Growth curves of WT, ΔcGNAT2, and NdhJ mutant strains (ΔndhJ, K89Q, and K89R). Data represent the mean ± Sd of 3 independent experiments. C, D) Oxygen evolution rates C) and Fv/Fm (maximum quantum yield) for WT, ΔcGNAT2, and NdhJ mutant strains (ΔndhJ, K89Q, and K89R). Data represent the mean ± Sd of 3 independent experiments. Statistical significance was determined using two-sample Student's t tests (**P < 0.01). In the boxplots, the bottom and top of the plot represent the lower and upper quartiles, respectively. The box limits inside represent the interquartile range, with the median indicated by a line. The whiskers on both ends represent the minimum and maximum values of the data. E) ETR(II) for WT, ΔcGNAT2, and NdhJ mutant strains (ΔndhJ, K89Q, and K89R). Data represent the mean ± Sd of 3 independent experiments. F, G) Fluorescence emission spectra at 77 K for WT, ΔcGNAT2, and NdhJ mutant strains (ΔndhJ, K89Q, and K89R). Spectra were recorded at 77 K with dark-adapted whole cells excited at 430 nm F) and 590 nm G). All spectra represent the averages of 3 biological replicates. H) Analysis of cyclic electron flow around PSI based on transient increases in chlorophyll fluorescence. Experiments were repeated with 3 biological replicates. I) P700+ oxidation–reduction kinetics of WT, ΔcGNAT2, and NdhJ mutant strains (ΔndhJ, K89Q, and K89R) in the presence of 10 μM DCMU. Experiments were repeated with 3 biological replicates, which gave nearly identical results. The spectrum of each P700+ redox curve represented a biological replicate per genotype.
Since NdhJ plays an essential role in maintaining photoautotrophic growth (He and Mi 2016), we determined the growth rates of WT and mutant strains and employed ΔndhJ strain as a deficient control to evaluate the regulation and/or adaptation of photosynthesis. Consistent with the above results (Fig. 3A), the growth rate of the ΔcGNAT2 strain was slightly slower than that of the WT strain, whereas the K89Q mutant had a similar growth rate to the WT strain under photoautotrophic growth conditions (Fig. 7B). Conversely, the ΔndhJ strain grew much slower than the WT strain under photoautotrophy, consistent with previous findings (He and Mi 2016). Growth was also suppressed in the K89R mutant, which mimicked unacetylated NdhJ, similar to the ΔndhJ mutant (Fig. 7B). Thus, our findings indicate that NdhJ lysine acetylation affects Syn7002 cell growth.
To assess whether NdhJ hypoacetylation could affect photosynthesis, we measured photosynthetic phenotypes in WT and mutant strains under photoautotrophy. Compared to the WT strain, the ΔcGNAT2, ΔndhJ, and K89R mutants had severely reduced oxygen evolution rates, Fv/Fm, and Y(II), whereas the K89Q strain exhibited similar phenotypes to the WT strain (Fig. 7, C and D; Supplemental Fig. S23). The light response curves of ETR(II) were substantially decreased in the ΔcGNAT2 and ΔndhJ mutants compared to the WT strain, while the K89Q mutant exhibited a slightly decreased light response curve, and the K89R mutant had a similar pattern to the ΔcGNAT2 strain (Fig. 7E). When we investigated the electron transport efficiency of these strains based on the low-temperature fluorescence emission spectra analysis, we detected a reduction in PET efficiency in the ΔcGNAT2 and ΔndhJ mutants compared to the WT strain (Fig. 7, F and G). Mutating K89 to Q decreased fluorescence emission spectra relative to the WT strain, whereas the K89R mutant had similar spectra to the ΔndhJ strain (Fig. 7, F and G). Consistently, we detected clear postillumination increases in chlorophyll fluorescence in the WT and K89Q mutants, while chlorophyll fluorescence was slightly reduced in the K89R mutant compared to the WT strain, similar to the ΔcGNAT2 strain (Fig. 7H). Meanwhile, chlorophyll fluorescence almost completely disappeared in the ΔndhJ mutant (Fig. 7H). Additionally, we measured PSI activity in the WT and mutant strains by monitoring P700+ oxidation–reduction kinetics in the presence of DCMU (Fig. 7I; Supplemental Fig. S24). As expected, P700+ reduction rates were higher in the WT and K89Q mutant strains than in the ΔndhJ and K89R mutants, whereas the ΔcGNAT2 strain had a slightly slower rate than the WT. Together, these findings indicate that cGNAT2 may affect PET efficiency by regulating NdhJ acetylation.
NdhJ is essential for CO2 uptake in the presence of high CO2 conditions (He and Mi 2016). As expected, the ΔndhJ mutant grew poorly under high CO2 conditions, whereas the K89R mutant that mimicked unacetylated NdhJ had a similar growth rate to the ΔndhJ mutant (Fig. 8A), the K89Q mutant had a similar growth rate to the WT strain, and the ΔcGNAT2 strain grew slower than the WT strain but much faster than the ΔndhJ strain (Fig. 8A). Next, we measured the photosynthetic phenotypes of the WT and mutant strains under high CO2 conditions and detected the impaired oxygen evolution reaction, PSII photochemical efficiency, electron transport rate of PSII, and electron transport efficiency in ΔcGNAT2, ΔndhJ, and K89Q mutants (Fig. 8, B to F; Supplemental Fig. S25). Compared to the WT and K89Q strains, postillumination increases in chlorophyll fluorescence disappeared in the ΔcGNAT2 and ΔndhJ mutants and were substantially decreased in the K89R mutant (Fig. 8G). Although the P700+ reduction rates were identical in the K89Q mutant and WT strains, the remaining mutants exhibited lower reduction rates than the WT strain (Fig. 8H; Supplemental Fig. S26). Together, these data suggest that NdhJ lysine acetylation affects photosynthesis under high CO2 conditions.
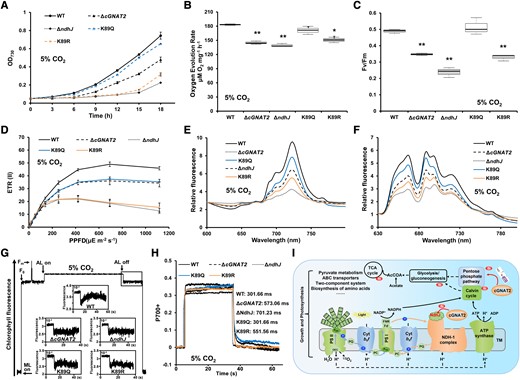
Effects of NdhJ acetylation on growth and electron transport under high CO2 conditions. A) Growth curves of WT, ΔcGNAT2, and NdhJ mutant strains (ΔndhJ, K89Q, and K89R) under 5% CO2 conditions. Data represent the mean ± Sd of 3 independent experiments. B, C) Oxygen evolution rates B) and C)Fv/Fm (maximum quantum yield) for WT, ΔcGNAT2, and NdhJ mutant strains (ΔndhJ, K89Q, and K89R) under 5% CO2 conditions. Data represent the mean ± Sd of 3 independent experiments. Statistical significance was determined using two-sample Student's t tests (*P < 0.05; **P < 0.01). In the boxplots, the bottom and top of the plot represent the lower and upper quartiles, respectively. The box limits inside represent the interquartile range, with the median indicated by a line. The whiskers on both ends represent the minimum and maximum values of the data. D) ETR(II) for WT, ΔcGNAT2, and NdhJ mutant strains (ΔndhJ, K89Q, and K89R) under 5% CO2 conditions. Data represent the mean ± Sd of 3 independent experiments. E, F) Fluorescence emission spectra at 77 K for WT, ΔcGNAT2, and NdhJ mutant strains (ΔndhJ, K89Q, and K89R) under 5% CO2 conditions. Spectra were recorded at 77 K with dark-adapted whole cells excited at 430 nm E) and 590 nm F). All spectra represent the averages of 3 biological replicates. G) Analysis of cyclic electron flow around PSI based on transient increases in chlorophyll fluorescence under 5% CO2 conditions. Experiments were repeated with 3 biological replicates. H) P700+ oxidation–reduction kinetics of WT, ΔcGNAT2, and NdhJ mutant strains (ΔndhJ, K89Q, and K89R) in the presence of 10 μM DCMU. Experiments were repeated with 3 biological replicates, which gave nearly identical results. The spectrum of each P700+ redox curve represented a biological replicate per genotype. I) Proposed model for the role of cGNAT2 in regulating growth and photosynthesis in cyanobacteria. TM, thylakoid membrane; PSI, photosynthetic system I; PSII, photosynthetic system II; PQ, plastoquinone; PC, plastocyanin; FNR, ferredoxin–NADP+ reductase; Fd−, ferredoxin.
To assess whether NdhJ hypoacetylation could affect the photoprotective role in Syn7002, we measured the nonphotochemical quenching (qN and NPQ) for the WT and mutant strains under different conditions. The ΔndhJ strain had obvious qN and NPQ values than the other strains under photoautotrophy and high CO2 conditions. The K89R mutant that mimicked unacetylated NdhJ had similar values to the ΔndhJ and ΔcGNAT2 mutant, whereas the qN and NPQ values of K89Q mutant showed similar trend with the WT strain (Supplemental Fig. S27). These observations indicate that NdhJ lysine acetylation regulated by cGNAT2 may affect the photoprotection of Syn7002.
Discussion
Previously, we identified hundreds of acetylated proteins in Syn7002 and revealed that PsbO acetylation was involved in the negative regulation of oxygen evolution (Chen et al. 2017). To better understand the function of these acetylated proteins, we aimed to identify the specific regulatory enzymes that control this modification. First, we tested all predicted KATs in Syn7002 using an acetylation-deficient E. coli strain and found that cGNAT2 had robust KAT activity in cyanobacteria (Fig. 1). We clearly demonstrated that cGNAT2 was able to add an acetyl group to a photosynthetic protein, both in vivo and in vitro (Fig. 6), while sequence alignment revealed that cGNAT2 has low similarity with other known prokaryotic KATs (Supplemental Fig. S3A). Notably, cGNAT2 was well conserved across plants and algae and showed the highest conservation with chloroplast SNAT from O. sativa (Supplemental Figs. S1, S3B, and Fig. S4). 3D structural alignment revealed that cGNAT2 shares the highest similarity with the known acetyltransferase (7DAJ) from O. sativa (Liao et al. 2021), both of which contain 7-β-chain domains and belong to the GNAT family (Fig. 2; Supplemental Data Set 2). We therefore concluded that cGNAT2 is not homologous with bacterial Pat, consistent with the notion that plant chloroplasts may have originated from cyanobacteria via endosymbiotic uptake (Martin et al. 2002; Deusch et al. 2008; Hofer 2013). Consequently, the acetylation-mediated molecular mechanism catalyzed by cGNAT2 in Syn7002 may also be applicable to plants and algae. Previous studies have revealed that mutations in 5 residues around the active pocket, including W188, D189, D226, N220, and Y233, can abolish the enzymatic activity of O. sativa SNAT (Liao et al. 2021). Here, we found that the 5 residues were conserved in cGNAT2, in addition to a conserved tryptophan (W105) (Supplemental Fig. S7), which is essential for cGNAT2 activity (Fig. 2). Therefore, it would be interesting to explore the functions and mechanisms of cGNAT2 homologs in other photosynthetic organisms.
To define potential cGNAT2 targets, we performed LFQ lysine acetylome analysis and identified 813 hypoacetylated sites on 548 proteins in the absence of cGNAT2 in Syn7002. Bioinformatics analysis suggested that many of these cGNAT2 targets are components of central metabolic and photosynthetic pathways and included 6 subunits of the cyanobacterial NDH-1 complex (Fig. 5). The NDH-1 complex is widely distributed in plants and cyanobacteria and is involved in regulating PET to protect plants from environmental stress and ensure efficient photosynthesis (Peltier et al. 2016; Hualing 2022). In cyanobacteria, the NDH-1 complex can reduce plastoquinone and use the released free energy to drive the active transport and synthesis of ATP through the biological membrane via a proton pump (Saura and Kaila 2019). In addition, the NDH-1 complex has been reported to play important roles in respiration, cyclic electron flow around PSI, and CO2 uptake (Battchikova et al. 2011). Here, the lack of cGNAT2 in Syn7002 was linked directly to photosynthesis suppression and growth retardation, suggesting that cGNAT2 could regulate lysine acetylation to affect the functions of its targets, including the NDH-1 complex. Thus, our data provide insights into the mechanisms underlying the regulation of NDH-1 complex function, which has not previously been reported.
Increasing evidence has demonstrated that PTMs play important roles in regulating the activity of the NDH-1 complex (Peltier et al. 2016). For example, NDH-1 complex activity is downregulated in Arabidopsis chloroplasts after redox modification (Courteille et al. 2013), whereas NdhF subunit phosphorylation substantially increases NDH-1 complex activity in barley (Hordeum vulgare cv. Hassan) (Martin et al. 2009) and tobacco (Nicotiana tabacum) (Lascano et al. 2003). Here, we found that the level of K89 acetylation in the NdhJ subunit of the NDH-1 complex was substantially downregulated after cGNAT2 knockout. It is accepted that the activities of many acetylated enzymes increase proportionally with increasing degrees of hydrophobicity (Maiti et al. 2012; Ali et al. 2018). Consistently, we showed that NdhJ activity was decreased in both the ΔcGNAT2 strain and the unacetylated (K89R) mutant (Fig. 7A). However, the detailed mechanisms underlying the acetylation-mediated regulation of NdhJ function in cyanobacteria remain elusive. From the perspective of NDH-1 complex structure, NdhJ and its 3 homologous subunits (NdhH, NdhI, and NdhK) form the core of the peripheral arm that corresponds to the hydrophilic segment of the NDH-1 complex (Pan et al. 2020). The loss of ndhJ leads to the disassembly of hydrophilic NDH-1 subcomplexes, ultimately influencing the CET around PSI, respiratory electron transport, and CO2 uptake in cyanobacteria (He and Mi 2016). Thus, NdhJ is essential for the stability and activity of the NDH-1 complex. Further sequence alignment analysis revealed that Syn7002 NdhJ is highly conserved across representative photosynthetic organisms (Supplemental Fig. S28), suggesting that a similar mechanism may exist in Syn7002. To test this hypothesis, we examined the crystal structure of the Syn7002 NdhJ homolog (6KHI, Thermosynechococcus vestitus; Pan et al. 2020) and found that NdhJ is located in the hydrophilic arm of the NDH-1 complex, close to the other 3 subunits (NdhH, NdhK, and NdhO; Supplemental Fig. S29A). Structural analysis further suggested that the hairpin loop of NdhJ may contact the NdhH subunit within the hydrophilic arm (Supplemental Fig. S29A), while cartoon representation also showed that the NdhJ hairpin loop was closely adjacent to the long hairpin loop of NdhH (Supplemental Fig. S29B), indicating interactions between these loops. Additionally, sequence alignment analysis revealed that K89 of Syn7002 NdhJ is conserved in T. vestitus NdhJ (K83) (Supplemental Fig. S30). In this study, cGNAT2 catalyzed K89 acetylation in NdhJ in vivo and in vitro (Fig. 6). Subsequent structural prediction of NdhJ revealed that K89, which is located on the NdhJ hairpin loop (Supplemental Fig. S31A), may form a hydrogen bond with F62 and 2 hydrogen bonds with E98 (Supplemental Fig. S31, B and C), preserving the ordered NdhJ loop structure. Since acetylation can neutralize positive charges and increase surface hydrophobicity (Es-Haghi et al. 2012; Jamil et al. 2015), K89 acetylation in NdhJ may alter charges and provide steric hindrance through the bulky acetyl group, leading to a change in the flexible hairpin loop conformation of NdhJ that alters the assembly of the hydrophilic core and the activity of the NDH-1 complex, consistent with a previous report that the loops of NDH-1 subunits have variable conformations (Pan et al. 2020).
Since lysine acetylation may modulate NdhJ conformation to regulate the assembly of the NDH-1 complex, we aimed to experimentally confirm the physiological consequences of acetylation using mutations that mimic the acetylated (Q) and unacetylated (R) forms of NdhJ, as described previously (Carabetta et al. 2019; Xu 2021). As expected, substantial decreases in chlorophyll fluorescence and P700+ redox rates were observed in the K89R mutant (Fig. 7, H and I), reflecting impaired CET around PSI. In cyanobacteria, the photosynthetic antenna absorbs light energy and transfers it to PS reaction centers via linear electron transport (LET) and CET. During steady-state photosynthesis, LET maintains the supply of ATP and NADPH at an approximate ratio, whereas CET–PSI is coupled with ATP formation without the accumulation of NADPH or other reducing substances (Munekage et al. 2004; Hualing 2022). Although the detailed mechanism through which PSI–CET regulates PSII photochemical efficiency remains unclear, ATP is known to be essential for various metabolic processes and CO2 fixation (Munekage et al. 2004; Hualing 2022). In the LET chain, the ATP/NADPH generation ratio is fixed because NADP+ reduction is coupled with proton translocation across the thylakoid membranes. Cellular processes require more ATP than NADPH, and LET cannot supply sufficient ATP to drive CO2 fixation; therefore, NDH-mediated CET produces extra ATP to satisfy the requirement for CO2 fixation and consume photoproduced NADPH (Endo et al. 1999). Since CET damage decreases ATP synthesis, further reducing the ATP/NADPH production ratio (Munekage et al. 2004; Hualing 2022), LET cannot correct the ratio, resulting in excessive NADPH accumulation and PSII photodamage due to the overreduction of stromal components (Fig. 7, C to E). The decreased fluorescence emission peaks observed in the K89R mutant indicate that PET from PBS to the PS reaction center (PSII and PSI) is impaired (Fig. 7, F and G), suggesting that K89 acetylation is involved in PET. In addition, the entire photosynthetic system of the K89R mutant was impaired under high CO2 conditions (Fig. 8). Thus, impaired electron transfer due to decreased NdhJ activity may also affect CO2 uptake in cyanobacteria. CO2 uptake is stimulated by NDH-dependent PSI CET (Ma and Mi 2008). Therefore, impaired NdhJ function may reduce ATP/NADP(H) production for CO2 fixation, resulting in reduced CO2 cycle efficiency that is exacerbated by the low CO2 affinity of the Rubisco enzyme in cyanobacteria (Peltier et al. 2016). Indeed, we detected clear decreases in the activities of the Rubisco and GAPDH enzymes in the carbon fixation pathway due to decreased lysine acetylation levels in ΔcGNAT2 cells (Supplemental Fig. S22).
Accumulating evidence has shown that protein acetylation can be regulated by AcCoA availability, either nonenzymatically or catalytically, and that AcCoA abundance fluctuates in response to both intracellular and extracellular cues, such as the loss of acetyltransferase and metabolic alterations (Pietrocola et al. 2015; Shi and Tu 2015). Given the important roles of cGNAT2 in Syn7002, it is conceivable that a lack of cGNAT2 blocks substrate acetylation, resulting in AcCoA accumulation in Syn7002 (Fig. 3E). This hypothesis is consistent with previous findings that acetylation modifications catalyzed by KAT are coupled to AcCoA fluctuations in yeast (Cai et al. 2011; Shi and Tu 2013). Additionally, the only organic carbon source reported to support the photoheterotrophic growth of Syn7002 is glycerol (Hendry et al. 2016), which can be transported into Syn7002 cells and converted into glycerol 3-phosphate by glycerol kinase before entering the glycolysis and TCA cycles rather than the oxidative pentose phosphate pathway (Hendry et al. 2016). This metabolic flux would produce substantially more AcCoA than carbon flux distribution under photoautotrophic conditions (Hendry et al. 2016). Indeed, we observed more relative AcCoA accumulation (ΔcGNAT2/WT) under glycerol photoheterotrophy than under photoautotrophy (Fig. 3F), supporting the notion that the AcCoA pool is susceptible to variations in available carbon sources (Weinert et al. 2013). Thus, we speculated that an additional exogenous carbon source may alter metabolic flux and produce excess AcCoA in Syn7002 under photoheterotrophy, further affecting photoheterotrophic growth through feedback inhibition. This may explain the reduced growth rate observed in ΔcGNAT2 cells. In the present study, the hypoacetylation sites identified in numerous photosynthetic proteins may be also involved in the regulation of photosynthesis, due to the important roles of these photosynthetic complexes in energy transfer (Sanchez-Baracaldo and Cardona 2020). For example, lysine acetylation of the subunit of PSII (PsbO) can negatively regulate oxygen evolution in Syn7002 (Chen et al. 2017). The acetylation of PSI subunit (PsaL) has an impact on the ability of Leptolyngbya ohadii to undergo state transitions (Niedzwiedzki et al. 2023). Furthermore, our previous study revealed that several photosynthetic proteins from cytochrome b6/f complex and NDH-1 complex were also identified to be acetylated, highlighting the potential role of lysine acetylation in regulating photosynthesis (Chen et al. 2017). As shown in Fig. 5D, the lysine acetylation levels of a large number of photosynthetic proteins were significantly decreased in ΔcGNAT2 strain, suggesting that cGNAT2 may affect photosynthesis of Syn7002 by modulating the lysine acetylation levels of various subunits of photosynthetic complexes. Based on our results, we propose a model to explain the molecular mechanism through which cGNAT2 regulates cell growth and PET in Syn7002 (Fig. 8I). In particular, cGNAT2 may affect cell growth and photosynthesis in Syn7002 via at least 2 mechanisms: (i) cGNAT2 may affect cell growth and PET by regulating K89 acetylation in NdhJ, a subunit of the NDH-1 complex, and (ii) acetylated proteins in photosynthesis and metabolism-related pathways may coordinately regulate cell growth and photosynthesis in Syn7002.
In summary, this study reports a KAT in cyanobacteria and elucidates the acetylation-mediated molecular mechanism through which it regulates cell growth and photosynthesis in Syn7002.
Materials and methods
Identification of KATs using an acetylation-deficient E. coli strain
The plasmid Pca24n and acetylation-deficient E. coli strain were kindly provided by Professor Alan J. Wolfe (Loyola University Chicago, Maywood, IL, USA) and were used to assay the enzymatic activities of all putative acetyltransferases from Syn7002, as described previously (Christensen et al. 2018). Briefly, acetyltransferases (Pta, YfiQ, and Acs) and deacetylase (CobB, protein–lysine deacetylase) from E. coli strain BW25113 were knocked out to reduce background acetylation levels. The strain was transformed with the pCA24n expression vector as a negative control. To express the known acetyltransferase, yfiQ (peptidyl-lysine N-acetyltransferase) was cloned into the pCA24n vector and transformed into the mutant strain retaining the WT allele of acs (Δpta yfiQ cobB). The resulting strain exhibited strong acetylation and was used as a positive control. All strains and vectors used in this study are listed in Supplemental Data Set 13.
To determine the enzymatic activities of all putative Syn7002 acetyltransferases, full-length genes, including cGNAT2 (A1596), A1081, A2752, A0666, A1611, A2436, A2253, A0832, A0947, A0096, and F0063, were amplified from Syn7002 genomic DNA using PCR with the primers listed in Supplemental Data Set 14. Generated PCR products were cloned into the TA cloning vector PMD-19T (Takara, Shiga, Japan) and transformed into E. coli DH5α cells for propagation as plasmids. After the plasmids had been digested using NotI and BamHI, the target DNA segments were purified and cloned into the pCA24n vector to express all putative Syn7002 acetyltransferases. All generated strains were cultured in TB7 medium (10 g/L tryptone buffered at pH 7.0 with 100 mM potassium phosphate) containing 25 μg/mL chloramphenicol and 0.4% (v/v) glucose at 37 °C for 10 h. After protein expression had been induced using 50 μM isopropyl-β-D-1-thiogalactopyranoside (IPTG), all strains were harvested and lysed by sonication (3 s on and 3 s off) for 30 min on ice using a JY92-IIN sonicator with an output of 135 W (Ningbo Scientz Biotechnology, Ningbo, China). Cell debris was removed by centrifugation at 12,000 × g for 10 min at 4 °C, and protein concentration was determined using a bicinchoninic acid (BCA) assay kit (Beyotime, Jiangsu, China).
Equal amounts of protein (about 30 μg) were redissolved in 1 × SDS loading buffer (50 mM Tris-Cl [pH 6.8], 1% [m/v] beta-mercaptoethanol, 2% [m/v] SDS, 0.1% [m/v] bromophenol, and 10% [m/v] glycerol) and boiled for 5 min. The protein mixture was then loaded onto a 12% (w/v) SDS–PAGE gel (1.5 mm thick, 80 mm wide, 70 mm long). After electrophoresis, the separated proteins were visualized by staining with Coomassie blue R250 and destained using destaining buffer (10% [v/v] methanol and 10% [v/v] acetic acid). Target protein expression and acetylation levels were confirmed using western blot analysis with anti-His-tag antibody (1:1,000 dilution, Product number 2365, Cell Signaling Technology, Danvers, MA) and rabbit polyclonal antiacetyl lysine antibody (1:1,000 dilution, PTM-105, PTM Biolabs, Chicago, IL, USA). Western blot analysis was performed using SimpleWesterns, which are gel-free, blot-free, capillary-based, automated western blotting system developed by ProteinSimple (Santa Clara, CA, USA) as described previously (Dong et al. 2015).
Protein structure simulation
After the cGNAT2 protein sequence had been retrieved from cyanobase (http://genome.microbedb.jp/CyanoBase), AlphaFold2 software was used to simulate the 3D structure of cGNAT2 using a fast homology MMseqs2 search with a reduced version of the databases (Jumper et al. 2021). Since target protein structure is often multimeric, multimer modeling was allowed in AlphaFold2 with ranking and relaxation of the predicted structures. For other parameters, we used the algorithm defaults in AlphaFold2. The final relaxed model of the predicted structure with rank 1 was selected and submitted to the PDB data set to identify structural homologs using the Dali server (Holm 2022). Domain structure was visualized using PyMOL (v. 2.3.2) (Seeliger and de Groot 2010). MD simulation of the final high-quality cGNAT2 structure with the AcCoA ligand retrieved from the PDB data set was performed using Molecular Operating Environment (MOE) (2019.0102) software (Vilar et al. 2008) with the default algorithm. The best-scoring docking simulation complex was selected, and potential binding sites of AcCoA were reported for functional analysis.
Protein expression and purification
Full-length cGNAT2 (A1596), ndhJ (A2750), gap (A0106), and rbcL (A1798) genes were amplified from Syn7002 genomic DNA using PCR with the primers listed in Supplemental Data Set 14. PCR products were cloned into the expression vectors pET32a and pET21b (Novagen, Germany) and then transformed into E. coli BL21 (DE3) for protein overexpression. For site-directed cGNAT2 mutation, the pET32a-cGNAT2 expression vector was used as a template. Point mutations were introduced into target sites using PCR with the primers listed in Supplemental Data Set 14. The generated PCR products were then transformed into E. coli BL21 (DE3), and point mutations in the transformed cells were confirmed by DNA sequencing.
All strains were cultured in fresh LB medium (each liter contained 10 g tryptone, 5 g yeast extract, and 10 g NaCl) at 37 °C in shaking flasks to an optical density of 0.6 at 600 nm, added to an appropriate concentration of IPTG, and incubated for another 12 h at 16 °C. Cells were then harvested, washed 3 times with ice-cold PBS buffer (137 mM NaCl, 2.7 mM KCl, 10 mM Na2HPO4, and 1.8 mM KH2PO4, pH 7.4), and disrupted by sonication (3 s on and 3 s off) for 30 min on ice using a JY92-IIN sonicator with an output of 135 W (Ningbo Scientz Biotechnology). Cellular debris was removed by centrifugation at 12,000 × g for 30 min at 4 °C. All lysates were purified using an affinity Ni-NTA agarose column (Qiagen, CA, USA) as described previously (Yang et al. 2015). Briefly, the target proteins were eluted using 8 mL elution buffer (20 mM Tris–HCl and 500 mM NaCl, pH 8.0) containing 10 to 250 mM imidazole. Each elution was collected, concentrated, and desalted in PBS buffer using a concentrator (Millipore, Bedford, MA, USA). Protein concentration was determined using a BCA assay kit (Beyotime, Jiangsu, China). Target protein (5 μg) expression was confirmed using a 12% (w/v) SDS–PAGE.
Fluorometric determination of acetyltransferase activity
The acetyltransferase activities of cGNAT2 and its mutants were determined using an acetyltransferase activity assay kit (AB204536; Abcam, Cambridge, USA) according to the manufacturer's instructions. Briefly, 50 nM of purified cGNAT2 or its mutants was incubated in 100 μL of reaction buffer containing 100 μM substrate and 25 μL acetyltransferase buffer for 30 min at 25 °C. The reaction was quenched by adding 50 μL isopropanol, incubated with 100 μL of test solution for 10 min incubation at 25 °C, and the reaction products were measured using a fluorescent microplate reader at excitation/emission = 380/520 nm. Diluted acetyltransferase positive control and double-distilled water were used as positive and negative controls, respectively. Experiments were repeated with 3 biological replicates. Statistical significance was determined using 2-sample Student's t tests (*P < 0.05; **P < 0.01).
Cyanobacterial strains and growth conditions
WT Syn7002 was grown in A+ medium at 37 °C with continuous illumination with 50 μmol photons/m2/s (LL), 250 μmol photons/m2/s (NL), or 2,000 μmol photons/m2/s (HL) (Stevens et al. 1973). The liquid culture was bubbled with 1% CO2 (v/v) in filtered air. For high CO2 growth, cells were cultured in A+ medium at 37 °C with continuous illumination, bubbled with 5% CO2 (v/v) in filtered air. For photoheterotrophic growth, cells were cultured in A+ medium at 37 °C with continuous illumination supplemented with 10 mM glycerol and 2.5 μM DCMU. Experiments were repeated with 3 biological replicates. Statistical significance was determined using 2-sample Student's t tests (*P < 0.05; **P < 0.01).
Mutant construction
Full-length A0947, cGNAT2, and ndhJ genes were amplified from Syn7002 genomic DNA using PCR with the primers listed in Supplemental Data Set 14. The PCR products were cloned into the TA cloning vector pMD19-T (Takara), and plasmids containing the A0947, cGNAT2, and ndhJ genes were disrupted by inserting a chloramphenicol resistance gene (Cmr, derived from the pRL271 plasmid) or kanamycin resistance gene (Kanr, derived from the pRL446 plasmid). To construct site-directed mutants, the plasmid containing ndhJ gene was used as a template, and site-directed ndhJ mutation was introduced into the selected sites using PCR with the primers listed in Supplemental Data Set 14. The resulting plasmids were transformed into Syn7002, as described previously (Eaton-Rye 2011). Target genes were inactivated using homologous recombination. The resulting transformants were selected on A+ agar plates with 12.5 μg/mL Cmr or 50 μg/mL Kanr under NL intensity and confirmed using PCR and DNA sequencing.
Protein extraction, trypsin digestion, and LC fractionation
WT and ΔcGNAT2 strains were grown in A+ medium at 37 °C under continuous illumination (250 μmol photons/m2/s), bubbled with 1% CO2 (v/v) in filtered air, until they reached exponential phase (OD730 nm = 0.8 to 1.0). Cells were immediately harvested by centrifugation at 4,000 × g for 15 min at 4 °C, washed 3 times with ice-cold PBS buffer, resuspended in ice-cold PBS buffer containing protease inhibitor cocktail (Thermo Fisher Scientific, Waltham, MA, USA), and disrupted by sonication (3 s on and 3 s off) for 30 min on ice using a JY92-IIN sonicator with an output of 135 W (Ningbo Scientz Biotechnology). Cellular debris was removed by centrifugation at 4,000 × g for 30 min at 4 °C, and protein concentration was determined using a BCA assay kit (Beyotime). Whole cell lysates were reduced, alkylated, and trypsin digested as described previously (Yang et al. 2014). Briefly, protein lysates from 3 biological replicates were precipitated using 80% (v/v) ice-cold acetone and redissolved in 50 mM ammonium bicarbonate. Equal amounts of proteins (about 2 mg) were reduced using 25 mM DTT at 37 °C for 45 min and alkylated with 50 mM iodoacetamide at 25 °C for 10 min in the dark. Subsequently, proteins were digested with sequencing grade modified trypsin (1:50, wt/wt; Promega, Madison, WI, USA) at 37 °C for 24 h and quenched by adding 0.1% (v/v) trifluoroacetic acid (TFA).
After desalting with a self-packed C18 STAGE column, each peptide mixture was separated using LC system with a 4.6 mm × 25 cm reverse-phase C18 column at pH 9 with a 60 min elution gradient from 8% to 32% (v/v) acetonitrile. Eluted peptides were merged into 4 fractions and desalted using a self-packed C18 STAGE column. Each fraction was dried using a vacuum centrifuge for MS analysis.
Immunoaffinity enrichment of acetylated peptides
Tryptic peptides from 3 biological replicates were dissolved in NETN buffer (1 mM EDTA, 100 mM NaCl, 0.5% (v/v) NP-40, and 50 mM Tris–HCl, pH 8.0) and mixed with preconjugated antiacetyl lysine antibody beads (PTM-104, PTM Biolabs, Chicago, IL, USA) for 6 h with gentle rotation at 4 °C. Beads were washed twice with NETN buffer and once with water. Bound acetylated peptides were eluted using 0.1% (v/v) TFA and desalted using a self-packed C18 STAGE column. Each sample was dried using a vacuum centrifuge for MS analysis.
LC–MS/MS analysis
To measure changes in protein and lysine acetylation abundance, fractionated tryptic peptides and enriched acetylated peptides were dissolved in solvent A (0.1% [v/v] formic acid and 2% [v/v] acetonitrile) and separated using an EASY-nLC 1200 system (Thermo Fisher Scientific) equipped with a 75 μm × 15 cm column (C18, 3 μm, Thermo Fisher Scientific). Peptides were eluted using a 60 min gradient of solvent B (0.1% formic acid and 90% acetonitrile) at a flow rate of 450 nL/min, as follows: 0 to 2 min, 5% to 8% (v/v) solvent B; 2 to 42 min, 8 to 24% (v/v) solvent B; 42 to 54 min, 24% to 36% (v/v) solvent B; 54 to 57 min, 36% to 80% (v/v) solvent B; and 57 to 60 min, 80% (v/v) solvent B. Eluted peptides were directly ionized and sprayed onto a Q Exactive HF-X mass spectrometer (Thermo Fisher Scientific). MS was carried out in data-dependent acquisition (DDA) mode with full scans (350 to 1600 m/z) acquired at 60,000 resolution with a minimum signal intensity of 2.3E5 to identify peptides and at 120,000 resolution with a minimum signal intensity of 5E4 to identify acetylated peptides. The electrospray voltage was set at 2.2 kV, and the isolation width was set at 1.4 m/z. For peptide identification, the top 10 most intense precursor ions were selected for MS/MS fragmentation using high-energy collision dissociation (HCD) with a normalized collision energy (NCE) of 28% and analyzed at a resolution of 15,000 in Orbitrap. The dynamic exclusion duration was set to 30 s. The maximum injection times were set to 50 and 22 ms for full MS and MS/MS, respectively. For acetylated peptide identification, the top 20 most intense precursor ions were selected for MS/MS fragmentation by HCD with an NCE of 28% and analyzed with a resolution of 15,000 in Orbitrap. The dynamic exclusion duration was set to 15 s. The maximum injection times were set to 50 and 10 ms for full MS and MS/MS, respectively.
Protein identification and quantification
Raw data files were searched against the Syn7002 protein database (http://genome.annotation.jp/cyanobase) concatenated with the reverse decoy database and common contaminants using MaxQuant software (version 1.6.1.0) (Cox and Mann 2008). Trypsin was used as a protease with 2 maximum missed cleavages. Carbamidomethylation (Cys) was used as a fixed modification. Dynamic modifications included deamidation (Asn/Gln), oxidation (Met), and acetylation (protein N-term) for peptide identification, whereas acetylation (Lys), deamidation (Asn/Gln), oxidation (Met), and acetylation (protein N-term) were specified as variable modifications for acetylated peptide identification. The maximum number of modifications per peptide was 5 amino acids. The mass error was set to 20 ppm for the first search and 4.5 ppm for the main search. Peptides shorter than 7 amino acids were excluded. The minimum score for modified peptides was set to 40. Acetylation sites with a localization probability > 0.75 were reported as class I acetylation sites. The false discovery rate (FDR) thresholds for the modification site, peptide, and protein identification were set at a maximum of 1%. The LFQ algorithm in MaxQuant was used. Other parameters were kept at their default values in MaxQuant, such as using unique and razor peptides for quantification, considering only unmodified peptides and those peptides bearing specified modification for quantification (default values).
For the LFQ proteome data, the raw LFQ intensities of all proteins were extracted from the MaxQuant result file (proteingroup.txt) and first normalized by the total intensities of all identifications in each biological group.
LFQ intensities in 2 groups required 2 detected values of 3 biological replicates in at least one group. The missing value of the third biological replicate was imputed using normally distributed values with default parameters in Perseus (Tyanova et al. 2016). Then, the normalized LFQ intensities were log2 transformed, and the average quantitative value of each sample in multiple replicates was calculated using the LFQ intensities. Finally, we calculated the ratio of the average values between the 2 samples, and the ratio was used as the final protein quantitation. For the statistical analysis, the 2-sample Student's t test, which is one of the most commonly and widely used statistical tests to detect differential protein expression, was applied to determine the significant differences between 2 groups in this study. To reduce the false positives, we added fold change as filter criteria as previous report (Yang et al. 2022). Thus, the fold change value coupled with P-value cutoff were both used as filter criteria in our study, and only fold change > 1.2 or <0.83 and P < 0.05 were defined as significantly differentially expressed.
For the LFQ acetylome data, the raw intensities of acetylated peptides were extracted from the MaxQuant result file (Acetyl.txt) and first normalized by the total intensities of all identifications. The intensities in 2 groups required 2 detected values of 3 biological replicates in at least one group. The missing value of the third biological replicate was imputed using normally distributed values with default parameters in Perseus (Tyanova et al. 2016). Then, the obtained intensities of acetylated peptides were log2 transformed and normalized with the abundance of the corresponding proteins (LFQ proteome data) in the same sample to remove the effect of protein expression on the identified acetylation level. The average quantitative value of acetylated peptide of each sample in multiple replicates was calculated using the normalized abundance. The relative abundance of lysine acetylation was calculated using the average values between the 2 samples and used as the final acetylation quantitation. For the statistical analysis, the 2-sample Student's t test was applied to determine the significant differences between 2 groups in this study. The fold change value and P-value cutoff were both used as filter criteria in our study, and only fold change > 1.2 or <0.83 and P < 0.05 were defined as significantly differentially expressed.
MRM-HR analysis and data processing
To determine lysine acetylation levels in target peptides from WT and ΔcGNAT2 strains, an MRM-HR assay was developed for target proteins. Tryptic peptides derived from quantitative proteomics were separated using an online Eksigent nanoLC 400 LC system with a 0.3 mm × 15 cm analytical column (C18, 3 μm, ChromXP). Peptides were eluted using a 65 min gradient of solvent B (0.1% [v/v] formic acid and 90% [v/v] acetonitrile) at a flow rate of 300 nL/min as follows: 0 to 8 min, 5% to 11% (v/v) solvent B; 8 to 35 min, 11 to 25% (v/v) solvent B; 35 to 49 min, 25% to 36% (v/v) solvent B; 49 to 59 min, 36% to 80% (v/v) solvent B; and holding at 80% (v/v) solvent B for the last 6 min. Eluted peptides were analyzed using a Triple-TOF6600 Plus mass spectrometer (AB Sciex, Darmstadt, Germany) with an MRM-HR acquisition model. The ion source was operated as follows: GS1 = 15, GS2 = 15, CUR = 35, ISVF = 4,500, and IHT = 150. The transition lists of the target tryptic peptides were generated by Skyline software (version 3.6, MacCoss Lab, University of Washington, WA, USA) using in silico analyses of the selected proteins combined with the peptide identification results (Supplemental Data Set 15). A TOF–MS scan at m/z 350 to 1,500 was acquired with an accumulation time of 500 ms, followed by the product ion of the targeted peptide precursor mass with an accumulation time of 50 ms. The intensity threshold was set to 2,000,000 cps, and collision-induced dissociation was triggered by the rolling collision energy.
All MRM-HR data were processed using Skyline software. A spectral library was built by searching data against Syn7002 protein database using the MSAmanda search engine in Skyline software. Briefly, trypsin was used as a protease with 2 maximum missed cleavages, and carbamidomethylation (Cys) was set as a fixed modification. Acetylation (Lys), deamidation (Asn/Gln), and oxidation (Met) were specified as variable modifications. Precursor ion charges were set as 2+ and 3+, whereas product ion charges were 1+ and 2+. Product ions were selected from ion 3 to the last ion. The spectral library file had been deposited in the publicly accessible iProX database (https://www.iprox.cn/) with the identifier IPX0005265000 under the file name “20220613_PRM_Search (BINGO)_For_Paper.blib.” Furthermore, Skyline software used in this study was also deposited in the iProX database.
For the peptide quantification in MRM analysis, after inserting the target peptides and MRM-HR data, the generated spectral library was also imported into Skyline and used to assess peak integration in MRM analysis. The similarity of the measured spectrum to a library spectrum will be calculated by Skyline using normalized spectral contrast angle and called dotp ranging between 0 and 1. Since this value can help to find interferences in detection where the dotp value would be lower, thus the spectra for spectral libraries had to be generated prior to the actual MRM analysis, and dotp value was utilized to control the quality and credibility of the identified peptides. Although the Skyline has a default peak picking algorithm, manual evaluation of the peak boundary was also suggested to eliminate the possible incorrect assignments by Skyline according to previously described (Hoffman et al. 2018; Wang et al. 2019; Husain et al. 2023) and the tutorials of Skyline (Skyline Targeted Method Refinement). The dotp value will change when operator performed “manual adjustment” for the target peptide. Hence, to accurately select the target peak, the transition peak integration boundaries of the target peptides were manually adjusted and checked to avoid possible spectral interference. Furthermore, to avoid false peptide identification, 3 to 5 transitions per peptide are recommended to ensure enough transitions and to maintain the selectivity for reliable quantification in complex biological samples, as previously described (Vidova and Spacil 2017). The peak area was automatically determined using Skyline software with the Savitzky–Golay smoothed chromatogram. The peak area of the target peptide from each biological replicate was obtained by summing the area under the curve (AUCs) of each transition. Target protein abundance was calculated by summing the peak area of the corresponding peptides. Acetylated abundance was normalized to protein abundance, and the fold change was calculated using the mean value of acetylated abundance between 2 groups. Significant differences between 2 groups were determined using 2-sample Student's t tests.
Bioinformatics analysis of acetylated proteins
Multiple sequence alignment was performed using ClustalX2, and a phylogenetic tree was constructed using the MEGA software (version 5.05) (Tamura et al. 2011) to investigate the evolutionary conservation of cGNAT2. Structure-guided sequence alignment was performed using ESprint 3.0 (Robert and Gouet 2014). Domains of KATs in Syn7002 were analyzed using a conserved domain search strategy in the NCBI database and visualized using the IBS tool (Liu et al. 2015). Functional annotation of all identified proteins was performed using InterProScan (version 5.5) (Jones et al. 2014) and classified into biological processes, molecular functions, and cellular components using the WEGO bioinformatics resource (Ye et al. 2018). Subcellular localization of the identified proteins was analyzed using PSORTb (version 3.0) (Yu et al. 2010). Enrichment analysis was performed using the Cytoscape plugin BiNGO v2.44 (Maere et al. 2005). Correlation was analyzed using Pearson's correlation coefficient. Amino acid sequence motifs were analyzed with the PLogo (O'Shea et al. 2013), and a position-specific heatmap was plotted using the log10 (ratio of frequencies) as previously reported (Yang et al. 2013).
IP and western blotting
IP experiments were performed to verify the acetylation levels of rbcL and GAPDH, as described previously with minor modifications (Liu et al. 2020). Briefly, magnetic beads (Invitrogen) were washed 3 times with PBS buffer and incubated with protein-specific antibody (about 5 μg) with gentle rocking for approximately 6 h at 4 °C on a rotator. Protein antibody was then cross-linked with beads by adding 25 μM disuccinimidyl suberate. After washing with PBS buffer, whole cell lysates (about 300 μg) were incubated with magnetic bead–antibody complex overnight at 4 °C on a rotator. Unbound proteins were removed by washing with PBS buffer, and immunoprecipitated proteins were eluted and boiled in SDS loading buffer. Equal amounts (about 20 μg) of eluted proteins were subjected to 12% (w/v) SDS–PAGE and transferred to a PVDF membrane for western blot analysis. The membranes were blocked with TBST buffer (25 mM Tris–HCl, pH 8.0, 150 mM NaCl, and 0.1% [v/v] Tween 20) containing 5% (w/v) skim milk powder for 2 h at 37 °C and then incubated with specific antibodies (rbcL [PHY5236A] and Gap [PHY5119A], 1:2,000 dilution; PhytoAB, CA, USA] or antiacetyl lysine antibody (1:2,000, in TBS/5% [w/v] BSA; PTM-105, PTM Biolabs) overnight at 4 °C. After washing 3 times with TBST buffer, the membranes were incubated with horseradish peroxidase (HRP)–conjugated goat antirabbit secondary antibody (1:5,000 dilution; Product number 7074, Cell Signaling Technology, Danvers, MA) or antimouse secondary antibody (1:5,000 dilution; Product number 7076, Cell Signaling Technology, Danvers, MA) for 1 h at 37 °C. The membranes were then washed with TBST buffer and visualized using a fluorescence scanner (ImageQuant, GE Healthcare, Chicago, IL, USA) with enhanced chemiluminescence immunoblotting detection reagents (Advansta, Menlo Park, CA). Densitometry analysis was performed using ImageJ software (http://rsbweb.nih.gov/ij/).
In vitro acetylation assay
In vitro, acetylation assay was performed as described previously (Gardner et al. 2006). In brief, 5 μg of cGNAT2 and its mutants were incubated with 5 μg of substrate (NdhJ, Gap, and rbcL) in 100 μL reaction buffer containing 500 mM Tris, 500 mM DTT, 500 mM sodium butyrate, and 50 mM AcCoA (specific activity, 47 mCi/mmol, Sigma-Aldrich). Heat-inactivated protein was used as a negative control. The reaction was finally stopped by boiling in 1 × SDS loading buffer (50 mM Tris–Cl [pH 6.8], 1% [m/v] beta-mercaptoethanol, 2% [m/v] SDS, 0.1% [m/v] bromophenol, and 10% [m/v] glycerol) and analyzed by western blotting using antiacetyl lysine antibody (PTM-105, PTM Biolabs) at a 1:1,000 dilution.
Enzymatic activity assay
The enzymatic activity of GAPDH was measured using a GAPDH activity assay kit (AKSU064U-1, Boxbio, Beijing, China) according to the manufacturer's instructions. Syn7002 cells in exponential growth phase were harvested, washed 3 times with PBS buffer, resuspended in extraction buffer, and lysed by sonication as described above. Protein concentration was determined using a BCA assay kit (Beyotime). Equal amounts of cell lysates (20 μg) were incubated with the working buffer, and absorbance values were recorded at 340 nm for 20 s (A1) and 320 s (A2) using a fluorescent microplate reader. Diluted GAPDH positive control and double-distilled water were used as positive and negative controls, respectively. GAPDH activity was calculated using the following formula: enzymatic activity (U/mL protein) = [1072 × (A2 − A1)]/(protein concentration). Experiments were repeated with 3 biological replicates. Statistical significance was determined using 2-sample Student's t tests (*P < 0.05; **P < 0.01).
The enzymatic activities of Rubisco and NdhJ were measured using a Rubisco ELISA assay kit (ML022780-2, Mlbio, Shanghai, China) and NdhJ ELISA assay kit (ML650374, Mlbio, Shanghai, China) according to the manufacturer’s instructions. In short, the microtiter wells were precoated with the plant Rubisco or NdhJ antibody. The standards were prepared by diluting the stock solution with dilution buffer to reach the appropriate concentrations to generate a standard curve. The concentrations of Rubisco standards were 0, 62.5, 125, 250, 500, and 1000 U/mL; NdhJ standards were 0, 15, 30, 60, 120, and 240 U/mL. Whole cell lysates from different Syn7002 cells were extracted as described above. Fifty microliters of samples (20 μg), standards, or double-distilled water was separately added to ELISA 96-well plate with 50 μL of biotin-labeled secondary antibody (provided with the kit). After incubation for 30 min at 37 °C, the plate was washed 5 times with 350 μL of washing buffer and then incubated with HRP-labeled detection antibody (provided with the kit) for another 30 min. After several washes with 350 μL of washing buffer, the 3,3′,5,5′-tetramethylbenzidine (TMB) that is the chromogenic substrate for HRP was added to the plate, and the mixtures were incubated in the dark for 15 min at 37 °C. The reaction was stopped with acid, and absorbance values were recorded at 450 nm using a fluorescent microplate reader. Protein concentration was determined using a BCA assay kit (Beyotime). A standard linear regression curve was drawn and used to calculate enzymatic activity. The product information of these 2 ELISA kits can be accessed at the following link: Rubisco: https://www.mlbio.cn/goods-98426.html; NdhJ: https://www.mlbio.cn/goods-98425.html. Experiments were repeated with 3 biological replicates. Statistical significance was determined using 2-sample Student's t tests (*P < 0.05; **P < 0.01).
Determination of AcCoA content
AcCoA level was determined using an AcCoA kit (BC0980, Solarbio, Beijing, China) according to the manufacturer’s instructions. In brief, cell lysates from different Syn7002 cells were isolated using sonication as described above. Protein concentration was determined using a BCA assay kit (Beyotime). Equal amounts of cell lysates (about 20 μg) were incubated with the working buffer, and absorbance values were recorded at 340 nm for 20 s (A1) and 80 s (A2) using a fluorescent microplate reader. Diluted AcCoA positive control and double-distilled water were used as positive and negative controls, respectively. AcCoA concentrations were calculated using the following formula: AcCoA concentration (nmol/mg protein) = [1640 × (A2 − A1) + 0.012]/(protein concentration). Experiments were repeated with 3 biological replicates. Statistical significance was determined using 2-sample Student's t tests (*P < 0.05; **P < 0.01).
CO2 exchange measurements
Syn7002 cells grown under different growth conditions were harvested and resuspended in 50 mM HEPES–NaOH buffer to final concentration 5.5 μg Chl/mL. Cell suspension was then placed in a reaction vessel of the mass spectrometer, and CO2 exchange was measured using membrane inlet mass spectrometer, model MIMS200 (Bay Instruments, LLC, USA), as previously described (Lindberg et al. 2004; Liran et al. 2016). In brief, the sample was transported into a U-tube with a gas filter membrane via a peristaltic pump under high vacuum. The gas from the sample was ionized and analyzed by MIMS. Enough dry ice was added to the Dewar vessel to stabilize the carbon dioxide baseline of the membrane feed mass spectrometer, prior to the experiment. The cell suspension was continuously stirred by a magnetic stirrer and kept at a controlled temperature of 20 °C. The CO2 signal was first measured in darkness with the peristaltic pump turned on. After stabilization, the change in CO2 was recorded for 5 min at a saturated light intensity of 950 μmol photons/m2/s. The MS system automatically obtains the abundance of corresponding mass peaks (m/z = 40 and 44) from 2 gases (Ar and CO2). To reduce measurement noise, gas concentrations were calculated by referencing biologically neutral Ar, which is typically present at approximately 1% (v/v) in air. Experiments were repeated with 3 biological replicates.
Measurement of photosynthetic oxygen evolution rate
Photosynthetic oxygen evolution rates were measured using an oxygen electrode system (Hansatech Instruments Limited, Norfolk, UK) as described previously (Liu et al. 2018). Syn7002 cells in exponential growth phase were harvested and resuspended in fresh A+ medium (OD730 nm = 1.0) containing 10 mM NaHCO3. After dark adaption for 10 min, cell cultures were added to an electrode chamber, and the temperature was maintained at 37 °C using a circulating water bath. Oxygen evolution rates were measured at a saturated light intensity of 950 μmol photons/m2/s. Experiments were repeated with 3 biological replicates. Statistical significance was determined using 2-sample Student's t tests (*P < 0.05; **P < 0.01).
Measurement of chlorophyll fluorescence and P700 redox kinetics
Syn7002 cells in exponential growth phase were harvested and resuspended in fresh A+ medium at a final concentration of OD730 nm = 1.0. After dark adaption for approximately 15 min, cells were added to a quartz cuvette that was inserted into a PAM fluorometer. Chlorophyll fluorescence was measured using a Dual-PAM-100 instrument (Heinz Walz Gmbh, Effeltrich, Germany) as described previously (Liu et al. 2018). Cells were illuminated using actinic light for a period of 30 s, and a saturating pulse (8,000 μmol/m2/s) was used to determine the maximal fluorescence yield every 30 s. All data were recorded using Dual-PAM software. The PSII parameters were calculated using the following formulas (Genty et al. 1989; Jokel et al. 2018): Fv/Fm = (Fm − F0)/Fm; Y(II) = (Fm″ − Fs)/Fm″; qN = (Fm − Fm′)/(Fm − F0); and NPQ = (Fm − Fm′)/Fm″, where F0 is the minimum fluorescence in the dark-adapted state, Fm and Fm″ are the maximum fluorescence in the dark- and light-adapted states, respectively, and Fs is the fluorescence in the light-adapted state. Maximal photochemical efficiency (Fv/Fm), effective quantum yield of PSII (Y(II)), electron transport rate through PSII (ETR(II)), and nonphotochemical quenching factor (qN and NPQ) were calculated as a previous study (Campbell et al. 1998). To record transient increases in chlorophyll fluorescence, dark-adaptive cells were first illuminated with actinic light and saturating pulse. Actinic light was subsequently switched off, and a transient increase in chlorophyll fluorescence was recorded for around 8 min. The P700 redox state was measured using a Dual-PAM-100 instrument (Heinz Walz Gmbh) as described previously (Yu et al. 1993; Huang et al. 2003; Xu et al. 2005; Zhao et al. 2007). Dark-adaptive cells were adjusted to a final concentration of OD730 nm = 3.0, and the P700 redox state was determined by monitoring the change of absorbance at 820 to 860 nm in the presence of 10 μM DCMU. The wavelength of the actinic light at 635 nm (red light) was used, and the intensity was precisely adjusted to 500 μmol/m2/s. The P700 reduction kinetics were fitted and calculated using GraphPad software as described previously (Yu et al. 1993; Zhao et al. 1998; Huang et al. 2003; Xu et al. 2005; Zhao et al. 2007). Experiments were repeated with 3 biological replicates. Statistical significance was determined using 2-sample Student's t tests (*P < 0.05; **P < 0.01).
Measurement of 77 K fluorescence spectra
Fluorescence emission spectra were determined using a single-beam fluorometer (Photon Technology International, New Brunswick, NJ) at 77 K as described previously (Dong et al. 2009; Zheng et al. 2021a, b). In short, cells in exponential growth phase were harvested, resuspended in fresh A+ medium at a final concentration of OD730 nm = 0.8 in the presence of 15% (m/v) glycerol, and incubated in the dark for 5 min before being immediately frozen in liquid nitrogen Dewar vessel. Excitation wavelengths were set to 590 nm for PBS and 430 nm for chlorophyll. Fluorescence emission spectra were measured every 1 nm in the 600 to 800 nm wavelength range. Each measurement consisting of 3 biological replicates was performed and averaged. Experiments were repeated with 3 biological replicates.
Statistical analysis
Data are presented as means ± Sd from at least 3 independent experiments. Statistical significance was determined using 2-sample Student's t tests. One asterisk indicates P < 0.05, and two asterisks indicate P < 0.01.
Accession numbers
Sequence data from this article can be found in the GenBank/EMBL data libraries under accession numbers listed in Supplemental Table S2.
Acknowledgments
The authors thank Min Wang and Shuzhao Jia (Analysis and Testing Center, IHB, CAS) for their assistance with the proteomic experiments.
Author contributions
J.Z., F.G., and M.Y. conceived and designed the experiments and wrote the article. K.J., X.L., Q.Z., and G.C. performed the experiments. K.J., F.G., J.Z., and M.Y. analyzed the data. All authors read and approved the final article.
Supplemental data
The following materials are available in the online version of this article.
Supplemental Figure S1. Phylogenetic tree of acetyltransferases across representative cyanobacteria.
Supplemental Figure S2.A0947 mutant construction and profiling of lysine acetylation levels in WT and ΔA0947 strains.
Supplemental Figure S3. Multiple sequence alignment of A1596 with known KATs in prokaryotes and land plants.
Supplemental Figure S4. Phylogenetic tree of acetyltransferases across representative prokaryotes and land plants.
Supplemental Figure S5.A1596 mutant construction.
Supplemental Figure S6. Structural analysis of KAT.
Supplemental Figure S7. Multiple sequence alignment of cGNAT2 with all Arabidopsis GNATs and other known KATs in plants.
Supplemental Figure S8. Functional effects of cGNAT2 deletion on Syn7002 under different light intensities.
Supplemental Figure S9. Effects of cGNAT2 deletion on Syn7002 light responses under different conditions.
Supplemental Figure S10. Effect of cGNAT2 deletion on nonphotochemical quenching under different light intensities.
Supplemental Figure S11. Analysis of cyclic electron flow around PSI based on transient increases in chlorophyll fluorescence detected under different growth conditions.
Supplemental Figure S12. The effects of cGNAT2 deletion on P700+ oxidation–reduction kinetics of the Syn7002.
Supplemental Figure S13. Overview of quantitative proteomic analysis results.
Supplemental Figure S14. Overview of quantitative lysine acetylome analysis results.
Supplemental Figure S15. GO classification of cGNAT2-regulated proteins according to biological process, molecular function, and cellular localization.
Supplemental Figure S16. GO enrichment analysis of cGNAT2-regulated proteins according to biological process.
Supplemental Figure S17. GO enrichment analysis of cGNAT2-regulated proteins according to molecular function and cellular component.
Supplemental Figure S18. KEGG pathway enrichment analysis of cGNAT2-regulated proteins.
Supplemental Figure S19. Analysis of lysine acetylation sites.
Supplemental Figure S20. Peak areas and dotp values of the acetylated peptide, [ELVSFYHLLK(ac)VGDNVTDPEEVR] from all samples.
Supplemental Figure S21. Identification of hypoacetylation sites in GAPDH and rbcL.
Supplemental Figure S22. cGNAT2 can catalyze rbcL and GAPDH acetylation in vitro and in vivo.
Supplemental Figure S23. Effects of NdhJ acetylation on effective quantum yield of PSII (Y(II)).
Supplemental Figure S24. P700+ oxidation–reduction kinetics of WT, ΔcGNAT2, and NdhJ mutant strains (ΔndhJ, K89Q, and K89R) in the presence of 10 μM DCMU.
Supplemental Figure S25. Effects of NdhJ acetylation on effective quantum yield of PSII under high CO2 condition.
Supplemental Figure S26. P700+ oxidation–reduction kinetics of WT, ΔcGNAT2, and NdhJ mutant strains (ΔndhJ, K89Q, and K89R) in the presence of 10 μM DCMU under high CO2 condition.
Supplemental Figure S27. Effects of cGNAT2 deletion on nonphotochemical quenching under different growth conditions.
Supplemental Figure S28. Multiple sequence alignment of Syn7002 NdhJ with representative photosynthetic organisms.
Supplemental Figure S29. Overall structure of the hydrophilic arm of the NDH-1 complex.
Supplemental Figure S30. Sequence alignment of Syn7002 and T. vestitus NdhJ proteins.
Supplemental Figure S31. Overall structure of NdhJ.
Supplemental Table S1. Predicted acetyltransferases in Syn7002.
Supplemental Table S2. The accession numbers of the major genes/proteins mentioned in this study.
Supplemental Data Set 1. List of potential acetyltransferases in cyanobacteria, prokaryotes, and plants.
Supplemental Data Set 2. Comparison of cGNAT2 structure with structures from the PDB database.
Supplemental Data Set 3. Summary of all identified proteins and peptides in Syn7002.
Supplemental Data Set 4. Summary of all quantifiable proteins in Syn7002.
Supplemental Data Set 5. Summary of all identified acetylated sites in Syn7002.
Supplemental Data Set 6. Summary of all quantifiable acetylated sites (class I) in Syn7002.
Supplemental Data Set 7. List of all differentially expressed acetylated sites in Syn7002.
Supplemental Data Set 8. List of all GO annotations and subcellular localizations of hypoacetylated proteins in Syn7002.
Supplemental Data Set 9. GO enrichment analysis of hypoacetylated proteins in Syn7002.
Supplemental Data Set 10. KEGG pathway enrichment analysis of hypoacetylated proteins in Syn7002.
Supplemental Data Set 11. Complete list of KEGG pathways for identified hypoacetylated proteins in Syn7002.
Supplemental Data Set 12. MRM-HR quantified results.
Supplemental Data Set 13. List of strains and plasmids used in this study.
Supplemental Data Set 14. List of primers used in this study.
Supplemental Data Set 15. Mass of targeted peptide precursors for MRM-HR.
Funding
This work was supported by the National Key Research and Development Program of China (2020YFA0907400) and the National Natural Science Foundation of China (grant no. 32261133523 and grant no. 32202910).
Data availability
The mass spectrometry proteomic data, MRM-HR data, and annotated spectra of the detected acetylated peptides have been deposited in a publicly accessible database iProX (https://www.iprox.cn/) with the identifier IPX0005265000.
References
Author notes
Kun Jia and Mingkun Yang contributed equally.
The author responsible for distribution of materials integral to the findings presented in this article in accordance with the policy described in the Instructions for Authors (https://dbpia.nl.go.kr/plphys/pages/General-Instructions) is Feng Ge ([email protected]).
Conflict of interest statement. The authors declare that they have no conflicts of interest.
