


Abstract
Understanding the molecular regulation of plant response to drought is the basis of drought-resistance improvement through molecular strategies. Here, we characterized apple (Malus × domestica) histone deacetylase 6 (MdHDA6), which negatively regulates apple drought tolerance by catalyzing deacetylation on histones associated with drought-responsive genes. Transgenic apple plants over-expressing MdHDA6 were less drought-tolerant, while those with down-regulated MdHDA6 expression were more drought-resistant than nontransgenic apple plants. Transcriptomic and histone 3 acetylation (H3ac) Chromatin immunoprecipitation-seq analyses indicated that MdHDA6 could facilitate histone deacetylation on the drought-responsive genes, repressing gene expression. Moreover, MdHDA6 interacted with the abscisic acid (ABA) signaling transcriptional factor, ABSCISIC ACID-INSENSITIVE 5 (MdABI5), forming the MdHDA6-MdABI5 complex. Interestingly, MdHDA6 facilitated histone deacetylation on the drought-responsive genes regulated by MdABI5, resulting in gene repression. Furthermore, a dual-Luc experiment showed that MdHDA6 could repress the regulation of a drought-responsive gene, RESPONSIVE TO DESICCATION 29A (MdRD29A) activated by MdABI5. On the one hand, MdHDA6 can facilitate histone deacetylation and gene repression on the positive drought-responsive genes to negatively regulate drought tolerance in apple. On the other hand, MdHDA6 directly interacts with MdABI5 and represses the expression of genes downstream of MdABI5 via histone deacetylation around these genes to reduce drought tolerance. Our study uncovers a different drought response regulatory mechanism in apple based on the MdHDA6-MdABI5 complex function and provides the molecular basis for drought-resistance improvement in apple.
Introduction
With global warming, severe droughts triggered by extreme weather enhance agricultural yield losses and become a big challenge for the human food supply (Dietz et al. 2021). To cope with drought stress, plants have evolved multifaceted strategies to improve drought resistance for survival, including morphological, physiological, and biochemical adaptations (Yang and Miao 2010; Zhou et al. 2013; Basu et al. 2016; Tuteja and Gill 2016). The underlying molecular mechanism of plant response to drought has also been widely revealed, and many regulatory and functional proteins participate in this process (Yu et al. 2008; Jiang et al. 2012; Nakashima et al. 2014; Liang Song 2016). Among the molecular regulation network of plants in response to drought, an increasing number of studies have demonstrated that epigenetic modifiers are key in regulating drought-responsive genes at transcriptional and posttranscriptional levels to modulate stress response in plants (Lamke and Baurle 2017; Chang et al. 2020).
Epigenetics refer to the heritable phenotypic changes that do not involve alterations in DNA sequence. The epigenetics mechanism mainly includes DNA methylation, histone modifications, and some noncoding RNAs (Duan et al. 2018). Among these epigenetic modifications, histone modification is the most well-studied mechanism, which refers to the post-translational covalent modifications on the histone tails, including acetylation, methylation, ubiquitination, SUMOylation, and phosphorylation. Different histone modifications on various amino acid residues constitute the histone code across kingdoms (Liu et al. 2010). Among them, acetylation is the most studied histone marker, a gene activation marker widely participating in plant development and stress response (Kumar et al. 2021). Histone acetylation is dynamically modulated by antagonistic enzymes, including histone acetyltransferases (HATs) and histone deacetylases (HDACs). HATs usually lead to gene activation by transferring the acetyl groups onto the histone lysine residues. At the same time, HDACs generally perform gene inactivation by removing the acetyl groups from the acetylation sites (Kumar et al. 2021).
Many studies have revealed that the histone acetylation dynamics controlled by HATs and HDACs play a vital role in plant drought responses and adaptations (Shen et al. 2019; Kumar et al. 2021). For example, Arabidopsis (Arabidopsis thaliana) hda19 mutants exhibit enhanced tolerance to salinity, drought, and heat stresses, suggesting that HDA19 is a negative regulator of plants in response to salinity, drought, and heat (Ueda et al. 2017, 2018). Another Arabidopsis histone acetyltransferase, HDA6, can repress the expression of acetate synthesis genes pyruvate decarboxylase 1 (AtPDC1) and Aldehyde dehydrogenases 2B7 (AtALDH2B7) by histone H4 deacetylation around these gene regions and decreases the acetate acid accumulations, negatively regulating drought response (Kim et al. 2017). However, a recent study has revealed that Arabidopsis hda9 mutants presented drought stress sensitivity and insensitivity to abscisic acid (ABA), indicating that HDA9 is a positive regulator in drought response (Baek et al. 2020). Investigation of the mechanism demonstrated that HDA9 and ABI4 formed a repressive complex to modulate the expression of key genes in the ABA catabolic pathway, ABA 8′-hydroxylase A1 (CYP707A1) and CYP707A2, by directly binding to their promoters (Baek et al. 2020). Similarly, another study showed that the HDA9-PWR (The protein Powerdress)-ABI4 histone deacetylase complex could suppress CYP707A1/2 genes and promote ABA accumulation in response to drought stress (Khan et al. 2020). Additionally, the histone deacetylase BdHD1, a homolog of AtHDA19, can repress the expression of the drought-responsive gene WRKY transcription factor 24 (BdWRKY24) by H3K9ac deacetylation to regulate ABA signaling and drought response in Brachypodium (Brachypodium Beauv.) (Song et al. 2019). In cotton (Gossypium hirsutum), the histone deacetylase GhHDT4D could suppress the GhWRKY33 expression by H3K9 deacetylation on the promoter region of GhWRKY33, proven to play an important role in regulating drought response in cotton (Ueda et al. 2018). HDACs can repress gene expression by histone deacetylation to negatively or positively regulate plant drought resistance.
HDACs confer gene inactivation by histone deacetylation; however, HDACs also cause gene activation in exceptional cases (Tasset et al. 2018; Van Der Woude et al. 2019; An et al. 2022). For example, HDA9 is required for transcriptional activation of the key gene of auxin biosynthesis flavin monooxygenases 8 (YUCCA8) to regulate auxin-dependent thermomorphogenesis in Arabidopsis (Van Der Woude et al. 2019). A recent study has uncovered the mechanism of antagonistic enzymes GCN5 (HAT) and HDA6 (HDAC) on gene expression. It reveals that GCN5/HDA6 controls the lysine acetylation/deacetylation of the corepressor TOPLESS (TPL) protein to enhance/inhibit the repression impacts of TPL on the downstream genes, leading to the transcriptional repression/activation, respectively (An et al. 2022). This study demonstrates that HATs/deacetylases facilitate transcriptional repression/activation through regulating corepressors, which have the opposite effects with histone acetylation, providing a different gene regulation mechanism.
The phytohormone ABA plays an important role in drought stress response. ABA-Insensitive 5 (ABI5) is a basic leucine zipper transcriptional factor and plays a vital role in ABA signaling. It has been reported that ABI5 widely involved in regulating plant development and abiotic stress responses (Skubacz et al. 2016). A previous study revealed that over-expression (OE) of ABI5 could improve water use efficiency (WUE) and enhance drought stress adaptation in cotton (Mittal et al. 2014). Similarly, MdABI5 can increase the drought resistance of transgenic apple (Malus × domestica) plants by directly binding to the drought-responsive genes LATE EMBRYOGENESIS ABUNDANT 6 (MdEM6) and MdRD29A and activating their expression, indicating that ABI5 positively regulates apple drought tolerance (Liu et al. 2022). Moreover, many transcriptional factors, such as R2R3-MYB (v-myb avian myeloblastosis viral oncogene homolog) transcription factor (MYB7), WRKYs, ABI3, and ABI4, can positively or negatively regulate ABI5 expression levels. Additionally, ABI5 proteins are also controlled by multiple post-translational modifications (PTMs) such as ubiquitination, SUMOylation, and phosphorylation (Skubacz et al. 2016). ABI5, a core regulator of ABA signaling, can be regulated by multiple transcriptional factors and PTMs involved in biological processes.
Apple is one of the favorite fruit crops widely grown worldwide. However, many apple production areas suffer from drought. Therefore, understanding the molecular regulatory mechanisms of apple plants in response to drought can enable effective genetic improvement in apple drought resistance. Considering the involvement of epigenetic regulations in drought response (Xu et al. 2018), HDAC-mediated histone modification regulation in apple drought response had not been elucidated. In this study, we demonstrated that the apple histone deacetylase 6 (MdHDA6) repressed the expression of drought-responsive genes by histone deacetylation, negatively regulating drought tolerance. Additionally, we found that MdHDA6 could interact with MdABI5 to coordinately regulate drought response in apple. Our findings characterized a histone deacetylase MdHDA6 coupled with MdABI5 that negatively regulates drought tolerance, providing a potential regulatory mechanism for apple drought-resistance improvement.
Results
MdHDA6 is a member of RPD3/HDA1 family and can catalyze histone deacetylation in vitro
Previous studies have demonstrated that histone deacetylases are involved in plant responses to abiotic stresses. Here, we characterized the apple histone deacetylase 6 (MdHDA6) involved in apple response to drought stress. First, we cloned the full-length MdHDA6 with an open reading frame (ORF) of 1407 bp, encoding a 468 amino acid polypeptide with a molecular weight of 52.7 kDa (Fig. 1A). As expected, a typical Histone Deacetylase domain (PF00850) was characterized among MdHDA6 proteins (Fig. 1A). To further investigate the phylogenetic relationship of MdHDA6 among histone deacetylase (HDA) members, we first identify the HDAs in apple genome and then performed the phylogenetic analysis with Arabidopsis HDA members (Fig. 1B). The results showed that the apple genome contains 14 HDA members, and MD14G1173000 was closest to the AtHDA6; therefore, we took MD14G1173000 as the AtHDA6 counterpart and named it MdHDA6 (Fig. 1B). Moreover, the phylogenetic analysis and multiple alignments were also performed by HDA6 protein sequences from different species (Supplemental Fig. S1). The results showed that MdHDA6 was closest to the Prunus L. HDA6, which belongs to the rosaceous plants (Supplemental Fig. S1A). The multiple alignments indicated that HDA6 proteins contained a conserved hist-deacetyl domain which could be crucial for the histone deacetylase activity among these species (Supplemental Fig. S1B).
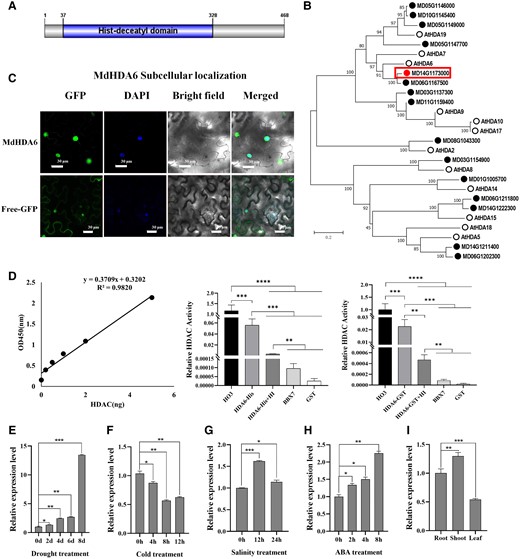
Characterization of apple histone deacetylase MdHDA6 and its expression profiles analysis. A) Domain architecture of MdHDA6 protein structure. Blue block denotes the hist-deacetyl domain. B) Phylogenetic analysis of HDA families in Arabidopsis and apple. The tree was constructed using the Neighbor-Joining method with the MEGA program. C) The subcellular localization of MdHDA6-GFP fusion protein was driven by vector pGWB405-MdHDA6-GFP and the GFP control was driven by the empty vector pGWB405-GFP. Bars = 30 μm. D) Detection of histone deacetylase activity of MdHDA6 in vitro. The recombinant protein MdHDA6-HIS and MdHDA6-GST, as well as the non-HDAC protein BBX7 (as the negative control) were induced and purified and then submitted to the HDAC Activity Assay Kit (Epigentek) following the manufacturer's instructions. The HO3 is the HDAC assay standard and is also the positive control. We also added the TSA (an inhibitor of HDAC activity) in the MdHDA6 protein samples (MdHDA6-HIS + HI or MdHDA6-GST + HI) to verify the deacetylation activity of the MdHDA6. The non-HDAC protein BBX7 (a transcription factor) and GST were set as negative controls. The activity of positive control HO3 was the internal control (setting as “1” value) and other samples were compared to the HO3. The error bar represents the standard error (n = 3). One-way ANOVA (Tukey's test) was performed and statistically significant differences were indicated by **P < 0.01; ***P < 0.001; ****P < 0.0001. E-H) Expression patterns of MdHDA6 in response to drought (E), cold (F), salinity (G), and ABA treatment (H). The apple seedlings were under drought treatment for 0, 2, 4, 6, and 8 d. The apple seedlings were treated at 4 °C for 0, 4, 8, and 12, and 200 mm NaCl for 0, 12, and 24 h, respectively. The apple leaves were treated with 100 mm ABA for 0, 2, 4, and 8 h. I) Expression pattern of MdHDA6 in apple shoot, root, and leaves. The malate dehydrogenase (MdMDH) was used as the internal reference gene. d, day; h, hour; ABA, abscisic acid; HI, HDAC inhibitor. Error bars indicate SD (n = 3 in E to I). One-way ANOVA (Tukey's test) was performed and statistically significant differences were indicated by *P < 0.05; **P < 0.01; ***P < 0.001; ****P < 0.0001.
To determine the subcellular localization of MdHDA6, we transiently expressed MdHDA6-GFP fusion protein and empty GFP control driven by CaMV35S promoter in Nicotiana benthamiana. The results indicated that MdHDA6 localized in the nucleus (Fig. 1C). Since MdHDA6 is a predicted apple histone deacetylase based on the sequence homology, we further verified the histone deacetylation activity of MdHDA6 in vitro (Fig. 1D). The MdHDA6-His and MdHDA6-GST (Glutathione S-transferase) fusion protein were induced and purified, then submitted to the HDAC Activity Assay Kit following manufacturer's instructions. The HO3 was the positive control with histone deacetylation activity provided by the Kit. The results showed that the HDAC activity of MdHDA6-His (and MdHDA6-GST) was lower than the positive control HO3 and significantly higher than the negative control proteins (BBX7, a zinc-finger protein B-BOX7 as the non-HDAC protein, and GST) (Fig. 1D). After adding the TrichostatinA (TSA, an inhibitor of HDAC activity) in the MdHDA6 protein samples (HDA6-His-HI and HDA-GST-HI), the HDAC activities were significantly lower than that of the MdHDA6 proteins (Fig. 1D). These results indicate that MdHDA6 indeed has the histone deacetylation activity in vitro. To investigate the potential role of MdHDA6 in response to abiotic stresses, we performed MdHDA6 expression analyses in response to drought, cold, salinity, and exogenous ABA treatment (Fig. 1, E to I). The results showed that drought and ABA treatment considerably induced the MdHDA6 expression (Fig. 1, E and H). In contrast, cold treatment significantly decreased MdHDA6 expression (Fig. 1F). After 12 h of 200 mm NaCl treatment, the MdHDA6 mRNA abundance first increased about 1.6-fold and then decreased to the nearly control levels after 24 h (Fig. 1G). Additionally, the MdHDA6 expression was highest in the shoots and lowest in the leaves (Fig. 1I). Taken together, these results indicate that MdHDA6 has histone deacetylation activity in vitro and is possibly involved in the regulation of apple response to abiotic stresses.
MdHDA6 negatively regulates drought response and adaption in apple
To uncover the biological function of MdHDA6 in response to drought stress, we first generated 3 MdHDA6 over-expression (MdHDA6-OE) transgenic apple lines, named OE#1, OE#2, and OE#3 (Fig. 2A). The MdHDA6 expression levels of MdHDA6-OE lines were 5 to 8 times higher than the wild-type (GL-3) (Fig. 2B). Then, we adopted GL-3 and MdHDA6-OE plants for short-term drought treatment and evaluated their drought-resistance phenotypes (Fig. 2, C to K). As shown in Fig. 2C, the MdHDA6-OE plants displayed impaired drought tolerance compared with GL-3 (Fig. 2C). The water loss of detached leaves in MdHDA6-OE plants was substantially higher than in GL-3 (Fig. 2D), indicating faster water loss in MdHDA6-OE plants. Correspondingly, the leaf relative water contents (RWC) of MdHDA6-OE plants were significantly lower than that in GL-3 under drought treatment and presented no differences under normal conditions (Fig. 2E). The further survival rates of MdHDA6-OE plants were also distinctly lower than that in the GL-3 under drought treatment (Fig. 2F), indicating that MdHDA6-OE plants were more sensitive to drought. The photosynthetic rates of MdHDA6-OE plants were significantly lower than GL-3 plants under drought stress (Fig. 2G). On the contrary, the extent of ion leakage in MdHDA6-OE plants was markedly greater than in GL-3 plants under drought stress, suggesting that the cell membranes of MdHDA6-OE plants were more damaged under drought stress (Fig. 2H). Additionally, the MdHDA6-OE plants accumulated more Malondialdehyde (MDA) and hydrogen peroxide (H2O2) contents than GL-3 under drought conditions (Fig. 2, I and J). Correspondingly, the Diaminobenzidine (DAB) staining also showed that the drought treatment induced more H2O2 accumulations in MdHDA6-OE plants than in GL-3 (Fig. 2K). These results indicated that MdHDA6-OE plants were more sensitive to drought stress than wild-type GL-3.
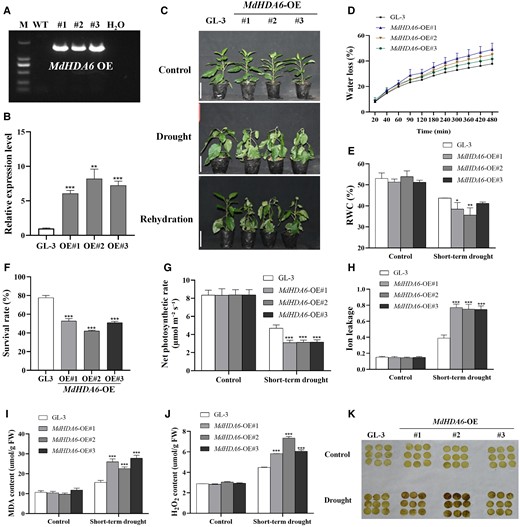
Over-expression of MdHDA6 reduced the drought tolerance in apple. A) Identification of MdHDA6 OE transgenic lines at DNA level. M: marker; WT: wild-type apple plants (GL-3); #1, #2, and #3: 3 MdHDA6-OE transgenic lines 1, 2, 3; H2O: Negative control, we used H2O as a template for the PCR reaction to be a negative control. B) Identification of MdHDA6-OE lines at RNA level. MdMDH was used as the internal reference gene. Error bars indicate SD (n = 3). C) Phenotypes of GL-3 (Wild-type) and MdHDA6-OE transgenic plants. Bars = 5 cm. Three-month-old plants were treated under drought for 14 d, and then rewatered for 7 d. D) Water loss of detached leaves from GL-3 and MdHDA6-OE plants at 25 °C. Data are mean ± SD (n = 6). E) Leaf relative water content (RWC) of GL-3 and MdHDA6-OE plants under drought. Data are mean ± SD (n = 6). F) Survival rates of GL-3 and 3 independent MdHDA6-OE lines in (C). Data are mean ± SD (n = 3). At least 20 seedlings were used per line in each biological replicate. G) Photosynthesis rate analysis of GL-3 and MdHDA6-OE plants under drought. Data are mean ± SD (n = 9). H) Leaf electrolyte leakage assays of GL-3 and MdHDA6-OE plants under drought treatment. Data are mean ± SD (n = 5). Detection of MDA (I) and H2O2 (J) contents in GL-3 and MdHDA6-OE plants under drought treatment. Data are mean ± SD (n = 3). K) DAB staining was performed to detect the H2O2 contents. MDA, malondialdehyde; H2O2, hydrogen peroxide. DAB, 3,30-DAB tetrahydrochloride. One-way ANOVA (Tukey's test) was performed and statistically significant differences were indicated by *P < 0.05; **P < 0.01; ***P < 0.001.
We then developed the MdHDA6 RNA interfering (MdHDA6-RNAi) transgenic apple plants and performed a phenotypic analysis under drought treatment (Fig. 3). As expected, the MdHDA6-RNAi plants exhibited enhanced drought tolerance than the GL-3 (Fig. 3), corresponding to the results of MdHDA6-OE plants. Similarly, 3 MdHDA6-RNAi transgenic lines were identified by PCR and RT-qPCR (Fig. 3, A and B). The phenotype analysis showed that MdHDA6-RNAi plants were more drought stress-tolerant and presented higher survival rates than GL-3 under drought (Fig. 3, C and D). Compared to GL-3 plants, the water loss of MdHDA6-RNAi plants was slower, and the leaf relative water content (RWC) was significantly higher under drought stress (Fig. 3, E and F). Also, the photosynthetic rate of MdHDA6-RNAi plants was significantly higher than the GL-3 plants under drought stress, with no differences under normal conditions (Fig. 3G). The corresponding ion leakage rate, MDA content, H2O2 content, and DAB staining of the MdHDA6-RNAi plants showed distinctly lower than that in GL-3 under drought (Fig. 3, H to K). These results indicated that down-regulated MdHDA6 expression enhanced drought tolerance in apple. Combined with the phenotypes of MdHDA6-OE plants, we conclude that MdHDA6 negatively regulates drought tolerance in apple.
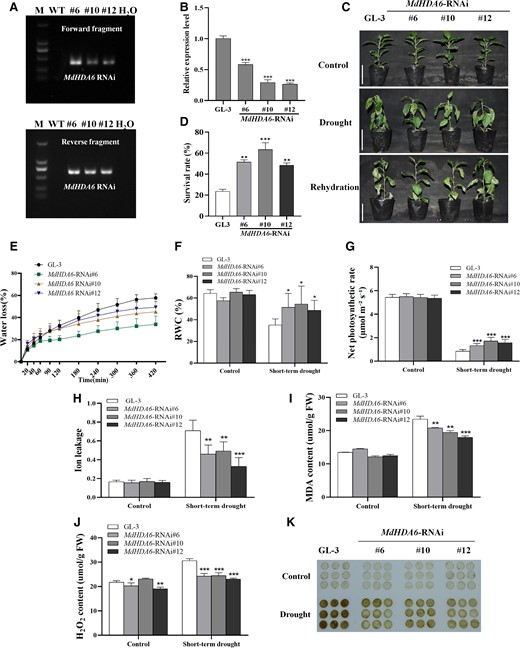
Down-regulation of MdHDA6 enhanced drought tolerance in apple. A) Identification of MdHDA6-RNAi transgenic lines at DNA level with 2 specific primers corresponding to the 2 RNAi fragments (Forward and Reverse fragments). M: marker; WT: wild-type apple plants (GL-3); #6, #10, #12: 3 MdHDA6-RNAi transgenic lines; H2O: Negative control, we used H2O as a template for the PCR reaction to be a negative control. B) Identification of MdHDA6 RNAi lines at RNA level. MdMDH was used as the internal reference gene. Error bars indicate SD (n = 3). C) Phenotypes of GL-3 (Wild-type) and MdHDA6-RNAi transgenic plants. Bars = 5 cm. Three-month-old plants were treated under drought for 14 d, and then rewatered for 3 d. D) Survival rates of GL-3 and 3 independent MdHDA6-RNAi lines in (C). Data are mean ± SD (n = 3). At least 18 seedlings were used per line in each biological replicate. E) Water loss of detached leaves from GL-3 and MdHDA6-RNAi plants at 25 °C. Data are mean ± SD (n = 6). F) Leaf relative water content (RWC) of GL-3 and MdHDA6-RNAi plants under drought. Data are mean ± SD (n = 6). G) Photosynthesis rate analysis of GL-3 and MdHDA6-RNAi plants under drought. Data are mean ± SD (n = 9). H) Leaf electrolyte leakage assays of GL-3 and MdHDA6-RNAi plants under drought treatment. Data are mean ± SD (n = 7). Detection of MDA (I) and H2O2 (J) contents in GL-3 and MdHDA6-RNAi plants under drought treatment. Data are mean ± SD (n = 3). K) DAB staining was performed to detect the H2O2 contents. MDA, malondialdehyde; H2O2, hydrogen peroxide. DAB, 3,30-DAB tetrahydrochloride. One-way ANOVA (Tukey's test) was performed and statistically significant differences were indicated by *P < 0.05; **P < 0.01; ***P < 0.001.
Since the apple trees are planted in the field for years, and apple orchards always suffer water deficits for extended periods, the apple trees are always under long-term drought stress. To explore the regulatory role of MdHDA6 in drought adaption, we performed a long-term drought treatment (100 days of water deficit) on MdHDA6-OE, MdHDA6-RNAi, and GL-3 (wild type) plants (Supplemental Fig. S2A). The Chlorophyll fluorescence (Fv/Fm) values and the photosynthetic rates of MdHDA6-OE lines were significantly lower, and MdHDA6-RNAi lines were significantly higher than in GL-3 plants (Supplemental Fig. S2, B and C). Similarly, the stomatal density of MdHDA6-OE lines was significantly lower, and the MdHDA6-RNAi lines were higher than in GL-3 plants (Supplemental Fig. S2D). The further WUE analysis showed that the WUE of MdHDA6-RNAi lines was higher than GL-3, and no significant differences were observed between MdHDA6-OE lines and GL-3 under normal conditions. Compared with normal conditions, long-term drought treatment enhanced the WUE. The WUE of MdHDA6-OE lines and MdHDA6-RNAi lines showed lower and higher variation than GL-3, respectively (Supplemental Fig. S2E), suggesting that MdHDA6 negatively regulates WUE in apple under long-term drought treatment. Moreover, the root-to-shoot ratios of apple plants under long-term drought treatment in MdHDA6-RNAi lines were significantly higher than that of GL-3 (Supplemental Fig. S2F). These results suggested that MdHDA6 could also negatively regulate drought adaption in apple under long-term drought stress.
Transcriptomic analysis reveals MdHDA6 disturbing the drought-responsive gene expression in response to drought stress
To investigate the global transcriptional regulations of MdHDA6 in response to drought, we performed transcriptomic analysis of the MdHDA6-OE#2 and GL-3 lines under drought treatment (Fig. 4 and Supplemental Fig. S3). Under normal conditions, 257 differentially expressed genes (DEGs), including 150 up-regulated genes and 107 down-regulated genes, were identified in MdHDA6-OE versus (vs.) GL-3 comparison, implying that MdHDA6 disturbed these genes’ expression under normal conditions (Fig. 4A). For drought treatment, drought stress disturbed 5,406 genes expression (1923 up-regulated genes; 3,483 down-regulated genes) in wild-type GL-3 under drought (DGL-3 vs. GL-3), while 13087 DEGs (6,026 up-regulated genes; 7,061 down-regulated genes) were identified in DMdHDA6-OE vs. MdHDA6-OE (Fig. 4A and Supplemental Figs. S3, A and B). Drought induced much more DEGs in MdHDA6-OE than in GL-3 plants. This suggested that MdHDA6-OE plants were more drought-sensitive than GL-3 plants, corresponding to the phenotype of MdHDA6-OE plants under drought (Fig. 2). When we compared DMdHDA6-OE with DGL-3, only 915 DEGs (707 up-regulated and 208 down-regulated genes) were identified (Fig. 4A), less than the number of DEGs among DGL-3 vs. GL-3 and DMdHDA6-OE vs. MdHDA6-OE. This meant that abundant drought-responsive genes were commonly induced in MdHDA6-OE and GL-3 under drought. After drought treatments, DMdHDA6-OE vs. DGL-3 displayed 915 DEGs (707 up-regulated and 208 down-regulated genes), implying that these genes differed in MdHDA6-OE and GL-3 plants in response to drought. The Venn diagrams show that most of the DEGs (4,665 DEGs in total of 5,406 DEGs) in DGL-3 vs. GL-3 were commonly shared in DMdHDA6-OE vs. MdHDA6-OE (Fig. 4, B and C), indicating that most of the drought-responsive genes in GL-3 under drought were also disturbed in MdHDA6-OE plants under drought. However, there are also 7887 genes specifically differentially expressed in MdHDA6-OE under drought but not in GL-3 under drought (Fig. 4, B and C).
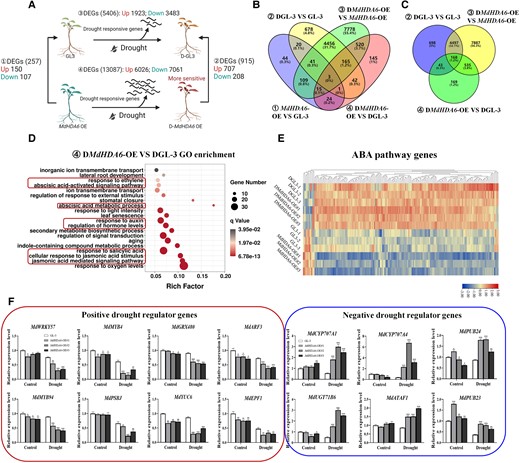
Transcriptomic analysis of MdHDA6-OE and GL-3 plants in response to drought. A) Diagram of differently expressed genes (DEGs) among GL-3, drought-treated GL-3 (DGL-3), MdHDA6-OE, and drought-treated MdHDA6-OE (DMdHDA6-OE). B and C) Venn diagrams of DEGs from different comparisons including MdHDA6-OE vs. GL-3, DGL-3 vs GL-3, DMdHDA6-OE vs. MdHDA6-OE, and DMdHDA6-OE vs. DGL-3. D) GO enrichment of DEGs from DMdHDA6-OE vs. DGL-3. E) Heatmap of expression changes of ABA pathways genes among these 6 samples. F) RT-qPCR analysis of drought regulator genes in MdHDA6-OE and GL-3 plants under normal and drought conditions. MdMDH was used as the internal reference gene. The error bar represents the standard error (n = 3). ABA, abscisic acid. One-way ANOVA (Tukey's test) was performed and statistically significant differences were indicated by *P < 0.05; **P < 0.01; ***P < 0.001.
To clarify the potential functions of drought-responsive genes affected by MdHDA6, we performed gene ontology (GO) enrichment analyses of DMdHDA6-OE vs. DGL-3 (Fig. 4D), DGL-3 vs. GL-3 and DMdHDA6-OE vs. MdHDA6-OE (Supplemental Fig. S3C). For DGL-3 vs. GL-3 and DMdHDA6-OE vs. MdHDA6-OE, DEGs showed similar GO assignment terms, including photosynthesis, fatty acid metabolic process, response to oxygen level, and cell death (Supplemental Fig. S3C). Interestingly, multiple hormonal pathways, such as jasmonic acid (JA), ethylene, and salicylic acid, were also substantially enriched in DGL-3 vs. GL-3 and DMdHDA6-OE vs. MdHDA6-OE. Notably, many more hormonal pathways were disturbed in DMdHDA6-OE vs. DGL-3, including ABA, JA, ethylene, salicylic acid, and auxins (Fig. 4D), suggesting that MdHDA6 might regulate the hormonal pathways to affect apple's drought tolerance. Next, we screened the ABA pathway genes and examined their expression changes among these samples. Most ABA pathway genes were up-regulated by drought and some were disturbed by MdHDA6 (Fig. 4E). Moreover, we also screened transcription factor genes in apple; their expression changes are presented as a heatmap in Supplemental Fig. S3D.
In addition, from the DEG catalog comparison of DMdHDA6-OE with DGL-3, we selected 8 positive and 6 negative drought-regulated genes and verified their expression changes by RT-qPCR (Fig. 4F). The 8 positive drought-regulated genes were homologs of Arabidopsis WRKY57, MYB4, glutaredoxin-C9 (GRX480), auxin response factor 3(ARF3), MYB94, Photosystem II protein (PSBJ), indole-3-pyruvate monooxygenase 6 (YUC6), and EPIDERMAL PATTERNING FACTOR 1 (EPF1), previously proven to positively regulate drought resistance in plants (Pasquali et al. 2008; Jiang et al. 2012; Lee et al. 2014; Cha et al. 2015; Jiang et al. 2016; Lee et al. 2016; Wang et al. 2016; Zheng et al. 2018; Cui et al. 2019; Li et al. 2019a). The 6 negative drought-regulated genes were homologous to Arabidopsis CYP707A1/4, UDP-glycosyltransferase 71A15 (UGT71B6), E3 ubiquitin-protein ligase (PUB23/24), and NAC (NAM:no apical meristem, a NAC protein; ATAF1/2; CUC2: NAMCUP-SHAPED COTYLEDON 1, a NAC protein) domain-containing protein (ATAF1), previously proven to negatively regulate drought resistance in plants (Okamoto et al. 2006; Priest et al. 2006; Lu et al. 2007; Cho et al. 2008). Interestingly, the 8 positive drought-regulated genes were down-regulated in DMdHDA6-OE vs. DGL-3 from the RNA-seq data, and their expression levels were also obviously lower in MdHDA6-OE plants than that in GL-3 under drought based on RT-qPCR data. On the contrary, the 6 negative drought-regulated genes up-regulated in the DMdHDA6-OE vs. DGL-3 RNA-seq data were confirmed by RT-qPCR to be significantly up-regulated in MdHDA6-OE compared with GL-3 under drought treatment (Fig. 4F). These results indicated that MdHDA6 could repress the expression of positive drought regulators and activate the expression of negative drought regulators to negatively regulate drought tolerance in MdHDA6-OE plants.
MdHDA6 mediates histone deacetylation of drought-responsive genes to negatively regulate drought tolerance in apple
Since MdHDA6 is a histone deacetylase and we have proved its histone deacetylation activity in vitro (Fig. 1D), it promotes us to verify if MdHDA6 performs histone deacetylation on drought-related genes to negatively regulate drought tolerance (Fig. 5). First, we determined the histone acetylation levels in MdHDA6-OE and GL-3 plants using anti-H3ac, anti-H3K9ac, and anti-H3K14ac antibodies to verify the histone deacetylation activity of MdHDA6 in vivo (Fig. 5, A and B). The results showed that the H3 histone global acetylation levels were significantly lower in MdHDA6-OE than in GL-3 plants. The global acetylation levels of H3K9ac and H3K14ac were also significantly decreased in some MdHDA6-OE plants than in GL-3 plants (Fig. 5, A and B). These results indicated that MdHDA6 could be globally deacylated on the H3, specifically on H3K9ac and H3K14ac residues.
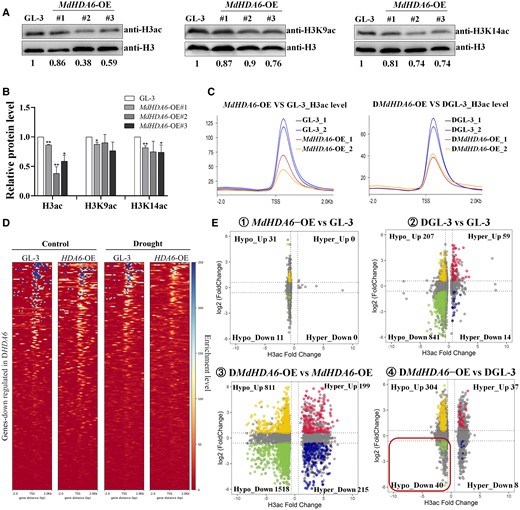
MdHDA6 mediates histone deacetylation on histone H3 and anti-H3ac Chip-seq analysis of MdHDA6-OE and GL-3 plants in response to drought. A) Western blot analysis of H3ac, H3K9ac and H3K14ac levels in MdHDA6-OE and GL-3 plants. Histone extracted from 3-mo-old seedlings of MdHDA6-OE lines and GL-3 were fractionated by 12% SDS-PAGE, blotted, and immunodetected by using specific antibodies (anti-H3ac, anti-H3K9ac, and anti-H3K14ac). All immunoblots were replicated at least 3 times. B) Statistical analysis of bands in Fig. 5A. Immunoblot signals relative to the GL-3 (set as 1) were quantified. Each value represents the mean SE of 3 biological replicates. One-way ANOVA (Tukey's test) was performed and statistically significant differences were indicated by *P < 0.05, **P < 0.01. C) The distribution of H3ac enrichment around the TSS region (upstream 2 kb to downstream 2 kb) in MdHDA6-OE and GL-3 plants under normal (left) and drought (right) conditions. D) Heatmaps of the TSS region of MdHDA6-repressed genes ranked by H3ac levels in the MdHDA6-OE and GL-3 under normal and drought treatment. E) Scatterplots presenting pairwise comparisons of H3 acetylation fold change (x-axis) associated with expression alterations (y-axis) in the MdHDA6-OE and GL-3 under normal and drought conditions.
To explore if MdHDA6 could perform histone deacetylation around specific drought-related genes, we further performed the Chromatin Immunoprecipitation sequencing (Chip-seq) using the anti-H3ac antibody in MdHDA6-OE and GL-3 plants under drought stress (Fig. 5, C to F and Supplemental Fig. S4). Consistent with the Western blot results, the Chip-seq data showed lower global H3 acetylation (H3ac) levels in MdHDA6-OE plants than in GL-3 plants under normal and drought conditions (Fig. 5C). To verify changes in H3ac enrichment on MdHDA6-repressed genes, we first screened the down-regulated DEGs among DMdHDA6-OE vs. DGL-3. The H3ac distributions among these genes, displayed as the heatmaps in Fig. 5D, suggest that the changes in H3ac enrichment might regulate the examined MdHDA6-repressed genes. The H3ac peaks were located in the promoter region within 1 kb upstream of the start codon (Supplemental Fig. S4A). The GO term assignments of differentially H3ac-modified genes showed that drought treatment disturbed “cellular response to ABA stimulus” and “ABA activated signaling pathway” (Supplemental Fig. S4B), corresponding to the RNA-seq data (Fig. 4, D and E). These results implied that MdHDA6 could affect the expression levels of ABA-responsive genes and their H3 acetylation levels.
To further identify the MdHDA6-mediated histone deacetylated genes, we combined the anti-H3ac Chip-seq data with the RNA-seq data to identify the DEGs affected by MdHDA6-mediated histone deacetylation (Fig. 5E). Considering that MdHDA6 can catalyze histone deacetylation and repress gene expression, we focused on the down-regulated DEGs with decreased H3ac levels among DMdHDA6-OE vs. DGL-3 comparison (“Hypo_down 40” in Fig. 5E; Hypo_down means Hypo-acetylated and down-regulated genes). A total of 40 gene dot plots were located on the Hypo_down region in the DMdHDA6-OE vs. DGL-3 comparison. Next, 5 positive drought-regulated genes, ARF3, MYB4, WRKY57, YUC6, and GRX480, from these 40 gene catalogs, were selected and performed Chip-qPCR (anti-H3ac) and RT-qPCR to validate the H3ac and expression alterations in MdHDA6-OE and GL-3 under drought (Fig. 6). Figure 6 shows the Integrative Genomics Viewer (IGV) screenshots of H3ac enrichment changes associated with gene expression alterations measured by ChIP-seq and RNA-seq data. The Integrative Genomics Viewer results showed that the 5 selected genes presented lower H3ac enrichment in MdHDA6-OE plants than in GL-3 under normal conditions, consistent with the H3 deacetylation function of MdHDA6 (Figs. 6 and 5A). After drought treatment, the H3ac enrichment was distinctly down-regulated in MdHDA6-OE plants than that in GL-3, suggesting that the drought stress enhanced the decrease of H3ac in these gene regions. Consistent with the IGV results, anti-H3ac ChIP-qPCR experiments also demonstrated that the H3ac levels of MdHDA6-OE plants were significantly lower than GL-3 plants under normal conditions; drought stress enhanced the down-regulation of H3ac around these gene regions (“H3ac enrichment” in Fig. 6). Histone deacetylation is associated with gene inactivation; therefore, decreasing H3 acetylation around these drought-related genes might lead to gene repression. Correspondingly, the RNA-seq and the RT-qPCR results verified that the corresponding expression levels of these genes in MdHDA6-OE plants were significantly lower than in GL-3, especially under the drought treatment (Fig. 6). Taken together, our results indicate that MdHDA6 can repress drought-responsive genes by deacetylating H3ac around drought-responsive genes to negatively regulate drought tolerance in apple.
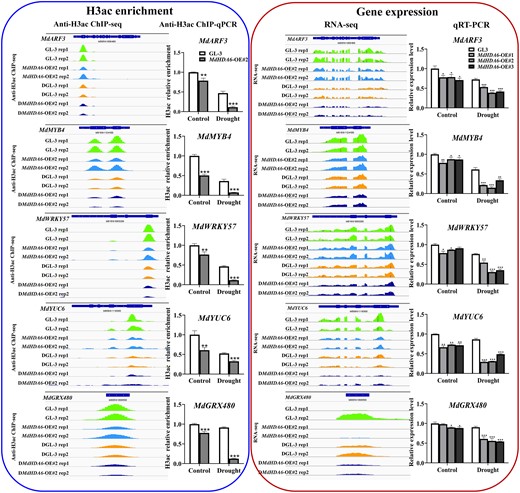
Validation of H3 acetylation changes (left) and expression alterations (right) on selected drought-related genes by ChIP-qPCR and RT-qPCR. The IGV screenshots of H3 acetylation enrichment generated by ChIP-seq data were presented on the left, and the ChIP-qPCR (anti-H3ac) validations were displayed on the right (blue box). H3 acetylation relative enrichment of MdARF3, MdMYB4, MdWRKY57, MdYUC6, and MdGRX480 in OE transgenic lines and GL-3 plants under control or drought conditions. Error bars indicate SD (n = 3). The red box showed the IGV screenshots of gene expression changes generated by RNA-seq data (left), and the RT-qPCR validations (right). Transcript levels of MdARF3, MdMYB4, MdWRKY57, MdYUC6, and MdGRX480 in OE transgenic lines and GL-3 plants under control or drought conditions. Error bars indicate SD (n = 3). One-way ANOVA (Tukey's test) was performed and statistically significant differences were indicated by *P < 0.05; **P < 0.01; ***P < 0.001.
MdHDA6 interacts with ABSCISIC ACID-INSENSITIVE 5 (ABI5) in vivo and in vitro
To explore the molecular mechanism of MdHDA6 in regulating drought response, we used MdHDA6-BD as the bait in a yeast 2-hybrid (Y2H) library screening. We found that an ABA signaling regulator, ABSCISIC ACID-INSENSITIVE 5 (MdABI5), was a potential MdHDA6-interacting protein. ABI5 plays a vital role in the ABA pathway and is involved in plants’ response to drought (Mittal et al. 2014; Skubacz et al. 2016; An et al. 2021). Transcriptomic results also showed that over-expression of MdHDA6 could affect the ABA pathway genes expression and H3 acetylation levels under drought stress (Fig. 4, D and E, Supplemental Fig. S4B). Therefore, we selected MdABI5 as a candidate interacting protein and further verified its interaction with MdHDA6 by Y2H (Fig. 7B), Bimolecular Fluorescence Complementation (BiFC) (Fig. 7C), Split-LUC (Fig. 7D), and Co-Immunoprecipitation (Co-IP) (Fig. 7E) assays. To identify the key region of interaction, we constructed the Y2H vectors containing the truncation of MdHDA6 and MdABI5 according to their conserved domains (Fig. 7A) and verified their interactions (Fig. 7B). The results showed that the N-terminal of MdHDA6 (MdHDA6-N in Fig. 7A, including the His-deacetyl domain), was necessary for the MdHDA6-MdABI5 interaction. However, the N-terminal of MdABI5 (MdABI5-N in Fig. 7A) without the basic region leucin zipper domain was required for the interaction (Fig. 7B). BiFC and Split-LUC assays were further performed to verify the interaction and the fluorescent signals were only observed when MdHDA6 and MdABI5 were co-expressed (Fig. 7, C and D). In addition, the Co-IP assay was used to confirm the MdHDA6 and MdABI5 interaction (Fig. 7E). These results indicate that MdHDA6 physically interacts with MdABI5.

MdHDA6 directly interacts with MdABI5. A) Truncation schematic diagram of MdHDA6 and MdABI5. B) Yeast 2-hybrid (Y2H) assays of MdHDA6 and MdABI5, as well as their truncated proteins. C) BiFC assay to verify the interaction of MdHDA6 and MdABI5. Bars = 100 μm. D) Split-LUC assay was applied to verify the interaction of MdHDA6 and MdABI5. E) Co-IP assay was used to validate the interaction of MdHDA6 and MdABI5. MdHDA6 fused with GFP and MdABI5 with MYC (Myelocytomatosis) tags were transiently expressed in tobacco. The anti-MYC antibody was used for immunoprecipitation and the anti-MYC and anti-GFP antibodies were used for western blot assay.
Interestingly, the latest study in apple revealed that MdABI5 positively regulates ABA signaling and drought resistance by directly binding to the promoters of ABA-related genes MdEM6 and MdRD29A, enhancing drought tolerance (Liu et al. 2022). These results prompt us to explore how MdHDA6 coupled with MdABI5 cooperatively regulated drought response in apple. Since MdHDA6 has histone deacetylation functions, it could be possible for MdHDA6 to perform histone deacetylation on the MdABI5 region. So, we investigated the H3ac enrichment in the MdABI5 gene region according to the H3ac ChIP-seq data (Fig. 8A). The results showed that the H3ac levels of MdHDA6-OE lines were substantially lower than that of GL-3 under normal conditions. However, no apparent changes were observed under drought treatment (Fig. 8A). The anti-H3K14ac ChIP-qPCR analysis also indicated that the MdHDA6-OE line H3K14ac level was lower than in GL-3. No differences were observed under drought treatment (Fig. 8B). Moreover, previous studies have demonstrated that HDA6 or HDA9 can perform deacetylation on protein lysine acetylation, such as TPL (An et al. 2022) and WKRY53 (Zheng et al. 2020). Therefore, we hypothesized that MdHDA6 could facilitate lysine deacetylation on the MdABI5 protein. Next, we used an antilysine-acetylation antibody to detect the lysine acetylation levels of MdABI5 in the MdHDA6-OE and GL-3 lines (Fig. 8C). Corresponding to the H3ac and H3K14ac results, the lysine acetylation levels of MdABI5 protein were decreased in the MdHDA6-OE lines compared to the GL-3 under normal conditions; however, no differences were observed under drought conditions (Fig. 8C). Also, the MdABI5 expression levels between MdHDA6-OE and GL-3 showed no differences under drought treatment (Fig. 8D). These results suggest that the over-expression of MdHDA6 could enhance the deacetylation of H3ac and H3K14ac sites around MdABI5, as well as the MdABI5 protein under normal conditions. However, the histone deacetylation around MdABI5 and protein deacetylation of MdABI5 showed no differences under drought stress in MdHDA6-OE plants compared to GL-3.
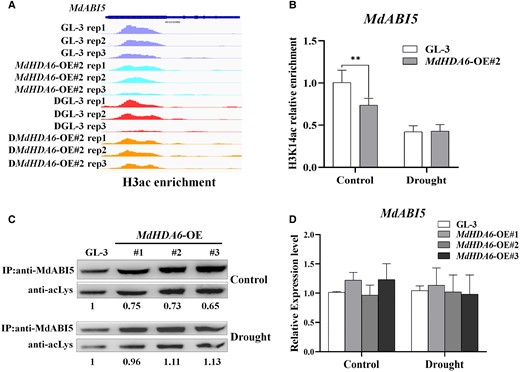
MdHDA6 can perform histone deacetylation around MdABI5 gene region and lysine deacetylation on MdABI5 protein under normal conditions but not under drought stress. A) The IGV screenshots of H3 acetylation enrichment around MdABI5 generated by ChIP-seq data in MdHDA6-OE and GL-3 plants under normal and drought conditions. B) ChIP-qPCR analysis of H3K14 acetylation around MdABI5 in MdHDA6-OE and GL-3 plants under normal and drought conditions. Error bars indicate SD (n = 3). C) Lysine acetylation levels of MdABI5 in MdHDA6-OE and GL-3 plants under normal and drought conditions. MdABI5 was immunoprecipitated from the different genotypes and analyzed by immunoblotting with an antibody to acetylated lysine (anti-acLys). Anti-MdABI5 was used as a loading control. The bands were quantified with ImageJ software. D) The relative expression levels of MdABI5 in MdHDA6-OE and GL-3 plants under normal and drought conditions. MdMDH was used as the internal reference gene. Error bars indicate SD (n = 3). One-way ANOVA (Tukey's test) was performed and statistically significant differences were indicated by **P < 0.01.
MdHDA6 represses the expression of MdABI5-downstream genes by mediating histone deacetylation around them
Since MdHDA6 can directly interact with MdABI5 (Fig. 7), it raises the question if MdHDA6 can regulate the MdABI5-downstream genes by histone deacetylation. The latest study has revealed that over-expression of MdABI5 can active ABA-related genes (9-cis-epoxycarotenoid dioxygenase (MdNCED3), MdEM6, MdRD29A, and MdRD29B) and drought-related genes (MdRD29A, MdRD29B, DEHYDRATION RESPONSE ELEMENT-BINDING PROTEIN 2A (MdDREB2A), catalase 1 (MdCAT1), and poly ADP-ribose polymerase (MdSOD1)) (Liu et al. 2022). Further analysis verified that MdABI5 could directly bind to the MdEM6 and MdRD29A promoters and activate their expression (Liu et al. 2022). To explore if MdHDA6 performs histone deacetylation on MdABI5-regulated genes, we first investigated the H3ac levels of MdABI5-regulated genes based on H3ac ChIP-seq data (Fig. 9A). The results suggested that the H3ac levels of MdNCED3, MdRD29B, MdDREB2A, and MdRD29A were decreased in MdHDA6-OE lines compared with GL-3 under normal and drought conditions (Fig. 9A). The further H3K14ac ChIP-qPCR analysis also indicated that the H3K14ac levels of MdEM6, MdCAT1, MdNCED3, MdRD29B, MdDREB2A, and MdRD29A decreased in the MdHDA6-OE lines compared with GL-3, especially under drought treatment (Fig. 9B). The corresponding expression levels of these genes showed significantly lower in MdHDA6-OE lines than that in GL-3 under drought conditions. At the same time, no obvious differences were observed under normal conditions (Fig. 9C). Together, these results suggest that MdHDA6 can mediate histone deacetylation on MdABI5-regulated genes and represses their gene expression under drought conditions.
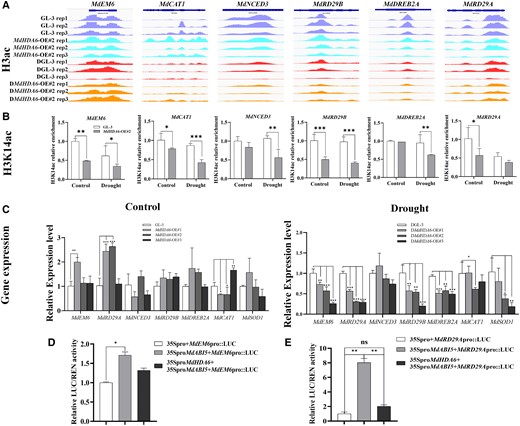
MdHDA6 mediates histone deacetylation on MdABI5-regulated genes and represses their expression. A) The IGV screenshots of H3 acetylation enrichment around MdEM6, MdCAT1, MdNCED3, MdRD29B, MdDREB2A, and MdRD29A generated by ChIP-seq data in MdHDA6-OE and GL-3 plants under normal and drought conditions. B) ChIP-qPCR analysis of H3K14 acetylation around MdEM6, MdCAT1, MdNCED3, MdRD29B, MdDREB2A, and MdRD29A in MdHDA6-OE and GL-3 plants under normal and drought conditions. Error bars indicate SD (n = 3). C) The relative expression levels of MdEM6, MdCAT1, MdNCED3, MdRD29B, MdDREB2A, and MdRD29A in MdHDA6-OE and GL-3 plants under normal and drought conditions. MdMDH was used as the internal reference gene. Error bars indicate SD (n = 3). D-E) Relative LUC/REN activity detected from the effects of 35Spro::MdABI5, 35Spro::MdHDA6, and 35Spro::MdABI5 + 35Spro::MdHDA6 on the expression of MdEM6pro::LUC (D) and MdRD29Apro::LUC (E). The values in 35Spro + MdEM6pro::Luc and 35Spro + MdRD29Apro::Luc samples were set to 1, respectively. Error bars indicate SD (n = 3). One-way ANOVA (Tukey's test) was performed and statistically significant differences were indicated by *P < 0.05; **P < 0.01; ***P < 0.001.
Moreover, the previous study also proved that MdABI5 could directly bind to the promoter of MdEM6 and MdRD29A and activate gene expression (Liu et al. 2022). To further investigate the involvement of MdHDA6 in MdABI5 activating MdEM6 and MdRD29A process, we performed dual-luciferase assays by adding the MdHDA6 protein into MdABI5 activating MdEM6 and MdRD29A promoters (Fig. 9, D and E). Indeed, MdABI5 protein alone can significantly activate the promoter of MdEM6 and MdRD29A. When we co-expressed MdHDA6 and MdABI5, the relative LUC/REN (Rellina) activity presented a decreased trend on the MdEM6 promoter, although no significant differences were observed (Fig. 9D). However, it was noticeable that the activation of the MdRD29A promoter driven by MdABI5 was blocked by the addition of MdHDA6 protein, suggesting that MdHDA6 antagonized the activation of MdABI5 on the MdRD29A expression (Fig. 9E).
A working model is proposed in Fig. 10 based on the above results. On the one hand, MdHDA6 can mediate histone deacetylation around the drought-positive regulator genes and represses their expression to negatively regulate drought resistance in apple. On the other hand, MdHDA6 can directly interact with transcriptional factor MdABI5 and facilitate histone deacetylation on MdABI5-downstream genes, leading to gene inactivation and reducing drought tolerance in apple. Furthermore, MdHDA6 can inhibit the activation of MdABI5 on its binding drought-responsive genes MdRD29A to negatively regulate drought tolerance in apple (Fig. 10).
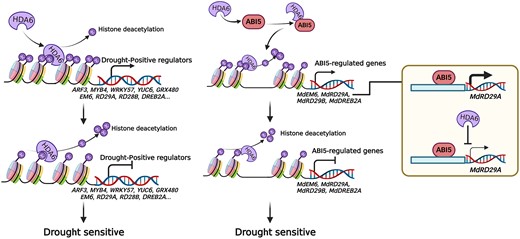
A working model of MdHDA6 negatively regulating drought resistance in apple. On one hand, MdHDA6 mediates histone deacetylation around the drought-positive regulator genes and represses their expression to negatively regulate drought resistance in apple. On the other hand, MdHDA6 can directly interact with transcriptional factor MdABI5 and facilitate histone deacetylation on MdABI5-downstream drought-responsive genes, leading the gene inactivation, which results in the reduce of drought tolerance in apple. Furthermore, MdHDA6 can inhibit the activation of MdABI5 on its binding drought-responsive genes MdRD29A to negatively regulate drought tolerance in apple.
Discussion
Studies have revealed that the histone acetylation dynamics controlled by HATs and HDACs play multiple roles in plant development and stress response processes (Liu et al. 2014; Chen et al. 2020). As a member of the HDA family, HDA6 is reportedly involved in abiotic stress and ABA responses. For example, an early study in Arabidopsis has indicated that HDA6 interacts with plant-specific histone deacetylase HD2C and hda6, hd2c-1, and hda6/hd2c-1 mutants displayed increased sensitivity to ABA and NaCl during seed germination, suggesting that HDA6 is involved in ABA signaling (Luo et al. 2012). They found that the H3K9K14ac levels of AtABI1, AtABI2, and ethylene response factor 4 (AtERF4) promoters were increased, and their expression levels were also increased in hda6, hd2c-1, and hda6/hd2c-1 mutants, indicating AtHDA6 can modulate histone deacetylation on AtABI1, AtABI2, and AtERF4 affecting their expression (Luo et al. 2012). A further study has verified that HDA6 inhibited acetate biosynthesis by H4 deacetylation on the acetate biosynthetic pathway genes PDC1 and ALDH2B7 to negatively regulate drought tolerance in Arabidopsis. In contrast, acetate acid can substantially enhance plant drought resistance (Kim et al. 2017). However, a recent study has revealed that Arabidopsis hda9 mutants are sensitive to drought stress and insensitive to ABA, indicating that HDA9 is a positive regulator in the drought response (Baek et al. 2020). Different members of the HDA family have opposite roles in plant drought resistance. Further analysis demonstrated that HDA9 and ABI4 formed a repressive complex to modulate the expression of key genes in ABA catabolic pathways, CYP707A1 and CYP707A2, by directly binding their promoters (Baek et al. 2020). Similarly, another study also showed that the HDA9-PWR-ABI4 histone deacetylase complex could suppress CYP707A1/2 genes and promote ABA accumulation in response to drought stress (Khan et al. 2020). Taken together, these studies provide insight that HDAs can modulate ABA signaling and drought tolerance by regulating ABA-related genes. In this study, we characterized a histone deacetylase MdHDA6 negatively regulating apple drought tolerance by catalyzing histone deacetylation on the drought-responsive genes (Fig. 6). Furthermore, we found that MdHDA6 could interact with ABA pathway transcriptional factor MdABI5 and MdHDA6 could facilitate histone deacetylation on MdABI5-downstream drought-related genes and repress their expression, which negatively contributed to the drought resistance in apple (Fig. 10). Our study uncovers a different regulatory mechanism of drought response in apple based on the function of MdHDA6-MdABI5 complex.
It has been well-studied that histone modifiers regulate biological processes by facilitating histone modification and modulating gene expression. However, a key point is how histone modifiers recognize their target genes or loci in the vast genomic sequence. A review has summarized the targeting mechanisms of histone modifiers: (i) Transcription factors (TFs)-mediated targeting: histone modifiers recognize their target genes by interacting with the DNA-binding TF or cofactors; (ii) Noncoding RNA-mediated targeting: histone modifiers recognize their target genes through interacting with lncRNAs, like PRC2; (iii) Self-targeting: histone modifiers themselves contain their DNA-binding domains and can directly bind DNA through their DNA-binding domains, like ZnF domain in histone methyltransferase (SUVR5) and REF6. Early studies found that HDA6 and HDA19 were recruited to the specific genes through the interactions of corepressors SAP18 or TPL with Ethylene-responsive element binding factor-associated Amphiphilic Repression motif-containing TFs, forming HDA6/19-cofactor-TFs corepression complexes to facilitate gene inactivation (Kagale and Rozwadowski 2011). However, a growing body of work has revealed that HDAs could directly interact with TFs and were recruited to the target loci via the TFs’ binding ability. For example, HDA9 can interact with ABI4 TF to regulate ABA homeostasis under drought stress (Baek et al. 2020). In apple, the MdHDA19-MdERF4 complex suppresses the apple fruit-ripening process by facilitating the histone deacetylation of fruit-ripening-related genes (Hu et al. 2022). Similarly, HDA9 can interact with WRKY53; they are mutual antagonists in regulating Arabidopsis stress response (Zheng et al. 2020). Notably, this study also found that WRKY53 was post-translationally modified by lysine acetylation, and HDA9 could remove lysine acetylation of WRKY53 protein, inhibiting WRKY53 transcription activity (Zheng et al. 2020). Another study also verified that HDA6 could remove the lysine acetylation from the repressor TPL protein, weaken the TPL-(Novel Interactor of jasmonate ZIM-domain (JAZ)) NINJA interaction, and inhibit the repression of TPL on the downstream target genes of the JA pathway, facilitating transcriptional activation (An et al. 2022). These results indicate that HDAs induce gene repression through direct or indirect interactions with TFs by facilitating histone deacetylation through TFs binding activity. Also, HDAs can perform protein lysine deacetylation of regulatory factors (like WRKY53 and TPL) to affect regulatory factors’ activities and play a different regulatory role in gene expression. This study demonstrates that MdHDA6 could directly interact with MdABI5 and MdHDA6 could facilitate histone deacetylation on MdABI5-downstream drought-responsive genes and repress their expression, reducing drought tolerance in apple (Fig. 9). Also, the over-expression of MdHDA6 could enhance the protein deacetylation on MdABI5 under normal conditions. Still, no changes under drought treatment (Fig. 8C). Similarly, the H3ac levels around the MdABI5 gene region were also substantially down-regulated in MdHDA6-OE plants compared with GL-3. Still, no apparent changes were observed under drought treatments (Fig. 8). It suggested that MdHDA6 can regulate MdABI5 on the histone acetylation and protein acetylation levels under normal conditions. However, when the apple plant is under drought treatment, drought stress as a much stronger factor can counteract the regulation effects of MdHDA6 on MdABI5 protein and histone acetylation. Interestingly, abundant studies have proved that the protein levels of ABI5 could be precisely regulated through multiple PTMs, such as phosphorylation, dephosphorylation, ubiquitination, and SUMOylating (Yu et al. 2021). Moreover, a previous study also revealed that N-glycosylation and N-acetylation sites were predicted at the N-terminus of the ABI5 protein, but there was no experimental evidence (Yu et al. 2015a). In this study, we provided experimental evidence that the MdABI5 lysine acetylation can be regulated by MdHDA6, corresponding to the previous prediction. Also, a previous study in Arabidopsis has proved that the H3ac levels around transcription start site (TSS) and coding sequence (CDS) regions of the ABI5 gene can be regulated by a putative histone acetyltransferase HOOKLESS1 (Liao et al. 2016). These results suggested that lysine acetylation also existed in the ABI5 protein, and the ABI5 gene regions were also regulated by histone acetylation.
It is widely believed that HATs mediate histone acetylation and activate gene expression, while HDACs perform histone deacetylation and repress gene expression (Chen et al. 2020). As expected, abundant gene expression was suppressed with corresponding histone deacetylation around gene regions in the MdHDA6-OE transgenic lines (Figs. 5 and 6), consistent with the HDAs function. However, many genes were also up-regulated in the MdHDA6-OE lines compared to GL-3 under drought (Fig. 4). Also, some negative drought regulator genes were up-regulated in MdHDA6-OE lines compared with GL-3 under drought (Fig. 4F). It seems that MdHDA6 may also induce gene activation under some certain circumstances. However, this result conflicts with the function of HDACs in gene repression, which also leaves us troubled about how HDACs induce gene activation. Fortunately, several studies have demonstrated that HDAs could also involve gene activation. For example, HDA9 is required for transcriptional activation of down-regulated genes YUCCA8, indicating that HDAs can also play a regulatory role in gene activation (Tasset et al. 2018; Van Der Woude et al. 2019). Similarly, the expression level of flowering repressor FLOWERING LOCUS C (FLC) was up-regulated in histone acetyltransferase hac1 mutants. They propose that HAC1 regulated flowering time by affecting the epigenetic modification of factors upstream of FLC (Deng et al. 2007). These results suggested that HATs/HDACs can mediate gene inactivation/activation independent of histone acetylation/deacetylation. Recently, a study has uncovered the mechanism of how HDA/HDAC performs opposite functions in gene inactivation/activation (An et al. 2022). They found that histone acetyltransferase GCN5 could mediate the protein acetylation of corepressor TPL, which enhanced the interaction of the TPL-NINJA repression complex to suppress the downstream target genes of the JA pathway, performing transcriptional repression. Conversely, HDA6 could deacetylate TPL and weaken TPL-NINJA interaction, inhibiting the TPL repression on the downstream target genes of the JA pathway and facilitating transcriptional activation (An et al. 2022). These results show that HATs and HDACs facilitate gene repression and activation by regulating the protein acetylation homeostasis of corepressor TPL, providing a different regulatory mechanism for HATs/HDACs-mediated gene regulation is independent of histone acetylation/deacetylation pathway. Based on this regulatory mechanism, we believed that the up-regulated genes in the MdHDA6-OE transgenic lines under drought might be mediated by the MdHDA6-corepressors, like TPL or other repressor factors.
Materials and methods
Plant materials, growth conditions, and drought stress treatment
For gene cloning, the leaves of “Golden Delicious” apple (Malus × domestica) variety planted in the greenhouse were used for total RNA extraction. An apple line named GL-3 generated from “Royal Gala” variety (Dai et al. 2013) with high regeneration and transgenic efficiency was used for apple genetic transformation. The MdHDA6 transgenic and GL-3 plants were subcultured on subculture medium [4.43 g/L MS salts, 30 g/L sucrose, 0.2 mg/L 6-Benzylaminopurine, 0.2 mg/L Indole acetic acid (IAA), and 8.0 g/L agar, pH = 6.0] for 1 mo, and then transferred to rooting medium (2.22 g/L MS salt, 20 g/L sucrose, 0.5 mg/L Indole butyric acid, 0.5 mg/L IAA, and 8.0 g/L agar, pH = 6.0) for 45 d. The plants were then transplanted into the soil (the ratio of peat to vermiculite is 3/1, v/v) and grew for an additional month in a light growing chamber with a light intensity of 8,000 lux and a humidity of 80% in a long-day photoperiod (light: dark, 14 h:10 h). Finally, transgenic plants were grown together with GL-3 for 2 wks under the same condition to make the plants grow identically. After that, they were treated with short-term drought treatment in which they isolated water in a natural setting for 15 d. During the drought treatment, phenotypic indicators were determined, and the status of intact plants was photographed. After drought treatment, the wilting plants were rehydrated for 7 d, and the survival rate was calculated. For each treatment, at least 6 plants were used for 1 biological replicate, and 3 biological replicates were applied. The long-term drought treatment was performed as in the previous study (Xu et al. 2018). The 1-mo transgenic and GL-3 plants were transplanted into the soil, and the uniform plants were equally divided into control and drought groups. The control group was irrigated daily to maintain the field capacity (FC) at 80%, and the long-term drought treatment group maintained the FC at 45%. The long-term drought treatment was continued for 100 d, and then the physiological phenotype of the drought treatment was evaluated.
Subcellular localization, plasmid construction, and transgenic plant generation
The subcellular localization assay was carried out as previously described (Li et al. 2021). The full-length CDS of MdHDA6 was introduced into the PDONR222 entry vector and then constructed into the pGWB405 expression vector following the Gateway system. The fusion constructs (pGWB405-MdHDA6-GFP) and the control vector (pGWB405-GFP) were transferred into 4-wk-old Nicotiana benthamiana leaves together with P19. Then, the infected Nicotiana benthamiana plants were grown under long-day photoperiod at 21 °C for 3 d. The nucleus of infiltrated Nicotiana benthamiana leaves was stained with DAPI (4,6-diamidino-2-phenylindole dihydrochloride) as the nucleus control. Finally, Fluorescence was observed under an inverted Leica TCS SP8 laser scanning microscope (Germany) with a 40× water immersion objective. Detection was performed using a 100% gain Hybrid Detector Leica (HyD). DAPI excitation was performed using a 405 nm solid-state laser, fluorescence was detected at 415 to 480 nm; GFP excitation was performed using a 488 nm solid-state laser, fluorescence was detected at 498 to 540 nm. The intensities of DAPI and GFP were 15% and 20%, respectively.
The full-length cDNA of MdHDA6 was cloned into the over-expression vector pGWB414, and the 303-bp CDS-specific interfering fragment of MdHDA6 was cloned into the RNAi vector PK7GWIWG2D by applying Gateway system, respectively. The recombined vectors were transformed into 4-wk-old GL-3 leaves using the stable Agrobacterium EHA105-mediated transformation method (Dai et al. 2013; Li et al. 2022). The transgenic buds were screened under the kanamycin resistance media, and then the transgenic seedlings were identified by PCR (DNA level) and RT-qPCR (RNA level) analyses. For identification of MdHDA6-OE transgenic lines at DNA level in Fig. 2A, we used one pair of primers: the forward primer was designed from the CaMV 35S fragment in the over-expression vector pGWB414 (Forward primer_35F: GCTCCTACAAATGCCATCA); the reverse primer was designed from the fragment of MdHDA6 (Reverse primer_HDA6-OE-attb2-R: GGGGACCACTTTGTACAAGAAAGCTGGGTCTCAGCACGAAGGATGACGATG). For the MdHDA6-RNAi lines, because the RNAi vector (PK7GWIWG2D) contains 2 inverted repeat fragments of MdHDA6 to form dsRNA and trigger the siRNA-mediated gene silencing process, we designed 2 pairs of primers to identify these 2 fragments in the RNAi lines, respectively. The primer pair of the first RNAi fragment was used as follows: the forward primer was designed from MdHDA6 (HDA6-RNAi-F: GGGGACAAGTTTGTACAAAAAAGCAGGCTTCAACATGGAAAATCTAAACACGCCC); the reverse primer was designed from the Intron fragment of the RNAi vector (Intron F: CCGTAAGAAGAGGCAAGAGTATGA). The primer pair of another RNAi fragment was as follows: the forward primer was designed from Kana gene of the RNAi vector (Kana F: GTGACTCCCTTAATTCTCATGTATAATTCGC); the reverse primer was designed from the MdHDA6 (HDA6-RNAi-R: GGGGACCACTTTGTACAAGAAAGCTGGGTCCTTTTTATCTTCTTCCATCTCATCTTCGTC). The principle of primer design was that one primer was designed from MdHDA6 or the vector, and the other primer was designed from the vector or MdHDA6, which can ensure the T-DNA insertion integrating with the genome. The primers used in this study are listed in Supplemental Table S1.
Physiological phenotypic analysis of transgenic and wild-type plants under drought treatment
The photosynthesis rate was measured using a LiCOR-6400 portable photosynthesis system (LI-COR, Nebraska, USA). Ion leakage of leaves was measured using the methods described previously (Xie et al. 2018). The determination of MDA was based on previous methods (Wang et al. 2012). H2O2 was detected as described by a previous study (Guan et al. 2013) with minor modifications. Briefly, the leaf discs were obtained with a hole punch (diameter 80 mm) and vacuum-infiltrated with 1 mg/ml 3,3′-DAB in 50 mM Tris-acetate (pH = 5.0). After being vacuum-infiltrated for 30 min, the leaf discs were incubated overnight at room temperature in darkness and then used 75% ethanol in a water bath of 100 °C to remove Chlorophyll. The content of H2O2 was quantified by the relevant detection kits (#H2O2- 1-Y, Suzhou Comin Biotechnology Institute, Suzhou, China). The relative water content of leaves was measured as described by Li et al. (2019b) with minor modifications. The fresh weight of leaf tissue was measured quickly, and the leaves were then transferred to deionized water for 36 h to determine turgid weight. Leaves were then oven-dried at 65 °C for 3 d and reweighed to measure the dry weight. The formula for calculating the relative water content (RWC) is RWC (%) = [(fresh weight-dry weight)/(turgid weight-dry weight)] × 100. All plants used in the above assays were at least 3 biological replicates in each assay. For water loss rate (WLR), fresh leaves of 3-mo-old plants were detached and placed in weighing dishes with the back of the leaves upward, and naturally lost water at room temperature. Fresh weight was measured within a certain time interval, and finally, the WLR of the leaves was calculated as the percentage of initial fresh weight.
Phylogenetic analysis
The phylogenetic tree was constructed using the MEGA7.0 program. For phylogenetic analysis, the amino acid sequences of HDA6 homologs in Arabidopsis and apple were retrieved from the TAIR website (https://www.Arabidopsis.org/Blast/index.jsp) and the NCBI website (https://www.ncbi.nlm.nih.gov/). The sequence of these proteins is first compared through ClustalW using MEGA 7.0 software, and the matched files are analyzed using Neighbor-Joining algorithm and Bootstrap analysis to perform 1000 repeated calculations on the matched files to construct an evolutionary tree.
RNA extraction and RNA-seq analysis
Total RNAs were isolated using the cetyltrimethylammonium Ammonium Bromide (CTAB) method (Chang et al. 1993) and extracted from leaves of GL-3 and MdHDA6-OE plants under normal and drought stress conditions. Three biological replicates were performed for each sample. Library construction and RT-qPCR were performed using total RNA following the manufacturer's instructions of [NEBNext Ultra Directional RNA Library Prep Kit for Illumina (New England Biolabs, USA)]. cBot Cluster Generation System using TruSeq PE Cluster Kit v3-cBot-HS (Illumina) was used to perform index-coded samples cluster. The libraries were sequenced on an Illumina Hiseq 4000 platform, and 150-bp paired-end reads were generated. Clean data were obtained by deleting the adapter-containing reads, ploy-N-containing reads, and low-quality reads of raw data and then mapped to the reference genome (Daccord et al. 2017) using HISAT2 v2.1.0 (Langmead and Salzberg 2012; Daccord et al. 2017) after quality control by FastQC v0.11.9 with default parameters. Then, the Htseq v0.13.5 (Anders et al. 2015) was used to quantify the read counts of each gene, and Reads Per Kilobase Million value was applied to represent gene expression abundance. The calculation formula of Fragments Per Kilobase Million (FPKM) was as follows: FPKM = read counts/(mapped reads (Millions) * exon length (KB)). R/DESeq2 packages (Love et al. 2014) were used to identify the DEGs between the control and drought-treated samples based on the read counts with the adjusted Q value <0.05 and 0.6-fold change in gene expression. The GO annotation and enrichment analyses were conducted by using the online tools agriGO (Tian et al. 2017) and KEGG Orthology Based Annotation System (Bu et al. 2021).
The RT-qPCR analysis was performed as follows: total RNA was isolated using the CTAB method (Chang et al. 1993) and digested with DNase I (Thermo Scientific, USA) to remove the residual DNA. The DNA-free RNA was used as the template for reverse-transcription PCR. The first-strand cDNA was synthesized using the RevertAid First Strand cDNA Synthesis Kit (Thermo Scientific, USA). RT-qPCR analysis was performed with qPCR Master Mix (Promega, USA) in a Bio-Rad CFX96TM system. MdMDH was used as the reference gene. Gene-specific primers are listed in Supplemental Table S1.
Histone deacetylation assay in vitro and in vivo
The in vitro histone deacetylation assay was performed following the manufacturer's instructions for the Epigenase HDAC Activity/Inhibition Direct Assay Kit (Epigentek). Briefly, the full-length CDS of MdHDA6 was cloned into pET-32(+) and pGEX-4 T vectors, which contained 10× HIS tag and 1× GST tag, respectively. The resulting constructs (MdHDA6-HIS and MdHDA6-GST) were transformed into E. coli strain BL21. Production and purification of MdHDA6-HIS and MdHDA6-GST fusion protein were performed by using Ni-NTA (Nitrilotriacetic Acid) agarose (Smart-Lifesciences) and Glutathione agarose (Thermo), respectively. The purified MHDA6 protein needed to be incubated with acetylated substrate and assay buffer for 60 min, then capture antibody and detection antibody were added. Finally, color-developing solution was added for color development, and the absorbance of the reactive solution was measured at 450 nm. The HDAC activity of MdHDA6 was calculated using a standard curve following the manufacturer's instructions and expressed as nanograms/minute/milligram of protein. (HO3: HDAC Assay Standard as a positive control, HI: HDAC Inhibitor TSA, were provided by Kit; BBX7 and GST were set as the negative controls.)
For detecting the global histone acetylation status in vivo, total histones were extracted as described by (Lu et al. 2011) with minor modifications. Briefly, fresh leaf tissues (0.1 g) of 2-mo-old GL-3 and MdHDA6-OE plants were ground to a fine powder in liquid nitrogen and suspended in 300 μl 3×SDS loading buffer (250 mM pH 6.8 Tris–HCl; 10% sodium dodecyl sulfate (w/v), 0.5% bromophenol blue (w/v), 50% glycerin (v/v)5% β-mercaptoethanol, (v/v)). The mixture was fully oscillated and then boiled at 100 °C for 8 min. Total histones were extracted from the supernatant after 10 min of centrifugation at 15,000 × g. Then the histones were used for western blot using the antibodies of anti-H3 (PTM1002, PTM Bio), anti-H3ac (Millipore, 17-615), anti-H3K9ac (Millipore, 07-352), and anti-H3K14ac (Millipore, 07-353). Among them, the immunoblot signal of anti-H3 was used as the loading control.
Chromatin immunoprecipitation followed by illumina sequencing (ChIP-seq) and qPCR analysis
Chromatin immunoprecipitation (ChIP) experiment was performed as described in the previous study (Xie et al. 2018). Briefly, leaves collected from GL-3 and MdHDA6-OE plants under normal and drought conditions were sliced into pieces, cross-linked for 20 min in 1% (w/v) formaldehyde, and stopped by adding 0.125 M glycine. The chromatin was isolated and sonicated to shear the DNA into 0.2 to 0.5 kb fragments. The antibody of anti-H3ac (Millipore, 17-615) or anti-H3K14ac (Millipore, 07-353) was used for immunoprecipitation into the isolated and sonicated chromatin. After that, the complexes obtained by immunoprecipitation were precipitated with ChIP-grade protein A/G agarose beads and washed 4 times with washing buffers. Finally, the immunoprecipitated DNA was obtained by reverse cross-linking and protein digested. The immunoprecipitated DNA was used for the subsequent Illumina high-throughput sequencing or qPCR analysis. The gene-specific primers of ChIP-qPCR analysis are listed in Supplemental Table S1.
For high-throughput sequencing, the immunoprecipitated DNA was submitted to the following ChIP-seq library construction with end repair, A-tail addition, sequencing junction addition, purification, and PCR amplification. After the libraries were qualified, the sequencing was performed on the Illumina high-throughput sequencing platform NovaSeq 6000. The reads after adapter removal and quality filtering were aligned to the apple reference genome (Daccord et al. 2017) by BOWTIE2 (Langmead and Salzberg 2012). After sorting using SAMTOOLS (Li et al. 2009), aligned reads were subjected to peaks calling with -q 0.05 by MACS2 software (Zhang et al. 2008). To annotate the distribution of peaks throughout the gene region, DEEPTOOLS (Ramírez et al. 2016) was applied to analyze the distribution of peaks located in the different gene regions under the default parameters. Further, differential H3ac enrichment analysis was performed using DIFFBIND software (Stark and Brown 2011) with False Discovery Rate 0.05 based on the DESEQ technique. Moreover, CHIPSEEKER (Yu et al. 2015b) was adopted to calculate the proportions of peaks in different gene regions by dividing the gene feature into promoter (TSS 5 kb region, with statistics for every 1 kb), 5′UTR, 3′UTR, exon, intron, downstream (default parameters), and intergenic regions (outside of these regions).
Yeast two-hybrid (Y2H) assays
The full-length CDS of MdHDA6 was first cloned into the binding domain (BD) vector. After detecting MdHDA6-BD without self-activation, MdHDA6-BD was used as the “bait” for the yeast 2-hybrid library screening. Then, the positive yeast plasmids were extracted and sequenced. For Y2H verification, the full-length CDS of MdABI5 was cloned into activation domain vectors, and cotransformed with MdHDA6-BD into yeast for expression using the Takara Yeast Transformation Kit (Clontech, USA). Transformants were cultured in SD/-Trp-Leu (-T/-L) and SD/-Trp-Leu-His-Ade (-T/-L/-H/-A) media for 3 days with or without 5-bromo-4-chloro-3-indolyl-α-d-galactopyranoside (X-α-gal) to examine the interaction of MdHDA6 and MdABI5. In order to further clarify the key domains of interaction, MdHDA6 and MdABI5 proteins were truncated according to their conserved domains, and the yeast point-to-point verification experiment was carried out.
Bimolecular fluorescence complementation (BiFC) assay
The BiFC assay was performed according to a previous study (Guan et al. 2014). The full-length CDS sequence of MdHDA6 and MdABI5 were cloned into pSPYCE and pSPYNE vectors, respectively. The constructed transient expression vector and pSoup plasmid were transferred into Agrobacterium C58C1 by electric shock transformation. After 3 d of incubation at 28 °C, heavy suspension (10 mM MES-KOH, 10 mM MgCl2, 150 to 200 μM acetylsyringone) was used to collect Agrobacterium colonies, and they were resuspended to OD600 = 1.0. Then, the prepared bacteria solutions of MdHDA6-pSPYCE and MdABI5-pSPYNE were mixed with equal volume and injected into Nicotiana benthamiana leaves. After 3 d of N. benthamiana growth, fluorescence was observed under an inverted Leica TCS SP8 laser scanning microscope (Germany) with a 40× water immersion objective. Yellow fluorescent protein was detected using photomultiplier module detector (PMT) at 682% gain with excitation at 514 nm and emission at 524 to 570 nm, and the intensity is 25%.
Split luciferase (Split-Luc) assays
After removing the termination codon, the full-length CDS of MdHDA6 was constructed to the Split-nLuc vector, and the full-length CDS of MdABI5 was cloned to the Split-cLuc vector. The constructed transient expression vector and pSoup plasmid were transferred into Agrobacterium tumefaciens C58C1 by electric shock transformation. After 3 d of incubation at 28 °C, heavy suspension (10 mM MES-KOH, 10 mM MgCl2, 150 to 200 μM acetylsyringone) was used to collect the bacterial colonies and they were resuspended to OD600 = 1.0. Then, the prepared Agrobacterium solutions of MdHDA6-nLuc and MdABI5-cLuc were mixed with the same volume and injected into N. benthamiana leaves. After 3 d of N. benthamiana growth, the fluorescence signals were collected using a CCD (Lumizone Pylon 2048B, USA) instrument.
Co-IP analysis
The full-length CDS sequences of MdHDA6 and MdABI5 were cloned into pEarlyGate104 (containing a GFP tag) and pC1305 (containing a 3× MYC tag) vector, respectively. Then, the constructed transient expression vectors and pSoup plasmid were transferred into Agrobacterium tumefaciens C58C1 by electric shock transformation. After 3 d of incubation at 28 °C, heavy suspension (10 mM MES-KOH, 10 mM MgCl2, 150 to 200 μM acetylsyringone) collected the bacterial colonies and resuspended to OD600 = 1.0. The suspensions were mixed with equal volume and injected into N. benthamiana leaves. After 3 d. of N. benthamiana growth, the total protein was sampled, extracted, and incubated with an anti-MYC (Sangon Biotech, Ab-395) antibody at 4 °C overnight for immunoprecipitation, then operated according to the instructions of Pierce Classic IP Kit (Thermo, USA). Finally, a western blot was adopted to detect the target band with the anti-MYC and anti-GFP (Abclone, AE012) antibodies after protein immunoprecipitation.
Transient dual-luciferase (Dual-LUC) assays
The full-length cDNA of MdHDA6 and MdABI5 were cloned into the vector pGreenII62-SK, and the promoter fragments of MdEM6 and MdRD29A were cloned into the vector pGreenII 0800-LUC. The constructed transient expression vectors were transformed into Agrobacterium tumefaciens GV3101 with pSoup plasmid by electric shock transformation. After 3 d of incubation in a 28 °C biochemical incubator, resuspension (10 mM MES-KOH, 10 mM MgCl2, 150 to 200 μM acetylsyringone) collected the bacterial colonies and resuspended to OD600 = 1.0. Then, they were mixed with equal volumes corresponding to the different protein-promoter combinations. The mixture was injected into N. benthamiana leaves, and the samples were frozen after 3 d. The double luciferase activity analysis experiment was carried out according to the instructions of the Dual-Luciferase reporter gene detection kit (Yeasen, Shanghai, China) by using the GloMax Navigator microplate luminescence detector (Promega, USA) for detection.
Protein lysine acetylation analysis of MdABI5
The total proteins were extracted from leaves of GL-3 and MdHDA6-OE lines. The total protein extracts were submitted to the immunoprecipitation process and incubated with the anti-MdABI5 antibody (The antibody was synthesized by ABclonal Biotech, Xian, China) overnight at 4 °C. The experiment was operated according to the instructions of Pierce Classic IP Kit (Thermo, USA). After the immunoprecipitation, the protein samples were separated into 10% gels via SDS-PAGE. Then, the samples were transferred to the PVDF membrane, which was sealed at room temperature for 2 h. After washing the membrane, the antilysine acetylation antibody (Jingjie BioLab, PTM-101) was added and incubated. Then, the membrane was rinsed with TBST solution 3 times and exposed to detect the protein lysine acetylation level. The immunoblot signal of anti-ABI5 was used as the loading control.
Statistical analysis
Data were expressed as the mean ± SD. SPSS (Version 21.0, USA) was used for one-way ANOVA (Tukey's test) analysis to determine the statistical significance. The variation significance level was indicated by asterisks: *P < 0.05, **P < 0.01, ***P < 000.1.
Accession numbers
The high-throughput sequencing data including RNA-seq and ChIP-seq were uploaded to the National Center for Biotechnology Information (NCBI) database under the accession number PRJNA940197. Sequence data from this article can be found in the NCBI data libraries under accession numbers MdHDA6 (LOC114820967), MdABI5 (LOC103430245), MdRD29A (LOC103406509), MdWRKY57 (LOC103403263), MdMYB4 (LOC103426993), MdGRX480 (LOC103434839), MdARF3 (LOC103434840), MdMYB94 (LOC103440880), MdYUC6 (LOC103441186), MdPSBJ (MD06G1065900), MdEPF1 (LOC103404726), MdCYP707A1/A4 (LOC103455974), MdUGT71B6 (LOC103441425), MdATAF1 (LOC103401717), MdPUB23 (LOC103442150), MdPUB24 (LOC103421753), MdEM6 (LOC103427564), MdRD29B (LOC103447507), MdNCED3 (LOC103445724), MdCAT1 (LOC103436733), MdDREB2A (MD01G1158600), and MdSOD1 (LOC103432668).
Acknowledgments
We thank Wenjing Liu, Yumeng Feng, Yingpu Duan for their help in the long-term drought treatment of apple plants.
Author contributions
W.L. performed the molecular experiments and wrote the draft manuscript; M.D. performed the molecular experiments of MdABI5 part; S.W. performed the bioinformatic analysis of RNA-seq and ChIP-seq; C.W. and M.G. helped with the plant materials propagation; Y.S. and J.G. performed the apple transgenic work; J.Y. helped with the tissue culture work; F.M. provided the experiment condition; Q.G. provided the experiment methods and reviewed the manuscript; J.X. conceived and designed the experiments and wrote, reviewed, and edited the manuscript. All authors read and approved the final manuscript.
Data availability
The datasets presented in this study can be found in online repositories. The names of the repository/repositories and accession numbers can be found in the article.
Supplemental data
The following materials are available in the online version of this article.
Supplemental Figure S1. Phylogenetic relationship of HDA6 and the alignment analysis of conserved hist-deacetyl domain.
Supplemental Figure S2. Phenotypes of MdHDA6 transgenic plants and wild-type plants GL-3 under long-term drought treatment.
Supplemental Figure S3. Transcriptomic analysis of MdHDA6-OE and GL-3 plants in response to drought.
Supplemental Figure S4. ChIP-seq analysis of H3 acetylation in MdHDA6-OE and GL-3 plants in response to drought.
Supplemental Table S1. Primers used in this study.
Funding
This work was supported by the National Natural Science Foundation of China (31972370), the Major Science and Technology Projects of Shaanxi Province (2020zdzx03-01-02).
Dive Curated Terms
The following phenotypic, genotypic, and functional terms are of significance to the work described in this paper:
References
Author notes
Wenjie Li and Mengting Deng contributed equally.
The author responsible for distribution of materials integral to the findings presented in this article in accordance with the policy described in the Instructions for Authors (https://dbpia.nl.go.kr/plphys/pages/General-Instructions) is Jidi Xu.
Conflict of interest statement. The authors declare that they have no conflicts of interest.
