


Abstract
Banana (Musa spp.) fruits, as typical tropical fruits, are cold sensitive, and lower temperatures can disrupt cellular compartmentalization and lead to severe browning. How tropical fruits respond to low temperature compared to the cold response mechanisms of model plants remains unknown. Here, we systematically characterized the changes in chromatin accessibility, histone modifications, distal cis-regulatory elements, transcription factor binding, and gene expression levels in banana peels in response to low temperature. Dynamic patterns of cold-induced transcripts were generally accompanied by concordant chromatin accessibility and histone modification changes. These upregulated genes were enriched for WRKY binding sites in their promoters and/or active enhancers. Compared to banana peel at room temperature, large amounts of banana WRKYs were specifically induced by cold and mediated enhancer–promoter interactions regulating critical browning pathways, including phospholipid degradation, oxidation, and cold tolerance. This hypothesis was supported by DNA affinity purification sequencing, luciferase reporter assays, and transient expression assay. Together, our findings highlight widespread transcriptional reprogramming via WRKYs during banana peel browning at low temperature and provide an extensive resource for studying gene regulation in tropical plants in response to cold stress, as well as potential targets for improving cold tolerance and shelf life of tropical fruits.
Introduction
Tropical fruits have a huge share of all fruits with rich nutritional composition and important economic value. Since tropical fruits have a short shelf life at room temperature, low-temperature storage is an effective way to extend the shelf life of fruits after harvest, but it usually causes various chilling injuries (CIs), which have been documented in tropical fruits, like banana (Musa acuminata), mango (Mangifera indica L.), and papaya (Carica papaya L.) (Zhang et al. 2017; Wu et al. 2019; Zhu et al. 2019). These CIs impair the production of volatiles and destroy the surface of fruits, leading to serious commercial loss (Valenzuela et al. 2017). Compared to fruits that have undergone cold domestication, tropical fruits have a weaker cold response system and are susceptible to sudden drops in temperature (Han and Fu 2019; Zhu et al. 2019; An et al. 2021). How tropical plant species, such as banana fruits, respond to low temperature and are induced with CIs is poorly understood at the molecular level.
Bananas (Musa spp.) are popular fruits worldwide and rank 4th among the most important food crops after rice (Oryza sativa), wheat (Triticum aestivum), and maize (Zea mays) (FAO 2017). However, a large fraction of banana production is wasted between harvest and consumption due to low-temperature storage during shipping and storage (Han et al. 2016; Han and Fu 2019). Because banana fruits are sensitive to low temperatures, a variety of CIs, such as peel browning and cessation of fruit ripening, gradually emerge under low-temperature storage (Han and Fu 2019; Zhu et al. 2019). These undesirable CI symptoms, especially peel browning, seriously reduce banana market value (Hu et al. 2017; Han and Fu 2019; Zhu et al. 2019; Kuang et al. 2020). Peel browning is mainly caused by an imbalanced intracellular environment and strong oxidative reactions (Zhang et al. 2021). The imbalance is brought forth by the degradation of membrane lipids via the action of multiple lipases, such as lipoxygenase (LOX) and phospholipase D (PLD), which disrupts the structural integrity of membranes and breaks the compartmentalization between multiple enzymes and their substrates (Lin et al. 2016; Valenzuela et al. 2017; Sun et al. 2020). The exposed substrates are rapidly oxidized by oxidases, such as polyphenol oxidase (PPO) and ascorbate oxidase (AAO), producing brown-pigmented complexes (Kogo et al. 2018). The complement of genes related to membrane degradation and oxidation is collectively called browning-related genes (BRGs). How these BRGs are regulated in cold-sensitive tropical fruits is not well understood.
Cis-regulatory elements (CREs) are important factors that influence gene transcription (Schmitz et al. 2021). Enhancers are distant DNA elements that modulate transcription, with some enhancers being located far away from their cognate promoter regions (Maher et al. 2018). In mammals, active enhancers enriched in the histone modification mark H3K27ac (acetylation of histone H3 at lysine 27) raise gene expression levels (Zentner et al. 2011). In plants, enhancers play a critical role in development and responses to environmental stimuli, but only a few have been characterized in detail (Ong and Corces 2011; Maher et al. 2018). These enhancers merge in accessible chromatin regions whose dynamics are associated with external environmental stimuli such as cold, heat, and drought stresses, as recently illustrated in the response of 3 grasses to cold stress (Perino and Veenstra 2016; Han et al. 2020; Wang et al. 2020). Therefore, a greater understanding of the distribution and roles of accessible chromatin regions and enhancers in the plant genome is urgent in general and in the context of responses to low temperature and browning formation in particular.
WRKY regulators are 1 of the largest families of transcription factors (TFs) with a highly covered WRKYGQK domain and target DNA sequence by recognition of core DNA motif (TTGAC) (Chen et al. 2018). Increasing evidences revealed that WRKY regulators play a crucial role in response to environmental stress and in the formation of browning in plant tissues. For example, in apple (Malus × domestica Borkh.) fruit, MdWRKY31 targeted W-box of MdLAC7 (LACCASE 7) to activate gene expression, thereby promoting browning formation in the dark (Wang et al. 2023). In banana fruit, 4 WRKY regulators increased fruit chilling tolerance via regulating the ABA biosynthetic pathway when treated with exogenous ABA (Luo et al. 2017). Despite these advances, how cold stress reprograms transcriptional regulatory network via WRKY regulators remains unclear.
Here, we used banana fruits as the representative of tropical fruits and applied multiomics approaches to investigate how cold-induced TFs regulate gene expression through chromatin accessibility and histone modifications in banana peels. We established genome-wide maps of DNase I-hypersensitive sites (DHSs) at low temperature and defined the enhancers distally involved in the expression of BRGs. Meanwhile, the binding site recognized by WRKY TFs was enriched in accessible chromatin regions of upregulated genes, and multiple WRKY family genes were specifically expressed at a high level after low temperature treatment. Finally, we reconstructed the regulatory network and highlighted WRKY TFs as core modules in response to low temperature and browning formation in banana peel, and our comprehensive annotation of cold-related functional elements in bananas should inform insightful efforts for genome editing–based breeding design of cold-tolerant bananas.
Results
Identification and characterization of cold-induced genes in banana peels
Bananas are sensitive to low temperatures. After a period of low-temperature storage, browning spots frequently appear on banana peels and gradually expand. To understand the molecular mechanism behind this biological phenomenon, we treated 2 groups of banana fruits with room temperature (RT group, 24 °C) and low temperature (LT group, 6 °C) for 0, 1, or 3 d and measured the associated changes in lightness and firmness of their peels. We observed the appearance of browning spots within 1 d of cold treatment, and these spots became more prominent after 3 d (Fig. 1A). We then measured the changes in physiological indexes of banana peels in RT and LT groups. The activities of LOX and PPO, H2O2 levels, and malondialdehyde (MDA) content were significantly increased after cold treatment (Supplemental Fig. S1A). Meanwhile, the lightness of the banana peels decreased over the low-temperature time course, but peel firmness did not change substantially within this time period (Fig. 1B and Supplemental Fig. S1B).
![Physiological changes and gene expression analysis of banana peels in response to low temperature. A) Browning spots appear on banana peels at low temperature (LT). Fruits were kept at 24 °C (room temperature [RT]) or 6 °C for 0, 1, or 3 d. The fruit images were digitally extracted for comparison. Scale bars = 2 cm. B) Lightness of banana peels at low temperature after 0, 1, or 3 d at 6 °C. Data are shown as means ± Se (standard error, n ≥ 3); asterisks represent significance between 2 treatments (t-test, *P < 0.05; **P < 0.01). C) Time course of gene expression for 3 CBFs, LOX6, PPO1, and POD2, at RT and LT. Data are shown as means ± Se (standard error, n = 3). D) PCA of RNA-seq data. Each circle represents 1 sample. E) DEGs in banana peels in response to low temperature. Venn diagram showing the number of common and time-specific DEGs. F) Heatmap of the RNA-seq and DHS data sets generated by k-means clustering analysis. PC1 represents a cluster of linear equation. RNA-seq and DNase-seq values were normalized. Representative genes are listed to the left. The patterns of PC1 are shown in the middle. Selected GO terms are listed to the right.](https://oup.silverchair-cdn.com/oup/backfile/Content_public/Journal/plphys/193/1/10.1093_plphys_kiad322/2/m_kiad322f1.jpeg?Expires=1749221041&Signature=FnYnT6l7h-IYof7ZNh4BfJFpglTtxZavtwSHzfuZS~yua~cjhScw4OrRPi0L1UjOPaPMm3Tptn~QM-vvClH2lVEnfDQ-3U4N-S0n6iLz-rUbci-puA3ligHpZcF8Xif6-idkwxmHGqKvmKLmvJqhPPtOX1CTZFX2nBzLO-pe2F~li2lVzIj9ryaOdoPZPxt8zge8-Xfnas~Pb0~9aEapHceQU0~Gdxy8JsVgnEu2JwGELhUbL4Qzttz-RzA-o4j1D~tnm85-yU7h~jJ31t23O1bfpRwBv57somqWPmN9ZzPrMYgOVRy2KnSA9z7nStjdNnkkcdYMG87IYoCiSfXa5Q__&Key-Pair-Id=APKAIE5G5CRDK6RD3PGA)
Physiological changes and gene expression analysis of banana peels in response to low temperature. A) Browning spots appear on banana peels at low temperature (LT). Fruits were kept at 24 °C (room temperature [RT]) or 6 °C for 0, 1, or 3 d. The fruit images were digitally extracted for comparison. Scale bars = 2 cm. B) Lightness of banana peels at low temperature after 0, 1, or 3 d at 6 °C. Data are shown as means ± Se (standard error, n ≥ 3); asterisks represent significance between 2 treatments (t-test, *P < 0.05; **P < 0.01). C) Time course of gene expression for 3 CBFs, LOX6, PPO1, and POD2, at RT and LT. Data are shown as means ± Se (standard error, n = 3). D) PCA of RNA-seq data. Each circle represents 1 sample. E) DEGs in banana peels in response to low temperature. Venn diagram showing the number of common and time-specific DEGs. F) Heatmap of the RNA-seq and DHS data sets generated by k-means clustering analysis. PC1 represents a cluster of linear equation. RNA-seq and DNase-seq values were normalized. Representative genes are listed to the left. The patterns of PC1 are shown in the middle. Selected GO terms are listed to the right.
To investigate changes in gene expression profiles in banana peels exposed to low temperature, we performed a transcriptome deep sequencing (RNA-seq) analysis (Fig. 1, C and D, and Supplemental Fig. S1C and Table S1). We observed increased transcript levels for several well-known genes associated with cold stress and browning in response to low temperature, such as MaCBF1 (C-REPEAT/DRE BINDING FACTOR1, Ma10_g01420), MaCBF2 (Ma06_g34430), MaCBF3 (Ma09_g04570), MaPPO1 (Ma08_g34740), MaPOD2 (PEROXIDASE2, Ma10_g15940), and MaLOX6 (Ma10_g17560) (Fig. 1C). We then analyzed differently expressed genes (DEGs) in the RT and LT groups. We identified 5,285 (3,044 upregulated and 2,241 downregulated) differentially expressed genes (DEGs) in pairwise comparisons between the controls (0 d at 6 °C) and 1 d at 6 °C, as well as 9,479 (5,271 upregulated and 4,208 downregulated) DEGs between the control and 3 d at 6 °C (Supplemental Fig. S1D and Table S2). Of these DEGs, 4,134 responded to low temperature at both time points, with the remaining genes showing a time-specific response (Fig. 1E). However, few DEGs were identified in the RT group (Supplemental Fig. S1E). Notably, we found more BRGs in the cold-induced DEGs than in the RT group, and most BRGs showed opposite expression in the shared fraction (Supplemental Fig. S1, F and G). These results suggest that although room temperature altered the expression level of some BRGs, it should not affect peel browning formation.
We then classified cold-induced DEGs (1 LT vs. 0 d and 3 LT vs. 0 d) into 6 groups based on a k-means clustering analysis, named R1 to R6 (Fig. 1F and Supplemental Table S2). Genes in clusters R1, R2, and R3 were downregulated in low temperature. Among these genes were EXLA1 (EXPANSIN-LIKE A1), ACO1 (ACC OXIDASE1), ARF19 (AUXIN-RESPONSE FACTOR19), and BZR1 (BRASSINAZOLE-RESISTANT1). Genes in clusters R4, R5, and R6 were upregulated in low temperature, including PPO1, PLA1 (PHOSPHOLIPASE A1), LOX5, RBOH (RESPIRATORY BURST OXIDASE HOMOLOG), and AOS1 (ALLENE OXIDE SYNTHASE 1). These genes were related to phospholipid degradation, reactive oxygen species (ROS) production, and enzymatic browning. Notably, more than half BRGs were located in the upregulated cluster (Supplemental Fig. S1H). Interestingly, genes in clusters R1, R3, and R4 responded rapidly to low temperature, as their transcript levels already changed after 1 d at 6 °C. Genes in cluster R6 were insensitive to low temperature after 1 d in the cold but underwent dramatic changes after 3 d. Gene Ontology (GO) enrichment and Kyoto Encyclopedia of Genes and Genomes (KEGG) analyses revealed that genes in R1 and R2 are involved in plant development, detection of external stimuli, and energy metabolism; genes in cluster R3 are related to signal transduction; and genes in clusters R4, R5, and R6 are preferentially associated with fatty acid redox, toxin metabolism, and glycerophospholipid metabolism (Fig. 1F and Supplemental Fig. S1I and Tables S3 and S4). These results suggest that cold strongly induced the degradation and oxidation of phospholipid in banana peel.
Histone features of banana peels under low temperature
Since the dynamics of histone modifications are influenced by environmental stress, we explored the chromatin landscape that shapes gene expression in banana peel under low temperature by performing histone chromatin immunoprecipitation followed by sequencing (histone modification chromatin immunoprecipitation sequencing [ChIP-seq]) to locate CREs in the genome (Fig. 2A). We thus determined the global distribution of histone modifications across the genome (Fig. 2, A to C). Active histone marks (H3K4me3, H3K9ac, and H3K27ac) were mainly distributed over the promoter regions, and more than 50% of repressive histone mark H3K27me3 was distributed along the gene body (Fig. 2C). We defined 8 chromatin states using the software ChromHMM (Ernst and Kellis 2017) (Fig. 2B and Supplemental Fig. S2A and Table S5). We classified genes in the banana genome into 1 of 3 categories (active, repressed, and no signal) as a function of their chromatin state and decoration with histone modifications (Fig. 2B). The active category comprised transcription start site (TSS flanking), transcription terminal site (TTS) flanking, and weak transcription. In the active state, the TSS flanking state showed a high enrichment for H3K4me3, a histone mark for active promoters in both plants and mammals. Moreover, the genes in subgroups TSS flanking 2 and TSS flanking 3 had higher levels of H3K9ac and H3K27ac than TSS flanking 1 and were more highly expressed than TSS flanking 1. The TTS flanking state was characterized by a high enrichment of H3K9ac and H3K27ac. In the repressed category, H3K27me3 was associated with gene silencing and was enriched in repressed regions and bivalent regions (with high enrichment of both H3K4me3 and H3K27me3), along with lower expression levels. The no signal category mostly represented intergenic regions that lack the histone marks analyzed here. Notably, the weak transcription state shared the same absence of histone marks, although it also exhibited a higher transition frequency to more active chromatin states (see column #8 in state transitions of Fig. 2B), suggesting that these genomic regions in a weak transcription state are near active chromatin regions.
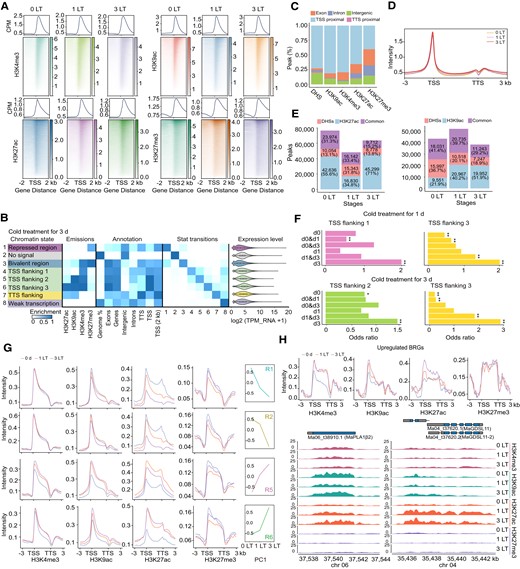
Analysis of genome-wide epigenetic features and for cold-induced genes. A) Metaplots and distribution of ChIP-seq reads for H3K4me3, H3K9ac, H3K27ac, and H3K27me3 across the gene body and 2 kb upstream/downstream of the TSS. Low temperature (LT). B) Chromatin state definitions based on ChIP-seq using the ChromHMM algorithm after 3 d at 6 °C. Each row represents a different chromatin state, and each column corresponds to a different histone mark, coverage, genome annotation, and gene expression. The state transitions show when a region switches from 1 chromatin state (row) to another (column). C) Cumulative frequencies of peaks for DHSs, H3K9ac, H3K4me3, H3K27ac, and H3K27me3 at different genic features across the genome. D) Metaplot of DNase-seq peaks. Window size: gene body ± 3 kb. E) Number of specific and common peaks for DHS and the H3K27ac or H3K9ac mark. The number and percentage of common, DHS-specific, and H3K27ac- or H3K9ac-specific peaks are given. F) Enrichment level of each cluster of cold-induced DHSs in the active chromatin state after cold treatment. Asterisks indicate significant differences of the enrichment of cold-induced DHSs in each chromatin state (t-test, *P < 0.05; **P < 0.01). G) Metaplots of histone modifications across genic regions for clusters 1, 2, 5, and 6. PC1 from Fig. 1F is plotted to the right. H) Metaplots for histone modification enrichment across genic regions for the upregulated BRGs. The average signal intensity from 3 kb upstream of the TSS to 3 kb downstream of the TTS is plotted in G, H). I) Genome browser view of normalized read coverage of histone ChIP-seq for representative genes.
Chromatin accessibility in banana peels under low temperature
We then globally analyzed the distribution of DHSs (Supplemental Fig. S2B and Table S6) and classified accessible chromatin regions into 5 groups: within 2 kb upstream of the TSS (proximal to the TSS), exons, introns, within 300 bp downstream of the transcription termination site (proximal to the TTS), and intergenic regions (>2 kb from the TSS or >300 bp from the TTS). We established that approximately 70% of all DHSs map proximal to the TSS, with another nearly 20% located in intergenic regions (Fig. 2C). We then evaluated chromatin accessibility dynamics in genic regions, which revealed that most DHSs are concentrated around the TSS at all 3 time points of the cold treatment. Compared to 0 d, chromatin accessibility was increased after low-temperature exposure, indicating that low temperature rapidly influences chromatin accessibility in banana peels (Fig. 2D). Interestingly, we observed that more than 75% of the DHSs, H3K27ac, and H3K9ac sites all map to TSS-proximal regions and transcribed regions (Fig. 2C), with nearly half of the DHSs not covered by H3K27ac or H3K9ac (Fig. 2E), which was consistent with previous reports that H3K27ac is not a hallmark of active enhancers in Arabidopsis thaliana (Yan et al. 2019; Wu et al. 2022). These results suggest that H3K27ac and H3K9ac are not hallmarks for active enhancers in banana peel.
We further investigated the dynamics of chromatin accessibility. We divided cold-induced DHSs into 6 clusters and evaluated the correlation by integrating cold-induced DHSs and output from the ChromHMM software (Supplemental Fig. S2C and Table S7). We found that these DHSs displayed significant changes in the TSS flanking category, which were marked by at least 1 active histone modification, and had higher levels of gene expression (Fig. 2F and Supplemental Fig. S2, D and E). This result suggests that low temperature increased chromatin accessibility in promoter regions associated with active modifications, mainly H3K4me3, leading to high expression levels of their marked genes.
Taken together, the DNase-seq and ChIP-seq data sets showed distinct chromatin states in different genomic regions and highlighted the complex correlation between chromatin states and transcription under low temperature. In addition to 8 states marked by histone modifications, accessible chromatin in intergenic regions may have potential functions in response to low temperature.
Cold-induced genes undergo changes in chromatin accessibility and histone modifications
To further understand the differences in epigenetic features of DEGs, we classified DHSs (34,179) into 6 modules based on principle component 1 (PC1) extracted from the PCA of expression clusters (Fig. 1F and Supplemental Table S8). Nearly 36% of DHSs across the genome were associated with the R4, R5, and R6 modules, which showed increased chromatin accessibility after 1 and/or 3 d of cold exposure (Fig. 1F). Notably, module R2 comprised approximately 40% of all DHSs (Fig. 1F). We assigned these DHSs to their closest genes, more than 60% of which were not differentially expressed and were associated with growth (Supplemental Fig. S2, F and G).
We then generated metaplots for each histone mark along genes and their flanking sequences (3 kb upstream of the TSS and 3 kb downstream of the TTS) for each cluster (Fig. 2G and Supplemental Fig. S2H). For upregulated DEGs, clusters 5 and 6 showed increases in H3K4me3, H3K9ac, and H3K27ac levels, which was consistent with the higher transcript levels of the associated genes (Fig. 2G and Supplemental Fig. S2H). By contrast, H3K9ac and H3K27ac levels increased after 1 d in the cold but decreased after 3 d, in agreement with the observed changes seen with cluster 4 in terms of transcript levels (Supplemental Fig. S2H). Notably, BRGs in the upregulated clusters associated with oxidative and phospholipid degradation experienced an increase in active histone marks (Fig. 2H). For example, the levels of active histone modifications were higher across the MaPLA1β2 (PHOSPHOLIPASE A1-BETA 2, Ma06_g38910) and MaGSDL11 (GSDL-TYPE LIPASE CLASS 3, Ma04_g37620) after cold treatment (Fig. 2I). For the downregulated DEGs, low temperature had minimal effects on H3K4me3 but substantially influenced H3K9ac and H3K27ac levels around the TTS. The high levels for H3K9ac and H3K27ac decreased from 0 to 3 d of cold exposure in both clusters 1 and 2, while cluster 3 exhibited a more modest reduction in the levels of these histone marks (Fig. 2G and Supplemental Fig. S2H). Interestingly, H3K27me3, which is strictly associated with silencing of key developmental genes, displayed similar dynamics from 0 to 3 d of cold exposure in all clusters, indicating that H3K27me3 does not affect gene expression, although its levels are affected by environmental stresses.
Intergenic DHS sites are predictive of enhancers
We observed that many DHS peaks map outside of promoter regions, which prompted us to ask whether these intergenic DHSs might function as enhancers. To test this hypothesis, we analyzed the Hi-C data sets and DNase-seq data sets using the activity-by-contact (ABC) model (Fulco et al. 2019) and determined that 64.7% of all genes have putative distal enhancers (Supplemental Table S9). These candidate enhancers were mainly located within 25 kb from the TSS (Fig. 3A). Moreover, we noticed that the expression levels of genes with promoters and candidate enhancers are significantly higher than those with promoters or candidate enhancers alone (Fig. 3B and Supplemental Table S10). To validate a function for these candidate enhancers in the modulation of gene expression, we performed transient assays in Nicotiana benthamiana leaves with 10 randomly selected candidate enhancers (Supplemental Table S11). To this end, we individually cloned each candidate enhancer upstream of a minimal cauliflower mosaic virus (CaMV) 35S promoter driving the transcription of the firefly luciferase (Luc) reporter gene. We observed that 80% of the constructs with a DHS have greater relative Luc activity when compared to the negative controls, although not as high as the positive control provided by the full CaMV 35S promoter (Fig. 3, C and D). These results validate our interpretation that these intergenic DHSs exert transcriptional enhancer activity.
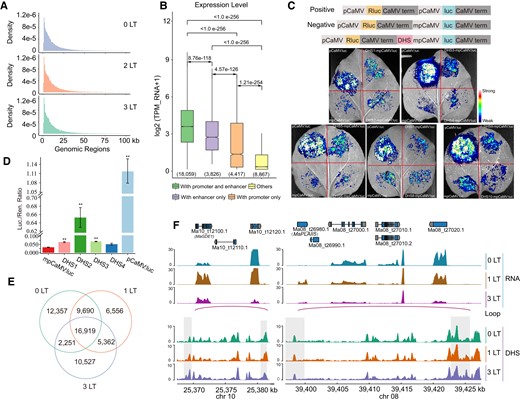
Analysis of candidate enhancers in response to low temperature. A) Distribution of distances between TSS and the center of enhancers. Enhancers were identified by the ABC model. Low temperature (LT). B) Boxplots of gene expression for genes with only the promoter, with only the enhancer, with both, or with neither. P-values were calculated with Wilcoxon signed-rank tests. The number of genes for each category is given in parentheses. The medians are indicated in the boxplot. C) Schematic diagrams for the reporter constructs of the dual-luciferase assay (top) and results of the assay in N. benthamiana leaves showing that candidate enhancers increase LUC transcription levels (bottom). pCaMV, cauliflower mosaic virus (CaMV) 35S promoter; mpCaMV, 35S minimal promoter; Rluc, Renilla reniformis luciferase; CaMV term, CaMV terminator; luc, firefly luciferase; DHS, candidate enhancer. pCaMV:luc served as a positive control. mpCaMV:luc served as a negative control. D) Relative Luc/Rluc activity from the dual-luciferase assay. The ratios between Luc and Rluc activities were calculated from N. benthamiana leaves. Data are shown as means ± Se (standard error, n ≥ 3). Statistical significance was determined by Welch's t-test (*P < 0.05; **P < 0.01). E) Number of candidate enhancers in response to low temperature. Venn diagram shows the number of enhancers in 0 d, 1 d, and 3 d. F) Integrated Genome Viewer browser window of normalized read coverage for RNA-seq, DNase-seq data, and putative loops for representative genes at 0, 1, and 3 d at 6 °C.
We then looked for cold-induced and time-specific enhancers and detected 22,445 cold-induced enhancers, of which 6,556 and 10,527 displayed time-specific functions (Fig. 3E and Supplemental Table S12). Among the cold-induced enhancers, we identified 103 enhancers that directly bind to the promoter regions of 58 BRGs. For example, MaGDE1 (GLYCEROPHOSPHODIESTER PHOSPHODIESTERASE 1, Ma10_g12100) and MaPLA1II5 (PHOSPHOLIPASE A1-II 5, Ma08_g26980) were regulated by distal enhancers and showed increased expression levels after exposure to low temperature (Fig. 3F). Our findings suggest that low temperature promoted the establishment of distal regulation in intergenic loci, which displayed enhancer activity and were involved in the regulation of BRG expression.
Footprints reveal the importance of the WRKY family in response to low temperature and browning formation
Accessible chromatin regions are widely distributed throughout the banana genome, providing hotspots for TF binding. We were interested in the timing of motif activity over the course of the cold treatment. We thus used the software chromVAR (Schep et al. 2017) to identify motif activity in response to low temperature (Supplemental Table S13). From 0 to 3 d, binding sites for ARF, AGL (MADS-BOX TRANSCRIPTION FACTOR LIKE), and GATA TFs were less abundant, suggesting that the loci to which these CREs belong undergo chromatin reprogramming. By contrast, we detected an enrichment for the binding sites of TFs like WRKYs, NACs, CBFs, TCPs (TEOSINTE BRANCHED1, CYCLOIDEA, AND PCFs), and ERFs (ETHYLENE-RESPONSE FACTORs) after 3 d in the cold (Fig. 4A). Notably, WRKYs, NACs, TCPs, CBFs, and ERFs are core regulators involved in the transcriptional cascade in response to cold in various plant species (Han et al. 2020; Sun et al. 2020; Wang et al. 2021). Interestingly, we also determined that the binding sites of several TF families, such as TCPs and MYBs, were highly accessible at both 0 and 3 d of cold treatment, indicating that the functions of these TF families are diverse (Fig. 4A).
![Footprint analysis of CREs. A) Identification of TF activity. Heatmap showing motif activity, as determined by chromVAR. Motif families are shown to the right. The heatmap represents the Z-score of motif activity, based on DNase-seq results. Low temperature (LT). B) Pairwise comparison of TF binding plots for 2 conditions (1 LT vs. 0 LT; 3 LT vs. 0 LT at 6 °C) by TOBIAS. Volcano plots show the differential binding score of each TF along the x-axis and −log10 (P-value) along the y-axis. Each circle represents 1 motif. C) Footprint analysis by TOBIAS for clusters 4, 5, and 6. D) Examples of WRKY binding sites in accessible chromatin at BRGs, as revealed by footprint analysis. E) Pairwise comparison of differently expressed WRKY plots for 2 conditions in banana peel. Volcano plots show the log2 (fold change) of each WRKY along the x-axis and -log10 (q-value) along the y-axis. The size of the circle represents gene expression level (Transcripts Per Kilobase of exon model per Million mapped reads [TPM]). Each circle represents 1 WRKY. F) Differentially expressed WRKYs (DEWRKY) in the RT and LT groups. G) Heatmap of the expression level of shared DEWRKY in the RT and LT groups. Room temperature (RT).](https://oup.silverchair-cdn.com/oup/backfile/Content_public/Journal/plphys/193/1/10.1093_plphys_kiad322/2/m_kiad322f4.jpeg?Expires=1749221041&Signature=sLhHlL0tumPvG-as3AxOLsKvD4olSjV86Sj4MCCM~K4SWB93LwQjZ9JDAWLV4rfLzadEPWaAmqUjYxPNlvOndJFS1h~T0eJ6TMBYFoausf6~dJMieXWdxgfi25--H0zhKRKMyDIsyqafe-RP69DaT3vPgytERfjRsvrnTK1EwjCBb11JZp~gFAkBQKPZbgXseN143kKK9i8iBIndfl2DnF1EhJPtWKoQ3oiPYBtxzOpVdjYBuhsg4IguC0tRmbd240jS8SaNLRWcMlvyGVWMnqaebx8-bxugDq4ytC4DA5uT5sx~YZfFiw-TEL3R0C5E6ESZAuTk-QaOWjQEtT~6DA__&Key-Pair-Id=APKAIE5G5CRDK6RD3PGA)
Footprint analysis of CREs. A) Identification of TF activity. Heatmap showing motif activity, as determined by chromVAR. Motif families are shown to the right. The heatmap represents the Z-score of motif activity, based on DNase-seq results. Low temperature (LT). B) Pairwise comparison of TF binding plots for 2 conditions (1 LT vs. 0 LT; 3 LT vs. 0 LT at 6 °C) by TOBIAS. Volcano plots show the differential binding score of each TF along the x-axis and −log10 (P-value) along the y-axis. Each circle represents 1 motif. C) Footprint analysis by TOBIAS for clusters 4, 5, and 6. D) Examples of WRKY binding sites in accessible chromatin at BRGs, as revealed by footprint analysis. E) Pairwise comparison of differently expressed WRKY plots for 2 conditions in banana peel. Volcano plots show the log2 (fold change) of each WRKY along the x-axis and -log10 (q-value) along the y-axis. The size of the circle represents gene expression level (Transcripts Per Kilobase of exon model per Million mapped reads [TPM]). Each circle represents 1 WRKY. F) Differentially expressed WRKYs (DEWRKY) in the RT and LT groups. G) Heatmap of the expression level of shared DEWRKY in the RT and LT groups. Room temperature (RT).
Although accessible chromatin defines hotspots for TF binding, the occupancy of a TF at its cognate binding site also occludes the cleavage site by DNase I, thereby leaving a footprint of TF binding (Neph et al. 2012). We therefore performed a genomic footprint analysis to understand the function of CREs in banana peels under low temperature using the TOBIAS (Transcription factor Occupancy prediction By Investigation of ATAC-seq Signal) framework (Bentsen et al. 2020) (Supplemental Table S14). We focused on the occurrence of the browning spots following cold exposure for 1 d (Fig. 4B). We detected a transition from binding of the TFs ATHB (A. thaliana HOMEOBOX), AGL, GRF (GROWTH-REGULATING FACTOR), and ARF to their cognate motifs on 0 d to binding of WRKY and ERF TFs after 1 d at 6 °C, indicating that low temperature facilitates the binding and the presumed activation of WRKY and ERF family members.
To better understand the contribution of TFs to the low-temperature response and browning formation, we mapped the TF binding activity of each cluster via TOBIAS (Fig. 4B and Supplemental Fig. S3A and Table S15). In the upregulated cluster (clusters R4, R5, and R6), the binding of WRKY and NAC TFs was strongly enriched upon exposure to cold, while TFs belonging to the TCP and MYB families showed preferential binding under control conditions, suggesting that their binding to their cognate motifs decreases at low temperature. In the downregulated cluster (clusters R1, R2, and R3), the binding of development-related TFs like AGLs, ARFs, and GRFs was replaced by the binding of ERF, MYB, NAC, and WRKY members to chromatin in response to cold. Interestingly, NACs and MYBs bound to their cognate motifs both before and following cold treatment. Notably, WRKYs only showed binding to their motif after cold treatment across all clusters (Fig. 4C). For instance, the promoter regions of MaLOX6 (LIPOXYGENASE 6, Ma10_t17560.1), MaMGL3 (MONOGLYCERIDE LIPASE, Ma07_t13610.1), MaPLDδ (PHOSPHOLIPASE D DELTA, Ma01_t02670.1), and MaPPO1 were enriched for the core motif (-TTGAC-) of WRKY TFs, with a much stronger signal upon cold exposure (Fig. 4D and Supplemental Fig. S3B). These results were complementary to those obtained with chromVAR. In addition, RNA-seq data showed that 100 WRKYs were differentially expressed in the LT group, of which 38 were shared with the RT group (Fig. 4, E and F). Most of the 38 shared WRKYs displayed opposite expression patterns in the RT and LT groups (Fig. 4G), suggesting that WRKYs were specifically induced in low temperature. Interestingly, we compared the expression levels of WRKYs in banana and temperate fruit apple (Malus domestica) at low temperature and found that WRKYs in banana peels were specifically induced and showed much higher levels of expression than those in apple peels (Supplemental Fig. S3C and Tables S16 and S17). These results suggest that the WRKY family plays a central role in response to low temperature and is strongly associated with banana peel browning.
WRKY TFs were involved in cold tolerance and membrane lipid degradation in banana peels
To gain insight into the regulation of cold-induced genes in banana peels by WRKY TFs, we used DNA affinity purification and sequencing (DAP-seq) for several selected WRKY TFs: MaWRKY18 (Ma03_t13060.1), MaWRKY40 (Ma07_t16310.1), MaWRKY60 (Ma07_t05300.1), MaWRKY11 (Ma09_t23420.1), and MaWRKY33 (Ma06_t01150.1), whose encoding genes were rapidly upregulated upon low temperature and showed high expression (Supplemental Table S18). The peaks of these 5 DAP-seq were mainly located in the TSS flanking regions, and de novo motif analysis showed that the core motif (-TTGAC-) was significantly enriched in the 5 WRKY DAP-seq, which is consistent with the WRKY TF binding motif in Arabidopsis (Fig. 5, A and B).
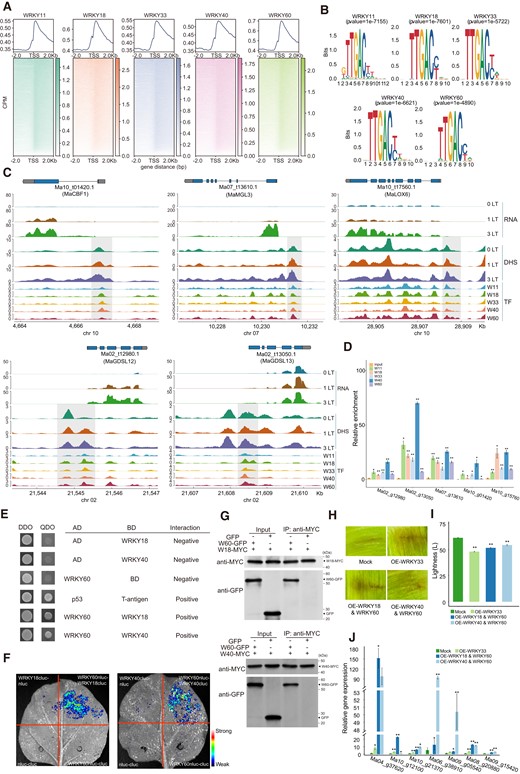
WRKY TFs participate in cold tolerance and membrane lipid degradation. A) Metaplots and distribution of DAP-seq reads for 5 WRKYs across the gene body and 2 kb upstream/downstream of the TSS. B) de novo motif analysis of 5 WRKY DAP-seq peaks. C) Integrated Genome Viewer showing normalized read coverage from RNA-seq, DNase-seq, and DAP-seq across the MaCBF1 and 4 BRG genomic regions. D) DAP-qPCR assay for validating the enrichment of peaks in promoter regions of candidate genes. E) Y2H assay showing the pairwise interaction between 5 WRKYs. AD, GAL4 activation domain; BD, GAL4 DNA binding domain. Yeast colonies were grown on DDO and QDO media. F) BIFC assay showing the pairwise interaction between WRKYs. G) Co-IP assay showing the pairwise interaction between WRKYs. H) Browning phenotypes of banana peels transiently overexpressing empty vector (mock control) or WRKY33 or both WRKY18 and WRKY60 or both WRKY40 and WRKY60. I) Lightness of infiltrated banana peels. Data are shown as means ± Se (standard error, n ≥ 3); asterisks represent significance between 2 treatments (t-test, *P < 0.05; **P < 0.01). J) Expression of 7 BRG transcripts in infiltrated banana peels. Data are shown as means ± Se (standard error, n ≥ 3); asterisks represent significance between 2 treatments (t-test, *P < 0.05; **P < 0.01).
We then integrated the RNA-seq, ChIP-seq, DAP-seq, and DNase-seq data sets to explore WRKY accessibility and binding to open chromatin. Looking through the list of WRKY target genes defined by DAP-seq (Supplemental Table S19), we noticed that WRKYs bind to the MaCBF1 promoter, which was rich in activating histone marks. In agreement, we detected high expression of MaCBF1 (Fig. 5C), although the expression levels of MaICEs (Ma06_g09680 and Ma10_g12250), encoding a putative upstream regulator, compared to Arabidopsis were lower from 0 to 3 d at low temperature. In addition, we found that WRKYs directly bind to the promoter region of cold-induced MaC2H2 (Ma09_g03200), encoding a C2H2 zinc-domain TF that functions as a transcriptional repressor of MaICE1 expression in response to cold stress (Han and Fu 2019). In addition to CBF1, Thioredoxin h2 (Trx-h2), whose encoding protein interacts with CBFs (Lee et al. 2021), showed an expression pattern similar to that of MaCBF1. These results suggest that WRKYs may directly or indirectly regulate MaCBF1 expression in response to low temperature.
In addition to mechanisms of cold tolerance, we investigated the function of WRKYs in peel browning. We determined that the promoters of 46 BRGs (34 upregulated and 12 downregulated) are targeted by at least 1 WRKY TF, such as MaGDSL12 (Ma02_t12980.1), MaGDSL13 (Ma02_t13050.1) MaMGL3, and MaLOX6 (Fig. 5C). DAP-qPCR experiments showed that the binding of WRKY TFs was significantly enriched in the promoters of these 4 BRGs (Fig. 5D and Supplemental Table S20). In addition, we found that 9 BRGs were not only bound by WRKY TFs but also targeted by cold-induced enhancers (Supplemental Tables S12 and S19), indicating that WRKYs bind to the enhancer and core promoter regions of BRGs, forming enhancer–promoter interactions that further enhance the expression of BRGs at low temperature.
Previous studies have shown that AtWRKY60 modulates responses to abiotic and biotic stresses together with AtWRKY40 and AtWRKY18, with which it physically interacts (Arrano-Salinas et al. 2018; Abeysinghe et al. 2019). To assess whether banana WRKYs similarly interact, we performed a yeast 2-hybrid (Y2H) assay (Supplemental Table S21) and observed an interaction between MaWRKY60 and MaWRKY40, and between MaWRKY60, WRKY40, and MaWRKY18 (Fig. 5E and Supplemental Fig. S4A). In addition, the protein interactions of WRKYs were also validated in bimolecular fluorescence complementation (BiFC) and Co-IP assays (Fig. 5, F and G). This result suggests that a complex comprised of MaWRKY18, MaWRKY40, and MaWRKY60 may regulate the expression of their downstream target genes in response to low temperature.
We further test the effect of WRKYs in promoting peel browning, MaWRKY-overexpression vectors (pEXT06-MaWRKY11/18/33/40/60) or their combination vectors (WRKY18 + MaWRKY60, WRKY40 + MaWRKY60) were injected into the banana peels. The infiltration peels were then observed after 3 d of incubation at 23 °C. As expected, the overexpression of MaWRKYs and the combinations promoted the browning of the peels (Fig. 5, H and I, and Supplemental Fig. S4, B to D). RT-qPCR analysis confirmed that MaWRKY overexpression significantly increased the expression of BRGs, such as MaGSDL11, MaGDE1, MaMGL4 (Ma10_g21370), MaPLA1β2, MaGDSL4 (Ma09_g05540), MaMGL (Ma08_g20880), and MaLOX5 (Ma09_g15420) (Fig. 5J and Supplemental Table S22). Meanwhile, transient silencing of 3 WRKY TFs (WRKY18, WRKY40, and WRKY60) was performed simultaneously in banana peels (Supplemental Table S23). After incubation at 6 °C for 3 d, the infiltrated peels were observed. Compared to the Mock group, the WRKY-silenced group showed slight browning (Supplemental Fig. S4, E and F). The expression levels of 3 WRKYs and BRGs were significantly decreased (Supplemental Fig. S4G and Table S22). These results suggest that MaWRKYs promote low temperature-induced banana peel browning by enhancing the expression of BRGs.
Network analysis of banana peel browning during low temperature with core WRKYs
To further understand how WRKY TFs coordinate other TFs in response to low temperature, we constructed a TF regulatory network with WRKYs at its core, consisting of specific edges connecting TFs–WRKYs–TFs under control and cold treatment conditions (Supplemental Fig. S4H and Table S24). We defined the dynamics of the TF network in response to low temperature. We observed that many TF regulatory edges were lost, but more TF regulatory edges were established at low temperature (Supplemental Fig. S4I). For example, MYB3R5 only regulates WRKY genes under control conditions, as did WRKYs for the expression of GATA12, AGL6, and MYB61, all of which control plant development. Conversely, ERF4 and HSFB2A (HEAT-SHOCK FACTOR B2A) exhibited a rewiring of their network resulting in the induction of WRKY gene expression in the cold, and their encoded TFs in turn regulated ERF054, CAMTA2, and NAC103 expression (Supplemental Fig. S4J).
To explore the molecular basis of browning formation in more detail, we dissected the cold-induced network comprising TF-regulated TFs and BRGs by integrating the DAP-seq data sets for the 5 WRKYs and the footprint and candidate enhancers described above (Supplemental Fig. S4K and Supplemental Table S25). The resulting browning network showed 10 regulatory patterns, including 580 regulatory interactions (Supplemental Fig. S4L). For example, WRKY18 directly regulated MaLOX5B expression; WRKY60 indirectly controlled MaAAO3 expression by inducing that of ERF019 (Fig. 6A). Notably, we found that the regulatory relationships between WRKY TFs were all reconstructed in low temperature (Fig. 6B). In addition, the RNA-seq data confirmed that the expression profile of lipase genes follows that of the 5 WRKY genes closely, consistent with the lipase genes being direct targets of the 5 WRKYs in response to low temperature (Fig. 6C). Among these BRGs directly regulated by WRKYs, MaPLA1β2 and MaGGDE1 were also regulated by the WRKY-targeted enhancer and showed increased expression levels (Fig. 6D). Collectively, these results suggest that the core WRKY module directly or indirectly regulates downstream target genes involved in membrane lipid degradation or oxidation during banana peel browning upon exposure to low temperature.
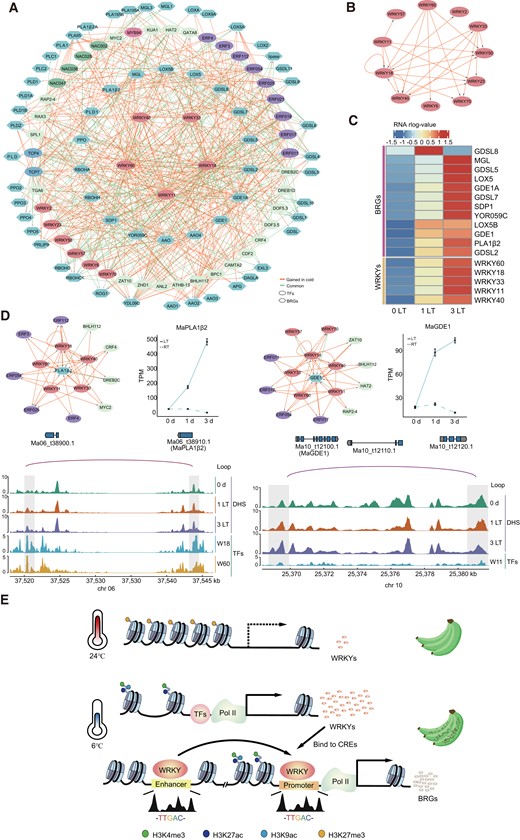
Dynamics of browning-related interaction networks and model of banana peel browning at low temperature. A) Rewiring of browning-related networks by 5 WRKY TFs at low temperature. Dynamic TF binding is represented by orange (regulation gain) and green (common regulation of the control and cold treatment) edges, at low temperature. Ellipses, TFs; hexagons, BRGs, based on binding data generated by DAP-seq. BRGs on the inside are directly regulated by at least 1 of the 5 WRKYs. B) Reconstructed WRKY regulatory network in low temperature. C) Heatmap of expression levels of the 5 WRKY TFs and their direct BRG targets. Normalized value was calculated from the RNA-seq data sets. D) Two BRGs directly regulated by WRKY TFs. Integrated Genome Viewer browser window of normalized read coverage DNase-seq data and putative loops for representative genes at 0, 1, and 3 d at 6 °C. Gene expression level was shown on the right. Data are shown as means ± Se (standard error, n ≥ 3). E) Model of the role of WRKYs in browning. Low temperature induces the expression of WRKY genes, whose encoded TFs bind to the promoter regions of BRGs and may activate their transcription, as well as to BRG enhancers, forming a chromatin loop that further enhances BRG expression.
Discussion
Low-temperature storage is widely used to extend the shelf life of fruits after harvest but can cause severe CIs in tropical fruits such as banana, mango (M. indica), and lychee (Litchi chinensis). Peel browning is a major CI in banana fruits, affecting banana quality and sensory assessment. In our study, we present comprehensive data sets describing the transcriptome, epigenetic features, and TF binding to establish a transcription regulatory map of banana peels exposed to low temperature. From this map, we established that short periods of low-temperature exposure induced the expression of many genes, including those related to phospholipid metabolism and oxidation. These cold-induced genes were frequently associated with accessible chromatin and enrichment of active histone marks along their promoters, such as H3K4me3, H3K9ac, and H3K27ac. Among these genes, most BRGs were activated by WRKY TFs, which bound to their promoter regions to and also to enhancers of BRG expression, likely forming a chromatin loop that further enhances the expression of BRGs (Fig. 6E). The key contribution of this work is the extensive resources generated for studying gene regulation and functional biology of banana peels under cold stress.
Histone modifications are hallmarks of gene activity. Acetylation of histone H3 weakens the interaction between histones and DNA and is associated with actively transcribed genes in response to environmental stimuli (Karmodiya et al. 2012; Gates et al. 2017). We determined that H3K9ac and H3K27ac were distributed in TSS flanking regions, thereby increasing the expression levels of their associated genes (Fig. 2B). Notably, we did not detect any correlation between enhancers and acetylated regions (Fig. 2, C and E). This observation may be due to the inability of acetylated histones to mark enhancers in banana peel as previously reported in Arabidopsis (Yan et al. 2019). This finding suggests that histone acetylation is not useful to annotate enhancers but rather marks active promoter regions with accessible chromatin in plants.
Chromatin accessibility analyses reflect distribution of CREs and provide crucial information about the transcriptional regulatory events underlying responses to environmental cues. Low temperature affected chromatin accessibility in potato (Solanum tuberosum) and the grasses, promoting an accessible chromatin environment for TFs to regulate the expression of relevant genes (Zeng et al. 2019; Han et al. 2020). Our study illustrated the global chromatin accessibility landscape of banana peels under low-temperature conditions, with intergenic regions and promoter regions being enriched in CREs and making up most of the accessible chromatin, indicating a critical role for distal regulatory elements in response to low temperature (Fig. 2C). Interestingly, we found many genes involved in growth and the RNA polymerase III complex with lower chromatin accessibility but relatively stable expression levels in response to cold (Fig. 1F and Supplemental Fig. S2, F and G). Other studies described similar results when analyzing the effects of hypoxic stress on Arabidopsis seedlings (Lee and Bailey-Serres 2019), possibly reflecting how plants mobilize resources in response to environmental stress, thus limiting the supplementation of energy produced by macromolecular complexes (Juntawong et al. 2014; Sorenson and Bailey-Serres 2014). These transcripts encoding macromolecular proteins and cellular machinery components tend to be maintained in response to environmental stimuli but are seldom translated.
The analysis performed with chromVAR and TOBIAS software revealed that low temperature influenced the accessible chromatin landscape and the binding of WRKY and ERF TFs (Fig. 4, A and B, and Supplemental Fig. S3A). Indeed, our findings are consistent with earlier reports in grasses and tea (Camellia sinensis) plants that ERFs and WRKYs play important roles in low-temperature conditions (Han et al. 2020; Wang et al. 2021). Notably, in addition to ERFs, we observed a strong increase of WRKY TF binding to their cognate motifs in upregulated clusters and BRGs, suggesting that WRKYs may be core regulators of browning formation (Fig. 4C and Supplemental Fig. S3B). Furthermore, our DAP-seq data revealed that WRKYs not only directly bound to the promoter regions of BRGs to activate their expression but also bound to their enhancers to form a chromatin loop that further enhanced their expression (Figs. 3F and 6A). These findings suggest that the cold tolerance conferred by WRKY TFs is conserved across plant species, as well as the core function of cold-induced enhancers in browning formation.
Land plants have evolved effective mechanisms to adapt to low-temperature stress at the molecular and physiological levels, such as the ICE1-CBF-COR (COLD-REGULATED) signaling module (Shi et al. 2015). Over the last 2 decades, much work has been devoted to uncovering the key components of low-temperature tolerance in model plants and dissecting their regulatory mechanisms (Lee et al. 2021; Luo et al. 2021; Song et al. 2021; Kopec et al. 2022), such as some apple varieties, raise their cold tolerance via the ICE1-CBF-COR pathway (An et al. 2021, 2022), and the expression levels of most WRKY genes in apple peels do not change significantly under cold treatment (Supplemental Fig. S3C and Table S16). However, tropical banana fruits may have repurposed WRKYs, which were directly involved in CBF expression (Fig. 5C and Supplemental Table S17) and may block ICE1 by inducing C2H2 (Han and Fu 2019). These WRKYs have been reported to be involved in immune response against pathogens in Arabidopsis (Arrano-Salinas et al. 2018; Abeysinghe et al. 2019) but may have been coopted to regulate the cold response in banana peels. Therefore, we hypothesize that this mechanism, whereby bananas repurposed WRKYs away from immunity to cope with cold stress, might be limited to cold tolerance but causes substantial adverse effects (Fig. 6E). These adverse effects break homeostasis within the cell, eventually causing browning.
Materials and methods
Plant material and treatment conditions
Mature-green banana (M. acuminata AAA group, Cavendish) fruits were harvested from Guangxi province. Banana fruit fingers were selected to be uniform and free from any physical injury or disease. All fruit fingers were soaked in 0.1% (v/v) Sporgon solution for 5 min to eliminate surface pathogens and were then air dried at room temperature. Subsequently, these banana fruits were exposed to low temperature (6 °C) for 1 or 3 d. Banana fruits without low-temperature treatment were used as control samples. For transient expression of WRKYs in banana peels, the full lengths of MaWRKY18, MaWRKY11, MaWRKY33, MaWRKY40, and MaWRKY60 were cloned into the binary vector pEXT06, driving by the maize UBI-1 promoter. The resulting constructs were transformed into Agrobacterium tumefaciens strain EHA105. Then, WRKY overexpression vectors and their combinations were injected into banana peels (Shan et al. 2020). The treated fruits were placed in the dark for 24 h and incubated at 23 °C for 3 d. The infiltrated peels were collected for measurement of lightness and gene expression. For WRKY silencing assay, the conserved DNA sequence of WRKY18, WRKY40, and WRKY60 was cloned into the pTRV2 vector. The resulting construct and pTRV1 were transformed into Agrobacterium strain EHA105 and mixed and injected into banana peels. The treated fruits were incubated at 6 °C for 3 d. The infiltrated peels were collected for measurement of lightness and gene expression (Wei et al. 2023).
Bagged apple (M. domestica cv. “Red Fuji”) fruits were harvest from Beijing and exposed to low temperature (6 °C) for 1, 3, or 5 d under white light (390 to 780 nm, 215 µmol m−2 s−1). Apple fruits without low-temperature treatment were used as control samples.
N. benthamiana was grown in a 1:1 mixture of nutritive soil and vermiculite at 23 °C ± 1 °C with relative humidity of 50∼60% in a greenhouse (light intensity of 120 µmol m−2 s−1) under a 16/8-h day/night cycle.
Measurement of fruit peel color and firmness after low-temperature treatment
The lightness and firmness of 3 randomly selected banana fruits were measured daily from 0 to 3 d. The lightness of banana peels was measured with a benchtop colorimeter (CR-5, Konica Minolta). Color values for L*, a*, and b* were recorded, and the L* value was used to evaluate the change in lightness of banana peels upon low temperature. The firmness of banana peels was measured with a Stable Micro System Texture Analyser with a P5 probe, with a contact area of 19.63 mm2. The forces were recorded to evaluate the change in firmness of banana peels at low temperature. LOX and PPO activities, H2O2 levels, and MDA content were assayed according to the kit manufacturer's instructions (Grace Biotechnology, Suzhou, China), and a previous report with slight modifications (Zhu et al 2019).
RNA sequencing
A total of 21 RNA samples were extracted from banana peels (0, 1, and 3 d) and apple peels (0, 1, 3, and 5 d) with the hot borate method (Kuang et al. 2020). Both day 0 of banana peel and apple peel were used as control groups for subsequent analysis, respectively. The mRNA was captured using a NEBNext Ultra RNA Directional Library Prep Kit (#E7420S, NEB), and Truseq sequencing libraries were prepared. The libraries were sequenced on an Illumina NovaSeq 6000 platform in a PE150 mode (2 × 150 bp paired-end reads). Three biological replicates were analyzed for each time point.
Raw reads were trimmed by fastp (version 0.12.4) with default parameters. FastQC (version 0.11.9) was used for quality control. Clean reads were then aligned to the banana reference genome (DH-Pahang v2) (Martin et al. 2016) or apple reference genome (M. domestica GDDH13 Whole Genome v1.1) (Daccord et al. 2017) using hisat2 (version 2.1.0) (Kim et al. 2015) with default parameters. Reads were then converted from SAM to BAM format, sorted, and indexed by Samtools (version 1.7) (Li et al. 2009). The read mapping to each gene was counted by the R package Rsubread (version 2.8.1) (Liao et al. 2019) with the featureCounts function. The counts were then used for differential expression analysis by DESeq2 (version 1.34.0) (Love et al. 2014), and principal component analysis (PCA) was performed by DESeq2 with the PlotPCA function. The transformed counts were normalized by DESeq2 and used in the next steps of analysis. The threshold for DEGs was set to |fold-change| ≥ 2, false discover rate (FDR) ≤ 0.01, and mean expression of transcript per million (TPM) ≥ 1. GO and KEGG analyses were performed with the R package clusterProfiler (version 4.2.2) (Yu et al. 2012), and the plot was generated by ggplot2 (version 3.3.6).
DNase-seq
Banana peels were ground into a fine powder in liquid nitrogen. Nuclei were extracted and digested as previously described (Lü et al. 2018). Subsequently, digested genomic DNA (gDNA) was separated by electrophoresis on agarose gel and recovered. The purified DNA was used to generate sequencing libraries with an Illumina TruSeq kit before being sequenced. A gDNA sample digested with DNase was also sequenced as the input/control.
Raw reads were processed using trim_galore (version 0.6.7) to trim low-quality regions and adaptors. The clean reads were aligned to the banana genome reference using Bowtie2 (version 2.2.5) (Langmead and Salzberg 2012) with default parameters. The SAM files were converted to BAM format, sorted, and indexed. Aligned reads with mapping quality below 30 were removed, those with improperly paired alignments and those mapping to the organelle genome, all with Samtools (version 1.7) (Li et al. 2009). Duplicated reads were removed by Picard tools. Peaks were called using MACS2 (version 2.2.7.1) (Zhang et al. 2008), and a relaxed threshold of P ≤ 0.01 was adapted in peak calling to enable the correct computation of the irreproducible discovery rate (IDR) (version 2.0.4.2) (Li et al. 2011) by merging the replicate peaks. The differentially accessible regions were identified based on the criteria |fold-change| ≥ 1.5 and FDR ≤ 0.05 by DESeq2 (version 1.34.0) (Love et al. 2014), and the transformed counts were used for analysis. Each peak was attached to its nearest gene if it was located 2 kb upstream to 1 kb downstream of the transcription start site (TSS) using GenomicFeatures (version 1.46.5) in R. The scores of TF activity were calculated by chromVAR (version 1.16.0) (Schep et al. 2017) using the peak accessibility scores as the inputs. The footprinting analysis was performed by TOBIAS (version 0.13.2) (Bentsen et al. 2020) with parameters: −read-shift 0 0 and −k_flank 6 in corrects bias process with the TOBIAS ATACorrect tool. The TF-to-TF interaction network was generated with the CreateNetwork function of TOBIAS. Cytoscape (version 3.9.1) (Shannon et al. 2003) software was used to plot the regulatory networks. The enhancer regions were predicted with the activity-by-contact model of enhancer–promoter regulation (ABC-Enhancer-Gene-Prediction, version 0.2.2) (Fulco et al. 2019), and the enhancer–gene connections from the ABC model were used to predict the putative target genes for a given TF. The connections between TFs and the promoter of their target genes were determined using the “closest” command of the BEDTools (Quinlan and Hall 2010) suite.
Hi-C
Hi-C library was performed as previously described (Dong et al. 2017). Nuclei were extracted and lysed with 0.5% SDS (w/v) at 65 °C for 5 min and then quenched by 10 volumes of 1% Triton X-100 (w/v). The chromatin was digested by MboI at 37 °C for 2 h. The ends were repaired by Klenow with biotin-14-dATP at 37 °C for 1 h; then, T4 ligase was added and ligated at 25 °C for 4 h. After reversed crosslinking, DNA was extracted and sonicated to 300 to 500 bp before binding to the streptavidin beads. The Illumina libraries were constructed on the beads before sequencing.
Hi-C data were processed using trim_galore (version 0.6.7) to trim low-quality bases and adaptor sequences. The clean reads were aligned to the banana genome reference using Bowtie2 (version 2.2.5) (Langmead and Salzberg 2012), and 5-kb resolution contact maps were constructed with HiC-Pro (version 3.1.0) (Servant et al. 2015) and “LIGATION_SITE = GATCGATC”.
ChIP-seq
Banana peels were fixed with 1% (w/v) formaldehyde in 1× phosphate-buffered saline (PBS) for 15 min under vacuum and then ground to a fine powder in liquid nitrogen. Nuclei were extracted and sonicated as previously described (Lü et al. 2018). The chromatin samples were incubated overnight with Dynabeads protein A/G (Invitrogen) and specific antibodies (H3K4me3, H3K27me3, H3K9ac, and H3K27ac; RevMAb and Millipore). The beads were then washed twice with low-salt buffer (150 mM NaCl in 10 mM Tris-HCl, 1 mM EDTA [TE]) and high-salt buffer (250 mM NaCl in TE). The washed beads were treated with Tn5 transposase for 30 min at 37 °C. The beads were then washed with low-salt and TE buffer and reverse crosslinked for 8 h. The purified DNA was then amplified with N50x and N70x index primers. Two biological replicates were sequenced for the experiment.
Trimming, mapping, postalignment processing, and peak calling of ChIP-seq data were performed as for the DNase-seq data above. The peaks were divided into 5 groups: exon, intron, intergenic region, TSS-proximal (<2 kb from TSS), and TTS-proximal (<300 bp from TTS). The chromatin states were determined and characterized based on 4 histone modification marks by ChromHMM (version 1.2.3) (Ernst and Kellis 2017). The averaged read densities were plotted by the computeMatrix and plotProfile functions within deepTools (version 3.5.1) (Ramirez et al. 2016).
DAP-seq
gDNA was extracted from low temperature-treated banana peel by the CTAB method and fragmented to an average of 200 bp by sonication. DAP-seq gDNA input libraries and the DAP-seq library were prepared as previously described (O'Malley et al. 2016). Trimming, mapping, postalignment processing, and peak calling of DAP-seq data were performed as for the DNase-seq data above. Each peak was attached to the nearest gene if it was located within 2 kb upstream to 1 kb downstream of the TSS using GenomicFeatures (version 1.46.5) in R.
Y2H assay
The full-length MaWRKY18, MaWRKY40, MaWRKY60, and MaWRKY33 coding sequences were individually cloned into the pGADT7 vector as prey. The full-length MaWRKY18, MaWRKY40, MaWRKY60, and MaWRKY11 coding sequences were individually cloned into the pGBKT7 vector as bait. The appropriate pairs of prey and bait plasmids were cotransformed into yeast (Saccharomyces cerevisiae) strain AH109 by the lithium acetate method. Positive transformants were selected on double-dropout (DDO) synthetic-defined (SD) medium lacking leucine and tryptophan (SD-Leu-Trp) for 3 d. Colonies were then plated onto quadruple-dropout (QDO) SD medium lacking leucine, tryptophan, adenine, and histidine (SD-Leu-Trp-Ade-His), and the potential for interactions was assessed based on growth for 2 d.
Luciferase reporter assay
Enhancer fragments of target DHSs were cloned upstream of the cauliflower mosaic virus (CaMV) 35S minimal promoter in pGreenII 0800-LUC to generate the reporter construct DHS-35S minimal promoter:luc. The reporter construct 35Spro: luc was used as a positive control, while pGreenII 0800-LUC with only the 35S minimal promoter was used as negative control. All reporter constructs were introduced into Agrobacterium (A. tumefaciens) strain GV3101. Constructs were infiltrated into N. benthamiana leaves, and LUC images were captured as previously described (Zhang et al. 2019).
BIFC assay
MaWRKY18 and MaWRKY40 full-length sequences were cloned into p1300-cluc, and MaWRKY60 full-length sequence was cloned into p1300-nluc. The constructs pro: nluc and pro: cluc; pro: WRKY-nluc and pro: cluc; and pro: nluc and pro: WRKY-cluc were used as negative controls. All reporter constructs were introduced into A. tumefaciens strain GV3101. The constructs were infiltrated into N. benthamiana leaves, and LUC images were captured by a low-light cooled CCD imaging apparatus (Tanon-5200, China) as previously described (Zhang et al. 2019).
Co-IP assay
MaWRKY18 and MaWRKY40 full-length sequences were cloned into p1300-MYC, and MaWRKY60 full-length sequence was cloned into p1300-GFP. The constructs pro: GFP and pro: WRKY-MYC and pro: WRKY-GFP and pro: WRKY-MYC were introduced into A. tumefaciens strain GV3101. The constructs were infiltrated into N. benthamiana leaves as previously described (Zhang et al. 2019). Co-IP assay was performed as previously described (Wu et al. 2021).
Accession numbers
Sequence data can be downloaded from the NCBI SRA database under the accession number PRJNA862911. The sequences used in this study can be found in the Banana Genome Hub (https://banana-genome-hub.southgreen.fr/) with the following accession numbers: MaCBF1, Ma10_g01420; MaCBF2, Ma06_g34430; MaCBF3, Ma09_g04570; MaPPO1, Ma08_g34740; MaPOD2, Ma10_g15940; MaLOX6, Ma10_g17560; MaPLA1β2, Ma06_g38910; MaGSDL11, Ma04_g37620; MaGDE1, Ma10_g12100; MaPLA1II5, Ma08_g26980; MaMGL3, Ma07_t13610.1; MaPLDδ, Ma01_t02670.1; MaWRKY18, Ma03_t13060.1; MaWRKY40, Ma07_t16310.1; MaWRKY60, Ma07_t05300.1; MaWRKY11, Ma09_t23420.1; MaWRKY33, Ma06_t01150.1; MaICEs, Ma06_g09680 and Ma10_g12250; MaC2H2, Ma09_g03200; MaGDSL12, Ma02_t12980.1; MaGDSL13, Ma02_t13050.1; MaMGL4, Ma10_g21370; MaGDSL4, Ma09_g05540; MaMGL, Ma08_g20880; and MaLOX5, Ma09_g15420.
Acknowledgments
We thank Chunzhen Cheng (Shanxi Agricultural University) and Xuejun Bei (Yulin Normal University) for providing the banana fruit materials, Ji Tian (Beijing University of Agriculture) for the apple materials, and Zhenbiao Yang (University of California, Riverside) for the comments on the manuscript.
Author contributions
P.L. designed the research. W.Z., X.N., S.X., Y.X., and Y.Q. performed the experiments. H.L., P.D., M.F., Y.Y., and Z.C. analyzed the data. W.Z. and P.L. wrote the manuscript.
Supplemental data
The following materials are available in the online version of this article.
Supplemental Figure S1. Physiological indexes of banana peel and overview of RNA-seq data sets.
Supplemental Figure S2. Epigenetic features in the banana genome in response to cold exposure.
Supplemental Figure S3. TOBIAS footprint analysis for the 3 clusters in Fig. 1F.
Supplemental Figure S4. Dynamics of the TF–WRKY–TF network.
Supplemental Table S1. Statistics of RNA-seq libraries.
Supplemental Table S2. Expression levels and clusters of DEGs.
Supplemental Table S3. GO analysis of the different DEG clusters.
Supplemental Table S4. KEGG analysis of the different DEG clusters.
Supplemental Table S5. Different chromatin states in ChromHMM and annotation of peaks from the upstream 2 kb to the downstream 1 kb of TSS.
Supplemental Table S6. Statistics of DNase-seq libraries.
Supplemental Table S7. Clusters of cold-induced DHSs based on PC1 of DEGs and annotation of peaks from the upstream 2 kb to the downstream 1 kb of TSS.
Supplemental Table S8. Clusters of DHSs based on PC1 of DEGs and annotation of peaks from the upstream 2 kb to the downstream 1 kb of TSS.
Supplemental Table S9. Quality control matrix for the Hi-C data.
Supplemental Table S10. Classification of genes with only promoter, with only enhancer, with both, or with neither.
Supplemental Table S11. Primer information of candidate enhancers.
Supplemental Table S12. Candidate enhancer regions and element–gene pairs with scores.
Supplemental Table S13. Z-scores of TF activity as determined by ChromVAR.
Supplemental Table S14. Results of binding positions for individual TFs across the genome by TOBIAS.
Supplemental Table S15. Results of binding positions for individual TFs across the genome in different clusters of DHSs by TOBIAS.
Supplemental Table S16. Expression levels of WRKY genes in apple peel at low temperature.
Supplemental Table S17. Expression levels of WRKY genes in banana peel at low temperature.
Supplemental Table S18. Primer information used for DAP-seq of the 5 WRKYs.
Supplemental Table S19. Target genes of the 5 WRKYs determined by DAP-seq.
Supplemental Table S20. Primer information used for DAP-qPCR.
Supplemental Table S21. Primer information used for the Y2H constructs.
Supplemental Table S22. Primer information used for RT-qPCR.
Supplemental Table S23. Primer information used for WRKY silencing vector construction.
Supplemental Table S24. TF binding network related to WRKYs in TOBIAS BINDetect.
Supplemental Table S25. Regulatory network of WRKY TFs and WRKY-BRGs.
Funding
This work was supported by the Construction of Plateau Discipline of Fujian Province (102/71201801101) and the Leading Innovative Talents Introduction and Cultivation Project, Changzhou, Jiangsu (CQ20220018).
References
Author notes
These authors contributed equally.The author responsible for distribution of materials integral to the findings presented in this article in accordance with the policy described in the Instructions for Authors (https://dbpia.nl.go.kr/plphys/pages/General-Instructions) is: Peitao Lü ([email protected]).
Conflict of interest statement. None declared.
