


Abstract
Somatic embryogenesis (SE) is a key regeneration pathway in various biotechnology approaches to crop improvement, especially for economically important perennial woody crops like citrus. However, maintenance of SE capability has long been a challenge and becomes a bottleneck in biotechnology-facilitated plant improvement. In the embryogenic callus (EC) of citrus, we identified 2 csi-miR171c–targeted SCARECROW-LIKE genes CsSCL2 and CsSCL3 (CsSCL2/3), which exert positive feedback regulation on csi-miR171c expression. Suppression of CsSCL2 expression by RNA interference (RNAi) enhanced SE in citrus callus. A thioredoxin superfamily protein CsClot was identified as an interactive protein of CsSCL2/3. Overexpression of CsClot disturbed reactive oxygen species (ROS) homeostasis in EC and enhanced SE. Chromatin immunoprecipitation sequencing (ChIP-Seq) and RNA-Seq identified 660 genes directly suppressed by CsSCL2 that were enriched in biological processes including development-related processes, auxin signaling pathway, and cell wall organization. CsSCL2/3 bound to the promoters of regeneration-related genes, such as WUSCHEL-RELATED HOMEOBOX 2 (CsWOX2), CsWOX13, and Lateral Organ Boundaries Domain 40 (LBD40), and repressed their expression. Overall, CsSCL2/3 modulate ROS homeostasis through the interactive protein CsClot and directly suppress the expression of regeneration-related genes, thus regulating SE in citrus. We uncovered a regulatory pathway of miR171c-targeted CsSCL2/3 in SE, which shed light on the mechanism of SE and regeneration capability maintenance in citrus.
Introduction
Somatic embryogenesis (SE) is an excellent research system to study the totipotency of plant cells, in which embryonic development occurs or even whole plants are formed from somatic cells without fertilization (Su et al. 2021). Owing to the extraordinary regenerative capacity of somatic embryos, SE has become a powerful method for propagation in vitro (Su et al. 2021) and generation of genetically modified crops with improved traits (Lowe et al. 2016). Somatic embryos form directly from explants or indirectly from embryogenic callus (EC), and the latter mode is more common in woody plants like citrus (Omar et al. 2016). In Arabidopsis thaliana, establishment of auxin maxima is essential for embryonic gene expression in vitro (Li et al. 2022). In citrus, however, SE was induced from EC by carbon source substitution of glycerol for sucrose in culture medium, rather than application of exogenous auxin. EC was induced from the undeveloped citrus ovules and used for biotechnology applications, such as somatic hybridization and genome editing. However, SE capability is weakened during subculture of EC, making regeneration the major obstacle to biotechnology-facilitated citrus improvement. The regulatory mechanisms of SE were rarely studied and not explicit in citrus.
Three SCARECROW-LIKE (SCL) genes, also named HAIRY MERISTEM (HAM) or LOST MERISTEMS (LOM), are miR171-targeted GRAS (GAI [gibberellin insensitive], RGA [repressor gibberellin], and SCR [scarecrow]) family genes in Arabidopsis (Llave et al. 2002; Rhoades et al. 2002). These SCLs are functional in a variety of developmental processes, including meristem development (Geng et al. 2021) and embryogenesis (Takanashi et al. 2018). A signal cascade model of ARABIDOPSIS THALIANA MERISTEM LAYER 1 (ATML1)-MIR171-HAM-WUSCHEL (WUS)-CLAVATA3 (CLV3) was proposed for new stem cell formation and stem cell niche maintenance in shoot apical meristems (SAM) in Arabidopsis (Zhou et al. 2015, 2018; Han et al. 2020b). It was reported that miR171 mediated spatiotemporal expression patterns of HAM1 which is essential for normal embryogenesis (Takanashi et al. 2018), and miR171/SCL regulated developmental processes via modulation of gibberellin and auxin signaling in Arabidopsis (Ma et al. 2014), tomato (Solanum lycopersicum) (Huang et al. 2017), and pear (Pyrus communis L.) (Jiang et al. 2018). The target SCLs, in turn, bind to the MIR171 promoter and activate its expression, forming a homeostatic feedback loop during branching and chlorophyll biosynthesis in Arabidopsis (Ma et al. 2014; Xue et al. 2014). miR171 accumulates at high levels in EC of citrus (Wu et al. 2011, 2015) and Lilium pumilum (Zhang et al. 2017a). Recently, the miR171-SCL6 module was reported to regulate SE in Lilium (Yan et al. 2022), but the regulatory pathway of SCLs in SE remains unclear.
SE induction is a complex process affected by many factors, and the redox environment is recognized as a regulator of somatic embryo formation in many plants, including spruce (Picea glauca) (Belmonte et al. 2005), Larix leptolepis (Zhang et al. 2009), cotton (Gossypium hirsutum) (Zhou et al. 2016), and Chinese fir (Cunninghamia lanceolata) (Hao et al. 2022). In spruce, a high ratio of reduced glutathione (GSH)/oxidized glutathione (GSSG) increases the number of embryos at initial stages, while development and maturation of somatic embryos proceed in response to a low GSH/GSSG ratio (oxidation state) (Belmonte et al. 2005). In the early SE induction of C. lanceolata, exogenous phytosulfokine (PSK) was added to effectively inhibit reactive oxygen species (ROS) outbreak and promote SE, accompanied by inhibited expression of peroxidase (PRX) enzyme and induced expression of SE–related gene WUSCHEL-RELATED HOMEOBOX 2 (WOX2) (Hao et al. 2022). In Valencia orange (Citrus sinensis), 5 proteins involved in GSH metabolism and antioxidative stress response exhibited dynamic expression patterns during SE (Pan et al. 2009).
ROS homeostasis was regulated by diverse antioxidant factors, including thioredoxins (Considine and Foyer 2014). Thioredoxins are small proteins that conduct reduction of disulfide bridges (S-S) of target proteins by conserved redox site CxxC (Meyer et al. 2005). Thioredoxins play key roles in the maintenance of cellular redox homeostasis through sensing and transfer of reducing equivalents or changing conformation of target proteins (Meyer et al. 2005). Thioredoxins were involved in SE of cotton by coordination of endogenous ROS homeostasis and auxin signaling (Zhou et al. 2016). In Arabidopsis, thioredoxin-dependent redox modification regulates the capacity of plant regeneration by the modulation of ROS homeostasis (Zhang et al. 2018).
Citrus is among the most important woody perennial fruit crops worldwide. SE is critical for germplasm innovation and genetic improvement via biotechnology in citrus (Guo et al. 2013; Omar et al. 2018). Recently, we validated that csi-miR171c is required for SE in citrus, and csi-miR171c overexpression promotes SE (Shi et al. 2022), but the downstream regulatory pathway remains unknown. In this study, we determined that CsSCL2/3 were the target genes of csi-miR171c in citrus callus, and suppression of CsSCL2 expression in EC enhanced SE. CsSCL2/3 interacted with the thioredoxin protein CsClot and suppressed expression of regeneration-related genes, thus to regulate SE in citrus. We uncovered the downstream pathway of the miR171-SCL module in regulation of SE in citrus, which provides insight into the regulatory network of SE in citrus.
Results
CsSCL2 and CsSCL3 were targets of csi-miR171 in citrus EC
Three CsSCL genes (CsSCL1/2/3) in citrus contain identical miRNA recognition elements (MRE) of csi-miR171c on the coding sequence (CDS) region (Supplemental Fig. S1A). The transient assay in Nicotiana benthamiana leaves validated the interaction of csi-miR171c with CsSCLs in vivo (Fig. 1, A to D). The intensity of the green fluorescence protein (GFP) signal was substantially reduced in leaf areas coexpressed with CsSCL-native MRE (nMRE) + pre-miR171c, compared with that of the CsSCL-nMRE + empty vector or the CsSCL- mutant MRE (mMRE) + pre-miR171c/empty vector (Fig. 1C). Moreover, the fluorescence readout ratio of the CsSCL-nMRE + pre-miR171c to CsSCL-nMRE + empty vector was significantly reduced compared with the CsSCL-mMRE + pre-miR171c to CsSCL-mMRE + empty vector (Fig. 1D). According to 5′ rapid amplification of cDNA ends (RACE) of CsSCLs in EC callus, CsSCL2 was cleaved between the 10th and 11th nucleotides of complementary sites to csi-miR171c, and CsSCL3 was cleaved between 18th and 19th nucleotides of complementary sites to csi-miR171c (Fig. 1E). However, no cleavage was detected at the predicted target site in CsSCL1 (Fig. 1E). Taken together, csi-miR171c targets and cleaves CsSCL2/3 mRNA but not CsSCL1 in citrus EC.
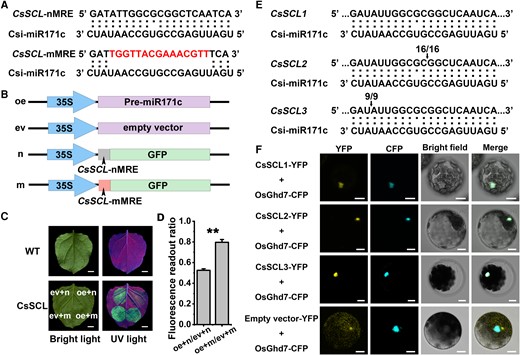
CsSCLs were the targets of csi-miR171c and CsSCL proteins located in cell nucleus. A) The sequences of native and mutant MRE of csi-miR171c on CsSCL (CsSCL-nMRE and CsSCL-mMRE). The double, single, and no point represent perfect, imperfect, and no complementation, respectively. The red nucleotides were modified. B) Diagrams of the overexpression vectors constructed for transient expression in N. benthamiana. oe, Pre-miR171c overexpression vector; ev, empty vector; n, the overexpression vectors of the native MRE with C-terminal fusion protein; m, the overexpression vectors of the mutant MRE with C-terminal fusion protein. C) GFP fluorescence on the N. benthamiana leaves injected with Agrobacterium tumefaciens. Photos were taken under bright field and UV light (excitation light wavelength 365 nm) 3 d after infection. WT leaf without any treatment showed no fluorescence signal under UV. Scale bars = 1 cm. D) The fluorescence readout ratios between different coexpression combinations within the injection areas of N. benthamiana leaves. Results are means of fluorescence readout ratio ± SEM from 4 leaves. Asterisks indicate statistically significant differences of CsSCL-nMRE compared with CsSCL-mMRE using an independent 2-sample t-test (*P < 0.05, **P < 0.01). E) Cleavage sites of csi-miR171c at MRE in CsSCLs (CsSCL1, CsSCL2, and CsSCL3) determined by 5′-RACE analysis. The arrows indicate the cleavage sites at MRE, and the numbers indicate the frequency of valid sequenced clones. F) Subcellular localization of CsSCL1, CsSCL2, and CsSCL3. CsSCL1-YFP, CsSCL2-YFP, CsSCL3-YFP, and empty vector-YFP, respectively, were cotransformed with OsGhd7-CFP (a nuclear marker) into Arabidopsis mesophyll protoplast. The photographs were captured with filters for YFP (excitation 514 nm/emission 550 to 590 nm), CFP (excitation 448 nm/emission 460 to 505 nm), bright light, and merged. Scale bars = 10 μm.
The GRAS protein family genes CsSCL1/2/3 have a variable N-terminal structure and a conserved C-terminal structure with 5 critical domains, i.e. LHRI, VHIID, LHRII, PFYRE, and SAW (Supplemental Fig. S1C). A phylogenetic tree based on the conserved C-terminal amino acid sequence showed that CsSCL1/2/3 in C. sinensis were clustered with AtSCL6 (miR171 target gene) in A. thaliana (Supplemental Fig. S1D). Especially, the closely clustered CsSCL2 and CsSCL3 have as much as 87.15% amino acid sequence identity and a bootstrap value of 100%, indicating that they are potential paralogs with similar function. Transient transformation in Arabidopsis protoplasts showed that the potential transcription factors (TFs) CsSCL1/2/3 are all localized in the nucleus, with the fused florescence signal overlapped with the nucleus-localized marker OsGhd7-CFP (Fig. 1F).
Suppression of CsSCL2 expression enhanced SE in citrus callus
In our previous studies, csi-miR171c was upregulated in EC and during SE of citrus, whereas target gene CsSCLs were downregulated; and the antagonistic expression pattern of miR171c and CsSCLs suggest that miR171c-CsSCL modules might be involved in SE (Wu et al. 2011, 2015). In csi-miR171c–overexpressed citrus EC, CsSCL2/3 were downregulated and SE was enhanced, while SE was impaired when the function of csi-miR171c was suppressed in citrus EC (Shi et al. 2022). To determine whether CsSCLs were involved in the regulation of citrus SE, the RNA interference (RNAi) vectors of CsSCL1 and CsSCL2/3 were transformed into the wild-type (WT) callus of ‘Guoqing No. 1’ Satsuma mandarin (Citrus unshiu) (WT-G1) that is recalcitrant to SE. Six and 7 transgenic lines were generated, respectively, after screening the amplified fused fragment (503 bp) of nptII (Supplemental Fig. S2, A and B). In 3 independent RNA silencing calluses of CsSCL2 lines (Ri2-L3, L21, and L37), expression of CsSCL2 was significantly downregulated compared with WT-G1, while expression of CsSCL1 and CsSCL3 was unchanged (Fig. 2A). The Ri2 lines, empty vector–transformed line (EV-G1), and WT-G1 were transferred to glycerol medium to induce SE. The globular somatic embryos formed in Ri2 at 60 days after SE induction (DAI), while WT-G1 and EV-G1 remained calluses (Supplemental Fig. S2C). SE was greatly enhanced in Ri2 lines (∼500 to 800 embryos formed in 1 gram of callus) compared with WT-G1 (<10 embryos formed in 1 gram of callus) at 100 DAI (Fig. 2, B and C). However, in the 2 RNA silencing calluses of CsSCL1 lines (Ri1-L70 and L86) with downregulated expression of CsSCL1, SE capability was unchanged compared with WT-G1, with only ∼40 embryos formed in 1 gram of callus at 120 DAI (Supplemental Fig. S2, D to F). Taken together, suppression of CsSCL2 (csi-miR171c target gene) rather than CsSCL1 in citrus EC enhanced SE.
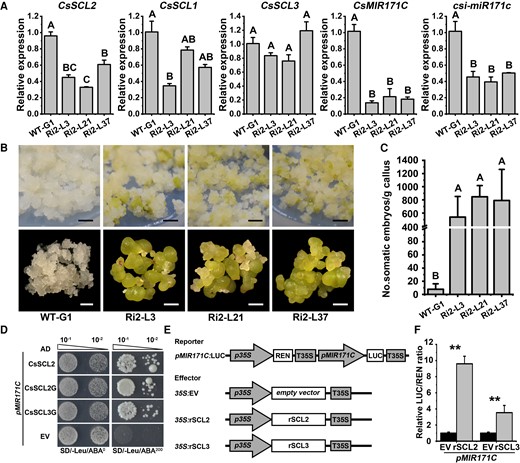
RNAi suppression of CsSCL2 enhanced SE capability in citrus callus. A) The relative expression levels of CsSCL2, CsSCL1, CsSCL3, CsMIR171C, and csi-miR171c in WT-G1 and the Ri2 lines (Ri2-L3, L21, and L37) without SE induction were detected by RT-qPCR. For RT-qPCR of mRNA (CsSCL2, CsSCL1, CsSCL3, and CsMIR171C), CsUBL5 was used as the internal reference gene and WT-G1 was used as the control (with the relative expression level set as 1.0). For RT-qPCR of miRNA (csi-miR171c), CsU6 was used as the internal reference gene and WT-G1 was used as the control (with the relative expression level set as 1.0). Error bars represent SEM from 3 BRs. Different capital letters indicate significant differences at P < 0.01 by a 1-way ANOVA using Tukey's HSD test. B) The somatic embryos formed in callus at 100 DAI. Pictures were taken by camera (upper panel, scale bars = 0.5 cm) and stereoscopic microscope (lower panel, scale bars = 1 mm). The calluses of different lines and views were digitally extracted and combined for comparison. C) Evaluation of SE capability in the callus lines at 100 DAI. SE capability was measured by counting the number of somatic embryos formed per gram of callus. Error bars represent standard deviation (SD) of 3 BRs. Different capital letters indicate significant differences at P < 0.01 by ANOVA using Tamhane's T2. D) The CsSCL2, CsSCL2G, and CsSCL3G proteins interact with the promoter of CsMIR171C in Y1H assay. pMIR171C, pABAi vector containing the promoter of CsMIR171C; AD-EV, empty vector used as the negative control; AD-CsSCL2, CsSCL2G, and CsSCL3G, prey vector containing CsSCL2, CsSCL2G, and CsSCL3G; SD/-Leu/AbA0, SD medium without Leu; SD/-Leu/AbA200, SD medium without Leu supplemented with AbA concentration of 200 ng mL−1. E) Schematic diagrams of vectors used for the DLR assay. pMIR171C: firefly luciferase (LUC), the reporter vector containing promoter fragments of CsMIR171C fused to LUC and p35S driven Renilla luciferase (REN) gene expression as an internal reference. 35S:EV, empty vector; 35S:rSCL2/rSCL3, overexpression vector containing rSCL2/rSCL3. F) The CsSCL2 and CsSCL3 proteins both activate the expression of CsMIR171C in LUC assay. 35S:EV + pMIR171C:LUC was used as control. Error bars represent standard deviation (Sd) of 6 BRs. The asterisks indicate significant differences of the 35S:CsSCL2 + pMIR171C:LUC or 35S:CsSCL3 + pMIR171C:LUC effector relative to the control according to independent 2-sample t-test (*P < 0.05; **P < 0.01). WT-G1: the WT callus of ‘Guoqing No. 1’ Satsuma mandarin (C. unshiu). Ri2: the RNA silencing callus of CsSCL2. DAI, days after SE induction.
Interestingly, the precursors of miR171c (CsMIR171C) and mature miR171c (csi-miR171c) were both downregulated in Ri2 lines compared with the WT-G1 (Fig. 2A). Yeast 1-hybrid (Y1H) assay showed that CsSCL2 and CsSCL2G/3G (the conserved C-terminal GRAS domains of CsSCL2/3) bound to the promoter of CsMIR171C, respectively (Fig. 2D). In dual-luciferase reporter (DLR) assay, the promoter sequence of CsMIR171C was fused to the firefly luciferase (LUC) gene as the reporter, and the CsSCL2 and CsSCL3 were cloned to the vector driven by the 35S promoter as the effectors (Fig. 2E). The relative LUC activity derived from the CsMIR171C promoter was strongly stimulated by CsSCL2 and CsSCL3, indicating that CsSCL2/3 interact with the CsMIR171C promoter and activate CsMIR171C expression in vivo (Fig. 2F). We demonstrate that CsSCL2/3 exert positive feedback regulation of CsMIR171C/csi-miR171c expression in citrus EC.
CsSCL2/3 interactive protein CsClot regulates SE
To explore the mechanism of CsSCL–mediated regulation in citrus SE, we screened CsSCL2-interactive proteins using yeast 2-hybrid (Y2H) assay. Since the full-length and N-terminal of CsSCL2/3 protein are self-activated, CsSCL2G was used as the bait to screen a cDNA library of citrus EC at SE stages (Supplemental Fig. S3). Y2H screening and yeast point to point assay determined that CsClot (a thioredoxin-like protein) interacted with CsSCL2G (Fig. 3A). Split firefly luciferase complementation imaging (LCI) and coimmunoprecipitation (Co-IP) assays further validated that CsSCL2G and the full-length CsSCL2 both interacted with CsClot (Fig. 3, B and C). Moreover, Y2H, LCI, and Co-IP assays validated that CsSCL3 also interacts with CsClot (Fig. 3). CsClot is homologous to the Clot (AT5G42850) gene in Arabidopsis, with the same noncanonical redox site (WCPDC) (Supplemental Fig. S4). CsClot belongs to the thioredoxin family that plays a redox role (Meyer et al. 2005). Transient cotransformation of the CsClot-GFP fusion vector with the nucleolar marker mCherry-AtFIB2 in N. benthamiana leaves showed that CsClot is localized in the cytoplasm (Supplemental Fig. S4).
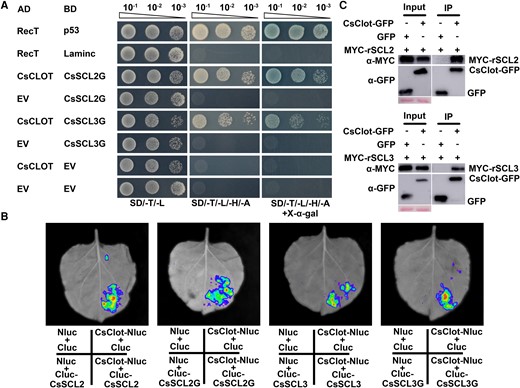
CsSCL2 and CsSCL3 interacted with CsClot. A) Interaction of CsSCL2G, CsSCL3G with CsClot verified by Y2H assays. BD-CsSCL2G and BD-CsSCL3G were respectively cotransformed with AD-CsClot in AH109 yeast strain to verify the interaction. Cotransformation of BD-p53 and AD-RecT was used as the positive control. Cotransformation of BD-Laminc and AD-RecT was used as the negative control. EV, empty vector; SD/-T/-L, SD medium without Trp and Leu; SD/-T/-L/-H/-A, SD medium without Trp, Leu, His, and Ade; SD/-T/-L/-H/-A/+X-α-gal, SD medium without Trp, Leu, His, Ade, and with X-α-gal. B) The interactions were detected between CsSCL2, CsSCL2G, CsSCL3, CsSCL3G, and CsClot by split firefly luciferase complementation imaging (LCI) assays. CsClot-Nluc and Cluc-CsSCLs (i.e. CsSCL2, CsSCL2G, CsSCL3, and CsSCL3G) were respectively coinjected into N. benthamiana leaves to observe the luciferase signal. Nluc + Cluc, CsSCLs-Nluc + Cluc, and Nluc + Cluc-CsClot were used as negative controls. C) Co-IP analyses show that CsSCL2 and CsSCL3 interact with CsClot. The bands in input assay indicated proteins expressed in N. benthamiana leaves. Co-IP was performed using anti-GFP Nanobody Magarose Beads, and Western blot were performed using anti-MYC (α-MYC) and anti-GFP (α-GFP). Cotransformation of the GFP empty vector (GFP) and MYC-rSCL2, MYC-rSCL3 were used as negative controls.
To characterize the function of CsClot in citrus callus, the overexpression vector PH7-CsClot was transformed into the wild-type (WT) callus of Valencia orange (C. sinensis) (WT-V) that have moderate SE competence. Three CsClot overexpression callus lines (OEC-L9, L16, and L27) were identified according to amplification of GFP and the fragment of the partial 35S promoter and CDS of CsClot (Supplemental Fig. S5, A and B). The OEC lines showed strong GFP signal (Supplemental Fig. S5C), and the expression level of CsClot was significantly upregulated (Fig. 4A). The SE capability of the OEC lines was significantly increased compared with the WT-V, according to the number of embryos formed in each line at 100 DAI (Fig. 4, B and C). Specifically, OEC-L27 formed up to 2,000 embryos in 1 gram of callus, while WT-V formed less than 500 (Fig. 4C). Moreover, the ROS level was decreased in the OEC lines compared with WT-V. 3,3′-Diaminobenzidine (DAB) staining showed that the levels of H2O2 was lower in the OEC lines compared with WT-V (Fig. 4D). The level of H2O2 in Ri2 lines was also reduced compared with WT-G1 (Fig. 4E). The activities of superoxide dismutase (SOD), peroxidase (POD), and catalase (CAT) were significantly reduced in OEC lines compared with WT-V (Fig. 4, F to H). These results suggest that overexpression of CsClot and suppression of CsSCL2 expression both enhanced SE and reduced the ROS level in citrus callus.

Overexpression of CsClot enhanced SE capability and disturbed ROS homeostasis in citrus callus. A) The relative expression level of CsClot in WT-V and the OEC lines (OEC-L9, L16, and L27) without SE induction as detected by RT-qPCR. CsUBL5 was used as the internal reference gene and WT-V as the control (with the relative expression level set as 1.0). Error bars represent SEM from 3 BRs. Different capital letters indicate significant differences at P < 0.01 by a 1-way ANOVA using Tukey's HSD test. B) The somatic embryos formed in callus at 100 DAI. The calluses of different lines were digitally extracted and combined for comparison. White arrows indicate somatic embryos. Scale bars = 1 mm. C) Evaluation of SE capability in the callus lines at 100 DAI. SE capability was measured by counting the number of somatic embryos formed per gram of callus. Error bars represent standard deviation (Sd) of 3 BRs. Different capital letters indicate significant differences at P < 0.01 by ANOVA using Tamhane's T2. The accumulation of H2O2 was detected by histochemical staining method in WT-V and the OEC-lines (OEC-L9, L16, and L27) D) or WT-G1 and the Ri2 lines (Ri2-L3, L21, and L37) E). Activities of SOD F), POD G), and CAT H) in the OEC lines and WT-V. Error bars represent SEM from 3 BRs. Different capital letters indicate significant differences at P < 0.01 by ANOVA using Tukey's HSD test. OEC, CsClot overexpression callus; WT-V, the WT callus of Valencia orange (C. sinensis); WT-G1, the WT callus of ‘Guoqing No. 1’ Satsuma mandarin (C. unshiu); Ri2, the RNA silencing callus of CsSCL2.
Identification of CsSCL2 directly regulated genes in citrus EC
To investigate the downstream regulatory pathway of CsSCL2/3 TFs in SE, 4×MYC-rSCL2 was overexpressed in WT-G1 callus (Fig. 5, A and B). In 3 independent 4×MYC-rSCL2 overexpression callus lines (OE2-L20, L27, and L31), the expression level of CsSCL2 was upregulated at least 60-fold compared with WT-G1 (Fig. 5C). The expression level of CsSCL1, CsMIR171C, and CsClot was significantly downregulated in OE2 lines compared with WT-G1, while CsSCL3 was upregulated in 2 OE2 lines (Fig. 5C). The OE2-L31 line was used for chromatin immunoprecipitation sequencing (ChIP-Seq) and RNA-Seq analyses, to explore direct downstream target genes of CsSCL2, with WT-G1 as a control. After removal of the adaptor contaminations and low-quality tags, 75.94% to 81.54% of the ChIP-Seq clean reads in each sample were mapped to Citrus clementina v1.0 genome (Supplemental Table S1). The correlation coefficients between 2 biological replicates (BRs) were in the range of 0.95 to 0.96 (Supplemental Table S2). The CsSCL2-binding peaks were highly enriched within 3 kb upstream of TSS (Supplemental Fig. S6A). In total, we identified 15,280 (OE2-L31- BR1) and 7,523 (OE2-L31-BR2) SCL2-binding peaks in the citrus genome, corresponding to 8,045 and 4,804 genes, respectively (Supplemental Fig. S6B). There were 6,670 overlapping peaks between the 2 BRs, corresponding to 4,432 genes (Supplemental Fig. S6, B and D). In contrast, only 36 and 89 nonspecific binding peaks were identified in the 2 BRs of WT-G1, corresponding to 32 and 64 genes, respectively; and there were only 10 overlapping peaks corresponding to 7 genes between the 2 BRs (Supplemental Fig. S6, B to D). After removal of 5 nonspecific binding genes, we identified 4,427 SCL2-binding specific genes (Supplemental Fig. S6D).
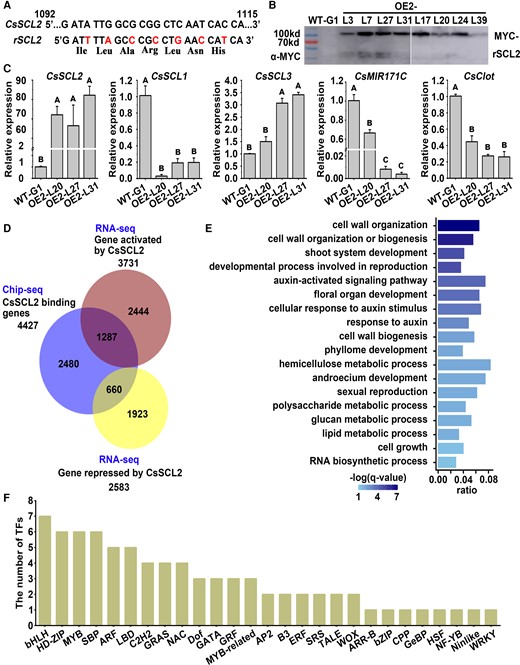
ChIP-Seq and RNA-Seq analysis of 4×MYC-rSCL2 overexpression callus (OE2) line. A) Schematic representation of the csi-miR171c–resistant CsSCL2 (rSCL2) vector constructed by synonymous mutation. The top strand depicts the original csi-miR171c target site of CsSCL2 from 1,092 to 1,115 nt from the start codon, and the bottom strand shows the sequence postmutation; bases in red indicate the replaced nucleotides. B) 4×MYC-rSCL2 fusion protein was detected in OE2 lines by Western blot, with WT-G1 as the control. C) The relative expression levels of CsSCLs, CsMIR171C, and CsClot in WT-G1 and the OE2 lines (OE2-L20, L27, and L31) without SE induction were detected by RT-qPCR. CsUBL5 was used as the internal reference gene and WT-G1 as the control (with the relative expression level set as 1.0). Error bars represent SEM from 3 BRs. Different capital letters indicate significant differences at P < 0.01 by ANOVA using Tukey's HSD test. D) Venn diagram of CsSCL2-binding genes (4,427 genes) identified from ChIP-Seq, CsSCL2-activated genes (3,731 genes), and CsSCL2-repressed genes (2,583 genes) identified from RNA-Seq, with the overlaps of 1,287 CsSCL2 directly activated and 660 CsSCL2 directly repressed genes. E) GO enrichment of the 660 CsSCL2 directly repressed genes, with a q-value < 0.05 as significant enrichment. The x-axis indicates percentage of identified genes in background (score as gene ratio), and color indicates significance level (score as −log (q-value)) using Benjamini and Hochberg (BH) correction. F) The columns show the number of CsSCL2 directly repressed genes in each the TF family. WT-G1: the WT callus of ‘Guoqing No. 1’ Satsuma mandarin (C. unshiu). OE2: 4×MYC-rSCL2 overexpression callus.
After removal of the adaptor contaminations and low-quality tags, 93.90% to 95.55% of the RNA-Seq clean reads in each sample were mapped to the C. clementina v1.0 genome (Supplemental Table S3). The correlation coefficients between 3 BRs of RNA-Seq data were in the range of 0.97 to 0.99 (Supplemental Table S4). A total of 6,314 differentially expressed genes (DEGs) were identified in the OE2 line relative to WT-G1, including 3,731 upregulated and 2,583 downregulated genes (Supplemental Table S5). Among them, 1,287 upregulated genes and 660 downregulated genes have SCL2-binding peaks in ChIP-Seq, indicating that they are SCL2 directly activated and inhibited genes, respectively (Fig. 5D and Supplemental Table S6). A total of 215 biological processes were enriched among the 1,287 SCL2-activated genes, mainly including responses to different hormones like ethylene, gibberellin, cytokinin, jasmonic acid, and auxin, as well as the aromatic compound biosynthetic process and RNA biosynthetic process (Supplemental Table S7). In contrast, 88 biological processes were enriched among the 660 SCL2-inhibited genes, and among them, 42 (47.7%) were development-related processes, such as reproduction, floral organ, and shoot development (Fig. 5E and Supplemental Table S8). The auxin-activated signaling pathway and response to auxin stimulus were significantly enriched among the SCL2-inhibited genes (Fig. 5E and Supplemental Table S8), including 5 AUXIN RESPONSE FACTOR (ARFs), 3 AUXIN RESISTANT/INDOLE-3-ACETIC ACID INDUCIBLEs (Aux/IAA), and 2 PIN-FORMEDs (PINs) (Supplemental Fig. S7A). The polysaccharide metabolic process and cell wall organization were also significantly enriched among the SCL2-inhibited genes (Fig. 5E and Supplemental Table S8), including 8 xyloglucan endotransglucosylases (XTHs), 5 genes involved in pectin synthesis and decomposition (GATL2, GATL9, PME17, PME44 and PLY1), 1 cellulose synthase (CESA6), and 2 callose synthase genes (GSL05 and GSL12) (Supplemental Fig. S7, B and C).
Among the CsSCL2 directly inhibited development-related genes, some are known to induce SE in plants, including LEAFY COTYLEDON 1 (LEC1), YUCCA4 (YUC4), SOMATIC EMBRYOGENESIS RECEPTOR-LIKE KINASE1 (SERK1), and WOX2, as well as WOX13 that regulates callus formation (Supplemental Table S8). Among the CsSCL2-inhibited genes, 79 encoded TFs of 27 different families, including WOX (CsWOX2 and CsWOX13) and LBD (CsLBD15, CsLBD36, CsLBD37, CsLBD39, and CsLBD40) TF families (Fig. 5F and Supplemental Table S6). CsSCL2 bound to the promoter regions of CsSERK1, CsWOX2, CsWOX13, CsLBD15, and CsLBD40 but bound to the distal intergenic region of CsLEC1 and the downstream region (≤3 kb) of CsYUC4, CsLBD36, CsLBD37, and CsLBD39 (Supplemental Table S9). Moreover, CsWOX4, CsWOX5, and CsWOX11, the 3 WOX genes that were not expressed in WT-G1 callus, were directly bound by CsSCL2 in the promoter region and their expression was activated in the CsSCL2-overexpressed EC line (Supplemental Fig. S8 and Supplemental Table S5).
CsSCL2/3 directly inhibited CsWOX2, CsWOX13, and CsLBD40 in citrus EC
We selected 3 CsSCL2-bound and inhibited genes with ChIP-Seq peak −log10 (P-value) > 20, including CsWOX2 (−log10 (P-value) = 27.97), CsWOX13 (−log10 (P-value) = 21.05), and CsLBD40 (−log10 (P-value) = 32.40) (Supplemental Table S9). Their homologous genes WOX2, WOX13, and LBD40 regulate SE and callus formation in Arabidopsis (Zhang et al. 2017b; Xu et al. 2018; Ikeuchi et al. 2022). CsWOX2, CsWOX13, and CsLBD40 were all localized in the nucleus (Supplemental Fig. S9). ChIP-Seq and ChIP-qPCR validated that CsSCL2 binds to the promoter of CsWOX2, CsWOX13, and CsLBD40 (Fig. 6, A and B). Reverse transcription quantitative PCR (RT-qPCR) confirmed that their expression level was significantly downregulated in the rSCL2 overexpression callus lines (OE2-L20, L27, and L31) compared with WT-G1 (Fig. 6C). In DLR assay, the sequences of rSCL2 and rSCL3 driven by 35S promoter were used as the effectors, and the promoter sequences of CsWOX2, CsWOX13, and CsLBD40 were fused to the LUC gene as the reporters, respectively (Fig. 6D). The relative LUC activity derived from CsWOX2, CsWOX13, and CsLBD40 promoters was strongly suppressed by rSCL2 and rSCL3 in N. benthamiana leaves (Fig. 6, E and F).
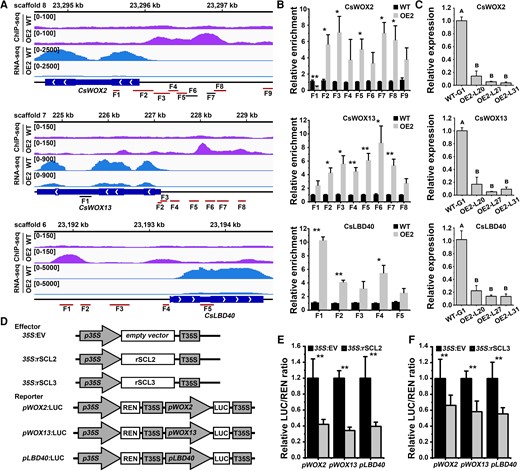
Three regeneration-related genes directly bound and inhibited by CsSCL2. A) The ChIP-Seq peaks and RNA-Seq signals of CsWOX2, CsWOX13, and CsLBD40 in WT and the OE2 line shown by Integrated Genome Browser (IGV). Schematic of genes shows the regions for ChIP-qPCR (CsWOX2, F1 to F9; CsWOX13, F1 to F8; and CsLBD40, F1 to F5). The regions marked red contain GT cis-elements, while the regions marked black have no GT cis-element. B) ChIP-qPCR analysis of CsWOX2, CsWOX13, and CsLBD40 in WT and the OE2 line. WT was used as the control (with the relative enrichment set as 1.0). Error bars represent SEM from 3 BRs. Statistically significant differences relative to WT was determined using independent 2-sample t-test (*P < 0.05, **P < 0.01). C) The relative expression levels of CsWOX2, CsWOX13, and CsLBD40 in WT and OE2 lines (OE2-L20, L27, and L31) without SE induction were detected by RT-qPCR. CsUBL5 was used as the internal reference gene, and WT-G1 was used as the control (with the relative expression level set as 1.0). Error bars represent SEM from 3 BRs. Different capital letters indicate significant differences at P < 0.01 by ANOVA using Tukey's HSD test. D) Schematic diagrams of vectors used for the dual-luciferase assay. pWOX2: firefly luciferase (LUC), pWOX13:LUC and pLBD40:LUC indicate the reporter vector containing promoter fragments of WOX2/WOX13/LBD40 fused to LUC, respectively, with p35S drives REN gene expression as an internal reference. 35S:EV, empty vector; 35S:rSCL2/rSCL3, overexpression vector containing rSCL2/rSCL3. E) The CsSCL2 and F) CsSCL3 proteins both repress the expression of WOX2/WOX13/LBD40 according to a dual-luciferase assay. 35S:EV + pWOX2:LUC/pWOX13:LUC/pLBD40:LUC was used as the control. Error bars represent standard deviation (Sd) of 4 BRs. The asterisks indicate significant differences relative to the control according to independent 2 sample t-test (*P < 0.05; **P < 0.01). WT: the wild-type callus of ‘Guoqing No. 1’ Satsuma mandarin (C. unshiu). OE2: 4×MYC-rSCL2 overexpression callus.
Discussion
csi-miR171c–targeted CsSCL2/3 regulate SE in citrus callus
The HAM family is widely present in land plants and can be grouped into 2 types, among them type II HAM members maintain the ancestral miR170/171 binding site (Geng et al. 2021). In Arabidopsis, 4 HAM members were identified, and HAM1/2/3 belong to type II (Engstrom et al. 2011). Three SCL (HAM) genes with csi-miR171c binding sites were identified in citrus (Wu et al. 2015). The phylogenetic analysis demonstrated that 3 CsSCL1/2/3 proteins were homologous with Arabidopsis AtSCL6 (HAM3), and CsSCL2 and CsSCL3 are closely clustered homologs (Supplemental Fig. S1). In Arabidopsis, HAM1 and HAM2 are redundant in function for shoot meristem maintenance (Schulze et al. 2010; Zhou et al. 2018; Han et al. 2020a). We previously overexpressed csi-miR171c in citrus EC which resulted in downregulation of CsSCLs and enhanced SE, whereas suppression of csi-miR171c function impaired SE (Shi et al. 2022). In this study, we validated that csi-miR171c targets and cleaves CsSCL2 and CsSCL3 rather than CsSCL1 in citrus EC (Fig. 1E), and suppression of CsSCL2 rather than CsSCL1 enhanced SE (Fig. 2 and Supplemental Fig. S2). Our results demonstrated that miR171c-targeted CsSCL2/3 regulate SE in citrus. The homologous genes of Arabidopsis type II HAM3 negatively regulate SE in citrus EC.
CsSCL2/3 interactive protein CsClot positively regulates SE through ROS homeostasis
In citrus callus, CsSCL2 and CsSCL3 interacted with CsClot protein (Fig. 3), and CsSCL2 bound to the CsClot promoter and inhibited CsClot expression in CsSCL2 overexpressed EC (Fig. 5C and Supplemental Fig. S8). Although function of Clot has been rarely reported in Arabidopsis, the thioredoxin family were reported to regulate meristem development and regeneration (Benitez-Alfonso et al. 2009; Zhang et al. 2018). Loss of function mutant of thioredoxin dcc1 increased ROS and inhibited shoot regeneration in Arabidopsis (Zhang et al. 2018). Proteomic analysis showed that a thioredoxin accumulated rapidly in the globular embryo and torpedo embryo in cotton (Zhou et al. 2016). In our study, overexpression of CsClot enhanced citrus SE (Fig. 4). We suggest that thioredoxin is a positive regulator of plant regeneration, including shoot regeneration and SE.
Thioredoxin mediates various biological processes in plants through alteration of ROS homeostasis in cells (Meyer et al. 2005; Buchanan 2016). A homolog of CsClot, Thioredoxin-related protein of 14 kDa (TRP14), reduces H2O2 levels in humans (Pader et al. 2014). Overexpression of CsClot leads to reduced H2O2 content, decreased enzyme activities of SOD, POD, and CAT, and enhanced SE in citrus callus (Fig. 4, F to H). ROS homeostasis determines cell fate, including callus formation, SE, and shoot and root regeneration. In cotton, tissue-accumulated ROS arrested callus growth but increased adventitious rooting (Deng et al. 2022). The SE capability of C. lanceolata was significantly improved by exogenous PSK addition that reduced H2O2 production and established an appropriate redox microenvironment (Hao et al. 2022). Shoot regeneration in Arabidopsis was inhibited by exogenous treatment with H2O2, while treatment with the reducing agent GSH effectively alleviated the decline of regeneration capability in dcc1 loss-of-function mutant (Zhang et al. 2018). We suggest that CsSCL2/3 interactive thioredoxin CsClot regulates SE possibly through ROS homeostasis in citrus callus.
CsSCL2/3 regulate SE possibly through inhibition of plant regeneration–related genes
CsSCL2 binds and represses expression of auxin pathway–related genes, including IAAs, ARFs, and PINs (Supplemental Fig. S7A) that are functional in SE induction (Wojcik et al. 2020). CsSCL2 directly repressed expression of well-known SE–related genes, such as LEC1 (Lotan et al. 1998), YUC4 (Bai et al. 2013), SERK1 (Hecht et al. 2001), and WOX2 (Wang et al. 2020a) (Supplemental Table S6). CsSCL2 also directly repressed genes involved in cell wall organization, including 8 XTHs (Supplemental Fig. S7), reminiscent of the fact that the structure and molecular composition of the cell wall are modified and XTHs are upregulated during SE induction (Smertenko and Bozhkov 2014). Since CsSCL2 directly bound and repressed expression of a series of regeneration-related genes in callus, we suggest that suppression of CsSCL2/3 TFs might release the expression of regeneration-related genes and thus enhance citrus SE.
CsSCL2 bound to the promoter of CsWOX2 and inhibited its expression in citrus callus (Fig. 6). In Arabidopsis, WOX2 plays an important role in somatic embryo formation (Wang et al. 2020a), and it is specifically expressed during the early stage of SE and used as a marker gene for SE (Godel-Jedrychowska et al. 2020). CsWOX13, another WOX family TF directly repressed by CsSCL2 in citrus callus (Fig. 6), is required for callus formation in Arabidopsis (Ikeuchi et al. 2022). Since CsSCL2 and CsSCL3 both bind to CsWOX2 and CsWOX13 promoters and inhibit their expression (Fig. 6) and they both interact with CsClot protein (Fig. 3), we suggest that CsSCL2 and CsSCL3 might be functionally redundant in regulation of citrus SE.
We suggest a working model for CsSCL2/3–mediated regulation of SE in citrus callus (Fig. 7). Csi-miR171c suppresses the expression of 2 target CsSCL genes (CsSCL2 and CsSCL3), while CsSCL2/3 exert positive feedback regulation on MIR171C expression. Suppression of CsSCL2 and overexpression of the interactive protein CsClot reduced the ROS level and enhanced SE in citrus callus. CsSCL2/3 directly inhibit the expression of regeneration-related genes such as CsWOX2 and suppress development, auxin and cell wall organization–related biological processes, and thus regulate SE.
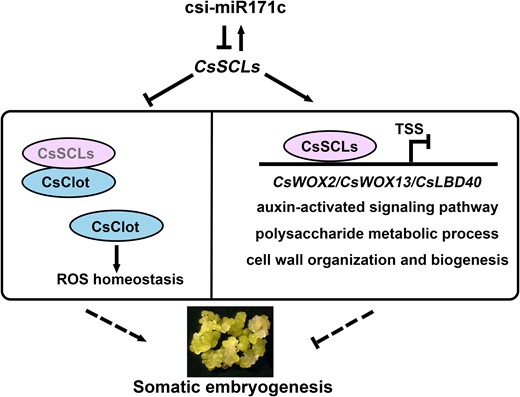
The working model for csi-miR171c-CsSCLs mediated regulation of SE in citrus callus. csi-miR171c suppresses the expression of 2 target CsSCL genes (CsSCL2 and CsSCL3), CsSCLs exert feedback regulation on csi-miR171c expression. CsClot was identified as interacting protein of CsSCL2/3, and overexpression of CsClot disturbed ROS homeostasis and enhanced SE capability in citrus callus. Moreover, CsSCL2/3 proteins directly bind and inhibit the expression of downstream regeneration-related genes including CsWOX2, CsWOX13, and CsLBD40 and inhibit biological processes such as auxin response and cell wall organization, thereby reducing SE capability in citrus callus.
Materials and methods
Plant materials
The EC used for genetic transformation was induced from the aborted ovules of “Guoqing No. 1” Satsuma mandarin (C. unshiu, G1) and Valencia orange (C. sinensis, V). The SE capability of EC has declined to a weak level in G1 and moderate level in V after preservation for years on Murashige and Tucker (MT) solid medium (Murashige and Tucker 1969), under a 16 h/8 h photoperiod at 25 °C and subcultured every 20 d.
The transient assay of miRNA–target interaction
The interactions between csi-miR171c and the potential target genes were validated by transient assays in N. benthamiana leaves according to the previous method (Long et al. 2016). A 503 bp DNA fragment of the csi-miR171c precursor was amplified from V genomic DNA (Shi et al. 2022) and cloned into the pK2GW7 vector using Gateway technology (Invitrogen, USA). The nucleotide sequence of MRE on the potential target genes, CsSCL1, CsSCL2, and CsSCL3, is identical (Supplemental Fig. S1A). The native and mutant MRE on CsSCLs (CsSCL-nMRE/mMRE) were synthesized and then cloned into the pMS4 vector with XhoI and XbaI restriction sites. csi-miR171c and MRE were coinfiltrated into leaves to observe the GFP signal through a hand-held fluorescent lamp (Beijing Liuyi, China) under 365 nm UV light after 3 d. The fluorescence readouts were quantified as mean greyscale values using ImageJ. Four leaves were used for statistical analysis. The primers used for vector construction were listed in Supplemental Table S10.
RNA extraction and 5′ RACE analysis
Total RNA from callus of V was extracted using RNAiso Plus (Takara, Japan) and used as the template. To validate the cleavage sites of CsSCLs, RLM-5′ RACE was conducted using the FirstChoice RLM-RACE Kit (Invitrogen, USA). The 5′ RACE adapter was directly ligated to the purified total RNA and then reverse transcribed, followed by nested PCR with gene-specific outer/inner primers (Supplemental Table S10).
Subcellular localization assay
The CDS (without a stop codon) of CsSCL1, CsSCL2, and CsSCL3 were amplified from cDNA of V, respectively, and inserted into the p2GWY7 vector using Gateway Cloning System (Invitrogen, USA) to produce the 35S:CsSCLs-yellow fluorescent protein (YFP) fusion constructs. The CDS of the interacting protein CsClot (without stop codon) was cloned into the pMDC83 vector using Gateway Cloning System (Invitrogen, USA) to generate a 35S:CsClot-GFP fusion construct. The CDS of CsWOX2 and CsWOX13 were cloned into the pMDC43 vector using Gateway Cloning System, respectively, to generate 35S:GFP-CsWOX2 and 35S:GFP-CsWOX13 fusion constructs. The fusion vector CsSCLs-YFP were transiently cotransformed with the nuclear marker OsGhd7-CFP (Xue et al. 2008) into Arabidopsis protoplasts (Wu et al. 2009). The fusion vector CsClot-GFP, GFP-CsWOX2, GFP-CsWOX13, and GFP-CsLBD40 were transiently coinfiltrated with the nucleolar marker mCherry-AtFIB2 (Chang et al. 2016) into N. benthamiana leaves. The florescence signals were captured using a laser scanning confocal microscope (Leica TCS SP8, Germany). The photographs were captured with filters for YFP (excitation 514 nm/emission 550 to 590 nm), CFP (excitation 448 nm/emission 460 to 505 nm), GFP (excitation 488 nm/emission 505 to 550 nm), and mCherry (excitation 552 nm/emission 590 to 640 nm). The photographs of the bright field were captured and merged with those of fluorescence. The primers used for vector construction were listed in Supplemental Table S10.
Phylogenetic analysis
CsSCL1, CsSCL2, and CsSCL3 were amplified from cDNA of V and translated into protein sequences. In Arabidopsis, the protein sequence of 3 miR171-targeted SCLs was obtained from TAIR (https://www.arabidopsis.org/). The conserved GRAS domains were identified in the 6 SCLs by Pfam (http://pfam.xfam.org/) and used to construct phylogenetic trees using MEGA7 with the neighbor-joining statistical method and bootstrap analysis (1,000 replicates).
Plasmid construction and callus transformation
Considering the high sequence similarity of CsSCL2 and CsSCL3, a CDS fragment of 470 bp (+239 to +708) in CsSCL3 was selected as the RNAi target against both CsSCL2 and CsSCL3 (Supplemental Fig. S1B). A CDS fragment of 575 bp (+1 to +575) in CsSCL1 was used as the RNAi target against solely CsSCL1. These fragments were amplified from cDNA of G1 and cloned into the pHGRV vector using the Gateway Cloning System (Invitrogen, USA), respectively. The recombinant vectors were transformed into the WT-G1 according to the previous method (Duan et al. 2007).
The CDS of CsClot was amplified from cDNA of V and then ligated into the pH7WG2D vector using the Gateway Cloning System (Invitrogen, USA) to obtain PH7-CsClot. The CDS of CsSCL2 and CsSCL3 were cloned from cDNA of V and inserted into the pTOPO-Blunt Simple vector (Aidlab, China). The csi-miR171c–resistant CsSCL2 (rSCL2) and CsSCL3 (rSCL3) were generated by introduction of 7 mutations into the predicted csi-miR171c binding site using recombinant PCR and then cloned into a Goldengate-recombined vector by the BsaI restriction site to generate the 35S:4×MYC-rSCL2 and 35S:4×MYC-rSCL3 fusion construct (Engler et al. 2014). The recombinant vectors PH7-CsClot and 35S:4×MYC-rSCL2 were respectively transformed into the WT-G1 according to the previous method (Duan et al. 2007). The primers used for vector construction were all listed in Supplemental Table S10.
RT-qPCR
mRNA was reverse transcribed using the HiScriptIIQ RT SuperMix for qPCR kit (Vazyme, China), with CsUBL5 as the endogenous reference gene (Liu et al. 2013). miRNA was reverse transcribed using the SuperScript III Reverse Transcriptase (Invitrogen, USA), with CsU6 as the endogenous reference gene (Kou et al. 2012). RT-qPCR was performed as previously described using a Roche LightCycler-480 (Wang et al. 2020b). The primers used for RT-qPCR were all listed in Supplemental Table S10.
Somatic embryo induction and SE capability evaluation
The Ri1, Ri2, OEC, WT-G1, and WT-V callus lines were induced to generate somatic embryos on glycerol medium (MT medium with 2 v/v glycerol as the carbohydrate source). SE capacity was evaluated as the number of somatic embryos formed in every 1 gram of callus (Long et al. 2018), with at least 3 bottles of callus as BRs.
Y1H and DLR assays
The Y1H assay was performed using the Matchmaker Gold Yeast 1-Hybrid System Kit (Clontech, Japan). The full-length CsSCLs (CsSCL2, 1 to 706 aa, and CsSCL3, 1 to 702 aa) and truncated CsSCLs (CsSCL2G, 348 to 705 aa, and CsSCL3G, 343 to 701 aa) were inserted into the pGADT7 vector by EcoRI and XhoI restriction sites. According to the full length of the CsMIR171C transcript (550 bp) in citrus (Shi et al. 2022), the putative promoter region (674 bp) was amplified from the genomic DNA of V and then cloned into the vector to generate pAbAi-MIR171C bait plasmid by the BstBI restriction site.
A DLR assay was conducted according to the previous method (Hellens et al. 2005). The promoter fragments of CsMIR171C, CsWOX2, CsWOX13, and CsLBD40 were inserted into pGreenII 0800-LUC by HindIII and NcoI restriction sites. The sequence rSCL2 and rSCL3 were cloned into the effector vector pH7WG2D using the Gateway Cloning System (Invitrogen, USA). The constructs were coinfiltrated into N. benthamiana leaves. Luciferase activity was detected using the Dual-Luciferase Reporter Assay System (Promega, USA) with an Infinite200 Pro microplate reader (Tecan, Switzerland). The primers used for vector construction were all listed in Supplemental Table S10.
Y2H, LCI, and Co-IP assays
A Y2H assay was conducted according to Yeastmaker Yeast Transformation System 2 User Manual (Clontech, Japan). The full-length CsSCLs and the truncated CsSCLs (CsSCL2N, 1 to 347 aa; CsSCL2G, 348 to 705 aa; CsSCL3N, 1 to 342 aa; and CsSCL3G, 343 to 701 aa) were inserted into the pGBKT7 vector by EcoRI and NotI restriction sites. The recombinant constructs and the empty vector of pGADT7 were cotransformed into the yeast strain AH109 (Clontech, Japan) to detect self-activation. The BD-CsSCL2G vector (without the self-activation region) was used as bait to screen the cDNA library. The full-length CDS of CsClot was amplified and inserted into the pGADT7 and then cotransformed with BD-SCL2G or BD-SCL3G into yeast strain AH109 for yeast point to point assay.
An LCI assay was conducted as previously described (Chen et al. 2008). The fragments of CsSCL2, CsSCL2G, CsSCL3, and CsSCL3G were inserted into pCAMBIA-CLuc to generate CLuc-CsSCLs by KpnI and SalI restriction sites, and the full-length CDS of CsClot (without a stop codon) was cloned into pCAMBIA-NLuc to generate CsClot-NLuc by KpnI and SalI restriction sites. The CLuc-CsSCLs and CsClot-NLuc were coinfiltrated into N. benthamiana leaves. The photographs were taken using a living plant imaging machine (Berthold LB 985, Germany) 3 d later. The primers used for vector construction were all listed in Supplemental Table S10.
The Co-IP assay was conducted according to a previous method (Turnbull et al. 2019). The 35S:4×MYC-rSCLs (35S:4×MYC-rSCL2/rSCL3) recombination vectors and 35S:CsClot-GFP were coinfiltrated into N. benthamiana leaves. The leaves were collected 48 h later, and protein was extracted and then incubated with Anti-GFP Nanobody Magarose Beads (Shenzhen KangTi Life Technology, China) for 2 h at 4 °C. Beads were washed and resuspended in 2× SDS gel-loading buffer. Western blot was performed according to a previous method (Huang et al. 2018).
Detection of ROS and enzyme activity assay
Hydrogen peroxide (H2O2) in callus was histochemically stained using DAB according to a previous method (Jia et al. 2021). The SOD, POD, and CAT activities were measured as previously described (Gao et al. 2008).
RNA extraction and RNA-Seq
Total RNA was extracted from WT-G1 and OE2 lines using the Hipure HP plant RNA mini kit (Magen, China), followed by quality evaluation on Bioanalyzer 2100 (Agilent, Germany). RNA-Seq libraries were constructed using the NEBNext Ultra RNA Library Prep Kit for Illumina (E7530; NEB) and NEBNext Multiplex Oligos for Illumina (E7500; NEB) and sequenced on an Illumina NovaSeq 6000 platform (Novogene, China).
RNA-Seq data were filtered according to previously described workflow (Feng et al. 2022). Clean and high-quality reads were mapped to the C. clementina v1.0 genome (http://citrus.hzau.edu.cn/index.php) and assembled into transcripts using HISAT2 and StringTie (http://ccb.jhu.edu/software.shtml). The DEGs were identified using edgeR (Robinson et al. 2010), with a log2-fold change ≥ 1.0 and a false discovery rate (FDR) < 0.05. Gene function was annotated using Blast2Go. TFs were annotated using planttfdb (http://planttfdb.gao-lab.org/). Gene Ontology (GO) enrichment was conducted using TBtools (Chen et al. 2020), with a q-value < 0.05. The raw data were submitted to NCBI Database under BioProject accession PRJNA901381.
ChIP-Seq and ChIP-qPCR
The fresh calluses of the OE2 line and WT-G1 were collected for ChIP, and the method was based on previous description (Cheng et al. 2018). Chromatin was extracted from 1 v/v formaldehyde crosslinked callus and fragmented to 100 to 500 bp by sonication. ChIP reaction was performed using Pierce Anti-c-Myc Magnetic Beads (Thermo Scientific, USA). ChIP-DNA and input-DNA samples were used to construct libraries and sequenced using the SE50 strategy on the MGISEQ-2000RS platform (BGI, China), with 2 BRs.
ChIP-Seq data were analyzed according to the previous method (Xia et al. 2020). The ChIP-Seq reads were aligned to the C. clementina v1.0 genome using Bowtie2 (Langmead and Salzberg 2012). The peaks were called using MACS2 software with default parameters (q-value < 0.05) (Zhang et al. 2008). The peaks of 2 replicates were merged using the irreproducibility discovery rate (IDR), with IDR < 0.05. The adjacent genes were retrieved by ChIPseeker (Yu et al. 2015). The ChIP-Seq results were visualized using the Integrated Genome Browser (IGV) (Nicol et al. 2009). The raw data were submitted to NCBI Database under BioProject ID PRJNA901543. The ChIP-DNA and input-DNA samples were used for ChIP-qPCR on a Roche LightCycler-480, with 3 independent BRs. The primers used for ChIP-qPCR were all listed in Supplemental Table S10.
Statistical analysis
Statistical analysis was performed using SPSS 21 software (IBM) to calculate the mean, standard error of mean (SEM), and standard deviation (sd). The comparisons of significant differences among multiple independent samples were performed by a 1-way analysis of variance (ANOVA) using Tukey's HSD test or Tamhane's T2. Different capital letters indicate significant differences at P < 0.01. A comparison of 2 samples was performed using an independent 2-sample t-test. Asterisks indicate statistically significant differences (*P < 0.05, **P < 0.01).
Accession numbers
The RNA-Seq and ChIP-Seq data were deposited in the NCBI Database under the BioProject accession PRJNA901381 and PRJNA901543, respectively. The sequences used in this study can be obtained from the database Orange Genome annotation project (http://citrus.hzau.edu.cn/index.php) with the following accession numbers: CsSCL1 (Ciclev10018916m/Cs5g_pb007350), CsSCL2 (Ciclev10019083m/CsUn_pb052510), CsSCL3 (Ciclev10019094m/CsUn_pb052500), CsClot (Cs7g_pb001600), CsLEC1 (Ciclev10010391m), CsYUC4 (Ciclev10008466m), CsSERK1 (Ciclev10000597m), CsWOX2 (Ciclev10029815m), CsWOX4 (Ciclev10002438m), CsWOX5 (Ciclev10033868m), CsWOX11 (Ciclev10021682m), CsWOX13 (Ciclev10026199m), CsLBD15 (Ciclev10002348m), CsLBD36 (Ciclev10027275m), CsLBD37 (Ciclev10029274m), CsLBD39 (Ciclev10003746m), and CsLBD40 (Ciclev10013705m).
Acknowledgments
We thank our colleagues Prof. Feng Li at Huazhong Agricultural University for providing pMS4 vectors for transient assays of the miRNA–target and Prof. Junhong Zhang and Prof. Pengwei Wang for providing vectors for protein subcellular localization.
Author contributions
X.-M.W. conceived the project and revised the manuscript. M.-Q.F. designed and performed most of the experiments and wrote the manuscript; N.J. and Z.-P.Y. performed ChIP-Seq and RNA-Seq data analysis; P.-B.W. and Y.L. assisted with callus transformation, phenotype evaluation, and callus subculture; Q.-M.X. and G.-A.X. contributed to the ChIP-DNA extraction; H.-H.J. assisted with ROS assay; Q.-F.S. and J.-M.L. assisted with RT-qPCR of miRNA. K.-D.X. and W.-W.G. contributed to manuscript revision.
Supplemental data
The following materials are available in the online version of this article.
Supplemental Figure S1. Sequence analysis of csi-miR171c and potential target genes CsSCLs.
Supplemental Figure S2. Identification of positive transgenic lines and observation of somatic embryogenesis (SE).
Supplemental Figure S3. Self-activation test of truncated CsSCL2 and CsSCL3.
Supplemental Figure S4. Sequences analysis and subcellular localization of CsClot.
Supplemental Figure S5. Identification of positive CsClot overexpression callus (OEC) lines.
Supplemental Figure S6. The distributions and numbers of binding peaks of CsSCL2.
Supplemental Figure S7. Heatmap of genes that are directly downregulated in the OE2 line compared with WT-G1 and the associated GO terms.
Supplemental Figure S8. The ChIP-Seq peaks and RNA-Seq signals of candidate genes.
Supplemental Figure S9. Subcellular localization analysis of CsWOX2, CsWOX13, and CsLBD40.
Supplemental Table S1. ChIP-Seq data summary.
Supplemental Table S2. Correlation of coefficients between biological replicates of ChIP-Seq data.
Supplemental Table S3. RNA-Seq data summary.
Supplemental Table S4. Correlation of coefficients between biological replicates of RNA-Seq data.
Supplemental Table S5. DEGs identified in the OE2 line relative to the WT-G1.
Supplemental Table S6. Function annotation of the CsSCL2 directly bound and up-/downregulated genes.
Supplemental Table S7. GO enrichment of the 1,287 CsSCL2 directly activated genes.
Supplemental Table S8. GO enrichment of the 660 CsSCL2 directly inhibited genes.
Supplemental Table S9. Annotation of the CsSCL2 directly bound and downregulated genes.
Supplemental Table S10. List of primer sequences.
Funding
This research was financially supported by the Ministry of Science and Technology of China (no. 2022YFF1003101), the National Natural Science Foundation of China (no. 32072528), the Natural Science Foundation of Hubei Province (no. 2022CFB157), and the Foundation of Hubei Hongshan Laboratory (no. 2021hszd009).
Data availability
The authors confirm that all experimental and raw data are available and accessible via the main text, the supplemental data and NCBI Database under the BioProject accession PRJNA901381 and PRJNA901543.
References
Author notes
The author responsible for distribution of materials integral to the findings presented in this article in accordance with the policy described in the Instructions for Authors (https://dbpia.nl.go.kr/plphys/pages/General-Instructions) is Xiao-Meng Wu ([email protected]).
Conflict of interest statement. The authors have no conflict of interest.
