


Abstract
Stem cells are the ultimate source of cells for various tissues and organs and thus are essential for postembryonic plant growth and development. SCARECROW (SCR) is a plant-specific transcription regulator well known for its role in stem cell renewal in plant roots, but the mechanism by which SCR exerts this function remains unclear. To address this question, we carried out a genetic screen for mutants that no longer express SCR in the stem cell niche of Arabidopsis (Arabidopsis thaliana) roots and characterized 1 of these mutants. Molecular genetics methods allowed us to pinpoint the causal mutation in this mutant in TELOMERIC PATHWAYS IN ASSOCIATION WITH STN 1 (TEN1), encoding a factor that protects telomere ends. Interestingly, TEN1 expression was dramatically reduced in the scr mutant. Telomerase and STN1 and CONSERVED TELOMERE MAINTENANCE COMPONENT 1 (CTC1), components of the same protein complex as TEN1, were also dramatically downregulated in scr. Loss of STN1, CTC1, and telomerase caused defects in root stem cells. These results together suggest that SCR maintains root stem cells by promoting expression of genes that ensure genome integrity. Supporting this conclusion, we demonstrated that the scr mutant accumulates more DNA damage than wild-type Arabidopsis and that this problem is aggravated after exposure to zeocin, a DNA damage reagent. Finally, we identified 2 previously uncharacterized motifs in TEN1 and provide evidence that a conserved amino acid residue in 1 of the motifs is indispensable for TEN1 function. SCR thus provides a connection between genome integrity and stem cell maintenance in Arabidopsis roots.
Introduction
Postembryonic growth and development in vascular plants rely on 2 populations of stem cells, 1 at the root tip and the other at the shoot tip. Located at the center of the root tip, the quiescent center (QC) is the ultimate source of all root cells and is therefore considered the very stem cell of the root (Fig. 1A). The QC is surrounded by cells that also have stem cell properties but give rise to various cell types, and together, these cells constitute the so-called stem cell niche (SCN) (Benfey and Scheres 2000), in which the QC acts as the organizing center (Dolan et al. 1993; van den Berg et al. 1997). Daughter cells of the SCN are mitotically much more active, forming a zone of dividing cells named the root apical meristem (RAM), which is adjoined by the elongation zone (Fig. 1A). Due to its critical importance in root growth, the SCN has been the subject of extensive research, and many factors involved in SCN maintenance have been identified in the model plant Arabidopsis (Arabidopsis thaliana), such as the PLETHORA family genes (Aida et al. 2004); WUSCHEL RELATED HOMEOBOX 5 (WOX5), a transcription factor specifically expressed in the QC (Sarkar et al. 2007); and TCP family members TCP20 and TCP21 (Shimotohno et al. 2018).
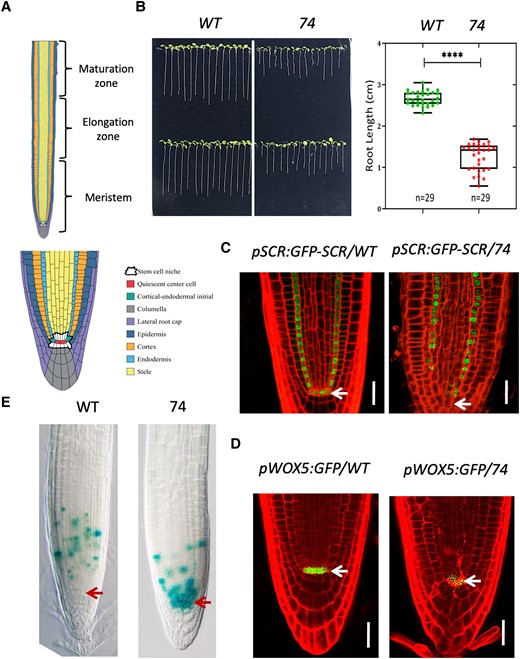
Mutant 74 is defective in root stem cell maintenance. A) Diagram of the different developmental zones (upper panel) of Arabidopsis root and cell types (lower panel) in the apical root meristem. B) Root length of 8-d-old seedlings. Representative image B) and box plot C). The median is the middle value of the data set. The upper and lower quartiles are equal to 25% and 75% of all values in the sample in a descending order, respectively. The value in the top whisker is the lower quantile + 1.5 times interquartile range (IRQ), and the value in the bottom whisker is the upper quantile − 1.5 times IRQ. Points represent values for individual samples. Outliers are those with a value greater than Q3 + (1.5 IQR) or less than Q1 − (1.5 IQR). ****P < 0.0001, t test. C, D) Confocal microscopy image showing the expression pattern of pSCR:GFP-SCR and pWOX5:GFP in the roots of wild type and mutant 74. The seedlings were 7 d old. Bar = 20 µm. E)CYCB1:1:GUS expression in the root of wild type and mutant 74, noting the shift of GUS staining maximum to the SCN in the mutant. Bar = 40 µm. The arrows in C) to E) mark the position of QC.
Telomere protective factors have also been shown to play a pivotal role in stem cell maintenance. In a genetic screen for mutants with compromised root growth, Hashimura and Ueguchi (2011) identified a mutant that has a defective SCN and a short root phenotype, which they named meristem disorganized1 (mdo1). MDO1 turns out to be TELOMERIC PATHWAYS IN ASSOCIATION WITH STN 1 (TEN1), a component of the CST complex [a trimeric complex composed of CONSERVED TELOMERE MAINTENANCE COMPONENT 1 (Ctc1), Stn1, and Ten1 in higher eukaryotes and Cdc13, Stn1, and Ten1 in yeast] that binds to and protects the telomere (Leehy et al. 2013). The ten1/mdo1 mutant is hypersensitive to DNA damage reagents, especially cells in the SCN (Hashimura and Ueguchi 2011). Severe growth retardation and telomere defects were also observed in mutants for CTC1 and STN1, which are components of the CST complex (Song et al. 2008; Surovtseva et al. 2009), suggesting that these 2 proteins may also have an important role in stem cell maintenance.
SCARECROW (SCR) is a member of the plant-specific GRAS family of transcriptional regulators with a pivotal role in stem cell maintenance and radial patterning in the root of the model plant A. thaliana (Di Laurenzio et al. 1996). In the scr mutant, QC is lost and SCN becomes disorganized, resulting in a short root phenotype (Sabatini et al. 2003). In addition to its important role in stem cell maintenance, SCR also plays an essential role in radial patterning. Compared with the wild type, which produces 2 layers of ground tissue—the endodermis and cortex—through an asymmetric cell division of the cortex/endodermis initial (CEI) cells (Fig. 1A), the scr mutant has only a single layer of ground tissue (Di Laurenzio et al. 1996). Because this mutant cell layer has characteristics of both endodermis and cortex, it has long been thought that SCR is required only for the asymmetric division of the CEI. However, a recent study showed that SCR is required for endodermal specification as well, whereby it acts redundantly with SCL23, a homolog to SCR (Long et al. 2015a).
The mechanism by which SCR regulates ground tissue patterning in A. thaliana has been largely elucidated. Acting upstream of SCR is SHORT-ROOT (SHR). However, SHR is expressed in the inner tissue of the root—the stele (Helariutta et al. 2000), unlike SCR, which is expressed specifically in the QC and endodermis (Di Laurenzio et al. 1996). The SHR protein is a mobile molecule able to move into the neighboring cells—the QC and endodermis (Nakajima et al. 2001)—where it forms a complex with SCR, enhances SCR expression through a feed forward loop, and specifies the endodermal cell fate (Cui et al. 2007; Sozzani et al. 2010). In the meantime, SHR gets trapped in the endodermis and QC as a result of physical interaction with and nuclear retention by SCR, thus defining a single layer of endodermis (Cui et al. 2007). This mechanism also requires some members of the IDD family of transcription factors, which physically interact with SHR and SCR as well (Welch et al. 2007; Moreno-Risueno et al. 2015; Long et al. 2015b).
Despite its pivotal role in stem cell maintenance, how SCR executes this role is still poorly understood. Although SCR in the QC is required for maintenance of the SCN, whether and how SCR exerts this role are still unclear (Sabatini et al. 2003). Through transcriptome analysis, Moubayidin et al. (2013) found that cytokinin signaling is elevated in the scr mutant; when a cytokinin signaling was blocked by mutation in ARR1, the short root phenotype of the scr mutant is largely rescued owing to a longer RAM, suggesting that SCR promotes root growth partially by suppressing cytokinin biosynthesis or signaling. The SCN in scr was also alleviated by arr1, as indicated by the restoration of WOX5 expression (Moubayidin et al. 2013). However, the rescue is likely to be an indirect effect of ARR1 because ARR1 is mainly expressed in the meristematic cells outside of the SCN. Moreover, the root of the arr1 scr double mutant is still substantially shorter than the wild type, suggesting the existence of other mechanisms. Recently, Shimotohno et al. (2018) showed that SCR is able to form a complex with TCP20 and PLT, and together, they activate the expression of WOX5, thus maintaining the SCN. More recently, we also showed that SCR has a role in promoting cell elongation and meristematic activity by maintaining redox homeostasis, but this does not seem to be relevant to SCN (Fu et al. 2021). These studies suggest that additional mechanisms exist for SCR in SCN maintenance.
The notion that SCR functions differently in the SCN and RAM is supported by other studies. Using a promoter-bashing approach, Kobayashi et al. (2017) revealed that the SCR promoter contains 2 cis-regulatory modules with distinct functions: 1 for QC expression and the other for endodermal expression. The factors that bind to these cis-regulatory motifs cannot be SHR, not only because SHR is present in the QC and endodermis but also because it does not have a DNA binding domain. Members of the IDD family of transcription factors could fit this role, but most IDD genes studied so far appear to be solely involved in ground tissue patterning (Welch et al. 2007; Moreno-Risueno et al. 2015; Long et al. 2015b). The only IDD factor known to be essential to stem cell maintenance is JACKDAW (JKD), but the jkd mutant has only slightly shorter root than the wild type (Welch et al. 2007), which suggests functional redundancy and/or the existence of additional factors that maintain the SCN.
Understanding the mechanism by which SCR maintains SCN necessitates the identification of factors that act upstream and downstream of SCR. We therefore have designed a genetic screen that allows us to identify mutants that affect SCR expression in the QC, but not in the endodermis. Several mutants fitting this criterium were obtained, and characterization of 1 of them is described in this report. Through marker-assisted crude mapping, whole genome resequencing, and functional complementation tests, we located the gene with the causal mutation TEN1, which encodes a component of the CST complex that protects telomere ends (Shay and Wright 2019). Interestingly, we found that TEN1 expression was dramatically reduced in the scr mutant. The other components of the CST complex, STN1 and CTC1, were also affected in scr, as was telomerase. These findings along with other relevant experiments suggest that SCR maintains the stem cell niche by ensuring telomere integrity. In addition, we have identified 2 evolutionarily conserved motifs in TEN1 and provided evidence that 1 of them has an essential role in TEN1 function.
Results
A genetic screen for genes involved in the SCR pathway identified a mutant defective in root stem cell maintenance
To identify factors that are involved in the SCR developmental pathway, we carried out an ethyl methanesulfonate (EMS) mutagenesis with seeds homozygous for a transgene expressing a GFP-SCR fusion protein under the control of the SCR promoter in the Columbia-0 (Col-0) background (pSCR:GFP-SCR, scr-1). From 10,000 mutagenized seeds, several mutants that no longer express GFP-SCR in the QC were obtained. One of these mutants, numbered 74, was chosen for further characterization in this study due to its apparent root growth defect (Fig. 1B). In this mutant, the GFP signal was lost not only in the QC but also in some endodermal cells close to the QC (Fig. 1C), which suggests that the mutation affects the SCN. Consistent with this observation, we found that cells in SCN became disorganized (Fig. 1C). We further examined the status of SCN in the mutant using the QC marker pWOX5:GFP and the mitotic marker CYCB1;1-GUS. As can been seen in Fig. 1D, the GFP signal was only weakly expressed in the QC, which is distorted in shape (Fig. 1D). In wild type, CYCB1;1-GUS was seen in meristem cells at a distance from the SCN; in our mutant, however, GUS activity was concentrated in the SCN and surrounding cells (Fig. 1E). In addition to the SCN and root growth defects, the mutant also displayed abnormal phenotypes in the shoot, such as short stature, fasciated inflorescence, extra branching, and clustered flowers (Supplemental Fig. S1, A and B). Seed development was affected as well, as some seeds were quite small and did not germinate (Supplemental Fig. S1C).
To determine whether the mutation responsible for the SCN defect was attributable to a single gene or multiple genes, we crossed the mutant with wild-type Col-0 and scored seedlings without GFP signals in the QC in the F2 segregation population. Intriguingly, among 404 F2 seedlings, only 19 seedlings could be reliably identified as mutant, resulting in a mutant frequency of about 1/20, which is dramatically less than the expected percentage for a single recessive mutation (1/4). A plausible explanation for the observed low percentage of mutants in the F2 population is that some mutants were lost because some mutant seeds could not germinate. Since phenotypic variation was also observed in the original mutant, albeit to a lesser extent, another explanation is that the mutation has incomplete penetrance; yet, another possibility is that there are other mutations that interact with the causal mutation, and these modifiers could alter the mutant/wildtype ratio in the F2 segregation population.
The gene with the causal mutation in our mutant is TEN1/MDO1
To distinguish among the possibilities described above and, more importantly, to determine whether the mutant phenotype can be attributed to a major allele, we performed a simple sequence length polymorphism (SSLP) analysis with an F2 segregation population resulting from a cross between the mutant and the wild type in the Ler background. This analysis was first conducted with 44 mutant seedlings showing a clear SCN defect phenotype, using 14 markers that are located in different regions of each of the 5 chromosomes. Only markers F28J9A on chromosome one showed a recombinant rate substantially less than 50%, suggesting that the causal mutation was located on this chromosome (Supplemental Fig. S2). To corroborate this conclusion, we analyzed the same population of mutants using 2 additional SSLP markers, NGA128 and T2K10. The recombinant rate was 3.49% for T2K10 and 1.14% for NGA128. These results suggest that the No. 74 mutant phenotype is most likely due to a recessive mutation in a single gene located near the NGA128 marker.
To pinpoint the location of the causal mutation, we next conducted whole genome resequencing with the mutants and their siblings from a F2 segregation population, as well as their parent lines. Bulked segregant analysis (BSA) (see Materials and methods for detail) clearly showed that the causal mutation is located in a region on chromosome one associated with the NGA128 marker (Supplemental Fig. S3, A–C). This result is consistent with the genetic analysis described above, lending further support to the notion that the causal mutation in mutant 74 is within a single gene. To identify the gene with the causal mutation, we first searched the region defined by the BSA analysis for genes that harbor a G-to-A mutation that is characteristic of the EMS mutagenesis, and a SNP index value of 1 that indicates complete linkage between the mutated sites and causal mutation. Among the genes meeting these criteria, 5 genes were further investigated because they either contain nonsense mutations within their coding sequences [AT1G53282, AT1G54030 (ERMO3), and AT1G54350 (ABCD2)] or lost the start codon [AT1G55720 (CAX6)] (Supplemental Table S1). AT1G56260 (TEN1) caught our attention as it has been previously identified as MERISTEM DISORGANIZATION 1 (MDO1), which plays an essential role in SCN maintenance (Hashimura and Ueguchi 2011; Leehy et al. 2013). Remarkably, our mutant had the same G-to-A mutation in the 77th codon as the mdo1-1 mutant (Leehy et al. 2013), resulting in Gly to Glu substitution. Similarly to our mutant, the mdo1-1 mutant affects SCR expression specifically in the SCN (Hashimura and Ueguchi 2011). The mdo1 mutant also resembles our mutant in many other respects, such as fasciated inflorescence stem and clustered flowers, as well as variable and incomplete penetrance of the mutant phenotypes (Hashimura and Ueguchi 2011). We therefore postulated that the gene with the causal mutation in our mutant is very likely to be MDO1. Nevertheless, in complementation tests, we have examined the function of all 5 candidate genes. In our first batch of transformations, however, we were unable to obtain any transgenic plants, which we believe is attributable to the low fertility of the mutant that was aggravated after agrobacteria infiltration. We therefore transformed an F2 segregation population of plants from a cross between the mutant and Col-0. Our reasoning is that, if the mutant is rescued, none of the resulting transgenic plants would display the mutant phenotype; otherwise, 1/20 would be abnormal, which is the percentage of mutants that we have observed in an F2-segregating population. As shown in Table 1, only AT1G56260 was able to complement the mutant. To confirm that AT1G56260 is the gene with the causal mutation, we isolated 2 independent lines of transgenic plants that is homozygous for mutant 74 and compared their root length with the wild type and the mutant. All progeny of these transgenic plants had roots that are close in length to the wild type (Supplemental Fig. S3, D and E). Based on these results, we conclude that our mutant is the same as mdo1-1.
Summary of the complementation test results
| Candidate gene | Number of transgenic plants examineda | Number of mutants expectedb | Actual number of mutants observedc |
|---|---|---|---|
| AT1G53282 | 134 | 7 | 5 |
| AT1G54350 | 110 | 6 | 7 |
| AT1G54030 | 246 | 12 | 14 |
| AT1G55720 | 205 | 10 | 8 |
| AT1G56260 | 173 | 9 | 0 |
| Candidate gene | Number of transgenic plants examineda | Number of mutants expectedb | Actual number of mutants observedc |
|---|---|---|---|
| AT1G53282 | 134 | 7 | 5 |
| AT1G54350 | 110 | 6 | 7 |
| AT1G54030 | 246 | 12 | 14 |
| AT1G55720 | 205 | 10 | 8 |
| AT1G56260 | 173 | 9 | 0 |
Number of T1 transgenic plants that show GFP fluorescence from the pSCR:GFP-SCR reporter gene. bNumber of mutants expected based on a 1/20 ratio observed for this mutant. cNumber of plants lacking GFP fluorescence in QC.
TEN1/MDO1 has several conserved motifs essential to its function
TEN1 is a component of the CST complex that binds to and ensures the integrity of the telomere (Lim and Cech 2021). The fact that our mutant has the same mutation (G77E) as the mdo1 mutant underscores the critical importance of this amino acid residue to TEN1/MDO1 function. Indeed, there is evidence that the G-to-E mutation caused protein instability in TEN1 (Lim and Cech 2021) and loss of TEN1's ability to interact with CTC, a scaffold protein essential for the assembly of the CST complex (Lim and Cech 2021).
Underscoring its essential role in telomere integrity, TEN1 is found in all organisms that have linear chromosomes (Prochazkova Schrumpfova et al. 2019). Bioinformatics analysis of TEN1 homologs from a number of organisms, including yeast, plants, and mammals, showed that G77 is located within a stretch of amino acid residues that are highly conserved in these organisms (Leehy et al. 2013). This motif was shown to be critical to TEN1 function, as the G77E mutation causes protein instability and loss of the ability to interact with STN1 (Leehy et al. 2013). The same analysis also revealed the presence of additional conserved motifs, but their functional importance has not been experimentally tested. To determine whether these additional motifs are indispensable for TEN1 function in plants, we identified the most conserved amino acid residues in them by multisequence alignment of TEN1 homologs from a wide spectrum of plants, ranging from bryophytes to seed plants, as well as 2 green algae species and the fission yeast (Supplemental Table S2). Two amino acid residues were found to be present in all TEN1 homologs: 1 is an arginine at position 21 (R21) and the other is a glycine at position 100 (G100) (Fig. 2A).
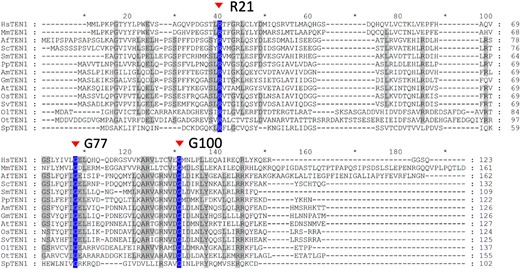
Multisequence alignment of TEN1 homologs from a diverse range of eukaryotes. Arrows mark the position of the most conserved amino acids, R21 and G100, as well as G77, which is mutated in the mdo1-1/ten1-3 mutant. See Supplemental Table S2 for the full names of the species and their corresponding taxonomy groups. TEN1 homologs in other species were identified in the NCBI database (www.ncbi.nlm. nih.gov/BLAST), phytozome (https://phytozome.jgi.doe.gov), and FernBase (https://www.fernbase.org) by BLAST, and multiple sequence alignment was performed using BLASTALX and the default parameters (Thompson et al. 1997). See Supplemental Table S2 for the full names of the species and their corresponding taxonomy groups.
To test the functionality of R21 and G100, we mutated the arginine to glycine (R21G) or glutamine (R21E) and the glycine to glutamine (G100E) and then expressed the mutant forms as GFP fusion proteins under the control of the TEN1 promoter in the TEN1 mutant. To circumvent the sterility issue of this mutant, we used the strategy described above (i.e. transforming F2 plants from a cross between the mutant and the wild type and calculating the percentage of transgenic plants still showing mutant phenotypes). The results showed that all but the protein containing the G100E mutation were able to fully rescue the mutant (Table 2). Since the number of seedlings containing the transgene and showing mutant phenotypes was the same as that expected based on the 1/20 frequency that is characteristic of our mutant, we conclude that the G100E mutation has completely abolished the function of the TEN1 protein. We confirmed these results in further experiments by analyzing the root length of transgenic plants homozygous for the 74/ten1 mutation (Fig. 3). This result suggests that G100 and hence the corresponding motif are critical for TEN1 function.
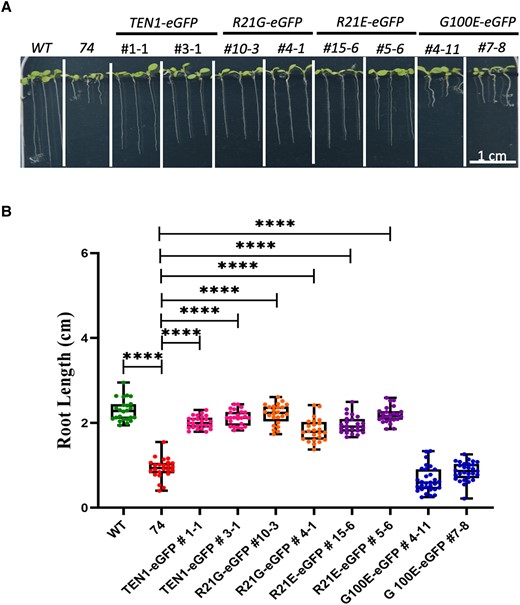
Complementation test showing the importance of G100 for TEN1 function. A) Representative images of 1-wk-old seedlings of wild type (WT), no. 74 mutant, and 2 independent transgenic lines for each transgene in the mutant 74/ten1 background. B) Statistical analysis of root length for the complementation test. The median is the middle value of the data set. The upper and lower quartiles are equal to 25% and 75% of all values in the sample in a descending order, respectively. The value in the top whisker is the lower quantile + 1.5 times IRQ, and the value in the bottom whisker is the upper quantile − 1.5 times IRQ. Points represent values for individual samples. Outliers are those with a value greater than Q3 + (1.5 IQR) or less than Q1 − (1.5 IQR). ****P < 0.0001. t test, n = 24.
Summary of results from the complementation tests for TEN1 variants
| Vector | Number of transgenic plants examineda | Number of mutants expectedb | Number of mutants observedc |
|---|---|---|---|
| pTEN1:TEN1-eGFP | 109 | 5 | 0 |
| pTEN1:R21G-eGFP | 115 | 6 | 0 |
| pTEN1:R21E-eGFP | 117 | 6 | 0 |
| pTEN1:G100E-eGFP | 110 | 6 | 6 |
| Vector | Number of transgenic plants examineda | Number of mutants expectedb | Number of mutants observedc |
|---|---|---|---|
| pTEN1:TEN1-eGFP | 109 | 5 | 0 |
| pTEN1:R21G-eGFP | 115 | 6 | 0 |
| pTEN1:R21E-eGFP | 117 | 6 | 0 |
| pTEN1:G100E-eGFP | 110 | 6 | 6 |
Number of T1 transgenic plants that show GFP fluorescence from the pSCR:GFP-SCR reporter gene. bNumber of mutants expected based on a 1/20 ratio observed for this mutant. cNumber of plants lacking GFP fluorescence in QC.
The TEN1 protein is mainly localized in the nucleus (Leehy et al. 2013). Hence, it is possible that the G100E mutation could cause a change in subcellular localization. To test this possibility, we examined by confocal microscopy the subcellular localization of the GFP fusion proteins, with or without the G100E mutation, in root epidermal cells of the transgenic plants used for the complementation tests [pTEN1:TEN1-eGFP (G100E) and pTEN1:TEN1-eGFP]. As expected, the TEN1-GFP protein was found mainly in the nucleus, but it appeared to be also present in the cytoplasm and even in plasma membrane (Fig. 4A). Strikingly, we found that the TEN1-GFP (G100E) protein was barely detectable, although it had the same subcellular localization as the wild-type form (Fig. 4, A and B). The low GFP fluorescence was unlikely due to the GFP tag, because the expression levels of the TEN1-GFP fusion proteins containing R21G [pTEN1:TEN1-eGFP (R21G)] or R21E [pTEN1:TEN1-eGFP (R21E)] were similar to those of TEN1-GFP (Fig. 4A). We also examined the transcript level of TEN1-GFP (G100E) by reverse transcription quantitative PCR (RT-qPCR) using primers located within the GFP sequence but found no difference in its expression level from other forms of TEN1 (Fig. 4C).
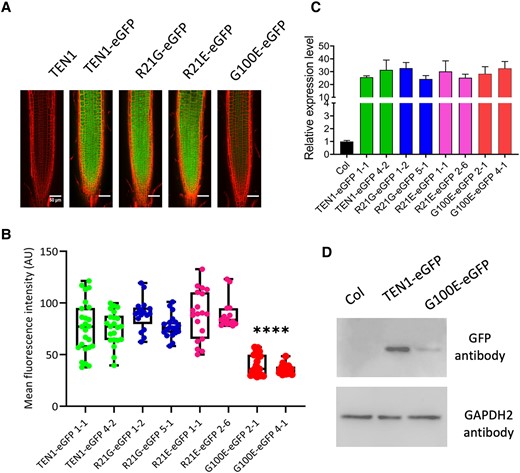
G100 is essential to TEN1 protein expression. A) Representative confocal microscope images showing the expression of the different GFP fusion proteins. Bar = 50 µm. B) Box plot and statistical analysis of GFP signal intensity in the root tip of transgenic plants. AU, artificial unit. The median is the middle value of the data set. The upper and lower quartiles are equal to 25% and 75% of all values in the sample in a descending order, respectively. The value in the top whisker is the lower quantile + 1.5 times IRQ, and the value in the bottom whisker is the upper quantile − 1.5 times IRQ. Points represent values for individual samples. Outliers are those with a value greater than Q3 + (1.5 IQR) or less than Q1 − (1.5 IQR). ****P < 0.0001. t test, n ≥ 15. C) RT-qPCR assay showing that transgenes are expressed at similar levels. Col was used as a negative control. The values are the mean ± Sd, 3 biological replicates. D) Western blot assay showing the protein level of the TEN1-GFP fusion protein with the G100E mutation (G100E-eGFP), relative to nontransgenic plants (COL), and the wild-type TEN1-eGFP fusion protein. GAPDH2 was used as a loading control.
The observed low fluorescence in the TEN1-eGFP (G100E) transgenic plants could be attributed to a low level of protein or to misfolding of the protein. To distinguish between these possibilities, we compared the protein level of the TEN1-GFP proteins with or without the G100E mutation by western blot. As shown in Fig. 4D, the mutated protein was present at a much lower level relative to the wild-type GFP fusion protein. Since the G77E mutation is known to affect the physical interaction between TEN1 and STN1 (Leehy et al. 2013), we reasoned that the G100E mutation may have a similar effect, which would make the protein more vulnerable to degradation. Surprisingly, however, yeast 2-hybrid assay indicated that the G100E mutant form was still able to interact with STN1 and the interaction was as strong as that between the wild-type form and STN1 (Fig. 5A). To validate this result, we tested their interaction further by bimolecular fluorescence complementation. As shown in Fig. 5B, the G100E mutation did not affect the interaction between TEN1 and STN1. These results suggest that the low level of the G100E mutant form is not due to its dissociation from the CST complex. Consistent with the result from our confocal microscope observation (Fig. 4A), TEN1-GFP was clearly detected in the plasma membrane and cytoplasm in addition to its nuclear localization (Fig. 5B).
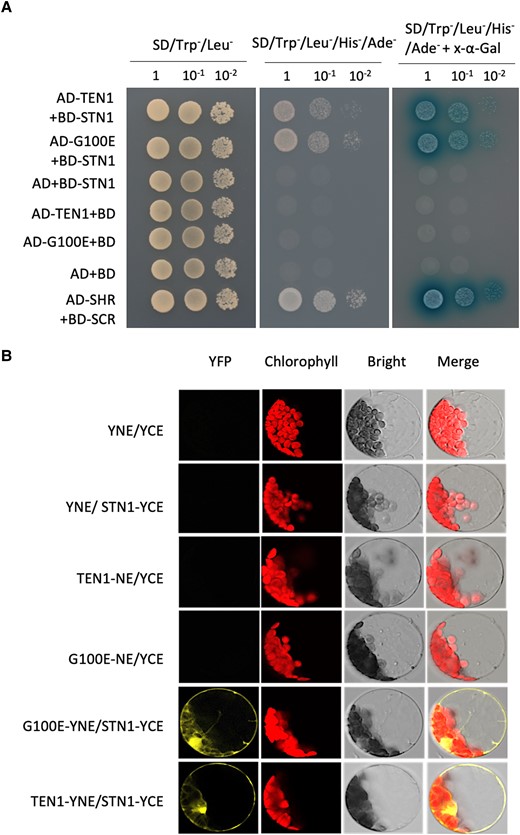
G100E mutation does not affect physical interaction between TEN1 and STN1. A) Yeast 2-hybrid assay showing that the G100E mutation does not affect the ability of TEN1 to interact with STN1. The SHR and SCR pair serves as the positive control. YNE, N-terminus of YFP; YCE, C-terminus of YFP. B) Bimolecular fluorescence complementation assay for the interaction between STN1 and TEN1 with or without the G100E mutation.
The steady-state level of TEN1 protein could be regulated by the ubiquitin–proteasome pathway and the G100E mutation may make it a better target for degradation. To test this hypothesis, we treated seedlings containing the pTEN1:TEN1-eGFP or pTEN1:TEN1(G100E)-eGFP construct with the proteasome inhibitor MG132 and then examined GFP fluorescence by confocal microscopy. As negative controls, the R21G and R21E mutation forms were also included in this experiment. No apparent difference in fluorescence signal intensity was detected for any of these proteins before and after MG132 treatments (Supplemental Fig. S4). These results suggest that TEN1 is degraded by a mechanism unrelated to the ubiquitin–proteasome pathway.
Other telomere protecting factors also play a role in stem cell maintenance in the root
The finding that mutation in TEN1 causes SCN defect raises the question of whether other telomere integrity factors also have a role in stem cell maintenance in the root. To address this question, we examined the SCN in mutants for the other components of the CST complex, CTC and STN1, as well as telomerase. Compared with the wild type, all mutants displayed a short and variable root phenotype (Fig. 6, B and C). Confocal microscopic imaging showed that in ctc1 and stn1 mutants, the SCN was severely disorganized with cells heavily stained by propidium dye, indicating cell damage (Fig. 6A). Cell damage was also observed in 2 telomerase mutants, tert1 and tert-2, although their SCN appear to be morphologically normal. These results suggest that telomere integrity is essential to stem cell maintenance.
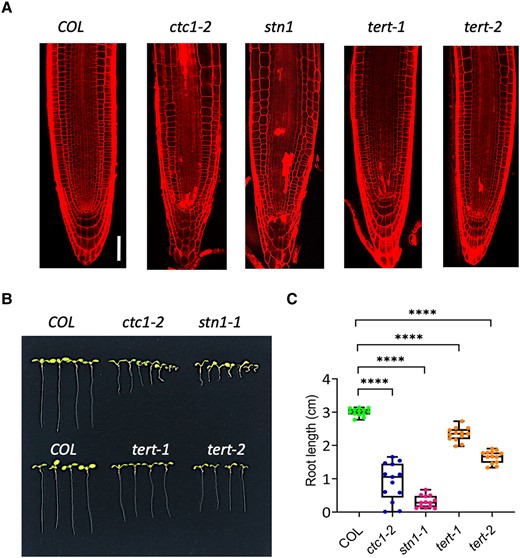
CTC1, STN1, and telomerase also play a role in SCN maintenance. A) Confocal microscope images showing disorganized SCN in ctc1, stn1, and telomerase (tert) mutants. B)ctc1, stn1, and 2 tert mutants have short roots. The seedlings were 8 d old grown in MS medium. C) Box plots of the root length of ctc1, stn1, and 2 tert mutants. The median is the middle value of the data set. The upper and lower quartiles are equal to 25% and 75% of all values in the sample in a descending order, respectively. The value in the top whisker is the lower quantile + 1.5 times IRQ, and the value in the bottom whisker is the upper quantile − 1.5 times IRQ. Points represent values for individual samples. Outliers are those with a value greater than Q3 + (1.5 IQR) or less than Q1 − (1.5 IQR). ****P < 0.001. t test, n = 13.
SCR maintains the SCN by maintaining telomere integrity
The finding that mutation in TEN1 causes SCN defect raises the possibility that SCR may maintain the SCN by maintaining the expression level of TEN1 and other telomere protecting factors. To investigate this possibility, we first examined TEN1 expression in the scr-1 mutant by RT-qPCR. Indeed, we found that the TEN1 transcript level was dramatically reduced in scr-1 (Fig. 7A). TEN1 expression was similarly affected in scr-3, albeit to a less extent (Supplemental Fig. S5A), as scr-3 is a weaker allele. We also examined the expression pattern and level of TEN1 in the scr-1 mutant using the pTEN1:TEN1-GFP reporter construct. Consistent with the RT-qPCR result, the GFP signal from the TEN1-GFP protein was significantly reduced in the scr-1 root (Fig. 7B).
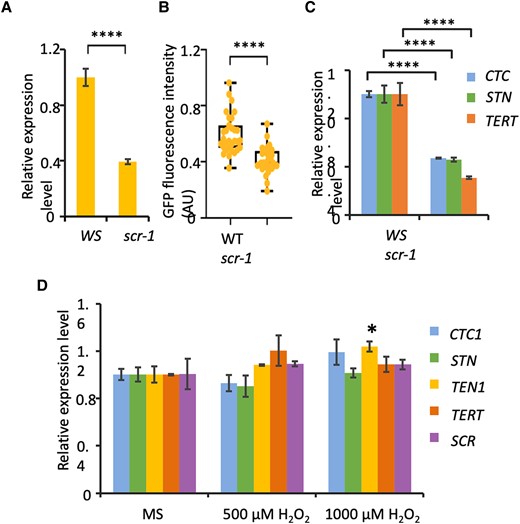
TEN1, CTC1, STN1, and telomerase are downregulated in the scr-1 mutant. A)TEN1 transcripts in the roots of wild-type (WS) and scr-1 seedlings. B) TEN1-eGFP protein level in wild-type (WT) and scr seedlings, as determined by the intensity of green fluorescence. The median is the middle value of the data set. The upper and lower quartiles are equal to 25% and 75% of all values in the sample in a descending order, respectively. The value in the top whisker is the lower quantile + 1.5 times IRQ, and the value in the bottom whisker is the upper quantile − 1.5 times IRQ. Points represent values for individual samples. Outliers are those with a value greater than Q3 + (1.5 IQR) or less than Q1 − (1.5 IQR). C) Transcript level of CTC1, STN1, and telomerase (TERT) in the roots of wild-type and scr-1 seedlings. D) Transcript level of TEN1, CTC1, STN1, and telomerase in the roots of wild-type seedlings with or without H2O2 treatments. For A), C), and D), RT-qPCR was performed using actin 7 as an internal control. The values are the mean ± Sd, 3 biological replicates. *P < 0.05; ****P < 0.0001. t test.
The SCN defect in the scr mutant is unlikely attributable only to the lower expression of TEN1, because scr have a much shorter root than ten1. We therefore also examined the transcript levels of STN1 and CTC1 as well as telomerase. As expected, all of these genes were found to be dramatically downregulated in scr-1 and scr-3 (Figs. 7C and S5B). These results suggest that SCR maintains the SCN by maintaining the integrity of chromosome ends.
Recently, we showed that the scr mutant has a defect in redox homeostasis, which partly explains its shorter root phenotype (Fu et al. 2021). It is thus possible that the reduction in expression of telomerase and the CST complex is an indirect consequence of an elevated level of reactive oxygen species in the mutant. To test this, we compared the transcript level of telomerase, TEN1, STN1, and CTC1 in wild-type seedlings grown in Murashige and Skoog (MS) medium or H2O2-containing medium. As shown in Fig. 7D, none of these genes was affected transcriptionally by H2O2 at a concentration of 500 µ M and 1,000 µ M, which have apparent growth inhibitory effects but are still below the level causing cell death (Cui et al. 2014). This result lends support to the notion that SCR maintains the SCN by maintaining telomere integrity.
If the reduction in TEN1 expression is a cause for the SCN defect in scr, scr mutants could have an elevated level of damaged DNA and thus would be hypersensitive to conditions that elicit DNA damage. To test whether this is the case, we first treated scr-1, scr-3, and their corresponding wild-type (WS and Col, respectively) seedlings with zeocin, a reagent known to cause DNA damage. As shown in Figs. 8 and S6, scr-1 and scr-3 seedlings became yellow at 20 µg/mL of zeocin and bleached at 50 µg/mL, whereas the wild type had only a few lesions. To assess the extent of DNA damage in the scr-1 mutant, we performed A/N (alkaline denaturation and neutral gel electrophoresis) comet assay according to Menke et al. (2001) and Pourrut et al. (2015). Under normal growth condition, a significant greater number of nuclei with a distorted shape was already present in the scr-1 mutant relative to the wild type (20% vs 12%). More critically, the distorted nuclei in the scr-1 mutant exhibited a higher proportion of DNA in the tail (indicating damage) (Fig. 8, D and E). After treatment with 10 µg/mL zeocin for 1 h, the percentage of distorted nuclei increased dramatically in both plants (47% vs 40%), which was accompanied by more significant difference in tailing. These results clearly indicate that the scr genome is somehow compromised.
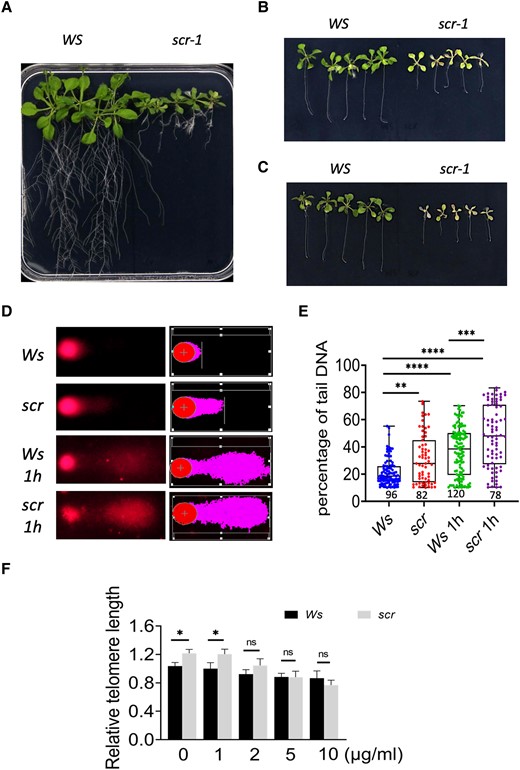
The scr-1 mutant is hypersensitive to zeocin, a DNA damage reagent. A) Wild-type (WS) and scr-1 seedlings 22 d after germination in MS medium. B), C) Wild-type (WS) and scr-1 seedlings 14 d after 8-d-old seedlings were transferred to MS medium containing 20 B) or 50 μg/mL C) zeocin. D) Representative images from the comet assay, showing damaged nuclei in the roots of 8-d-old wild-type and scr-1 seedlings, with or without zeocin treatment (10 µg/mL zeocin for 1 h), before (left) and after (right) processing with the CASP software. The damaged DNA (in the tail) is marked in a different color. E) Statistical analysis of the percentage of DNA in the comet tail using the CASP software. The number below the graph indicates the number of nuclei examined. The median is the middle value of the data set. The upper and lower quartiles are equal to 25% and 75% of all values in the sample in a descending order, respectively. The value in the top whisker is the lower quantile + 1.5 times IRQ, and the value in the bottom whisker is the upper quantile − 1.5 times IRQ. Points represent values for individual samples. Outliers are those with a value greater than Q3 + (1.5 IQR) or less than Q1 − (1.5 IQR). F) Quantitative PCR assay of telomere length. Two days after 6-d-old WS and scr seedlings were transferred to MS medium containing 0, 1, 2, 5, and 10 µg/mL zeocin. Three biological replicates. The values are the mean ± Sd, 3 biological replicates. Tukey's test was used in E) and F). *P < 0.05, **P < 0.01, ***P < 0.001, and ****P < 0.0001.
Next, we examined the integrity of the telomeres using a quantitative PCR-based assay for telomere length measurement (Cawthon 2002; Vaquero-Sedas and Vega-Palas 2014). Intriguingly, under normal growth conditions, the scr-1 mutant seemed to have slightly longer telomeres than the wild type (Fig. 8). However, after exposure to zeocin, the telomere became shorter at a faster rate in the scr mutant than the wild type and 10 µg/mL of zeocin made the mutant telomere shorter than the wild type (Fig. 8F). This result suggests that the scr mutant may have some lesions in its telomeres due to defects in its telomere protecting mechanisms, making the plant vulnerable to DNA damage reagents. The results described above lend strong support to the notion that the scr mutants have a defect in telomere integrity.
Discussion
Maintaining the SCN is essential to postembryonic growth and development in plants. Although SCR was identified as a key regulator of stem cell maintenance in Arabidopsis root more than 2 decades ago, the mechanism by which SCR maintains the root SCN has remained unclear. Serendipitously, in this study, we discovered a connection between SCR and telomere protecting factors. In a genetic screen aimed to identify factors that regulate SCR expression, we uncovered a mutant that has lost SCR expression in the SCN, resulting in disorganized SCN and a short root phenotype. Through subsequent molecular analyses, we were able to locate the causal mutation within TEN1 that encodes a component of the telomere-end protecting CST complex. Because of the similar SCN defects in ten1 and scr mutants, we wondered if altered TEN1 expression and other telomere protecting factors could be a cause of the SCN defect in scr. We tested and corroborated this hypothesis by RT-qPCR, which showed that telomerase and the 3 components of the CST complex, TEN1, CTC1, and STN1, were all downregulated in scr. This change in gene expression is clearly not due to an elevated level of reactive oxygen species that accumulated in the scr mutant (Fu et al. 2021), because none of these genes was induced by hydrogen peroxide. These results together suggest that SCR maintains the SCN, at least partly, by sustaining an optimal expression level of telomere protecting factors and thus ensuring telomere integrity. Supporting this conclusion, we demonstrated that the scr mutant was hypersensitive to zeocin, a DNA damage reagent, in terms of plant growth, the amount of damaged DNA, and telomere length. Even under normal growth conditions, the scr mutant already displayed a greater extent of fragmented DNA, as revealed by the comet assay. Although the finding that telomeres are longer in the scr mutant was puzzling, we think it is possible that this is an indication of DNA damage, as telomeres shorter than a threshold size could trigger a remedy mechanism called alternative telomere lengthening (Nabetani and Ishikawa 2011).
The role of SCR in maintaining genome stability may not be limited to the telomere because 1 of its downstream targets, STN1, has been shown to interact with DNA polymerase alpha, an enzyme involved in genome replication (Derboven et al. 2014). In addition, there is evidence that individual components of the CST complex may have distinct functions that are currently not understood. For instance, protein subcellular location studies showed that in the nucleus, TEN1 and CTC1 are enriched in many spots beyond the telomeres, which do not overlap (Surovtseva et al. 2009; Leehy et al. 2013). In the present study, we found that TEN1 protein was even localized in the plasma membrane and cytoplasm (Fig. 4, A and E). These observations suggest that TEN1 is a multifunctional protein, which was also proposed in a recent study by others (Lee et al. 2016). Considering the fact that TEN1, CTC1, and STN1 are downregulated in scr, it is logical to postulate that SCR maintains the root SCN by ensuring genome stability at the genome scale.
The fact that our ten1 mutant was isolated as a plant losing SCR expression in the QC, along with our subsequent finding that mutation in other telomere-associated factors caused SCN defect as well, raises the possibility that there might be a regulatory loop between SCR and telomere integrity genes. On the one hand, SCR promotes the expression of telomere integrity genes, thus maintaining genome stability and SCN; on the other hand, telomere integrity factors ensure genome stability, thereby maintaining the SCN and SCR expression likely as an indirect consequence of the loss of the QC.
In addition to the role of SCR and telomere integrity factors in SCN maintenance, in this study, we also identified and functionally validated the indispensability of a conserved motif in TEN1. Through phylogenetic analyses of TEN1 homologs from a wide range of eukaryotes, we showed that 3 amino acid residues are present in all plants: R21, G77, and G100. The functional importance of G77 is underscored by the fact that it is exactly the same mutation in our mutant and the mdo1 mutant (Leehy et al. 2013). To examine the functionality of R21 and G77, we substituted glutamic acid (E) or alanine (A) using site-directed mutagenesis and expressed them in our mutant. Only the G100E mutation failed to complement the ten1 mutant, indicating that G100 is critical for TEN1 function. Interestingly, in further experiments, we showed that the TEN1 protein with the G100E mutation was barely detectable, although this mutation did not affect the physical interaction between TEN1 and STN1. These results strongly suggest that the motif containing G100 is required for protein stability, although how G100 exerts this role is still unknown. It is noteworthy that components in the CST complex interact not only with each other but also with other proteins, such as POT1 (Renfrew et al. 2014) and DNA polymerase (Derboven et al. 2014). It is thus possible that this motif is required for protein–protein interaction with other proteins, which warrants further investigation.
Materials and methods
Plant growth conditions and treatments
For root growth experiments, Arabidopsis (A. thaliana) seedlings were grown aseptically in MS medium supplemented with 1% (w/v) sucrose and 0.6% Phytagel (Beijing BioDee Biotech, P8169) in square petri dishes, which were placed vertically in a Percival growth chamber (model 41L). The growth conditions were 16-h light (50 micromoles/m2/s of light irradiance) and 8-h darkness with a constant temperature of 22°C. For this purpose, seeds were first sterilized with 10% (v/v) bleach and then washed thoroughly with sterile H2O before sowing. For bulking and experiments with above-ground organs, plants were grown in a growth room with the same settings as the growth chamber.
For chemical treatments, seedlings were first germinated and grown in 1× MS medium for 6 d (for H2O2) or 8 d (for zeocin and MG-132, a peptide aldehyde proteasome inhibitor). After transfer to the appropriate medium, seedlings were then allowed in the growth room for 3 h, 4 d, or 6 d with MG-132 (MedChemExpress, HY-13259), H2O2, or zeocin (Coolaber, SL4140), respectively. As a control, a similar number of seedlings were also transferred to fresh MS medium and mock treated for the same amount of time.
EMS mutagenesis, mutant screen, and characterization
EMS mutagenesis was conducted according to the Arabidopsis handbook (Weigel and Glazebrook 2002). Approximately 20,000 seeds (Col-0) homozygous for the pSCR:GFP-SCR transgene were treated overnight at room temperature with 10 mL 0.1% (w/v) EMS (Sigma M0880, MO, USA). After thorough washing, the seeds were suspended in 0.01% agarose and sowed in soil (3 to 5 seeds per pot). At maturity, the seeds (M0) from all the plants in each pot were pooled and numbered. For mutant screening, the root tip (∼1 cm) of 1-wk-old seedlings grown in MS medium was cut and examined under a compound fluorescence microscope (Olympus BX61), and seedlings showing an abnormal pattern or intensity of GFP fluorescence (M1) were transferred to soil for seed setting. Putative mutants were reexamined at the M2 generation, and true mutants were crossed to Ler for subsequent genetic analyses and causal gene identification. For confocal microscopy, seedlings were stained for 1 min with propidium iodide (PI) (Sigma, P-4170) dissolved in ddH2O at a concentration of 10 μg/mL and images were captured using a Leica SP8 confocal microscope. For PI staining, the laser wavelength was 561 nm, the intensity was 36%, collection bandwidth was 572 to 641 nm, and the gain was 800; for GFP fluorescence, the laser wavelength was 488 nm, the intensity was 70%, collection bandwidth was 500 to 550 nm, and the gain was 800.
Genetic analysis and marker-assisted mapping of the causal genes in mutant 74
For this purpose, mutants in the F2 population from a cross between mutant 74 (in the Col background) and Ler were selected based on the expression pattern of GFP fluorescence in the root tip. The percentage of seedlings showing loss of GFP-SCR expression was then calculated as a proxy for the penetrance of the mutant phenotype. To determine the chromosomal location, individual mutants were genotyped when they were 1 mo old by PCR using SSLP markers. Primer information was retrieved from the Arabidopsis Information Resource (TAIR, http://www.arabidopsis.org) and is listed in Supplemental Table S3. DNA was extracted using the CTAB method.
High-throughput sequencing and BSA analysis
Three groups of plants were sequenced using the Illumina paired-end sequencing method on the HiSeq4000 platform: the same F2 mutant plants as described above for marker-assisted mapping (57 plants), normal F2 plants (30 plants), and the original mutant 74 (M2, 30 plants). An equal amount (weight) of leaf samples was collected from each plant, and the leaf samples were pooled for each group for DNA extraction using the TIANGEN DNA purification kit (TIANGEN, DP305-02). High-throughput sequencing and BSA were provided by a commercial service (Lianchuan Biotech Ltd., Hangzhou, China).
After removal of linker sequences, contamination, and low-quality reads, 4.28 Gbp, 3.44 Gbp, and 2.12 Gbp valid sequence reads were obtained for the 3 groups of samples, respectively, corresponding to a coverage of 56.5X, 45.3X, and 28.0X. After the sequence reads were mapped to the Arabidopsis genome usingTAIR10 (https://www.arabidopsis.org/download/), SNPs in the mutants were then identified by pairwise comparison, for which the genome sequence of Ler that we generated recently was also used as the reference (Li et al. 2020). For a particular mutated site, the ratio between the number of reads with that nucleotide and the total number of reads was calculated as the SNP index. Thus, the SNP_index should be one for those sites that are completely linked to the causal mutation, and 0.33 for the normal F2 population. The Delta_SNP_index was then calculated by subtracting the SNP_index for F2 normal from that for F2 mutants. Finally, SNPs with a Delta_SNP_index within the top 0.5% that also causes missense or nonsense mutation were selected as candidate causal mutations and the genes containing these SNPs were subject to further investigation.
Complementation tests
All genes tested in this study were expressed in mutant 74 under the control of their own promoters. For the promoter, the intergenic region up to 3 kb, upstream of the first codon, was PCR amplified. For AT1G54030, AT1G55720, and AT1G56260, the coding region was amplified from genomic DNA, whereas for AT1G54350, the cDNA was used as the template. AT1G53282 is an exception because of its small size: its promoter and coding region were amplified as a single piece using genomic DNA as the template. For the convenience of cloning, appropriate restriction sites were introduced into the primers used for the PCR amplification (Supplemental Table S3). After digestion with corresponding enzymes and purification, PCR fragments were cloned into the pBluescript vector. Finally, clones whose sequences have been confirmed by Sanger sequencing were subcloned into the expression vector pCambia1305 or pCambia1302 (see Supplemental Table S3 for the restriction sites used).
The construct for expressing TEN1-GFP fusion protein was generated in a similar manner to the clones above, except that the coding region was PCR amplified using the forward primer TEN1-F and a reverse primer that does not contain the stop codon (TEN1-R, Supplemental Table S3). The GFP sequence in the expression vector was also retained and the 2 sequences were fused in frame. To construct GFP-tagged mutant versions of TEN1, the point mutation was introduced by overlapping PCR. First, 2 fragments were separately amplified: a 5′ fragment using TEN1-F and a reverse primer that contains the mutant nucleotide (Rm primers) and a 3′ fragment using TEN1-R and a forward primer that contains the mutant nucleotide (Fm primers); the 2 PCR reactions were then mixed and subjected to PCR for 5 cycles; finally, fresh TEN1-F and TEN1-R primers were added to this mix and PCR was allowed to run for 28 cycles.
For cloning described in this study, a high-fidelity DNA polymerase, PrimeSTAR HS DNA Polymerase (TaKaRa, R010A), was used for all PCR reactions. Transgenic plants were generated in the Col-0 ecotype using the flower dip method (Clough and Bent 1998) and selected on MS medium containing hygromycin at a concentration of 50 μg/mL−1.
Other molecular assays
RNA extraction and RT-qPCR
Total RNA was extracted from the roots of 8-d seedlings using the TRIzol reagent. After treatment with DNase I (Thermo Scientific, EN0521) to remove residual genomic DNA, the RNA was converted into cDNA using the PrimeScript II 1st-Strand cDNA Synthesis Kit (TaKaRa, 6210A) following the instruction in the manual. The cDNA was then used as a template in subsequent RT-qPCR assay, for which Taq Pro Universal SYBR qPCR Master Mix (Vazyme, Q711-02) was used on a Bio-Rad CFX Connect real-time system. The primers used in the assay were CTC1-RT-F and CTC1-RT-R for CTC1; STN1-RT-F and STN1-RT-R for STN1; TEN1-RT-F and TEN1-RT-R for TEN1; TERT-RT-F and TERT-RT-R for TERT; SCR-RT-F and SCR-RT-R for SCR; and eGFP-F and eGFP-R for the GFP-fusion genes. 18S rRNA and ACTIN7 were used as internal controls. See Supplemental Table S3 for information about the primers.
Yeast 2-hybrid assay
The MATCHMAKER two-hybrid system 3 (http://www.bdbiosciences.com) was used for this experiment, whereby STN1 was used as the bait and TEN1 with or without the G100E mutation was used as the prey. The STN1 and TEN1 coding sequences were amplified by PCR using cDNA made from wild-type Col seedlings as the template, cut with EcoRI along with PstI and BamHI, respectively, and then cloned into the corresponding sites of the GBKT7 or GADT7 vectors. After confirmation by Sanger sequencing, the STN1-BD and TEN1-AD or TEN1-G100E-AD plasmids, as well as negative controls, were cotransformed into competent yeast (Saccharomyces cerevisiae) cells (strain: YH109), and cells with both constructs were selected on SD/-Leu/-Trp medium (Clontech, 630417). Ten colonies picked up with a tooth pick were diluted in 1 mL 0.9% NaCl (w/v) and spotted onto SD/-Ade/-His/-Leu/-Trp medium (Clontech, 630428) with or without α-X-Gal (GoldBio, 107021-38-5). See Supplemental Table S3 for information about the primers.
Bimolecular fluorescence complementation
This assay was conducted essentially as described (Walter et al. 2004). TEN1 with or without the G100E mutation was fused to the N-terminal 155 amino acids of YFP, which were named as TEN1-YNE and G100E-YNE, respectively, whereas STN1 was fused to the C-terminal 86 amino acids of YFP, and the fusion protein was named as STN1-YCE. To make the TEN1-YNE or G100E-YNE expressing construct, TEN1 with or without the G100E mutation was PCR amplified using primers TEN1-BiFC-F and TEN1-BiFC-R (Supplemental Table S3) and their clones described above as the templates, cut with BamHI and XhoI that had been introduced into the primers during primer synthesis, and cloned into the same restriction sites in the pSPYNE-35S vector. The STN1-YCE expressing construct was cloned into the pSPYCE-35S vector by introducing XbaI and XhoI into the coding region of STN1 by PCR using the STN1-BiFC-F and STN1-BiFC-R primer pair (Supplemental Table S3). The plasmids for STN1-YCE and TEN1-YNE or G100E-TNE were then introduced together into Arabidopsis protoplasts prepared according to Yoo et al. (2007), and YFP fluorescence and chlorophyll autofluorescence were then imaged using a Leica TCS SP8 confocal microscope. For YFP, the laser wavelength was 514 nm, intensity was 8%, collection bandwidth was 521 to 587 nm, and the gain was 778; for chlorophyll, the laser wavelength was 633 nm, intensity was 1%, collection bandwidth was 669 to 761 nm, and the gain was 806. As controls, a number of plasmid pairs were also cotransformed into the protoplast, including the YNE + YCE pair, TEN1 − YNE + YCE, G100E − YNE + YCE, and YNE + STN1 − YCE pairs.
Western blot
Eight-day-old seedlings grown in MS medium were used for this experiment. For each sample, 0.1 g of root cut 1 cm from the tip was grounded in 300 μL ice-cold protein extraction buffer (50 mM Tris-HCl, pH 7.5, 150 mM NaCl, 1% (v/v)Triton X-100, 1 mM EDTA, 1× protease inhibitor cocktail (Sigma-Aldrich), and 1 mM PMSF). After centrifugation (14,000 RCF 4°C, 10 min), the supernatant was mixed with SDS loading buffer, boiled for 5 min, and then loaded to 10% (w/v) SDS–polyacrylamide gel for electrophoresis. The proteins were then transferred for 1 h to a PVDF membrane (MilliporeSigma ISEQ00010) using the semidry method, and the GFP fusion proteins were detected using the JL-8 (Clontech, 632380; 1:2,500 dilution) as the primary antibody and an HRP-conjugated Affinipure Goat Anti-Mouse antibody (Proteintech, SA00001-1; 1:2,500 dilution) as the secondary antibody. As a loading control, GAPDH was also detected using an antibody against it from Proteintech (60004-1-Ig; 1:20,000 dilution). Signal was visualized using the ECL Western Blotting Reagent (Hyyan Biotech, HY005) and a chemifluorescence imaging system from Syngene (Gbox Chemi XRQ).
Quantitative PCR assay for telomere length measurement
This assay was essentially performed as previously described with some modifications (Cawthon 2002; Vaquero-Sedas and Vega-Palas 2014). First, seeds were germinated on MS medium or MS medium containing various concentrations of zeocin, and genomic DNA was extracted from the roots of 8-d-old seedlings using the Plant Genomic DNA Kit (TIANGEN, DP305). Then, the telomeric sequences were amplified using primers TelA and TelB on a Bio-Rad CFX connect Real-time System using TB Green Premix Ex Taq II (TaKaRa, RR820A). The single copy gene CYP5 was also amplified as a reference, using primers CYP5-F and CYP5-R. Two hundred nanograms of DNA per PCR was used.
The qPCR conditions were as follows: for telomeric sequences, (i) 95°C, 15 min; (ii) 2 cycles of 94°C, 15 s, and 49°C, 15 s; (iii) 32 cycles of 15 s at 94°C, 10 s at 62°C, and 15 s at 74°C; and (iv) 1 min at 72°C. For CYP5, 95°C, 10 min; 95°C, 15 s; 60°C, 1 min; and 72°C, 1 min. Totally 32 cycles. The results were calculated by 2−ΔΔCt. Statistical significances of differences were assessed using Tukey's test.
Comet assay
The comet assay was performed according to Menke et al. (2001) and Pourrut et al. (2015). The roots of 8-d-old seedlings were sliced on ice in 400 µL 1 × PBS buffer (160 mM NaCl, 8 mM Na2HPO4, and 4 mM NaH2PO4, pH = 7.0) containing 50 mM EDTA. The debris was removed by filtering through a 75-µm nylon cloth, and the nuclei suspension was mixed with an equal volume of 1% (w/v) low-melting temperature agarose (Hydragene 1422032833) preheated at 42°C. The mixture was then spread onto a microscope slide that had been precoated with 1% (w/v) normal-melting point agarose (Hydragene 15220218). The slides were placed on ice for 5 min for the agar to solidify. After the coverslip was removed, the slide was immersed in a high-alkali solution (0.3 M NaOH and 5 mM EDTA, pH > 13) for 10 min at room temperature in the dark, followed by rinsing in 1× TBE buffer (90 mM Tris–borate and 2 mM EDTA, pH = 8.4) 3 times (5 min per rinse) on ice. For the A/N procedure, the slide was submerged in a fresh neutral electrophoresis buffer (1× TBE) and then subjected to electrophoresis for 4 min at 31 V (1 V/cm), 15–17 mA. After electrophoresis, the slide was kept for 10 min in 1% (w/v) Triton prior to dehydration for 2 × 5 min in 70% and 96% ethanol and air drying. The dry agarose gel was stained with 15 µL ethidium bromide (10 µg/mL dissolved in water) and then covered with a cover glass for 10 min in the dark. After being washed 3 times with ddH2O, the slide was examined with an Olympus BX61 fluorescence compound microscope and images were captured at a 20-fold magnification using a rhodamine filter. For quantification, the image was analyzed using CASP, a free semiautomatic app (http://www.casp.of.pl) (Konca et al. 2003), and parameters as described by Garcia et al. (2007) and Gonzalez et al. (2012). The average percent of DNA in the tail (>10%) was used as the primary measure of DNA damage in the experiments. At least 3 slides were evaluated in each treatment, and 3 biological replicates were performed. Statistical significances of differences were calculated using Tukey's test.
Accession numbers
Sequence data from this article can be found in the GenBank/EMBL data libraries under accession numbers AT3G54220 (SCR), AT1G56260 (TEN1), AT1G56260 (STN1), AT4G09680 (CTC1), and AT5G16850 (TERT).
Acknowledgments
The authors are thankful to Jen Kennedy (Florida State University) for editing the manuscript.
Author contributions
B.W., X.S., J.G., and R.L. performed the experiments; J.F. and J.B. provided technical assistance; H.C. conceived and supervised the project and wrote the article with contribution of B.W. and X.S.
Supplemental data
The following materials are available in the online version of this article.
Supplemental Figure S1. Mutant 74 shows abnormal shoot phenotypes.
Supplemental Figure S2. SSLP-assisted mapping located the causal mutation near the NGA128 marker on chromosome one.
Supplemental Figure S3. AT1G56260 is the gene with the causal mutation in mutant 74.
Supplemental Figure S4. TEN1 is not a substrate for the proteasome-mediated degradation pathway.
Supplemental Figure S5. TEN1, CTC1, STN1, and telomerase are downregulated in the scr-3 mutant.
Supplemental Figure S6. The scr-3 mutant is hypersensitive to zeocin, a DNA damage reagent.
Supplemental Table S1. Candidate genes in mutant 74 as determined by genome sequencing.
Supplemental Table S2. Eukaryotic species used in the multisequence alignment of TEN1 homologs.
Supplemental Table S3. Primers used in this study.
Funding
This research is supported by the National Science Foundation of China (grant no. 31871493), Florida State University, and Northwest Agriculture and Forest University. The authors confirm that the data supporting the findings of this study are available within its supplementary materials.
References
Author notes
These authors contributed equally.
Present address: State Key Laboratory of Plant Genomics and Center for Plant Gene Research, Institute of Genetics and Developmental Biology, Chinese Academy of Sciences, Beijing 100101, China
The author responsible for distribution of materials integral to the findings presented in this article in accordance with the policy described in the Instructions for Authors (https://dbpia.nl.go.kr/plphys/pages/General-Instructions) is Hongchang Cui.
Conflict of interest statement. The authors declare no conflict of interest.
