


Abstract
Rapeseed (Brassica napus), an important oil crop worldwide, provides large amounts of lipids for human requirements. Calcineurin B-like (CBL)-interacting protein kinase 9 (CIPK9) was reported to regulate seed oil content in the plant. Here, we generated gene-silenced lines through RNA interference biotechnology and loss-of-function mutant bnacipk9 using CRISPR/Cas9 to further study BnaCIPK9 functions in the seed oil metabolism of rapeseeds. We discovered that compared with wild-type (WT) lines, gene-silenced and bnacipk9 lines had substantially different oil contents and fatty acid compositions: seed oil content was improved by 3%–5% and 1%–6% in bnacipk9 lines and gene-silenced lines, respectively; both lines were with increased levels of monounsaturated fatty acids and decreased levels of polyunsaturated fatty acids. Additionally, hormone and glucose content analyses revealed that compared with WT lines the bnacipk9 lines showed significant differences: in bnacipk9 seeds, indoleacetic acid and abscisic acid (ABA) levels were higher; glucose and sucrose contents were higher with a higher hexose-to-sucrose ratio in bnacipk9 mid-to-late maturation development seeds. Furthermore, the bnacipk9 was less sensitive to glucose and ABA than the WT according to stomatal aperture regulation assays and the expression levels of genes involved in glucose and ABA regulating pathways in rapeseeds. Notably, in Arabidopsis (Arabidopsis thaliana), exogenous ABA and glucose imposed on developing seeds revealed the effects of ABA and glucose signaling on seed oil accumulation. Altogether, our results strongly suggest a role of CIPK9 in mediating the interaction between glucose flux and ABA hormone signaling to regulate seed oil metabolism in rapeseed.
Introduction
About 87% of plant lipids was supplied for lipid consumption per year, which greatly contributed to the food, biofuel, and chemical industries worldwide (Mielke, 2019). Rapeseed (Brassica napus; AACC, 2n = 38) is a major oilseed crop, providing approximately 16% of edible oils globally (Woodfield et al., 2017). The level of triacylglycerols (TAG) in the harvested seed is generally in the range of 45%–50% (w/w), which is primarily found in the cotyledon cell cytoplasm. The accumulation of large amounts of oil increased rapeseed's economic value. Rapeseed was one of the earliest and most rapidly adopted biotechnologically modified crops (Beszterda and Nogala-Kałucka, 2019). Crop domestication is a millennial activity that modifies crop species to meet human needs. Many traits have been modified in crops through traditional plant breeding techniques. In recent years, CRISPR/Cas9 genome-editing biotechnology, a highly effective tool, has been employed in crops to improve various traits, such as disease and pest resistance, yield increases, and high oil production. Several genetic engineering efforts have been devoted to improve oil production in rapeseeds. Various extensive reviews have been performed on the modification of Brassica oil using either conventional breeding or transgenic approaches (Hannoufa et al., 2014).
Calcineurin B-like (CBL)-interacting protein kinases (CIPKs) family is known for their function in maintaining cellular homeostasis under abiotic and biotic stresses, such as cold, drought, flood, and diseases, including bacterial speck disease in tomato (Solanum lycopersicum) and the stripe rust fungus in wheat (Triticum aestivum; Kim et al., 2003; de la Torre et al., 2013; Zhou et al., 2014; Liu et al., 2018b). The key to CIPKs’ versatile roles was the large numbers of CIPK proteins in plants, which are involved in several physiological pathways. They control intracellular ion or nutrition homeostasis by modulating ion channels and transporters such as K+ TRANSPORTER 1 (AKT1), SLOW ANION CHANNEL-ASSOCIATED 1 (SLAC1), and NITRATE TRANSPORTER 1 (NRT1.1/CHL1; Xu et al., 2006; Hu et al., 2009; Maierhofer et al., 2014). They participate in programmed cell death against pathogenic infection by regulating the reactive oxygen species (ROS) signaling systems (de la Torre et al., 2013). They are also involved in many other signaling processes, such as glucose and ABA, in plant growth and development (Chen et al., 2012; Deng et al., 2020). Oil content regulation had been reported in rapeseed and cotton (Gossypium hirsutum; Guo et al., 2018; Cui et al., 2020), however, the knowledge about its molecular bases remains obscure. Therefore, oil synthesis and accumulation mechanisms should be conducted, particularly in the context of further improvements in lipid content.
It had been discovered that the Push–Pull–Package–Protect strategy can control the total flux of carbon into lipids (Thomas et al., 2019): Push, to enhance the source of carbon flux activating the de novo synthesis of fatty acids (FAs); Pull, to enhance gene expressions involved in assembling TAG; Package, to promote TAG storage into the oil body; and Protect, to suppress genes involved in oil degradation. Carbons from central metabolism are never entirely devoted to oil production, not even in oilseeds. If the carbon flux to oil synthesis from central metabolism can be strengthened, oil accumulation will be enhanced based on the above-mentioned “PUSH” strategy. Sucrose, a major assimilated carbon from photosynthesis, is transported into sinks providing energy and processed materials for seed development. The import and cleavage of sucrose play roles in determining the strength of sinks and triggering the seed storage (Ruan, 2014). Hexose phosphate generated by the cleavage of sucrose can enter the glycolysis or oxidative pentose phosphate pathway, which generates many intermediates and energy for de novo FA and TAG syntheses.
Glucose as a signal molecule not only plays a role in carbon metabolism but also serves as an energy sensor transducing energy signaling. Studies on glucose signaling have progressed in broad aspects of plant biology, including source–sink communication (Rossi et al., 2015), glucose–hormone interactions (Gibson et al., 2011), glucose regulation of plant development (Song et al., 2015), and glucose and stress (Miller and Chourey, 1992). Source–sink communication is involved in source–sink nutrient allocation to influence crop productivity, which has been reported to regulate glucose and hormone signaling. Several studies have been reported that glucose–ABA interaction has a vital role in promoting storage reserve accumulation (Ooms et al., 1993; Rook et al., 2001; Finkelstein et al., 2002). Although several studies have evaluated in Arabidopsis, relatively little is known regarding the interconnections between ABA and glucose signal transduction pathways in crop species. Most studies on ABA and glucose signaling interconnections concerned seedling and seed early germination in Arabidopsis; however, little is known about seed development, especially the oil synthesis and accumulation.
This study combined transcription and translation level investigations, discovering the roles of BnaCIPK9 in oil metabolism. Both gene-silenced and loss-of-function mutant bnacipk9 lines display significantly increased seed oil content. Moreover, FA composition was substantially changed with notably increased levels of monounsaturated FAs and decreased levels of polyunsaturated FAs in both lines, which contributed to the high oil breeding and provided the basis to further elucidate the regulation mechanism. This study provided insights into the underlying function involving glucose–ABA signaling during seed oil metabolism. A reduced sensibility to ABA and glucose helps explain the enhanced thresholds of glucose and ABA in homozygous mutant seeds, combined with increased glucose levels in seed tissues, thereby establishing links between storage product accumulation, including oils, and glucose–hormone signaling. Although the roles of CIPKs had been demonstrated during the process of balancing cell homeostasis under abiotic and biotic stresses, this does not appear to implicate the high glucose response, which firstly displayed the CIPK response to high glucose by enhancing storage accumulation and increased seed oil content in rapeseeds.
Results
Homolog characterization of BnaCIPK9 and generation of gene-silenced and loss-of-function mutant lines in rapeseed
Based on data available from Westar, ZS11, and Damor genome sequences published online, our BLAST results of the AtCIPK9 coding sequence (CDS) revealed four copies of BnaCIPK9 in rapeseed: two on chromosome A9 and the other two on chromosomes A10 and C05, which are named as BnaA9.CIPK9.1, BnaA9.CIPK9.2, BnaA10.CIPK9, and BnaC05.CIPK9, respectively. Three alternative splicing events were observed in Arabidopsis in this study: AtCIPK9-1, AtCIPK9-2, and AtCIPK9-3. Results of TA clones of CDSs in Westar showed that these homolog sequences were highly consistent with those published in the Westar genome database (http://cbi.hzau.edu.cn/cgi-bin//bnapus/gb2/gbrowse/westarv0/; Figure 1A). The homologs shared 95% amino acid identity with rapeseed and 98% with Arabidopsis. Sequences with high conservation suggest functional redundancy among them.
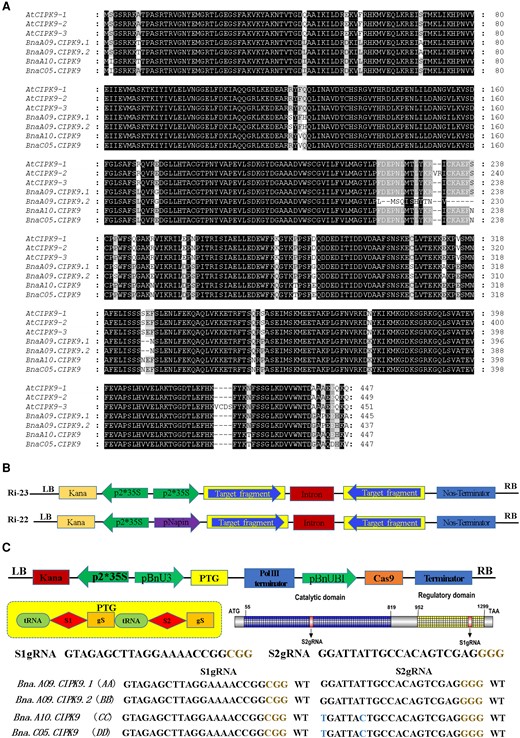
CIPK9 homolog sequences and vector schematic illustrations of RNAi and CRISPR/Cas9 system. A, Alignment of the full amino acid sequence in CIPK9 homologs in Arabidopsis and rapeseed. Conserved residues are marked in black boxes, and similar residues are marked in gray boxes. The alignment is generated using the DNAMAN software. B, Schematic illustration of the RNA interference binary vectors. Ri-22 with Napin promoter; Ri-23 with 35S promoter. C, Characterization of BnaCIPK9 gene editing using the CRISPR/Cas9 system in rapeseed. S1gRNA and S2gRNA target the BnaCIPK9 catalytic and regulatory domains, respectively. Blue-colored nucleotides indicate the SNP in BnaA10.CIPK9 and BnaC05.CIPK9 S2gRNA targets. Brown-colored nucleotides indicate the protospacer adjacent motif.
To examine the role of CIPK9 in oil content regulation, transgenic lines were produced. The spring cultivar Westar was used as the transgenic recipient. To disrupt gene expression at the RNA level, transgenic plants with constitutive promoter 35S and seed-specific promoter Napin were constructed with an interference expression of BnaCIPK9 (RNAi lines) by RNA interference (RNAi) biotechnology (Figure 1B and Supplemental Figure 1A). To intervene at the protein level, loss-of-function mutant bnacipk9 lines were created using CRISPR/Cas9 to assess the mechanism of regulating lipid metabolism and the potential application to agricultural production. The CRISPR/Cas9 system was constructed according to Xie et al (2015). Two target sgRNAs were designed using the tool from CRISPR-P (http://crispr.hzau.edu.cn/CRISPR2/; Figure 1C and Supplemental Figure 1B).
The T0-positive-transgenic plants were sequenced through Sanger DNA sequencing to verify their edited status. The results show that the insertion of a single nucleotide was predominant, among which A/T nucleotide insertion was the primary occurrence. Moreover, the frequency of substitution mutation and deletion mutation was low, of which the substitution mutation between A and T was more than that between C and G (Table 1). The analyses of the gene-editing event in T0 generation plants indicated that BnaA9.CIPK9.1 and BnaA9.CIPK9.2 were edited but the BnaA10.CIPK9 and BnaC05.CIPK9 were not, suggesting that S2gRNA was not capable of targeting mismatched nucleotide sequences. Moreover, the higher edit frequency on BnaA9.CIPK9.1 and BnaA9.CIPK9.2 by S2gRNA implied that the activity of SgRNA2 was higher than that of S1gRNA. Furthermore, the frequency of chimeric and heterogeneous mutations was greater than that of biallelic and homologous mutations (Table 2).
The editing formats and frequencies of the two SgRNAs in rapeseed T0 plants
| Genotype | Editing format | |||
|---|---|---|---|---|
| Insertion | Mutation | Chimera | Deletion | |
| Sg1-AABB | 7A 3C 2T 1G | 2A-T 1C-G | 2I 1M 6Vm | >3 bp 1 |
| Sg2-AABB | 9A 3C 4T 1G | 4A-T 3C-G | 3I 3M 6Vm | ≤3 bp 1; >3 bp 1 |
| Sg1-CC | 8A 4C 4T 3G | 2A-T 1C-G | 3I 3T 7Vm | ≤3 bp 1; >3 bp 1 |
| Sg2-DD | 6A 3C 4T 1G | 2A-T 2C-G | 2I 2M 6Vm | ≤3 bp 1; >3 bp 1 |
Vm, multiple mutation; I, SNP insertion; M, SNP mutation. AA, BB, CC, and DD indicate the four BnaCIPK9 alleles.
The editing genotypes and frequencies among alleles of the two SgRNAs in rapeseed T0 plants
| Gene type | Sg1RNA | Sg2RNA | ||||||
|---|---|---|---|---|---|---|---|---|
| Chimera | Heter | Homo | Biallelic | Chimera | Heter | Homo | Biallelic | |
| AA | 9 | 16 | 3 | 2 | 12 | 21 | 5 | 4 |
| BB | 8 | 12 | 2 | 1 | 10 | 19 | 4 | 5 |
| CC | 10 | 5 | 4 | 1 | 0 | 0 | 0 | 0 |
| DD | 13 | 20 | 3 | 5 | 0 | 0 | 0 | 0 |
Heter, heterozygous mutant; Homo, homozygous mutant. AA, BB, CC, and DD indicate the four BnaCIPK9 alleles.
The off-target site was detected, suggesting that the off-target phenomenon was not found in the T0 generation (Supplemental Table 1). Considering that not all BnaCIPK9 homologs were completely edited, the T0-generation edited plants were chosen to conduct generation propagation to generate a homozygous mutant. Homozygous lines were obtained in the T2 generation. Moreover, Cas9 was tested in homozygous mutant lines, of which Cas9-free lines in T2 and T3 generations were used as genetic lines to conduct this study. The gene-editing status of offspring was tracked by Hi-Tom technology and verified by TA clone sequencing (Supplemental Figure 2). And the edit status in Cas9-free lines was found to be stable in T2 and T3 generations.
Alteration of oil content and FA compositions in seeds from gene-silenced and loss-of-function mutant lines
RNAi lines from T1 and T2 generations were examined for BnaCIPK9 expression levels. No regularity of gene silencing was observed between two promoter-type RNAi-transgene plants in multiple generations; however, all of them showed different levels of silenced BnaCIPK9 expression. Furthermore, in both of these RNAi-transgene plants, the level of BnaCIPK9 silencing expression showed attenuation in subsequent generations (Figure 2A). The RNAi lines with silenced BnaCIPK9 expression and loss-of-function mutant bnacipk9 lines (all with the frame-shift mutations) were selected for seed oil content assessment and FA composition analyses. The oil content spread different ranges in multiple generations; however, similar ranges were observed in both RNAi and bnacipk9 lines. The environment is known to have important effects on oil content. Thus, plants from multiple generations were grown under different conditions, including various soil, water, and light conditions, which made the oil content different among generations. The average data eliminating the extremum values from each independent line were used to determine changes in oil content. In RNAi lines, oil content from multiple independent lines was increased compared with that in the wild-type (WT) lines, ranging from 1.03% to 5.47% and 1.60% to 6.81% in T1 and T2 generations, respectively (Figure 2B). Moreover, in the bnacipk9 lines, the oil content from four selected independent lines was increased compared with that in the WT lines, ranging from 3.64% to 5.53% and 3.10% to 4.86% in T2 and T3 generations, respectively (Figure 2C).
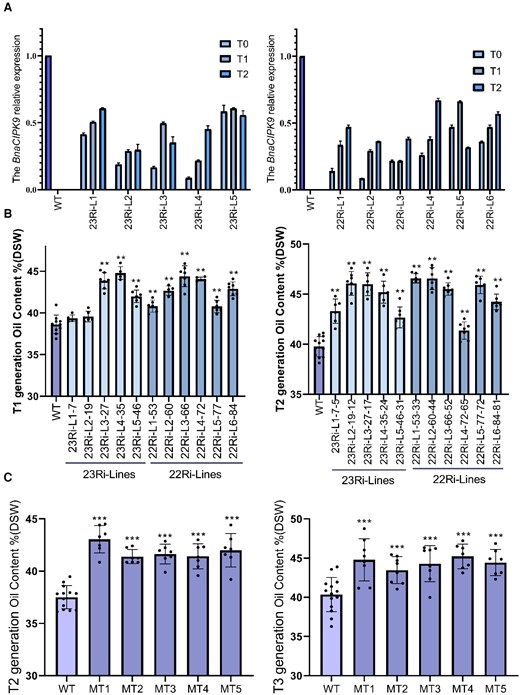
Seed oil content in gene-silenced and loss-of-function mutant lines. A, Relative expression of BnaCIPK9 in developing seeds from T0 to T2 generations. The independent transgenic plant lines with Napin and 35S promoters, respectively. Each independent line included 3–4 inbred lines as biological repeats, and each inbred line had three technical repeats. Error bars indicate standard deviation (n = 9–12). B, Seed oil content in RNAi line mature seeds. Both the T1 and T2 generations were grown under field conditions. C, Seed oil content in bnacipk9 lines. The T2 and T3 generations were grown under growth chamber and field conditions, respectively. B and C, Each independent line included 5–7 inbred lines as the biological repeats. Error bars indicate the standard deviation (n = 5–7). The seed oil content was measured using the NIRS. DSW, dry seed weight. Each dot denotes one plant of the mixed inbred lines within each independent line. Single, double, and triple asterisks indicate significant differences between the transgenic and WT plants with P values of 0.05, 0.01, and <0.001, respectively, as determined using the analysis of variance by the least-significant difference test.
FA composition analysis showed that the monounsaturated fatty acid (MUFA; 18:1) level was significantly increased and the polyunsaturated fatty acid (PUFA; 18:2 or 18:3) level was significantly decreased in both RNAi lines and bnacipk9 seeds compared with that in WT seeds. In RNAi-transgene lines, the oleic acid (18:1) level was increased by 3%–7%, whereas the linolenic acid (18:2) level was decreased by 2%–3%. No significant differences were detected in the levels of other FAs. In the bnacipk9 lines, other than the increased oleic acid (18:1) and decreased linoleic acid (18:2) by 2%–3% and 1%–2%, respectively, the linolenic acid (18:3) level was also dramatically decreased by 2%–3% when compared with that in WT plants (Table 3). It is noteworthy that reducing PUFA levels (especially linolenic acid, 18:3) with increasing MUFA levels (oleic acid, 18:1) makes the oil more edible with higher stability. Proteins were the second-largest storage substance in oil crop seeds and the total amount of which showed no obvious significant difference other than one or two lines with some reduction (Table 3).
FA compositions and protein content in mature seeds of gene-silenced and loss-of-function mutant lines
| Materials | Protein content (%) | C16:0 (%) | C18:0 (%) | C18:1 (%) | C18:2 (%) | C18:3 (%) | C20:1 (%) | |
|---|---|---|---|---|---|---|---|---|
| T1 | WT | 23.92 ± 1.46 | 4.86 ± 0.15 | 2.60 ± 0.50 | 57.81 ± 1.65 | 17.84 ± 1.07 | 8.41 ± 0.77 | 2.71 ± 0.59 |
| 23Ri-L1-7 | 23.25 ± 0.62 | 4.85 ± 0.11 | 2.31 ± 0.13 | 61.94 ± 0.43** | 17.14 ± 0.22 | 8.86 ± 0.94 | 2.90 ± 0.14 | |
| 23Ri-L2-19 | 22.71 ± 0.29 | 4.54 ± 0.10** | 2.14 ± 0.11 | 67.85 ± 0.40** | 14.69 ± 0.09** | 8.09 ± 0.58 | 2.03 ± 0.75 | |
| 23Ri-L3-27 | 24.62 ± 0.48 | 4.54 ± 0.10** | 2.17 ± 0.14 | 67.09 ± 1.31** | 15.13 ± 0.21** | 7.91 ± 0.42 | 2.26 ± 1.02 | |
| 23Ri-L4-35 | 22.97 ± 0.24 | 4.76 ± 0.11 | 2.22 ± 0.06 | 62.45 ± 0.52** | 16.82 ± 0.65 | 8.59 ± 0.46 | 2.24 ± 0.80 | |
| 23Ri-L5-46 | 22.92 ± 0.41 | 4.67 ± 0.13 | 2.43 ± 0.20 | 62.16 ± 0.63** | 17.47 ± 0.59 | 8.45 ± 0.23 | 3.17 ± 0.48 | |
| 22Ri-L1-53 | 23.14 ± 0.43 | 4.67 ± 0.09 | 2.39 ± 0.15 | 62.11 ± 0.88** | 16.95 ± 0.33 | 8.37 ± 0.44 | 2.66 ± 0.39 | |
| 22Ri-L2-60 | 22.48 ± 0.80 | 4.56 ± 0.22 | 2.24 ± 0.11 | 67.99 ± 1.20** | 14.39 ± 1.06** | 8.01 ± 0.56 | 2.23 ± 1.15 | |
| 22Ri-L3-66 | 20.49 ± 0.93* | 4.51 ± 0.22 | 2.08 ± 0.13 | 67.47 ± 1.40** | 15.00 ± 0.41** | 8.48 ± 0.68 | 2.11 ± 1.36 | |
| 22Ri-L4-72 | 22.71 ± 0.39 | 4.67 ± 0.12 | 2.23 ± 0.17 | 64.01 ± 1.14** | 14.21 ± 0.64** | 7.92 ± 0.82 | 2.41 ± 0.73 | |
| 22Ri-L5-77 | 22.22 ± 0.46 | 4.67 ± 0.09 | 2.37 ± 0.14 | 65.39 ± 0.71** | 14.35 ± 0.61** | 8.52 ± 0.51 | 2.98 ± 1.25 | |
| 22Ri-L6-84 | 21.80 ± 0.94 | 4.78 ± 0.15 | 2.30 ± 0.19 | 64.24 ± 0.43** | 14.68 ± 0.71** | 8.29 ± 0.14 | 2.67 ± 1.12 | |
| T2 | WT | 22.98 ± 0.44 | 4.85 ± 0.22 | 2.16 ± 0.08 | 61.60 ± 0.58 | 17.27 ± 0.46 | 8.42 ± 0.46 | 2.36 ± 0.99 |
| 23Ri-L1-7-5 | 21.97 ± 1.26 | 4.60 ± 0.19 | 2.30 ± 0.22 | 68.91 ± 0.71** | 14.54 ± 1.07** | 7.94 ± 1.07 | 2.45 ± 0.56 | |
| 23Ri-L2-19-12 | 21.18 ± 0.72 | 4.47 ± 0.07 | 2.20 ± 0.10 | 69.69 ± 0.57** | 13.76 ± 0.43** | 8.36 ± 0.43 | 2.23 ± 0.23 | |
| 23Ri-L3-27-17 | 22.74 ± 0.59 | 4.46 ± 0.10 | 2.32 ± 0.14 | 66.62 ± 0.70** | 14.6 ± 0.83** | 8.04 ± 0.83 | 3.35 ± 0.40 | |
| 23Ri-L4-35-24 | 22.03 ± 1.29 | 4.48 ± 0.14 | 2.12 ± 0.13 | 69.12 ± 0.75** | 13.85 ± 0.75** | 8.47 ± 0.75 | 1.81 ± 0.32 | |
| 23Ri-L5-46-31 | 21.61 ± 0.89 | 4.65 ± 0.17 | 2.33 ± 0.25 | 66.31 ± 1.24** | 15.23 ± 0.38** | 8.35 ± 0.38 | 2.24 ± 0.14 | |
| 22Ri-L1-53-33 | 21.59 ± 0.97 | 4.54 ± 0.09** | 2.30 ± 0.02 | 66.77 ± 0.48** | 14.12 ± 0.51** | 8.18 ± 0.51 | 3.62 ± 0.27 | |
| 22Ri-L2-60-44 | 21.29 ± 0.51 | 4.56 ± 0.07 | 2.29 ± 0.03** | 66.86 ± 0.57** | 13.92 ± 1.16 | 8.12 ± 1.16 | 3.42 ± 0.29 | |
| 22Ri-L3-66-52 | 20.54 ± 0.49* | 4.39 ± 0.04** | 2.27 ± 0.14 | 64.82 ± 0.81** | 14.62 ± 0.91** | 8.31 ± 0.91 | 3.45 ± 0.50 | |
| 22Ri-L4-72-65 | 22.22 ± 0.58 | 4.56 ± 0.04 | 2.48 ± 0.22 | 65.23 ± 1.93** | 13.43 ± 0.64** | 8.24 ± 0.64 | 3.05 ± 0.14 | |
| 22Ri-L5-77-72 | 21.38 ± 0.76 | 4.51 ± 0.12 | 2.25 ± 0.15 | 66.29 ± 0.81** | 13.95 ± 0.86** | 8.39 ± 0.86 | 2.63 ± 0.43 | |
| 22Ri-L6-84-81 | 22.68 ± 0.83 | 4.53 ± 0.16 | 2.32 ± 0.16 | 65.27 ± 0.64** | 14.66 ± 1.02** | 8.43 ± 1.02 | 3.38 ± 0.52 | |
| T2 | WT | 26.62 ± 1.09 | 3.96 ± 0.09 | 1.82 ± 0.04 | 55.83 ± 0.81 | 19.37 ± 0.63 | 9.89 ± 0.17 | 1.16 ± 0.24 |
| MT1 | 25.45 ± 0.95 | 3.18 ± 0.12 | 1.83 ± 0.1 | 58.3 ± 0.45** | 16.79 ± 0.61** | 8.06 ± 0.41* | 1.49 ± 0.38 | |
| MT2 | 25.14 ± 1.20 | 3.55 ± 0.17 | 1.96 ± 0.03 | 59.17 ± 1.2** | 15.67 ± 0.18** | 7.91 ± 0.24** | 1.31 ± 0.08 | |
| MT3 | 26.15 ± 0.70 | 3.66 ± 0.04 | 1.78 ± 0.09 | 56.75 ± 1.24** | 18.76 ± 0.37 | 7.83 ± 0.52** | 1.1 ± 0.02 | |
| MT4 | 25.84 ± 1.23 | 3.49 ± 0.04 | 1.8 ± 0.09 | 58.96 ± 0.98** | 18.22 ± 0.6** | 6.99 ± 0.21* | 1.12 ± 0.05 | |
| MT5 | 24.12 ± 0.33* | 3.45 ± 0.06 | 1.47 ± 0.15 | 56.58 ± 0.46* | 17.6 ± 0.45** | 8.09 ± 0.42* | 1.64 ± 0.14 | |
| MT6 | 26.33 ± 0.94 | 3.36 ± 0.05 | 1.27 ± 0.11 | 58.22 ± 1.34** | 16.98 ± 0.19** | 8.22 ± 0.16* | 1.61 ± 0.05 | |
| T3 | WT | 25.4 ± 1.12 | 3.59 ± 0.12 | 1.8 ± 0.07 | 57.87 ± 0.52 | 18.1 ± 0.16 | 8.91 ± 0.24 | 1.84 ± 0.17 |
| MT1 | 24.52 ± 0.98 | 3.62 ± 0.38 | 1.57 ± 0.31 | 60.1 ± 0.35* | 17.24 ± 0.23 | 7.48 ± 0.23* | 1.57 ± 0.32 | |
| MT2 | 24.17 ± 0.06 | 3.73 ± 0.33 | 1.34 ± 0.11 | 60.54 ± 0.22* | 17.2 ± 0.21* | 6.23 ± 0.43* | 1.94 ± 0.2 | |
| MT3 | 22.44 ± 0.56** | 3.87 ± 0.49 | 1.57 ± 0.01 | 62.28 ± 0.32** | 16.48 ± 0.15** | 6.1 ± 0.3** | 2.06 ± 0.27 | |
| MT4 | 24.98 ± 1.23 | 3.53 ± 0.28 | 1.66 ± 0.36 | 62.2 ± 0.3** | 16.32 ± 0.12** | 6.48 ± 0.34* | 1.74 ± 0.34 | |
| MT5 | 25.07 ± 0.78 | 3.29 ± 0.19 | 1.47 ± 0.25 | 60.7 ± 0.35* | 15.81 ± 0.51* | 5.99 ± 0.48** | 1.88 ± 0.18 | |
| MT6 | 25.17 ± 0.49 | 3.82 ± 0.12 | 1.76 ± 0.33 | 61.75 ± 0.24* | 17.79 ± 0.14 | 6.47 ± 0.28* | 1.55 ± 0.24 |
23Ri and 22Ri, gene-silenced lines (RNAi lines); MT, the independent lines of Cas9-free loss-of-function mutants lines (bnacipk9 lines); WT, wild-type plant lines (Westar). Six independent lines were separately selected from the RNAi and bnacipk9 lines. The FA composition and protein content were measured using gas chromatography and the NIRS-System, respectively. Data are represented as the means ± SE corresponding to 5–7 inbred lines in each independent line. Asterisks denote significant differences (* P = 0.05 and ** P = 0.01) between the RNAi or bnacipk9 lines and WT plants based on the analysis of variance by the least-significant difference test.
The bnacipk9 mutant displays no apparent performance penalty under NaCl, cold, and drought stresses
CIPK9, as a member of CIPKs, had been reported to play important roles in responding to ions, such as K+ and Mg2+, oxidative stress, and drought (Pandey et al., 2007; Tang et al., 2015; Song et al., 2018; Kanwar et al., 2022). To investigate the performance of homozygous mutants under abiotic stress, NaCl, cold, and drought treatments were imposed during the seedling stage (20 days after sowing). Chlorophyll, H2O2, and malondialdehyde (MDA) played vital roles in abiotic and biotic stress response, which can serve as indices to diagnose the degree of injuries in plant cells (Janero, 1990; Liu et al., 2018a; Yuan et al., 2018).
Plants were placed at 4°C for 7 days followed by 4 days at 0°C as cold treatment. After placing under 4°C for 7 days, plant morphology showed no obvious difference between WT and the bnacipk9 mutant lines. When the temperature was turned down to 0°C for another 4 days, the mutant plants underwent albefaction (Figure 3A). The chlorophyll content was lower in bnacipk9 mutants with the MDA and H2O2 content significantly increased (Supplemental Figure 3A). Drought treatment was conducted in 3-week-old plants, which were irrigated with an equal amount of water (0.5 L) directly on each pot to promote growth during their development. The water supplement was stopped in those 3-week-old plants until the plants exhibited hydropenia symptoms. And it was after 10 days, bnacipk9 mutant plants showed improved drought tolerance in all four independent mutant lines (Figure 3B). After drought stress treatment, compared with WT lines the H2O2 and MDA content decreased and the chlorophyll content increased significantly in bnacipk9 lines (Supplemental Figure 3B). Salinity treatment was conducted with NaCl at 13.5 g L−1. Two liters of NaCl treatment was added every second day. After five consecutive treatments, a substantial difference appeared between the WT and the bnacipk9 lines. Leaves showed signs of senescence in bnacipk9 lines and plants in “M4” mutant lines showed curl leaves (Figure 3C). Under NaCl treatment, chlorophyll content was significantly decreased, whereas the MDA and H2O2 contents were markedly increased in bnacipk9 lines when compared with WT plants (Supplemental Figure 3C). The visible phenotype, MDA, chlorophyll, and H2O2 contents strongly suggest that the bnacipk9 mutant plants possessed increased drought tolerance but were more sensitive to NaCl and cold.
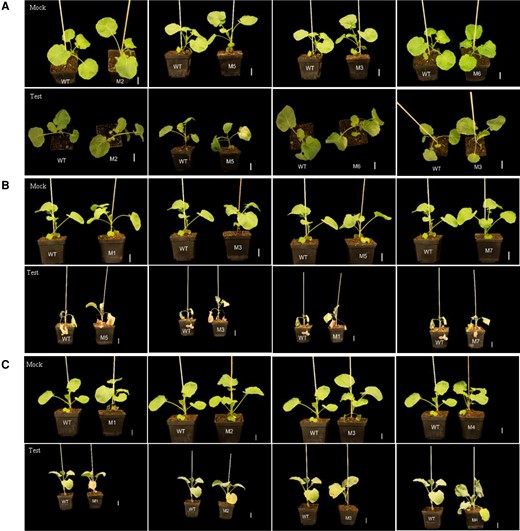
WT and mutant plant performance under abiotic stress. A, Cold, B, drought, and C, NaCl treatments. M1–M7, independent bnacipk9 lines. Five of seven independent bnacipk9 lines were randomly selected to perform each abiotic stress treatment. Mock, 3-week-old plants before the treatment; Test, plants upon the completed corresponding treatments. In every group of “Mock” or “Test” only one WT line was selected from the WT lines with even growth and developmental conditions. Scale bar, 3 cm.
Source and sink organ strength is associated with hormone changes in the bnacipk9 plants
Visual examination of plant growth and development showed that various organ sizes were obviously different between WT and the bnacipk9 mutant plants. Moreover, bnacipk9 mutant leaves displayed a delayed senescence and higher numbers of leaves (Supplemental Figure 4). Siliques of the bnacipk9 lines at both 15 days after florescence (DAF) and 35 DAF were longer than that of the WT plants (Figure 4, A and B). The size of the leaves was larger in bnacipk9 mutants as well (Figure 4C). To examine seed development, silique walls were peeled, and the siliques of multiple lines at 15 DAF and 35 DAF were inspected. No obvious morphological differences in developing seeds were found between the bnacipk9 mutant lines and WT lines, including the numbers, sizes, and developments (Figure 4, A and B).
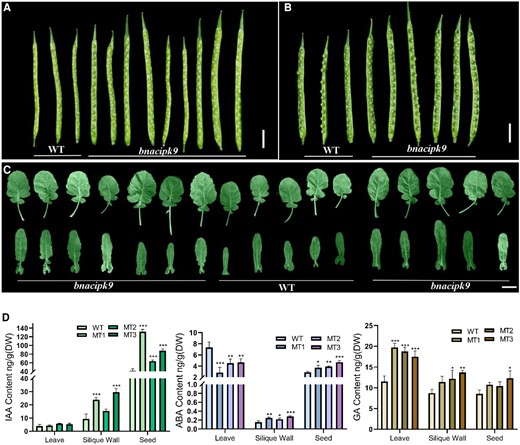
Source organ morphology and hormonal levels in plants. A, Siliques from 15 DAF; B, siliques from 35 DAF; and C, leaves from plants (45 days after sowing), and the siliques were peeled to observe the seeds’ morphology. Scale bar, 3 cm. D, The hormonal level from different tissues. WT, wild-type line; MT, bnacipk9 lines; DW, dry weight. Three independent bnacipk9 lines were selected for this experiment. The error bars indicate the standard deviation (n = 3). Single, double, and triple asterisks indicate significant differences between transgenic and WT plants with P values of 0.05, 0.01, and <0.001, respectively, as determined using the analysis of variance by the least-significant difference test.
It was reported that hormonal and carbon metabolisms played roles in regulating organ size and plant growth (Weselake et al., 2009; Hussain et al., 2020). Indoleacetic acid (IAA), ABA, and gibberellic acid (GA) were reported to have vital effects on organ size. ABA affects plant growth at the late phase of plant development. The seeds and other sink tissues were studied to quantify the IAA, GA, and ABA levels. In source tissue, there was no difference in IAA level in leaves, whereas the silique wall showed a significant difference in both of the two independent lines (Figure 4D). GA concentration was significantly different in both leaves and silique walls as well (Figure 4D). Moreover, the concentration of ABA was markedly decreased in leaves but significantly increased in the silique wall (Figure 4D). The lower ABA content in leaves could be related to the senescence delay. Results in seeds (35 DAF) showed that both IAA and ABA concentrations were higher with the GA increased slightly (Figure 4D). Despite that no morphology difference was obvious in seeds (35 DAF), the significant changes in the hormone level signified that the physiological condition was likely changed in the mutant seeds. During seed development, ABA is known to exert a regulatory effect during the mid-to-late stages of embryo maturation. ABA has also been reportedly implicated in other physiological pathways that are associated with storage and oil deposition in seeds (Nakajima et al., 2012; Ma and Wang, 2016).
Our results thus suggested that in bnacipk9 mutant plants IAA and GA played important roles in promoting organ sizes with a varying degree of effects in different tissues. Moreover, ABA played pleiotropic effects, i.e. decreasing content in leaves and increasing storage content in seeds, thereby permitting longer cycles of growth and improving the seed-filling.
Sugar metabolism is changed differently in source tissues and developing seeds
Glucose played important role in carbon supply to meet plant requirements for the source and sink organ development and storage product deposition (Ohto et al., 2005; Zhai et al., 2017). To determine whether sugar metabolism was altered in the mutant plants, we extracted and quantified sugars content in leaves, silique walls, and seeds. Focusing on active oil accumulation phases, 25 DAF and 35 DAF seeds were chosen, which are vital stages of oil accumulation. Hexose was the product of sucrose breakdown, which could strengthen and support the sizes of sinks, such as that of developing seeds and fruits (Ruan, 2014).
In this study, glucose and fructose showed diverse differences. Glucose was significantly increased in seeds (25 DAF and 35 DAF) but decreased in source organs (leave and silique wall) in bnacipk9 lines compared with that in the WT lines (Figure 5, A and D), Fructose, on the other hand, showed no significant differences among WT and bnacipk9 lines within the tissues tested but its content in 25 DAF seeds was significantly increased in bnacipk9 lines (Figure 5, B and D). Sucrose, considered as a biochemical marker for sink strength, played a key role in sink development in crops (Ruan, 2014). Sucrose was significantly increased in bnacipk9 lines in all tissues examined. Moreover, sucrose in seeds and leaves was higher than that in the silique wall (Figure 5, C and D). A series of studies had suggested that the relative accumulation of hexose and sucrose played roles in seed mass and size during seed development (Weber et al., 1997). Sucrose and glucose metabolism had been reported to have a close relationship with a source and sink tissue development (Gilbert et al., 2012). In this study, the ratio of hexose/sucrose displayed significant differences between WT and the bnacipk9 lines, both in source tissue leaves and sink tissue seeds, and with an opposite trend. In contrast, the ratio was significantly decreased in leaves and increased in seeds in bnacipk9 lines during the height of the oil accumulation phase (Figure 5E).
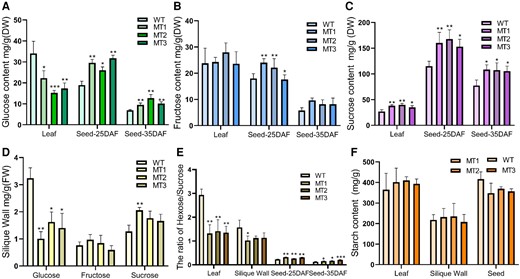
Sugar status in source organs and seeds. A–C, the content of glucose, fructose, and sucrose in tissues, respectively. D, sugar content in the silique wall. E, the ratio of hexose to sucrose in tissues. F, starch content in tissues. WT, wild-type line; MT, bnacipk9 lines; DW, dry weight. Three independent bnacipk9 lines were selected for this experiment. Error bars indicate standard deviation (n = 3). Single, double, and triple asterisks indicate significant differences between bnacipk9 lines and WT plants with P values of 0.05, 0.01, and <0.001, respectively, as determined using the analysis of variance by the least-significant difference test.
The content of starch displayed different alteration tendencies between the source organs (leaves and silique wall) and seeds; it was increased in source tissue but decreased in seeds in bnacipk9 lines compared with that in the WT lines. But the differences were not statistically significant (Figure 5F). Moreover, our results show that the ratio of hexose/sucrose changes during seed development, which decreased from the rapid oil synthesis stage (25 DAF) to the steady oil synthesis stage (35 DAF). Taken together, the increased glucose and sucrose contents in leaves and seeds of bnacipk9 lines indicated an improvement in sugar metabolism in bnacipk9 mutant lines. Although starch content showed no significant changes, alteration of sugars metabolism induced a series of changes in the storage product biosynthesis, including sugars deposition, as well as enhanced oil storage.
The bnacipk9 mutant is insensitive to glucose and ABA
Glucose and ABA can serve as signal molecular activators of various physiological activities to help plants maintain cellular homeostasis (Finkelstein, 2013; Rolland et al., 2006). Sensitivity to glucose or ABA is important in regulating signal sensing and transduction. Both glucose and ABA were elevated in bnacipk9 seeds. Therefore, we hypothesized that it was the alteration of sensitivity to ABA and glucose that improved the thresholds of ABA and glucose concentration in bnacipk9 mutant seeds. Glucose and ABA can be sensed by guard cells to regulate the stomatal aperture (Granot and Kelly, 2019). We, therefore, examined the stomatal aperture and the sensitivity of the bnacipk9 mutant leaves to ABA and glucose.
The bnacipk9 and WT lines were placed in the greenhouse and acclimated to dark for 12 h and light for 3 h to maximize physiological uniformity among plants. Thereafter, detached leaves from the tested subjects were incubated in MES-KCl buffer with the corresponding treatment for another 2 h. Stomatal closure was activated by induction of 10 μmol L−1 ABA; closure was more drastic in WT than in homozygous mutants (Figure 6). These results suggested that the bnacipk9 mutant was less sensitive to high ABA concentration. When induced by 200-mM glucose, the stomatal aperture behaved differently between WT and bnacipk9 mutant plants (Figure 6). The stomatal aperture was smaller in WT plants; however, it almost had no changes in bnacipk9 mutants. To exclude osmotic effects on the stomata, 200-mM mannitol was used. In this experiment, the stomata became smaller in the bnacipk9 mutant and responded more intensively than in WT plants (Figure 6). These results indicated that the bnacipk9 mutant was more sensitive to osmotic stress but less sensitive to glucose than WT plants.
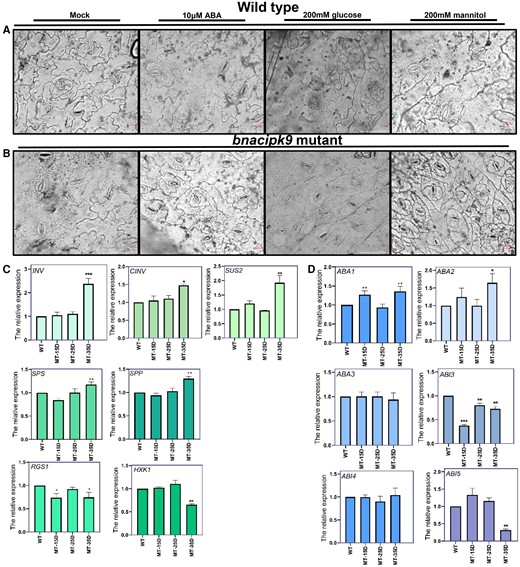
The bnacipk9 mutant is insensitive to glucose and ABA. A and B, Stomatal observation of the epidermis under incubation with ABA and glucose in WT and bnacipk9 mutant lines, respectively. WT and bnacipk9 mutant rape plants acclimated to dark conditions for 12 h and light conditions for 3 h. Intact leaves were incubated in MES-KCl buffer with 10 μm ABA, 200 mM glucose, or 200 mM mannitol for 2 h. Two hours later, the abaxial epidermal strips were promptly peeled off and observed under the microscope. Scale bar: 20 μm. C and D, Glucose and ABA biological pathway-related gene expression levels, respectively. WT, wild-type. MT-15D, MT-25D, and MT-35D denote 15 DAF, 25 DAF, and 35 DAF seeds from bnacipk9 mutants, respectively. Seeds from each stage were investigated using three independent lines. BnaActin7 and BnaUBC2 were used as internal standards. All samples were investigated using three technical replicates. The gene expression levels were determined using RT–qPCR. The error bars indicate the standard deviation (n = 9). Single, double, and triple asterisks indicate significant differences between transgenic and WT plants with P values of 0.05, 0.01, and <0.001, respectively, as determined using the analysis of variance by the least-significant difference test.
To further evaluate the physiology and signal transduction of ABA and glucose, the transcript levels of key genes involved in these pathways were investigated. INVERTASE (INV) and CELL WALL INVERTASE (CWIN) are core members of INVs, playing key roles in sucrose-to-glucose and fructose hydrolysis. SUCROSE SYNTHASE (SUS) degrades sucrose into UDP-glucose and fructose and it is considered a marker for sink strength, supporting sink development (Chourey et al., 1998; Ruan et al., 2003; Zrenner et al., 1995). SUC-PHOSPHATE SYNTHASE (SPS) and SUC-PHOSPHATE PHOSPHATASE (SPP) are pivotal in sucrose biosynthesis (Leloir and Cardini, 1955). ABA DEFICIENT 1/ZEAXANTHIN EPOXIDASE (ABA1/ZEP), ABA DEFICIENT 2/SUGAR-INSENSITIVE 4 (ABA2/GIN3) and ABA DEFICIENT 3/GLUCOSE INSENSITIVE 5 (ABA3/GIN5) are involved in ABA biosynthesis. ABA2 and ABA3 were reported to play roles in responses to glucose signaling (Fàbregas and Fernie, 2021). The ABA INSENSITIVE (ABI) genes play roles in mediating ABA sensitivity, among which ABA INSENSITIVE 3/SUGAR INSENSITIVE 10 (ABI3/SIS10), ABA INSENSITIVE 4/GLUCOSE INSENSITIVE 6 (ABI4/GIN6), and ABA INSENSITIVE 5 (ABI5) participate in ABA regulation and integration with glucose signaling (Finkelstein, 2013). HEXOKINASE 1 (HXK1) is a core component of plant glucose sensing and signaling (Moore et al., 2003). Regulators of G protein signaling (RGS1)-mediated sugar signaling is in an HXK-independent glucose signaling pathway as a receptor or coreceptor for D-glucose at the plasma membrane, playing roles in sensing glucose and modulating cell proliferation (Chen and Jones, 2004).
Significantly lower levels of transcripts of genes involved in the glucose signaling (HXK1 and RGS1) were observed in 35 DAF seeds of bnacipk9 mutants compared with that in 35 DAF seeds of WT plants (Figure 6C). Moreover, in 35 DAF seeds, the expression levels of glucose synthesis genes (INV, CINV, and SUS2) and sucrose synthesis genes (SPS and SPP) were significantly increased in the bnacipk9 mutants (Figure 6C). However, in 15 DAF and 25 DAF seeds of the mutants, genes involved in glucose synthesis and sensing were not significantly changed other than RGS1 which was up-regulated in 15 DAF mutant seeds. These results indicated that physiological pathways in glucose metabolism were more active and glucose signal sensing were less active, consistent with a lower sensitivity to glucose in the homozygous mutants. The ABA3 transcript levels showed no significant difference in any mutant seeds at all three stages, but ABA1 and ABA2 were significantly increased in the 35 DAF mutant seeds (Figure 6D). The genes involved in ABA signaling showed different changes. The ABI3 transcript level was significantly decreased in the mutant seeds in all three stages, with ABI4 showing no significant change, and only in the 35 DAF mutant seeds, the ABI5 was significantly down-regulated (Figure 6D).
Transcript level changes of the investigated genes indicated that it was only at a certain stage during seed development, such as the 35 DAF when steady oil synthesis and accumulation occur, that the BnaCIPK9 played a vital role. The 35 DAF seeds were at the late embryogenesis phase, in which the ABA and sucrose played key roles in seed maturation (Finkelstein et al., 2002; Ruan, 2014). Therefore, our results support the notion that BnaCIPK9 regulates oil accumulation through effects on ABA and glucose signaling processes. In other words, alteration in ABA and glucose signal sensing enhanced ABA and glucose accumulation in the bnacipk9 mutant seeds. Moreover, with a heightened glucose cross talk with ABA, sugar metabolism became more active in the mutant seeds. Therefore, sucrose the key product to sink strength was largely accumulated, which enhanced the storage activity and oil synthesis in the BnaCIPK9 loss-of-function seeds.
Reduced sensitivity to ABA and glucose leads to improved oil content in cipk9 mutant seeds
To determine whether the increasing ABA and glucose concentrations and insensitivity to high glucose levels in the cipk9 mutant influenced the oil content in seeds, we treated the developing seeds with exogenous ABA or glucose in WT, overexpression (OE) transgenic, and mutant lines in Arabidopsis. Glucose concentrations of 100 and 200 mM and ABA concentrations of 20 and 80 μM were used in this experiment, sprayed once per 3 days onto the siliques during the seed development stage until the siliques turned yellow in color and the seeds reached maturation. Moreover, to further elucidate the function of CIPK9 in oil metabolism by regulating ABA or the glucose signal and the relationship between ABA and glucose signaling, we analyzed the glucose or ABA biosynthesis and signaling- as well as oil biosynthesis-related gene expression profiles. In oil metabolism, ACYL CARRIER PROTEIN 1 (ACP1), BIOTIN CARBOXYL CARRIER PROTEIN 2 (BCCP2), KETOACYL ACP SYNTHASE 1 (KAS1), and FATTY ACID DESATURASE 2 (FAD2) are key genes in the de novo FA biosynthesis. DIACYLGLYCEROL ACYLTRANSFERASE 1 (DGAT1), PHOSPHOLIPID: DIACYLGLYCEROL ACYLTRANSFERASE 1 (PDAT1), GLYCEROL-3-PHOSPHATE ACYLTRANSFERASE 9 (GPAT9), and OLEOSIN 1 (OLE1) play important roles in TAG biosynthesis (Li-Beisson et al., 2013).
All three sets of independent experiments showed that the oil content in mature seeds could be increased using 100 mM glucose and could be reduced using 200 mM glucose in WT and OE lines (Figure 7A). However, this phenomenon was different in the mutant lines in that the oil content significantly increased upon both 100 and 200 mM glucose treatments. Upon 100 mM glucose treatment, ABA biosynthesis-related genes were up-regulated with an evident increase in oil content in all plants of the corresponding genotype (Figure 7, A and C). The increments of oil content were 3.46%, 4.61%, and 5.07% in mutant, WT, and OE lines, respectively. However, under 200 mM glucose treatment, ABA biosynthesis-related genes only displayed the up-regulation trend, with increased oil content by 8.25% in mutant seeds, and the down-regulation trend, with reduced oil content by 7.62% and 7.91% in WT and OE lines, respectively. Therefore, these results suggested that the ABA levels are regulated by the glucose levels and play a role in oil metabolism. Genes involved in the sugar metabolism showed no obvious differences in the cipk9 mutant seeds but diminished in WT and OE lines with increasing glucose concentrations, which was consistent with the result of a previous study reporting that high glucose levels exerted an inhibitory effect on sugar metabolism (Moore et al., 2003). Glucose levels can be considered as the carbon integrated as a storage product and a signal that senses the energy level (Xiao et al., 2000). These results suggested that the exogenous glucose level not up to inhibit sugar metabolism level could enhance the storage matter oil accumulation in developing seeds. The ABA or glucose signaling genes did not show any difference in the transcript levels upon increasing glucose concentrations in cipk9 mutant seeds, but they were up-regulated in the WT and OE lines. We consider that the up-regulation of the CIPK9 transcription level upon increasing applied glucose in the WT and OE lines is an interesting finding. All these results further supported our finding of insensitivity to high glucose levels in the cipk9 mutant, which suggested that CIPK9 negatively regulates glucose level in developing seeds.
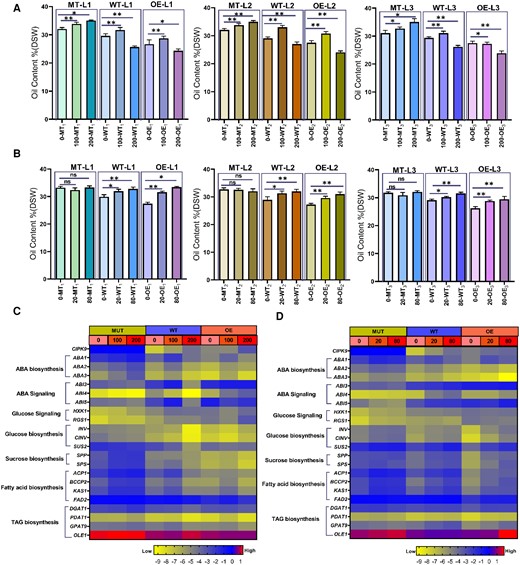
Oil content of maturation seeds and gene expression level induced by ABA and glucose in Arabidopsis. A and B, Oil content of maturation seeds upon glucose and ABA treatments, respectively. MT-L1 to MT-L3, WT-L1 to WT-L3, and OE-L1 to OE-L3 denote three independent lines of corresponding genotype plants. DSW, dry seed weight. Plants with regular development during the florescence stage were sprayed with ABA and glucose in siliques once per 3 days. Asterisks and ns denote significant differences (* P, 0.05 and ** P, 0.01) and no significant differences, respectively between OE or atcipk9 mutant and WT plants by the analysis of variance using the least-significant difference test. Each independent line included 3–4 inbred lines as biological repeats, and each inbred line had three technical repeats. Error bars indicate standard deviation (n = 9–12). C and D, Heat map of genes expression involved in sugar and ABA metabolism and signaling as well as oil metabolism upon glucose and ABA treatments, respectively. The gene expression levels were determined using RT–qPCR. ABA- or glucose-treated developing seeds of 15 DAF from Arabidopsis were selected for this experiment. Each value was obtained using three independent experimental replicates. All samples were investigated using three technical replicates. The expression values were normalized to AtActin2 and AtUBQ10. The color scale represents the gene relative expression score, ranging from low (−9, marked with yellow) to high (1, marked with red). MT, atcipk9 mutant, WT, wild type (Col-0), and OE, overexpression lines. ABA concentration, 0, 20, and 80 μM L−1; glucose concentration, 0, 100, and 200 mM L−1.
Treatments with 20 and 80 μM ABA could increase the oil content in the WT and OE lines; however, they had almost no effect on the mutant lines (Figure 7B), suggesting that the higher ABA level in certain ranges (20 and 80 μM) could enhance oil accumulation during seed development. Compared with the WT, the OE lines increased the oil content by 4.5% and 6.5% upon treatment with 20 and 80 μM ABA, respectively (2.0% and 4.5% in the WT). The increment of oil content was higher in the OE lines upon treatment with 20 or 80 μM ABA. Considering the heightened effects of exogenous ABA on the OE lines and almost no effects on the cipk9 mutant, we hypothesized that endogenous ABA content is different among these lines. This was confirmed through ABA quantification among the WT and cipk9 mutant lines as mentioned above, consistent with the results of a previous study reporting that the increase in oil accumulation level may be influenced by the ABA dosage, which could be stimulated at a certain range and impeded when it was over the range (Cheng et al., 2002). In the cipk9 mutants, the increased endogenous ABA might have been up to the threshold of oil accumulation, causing the exogenous ABA to lose its positive function to further induce oil accumulation. However, in the OE lines, the lower limit of endogenous ABA could allow exogenous ABA to increase ABA concentration and induce oil accumulation. Moreover, this was supported by the expression profiles of genes involved in ABA biosynthesis and signaling in all three genotype lines. Lower expression levels were observed in the case of the ABA biosynthesis genes in the OE lines compared with those in the cipk9 mutant and WT lines (Figure 7D), indicating lower ABA levels in the OE lines. With the increase in the exogenously applied ABA concentration, the ABA signaling genes were up-regulated in the WT and OE lines, although they showed no difference in the mutant lines. Moreover, the CIPK9 gene expression was up-regulated upon an increase in the exogenously applied ABA concentration in the WT and OE lines. These results indicated the sensitivity differences to ABA under different CIPK9 transcription levels among the three genotype lines and that the endogenous ABA content affects oil metabolism.
To further reveal the complex signaling network that connects the glucose and ABA signaling pathways in plants, we analyzed the expression of genes involved in sugar metabolism and signaling upon ABA treatment in the developing seeds. With the increase in the exogenously applied ABA concentration, the genes involved in glucose signaling showed almost no change in any of the genotypes. The genes involved in glucose and sucrose biosynthesis were almost unchanged in all, except in the OE lines where they were up-regulated, potentially resulting from the substantially increased oil biosynthesis to enhance sugar consumption and promote their biosynthesis. All these results strongly supported that ABA directly affects oil metabolism. To define the oil biosynthesis pathways during the exogenously applied ABA or glucose treatments, we investigated the expression profiles of key genes involved in FA and TAG biosynthesis. In the lines in which the oil content significantly altered upon the ABA or glucose treatment, the FA biosynthesis-related genes were markedly up- or down-regulated with TAG biosynthesis-related genes showing a minimal difference.
In summary, CIPK9 plays a role in oil metabolism to balance tissue glucose homeostasis by mediating the cross talk between glucose and ABA signaling. In the case of CIPK9-mediated oil metabolism, the ABA signaling can be regulated by the glucose signaling and directly affect oil accumulation by improving FA biosynthesis (Figure 8).
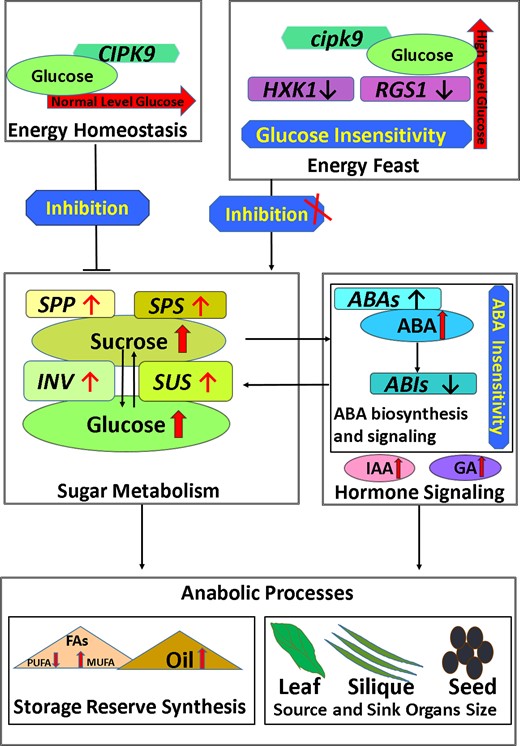
Model map for the role of CIPK9 in regulating seed oil content as well as source and sink organ size. CIPK9 can participate in the regulation of glucose homeostasis. In the cipk9 mutant, the CIPK9 protein loses its function and diminishes the sensitivity to high glucose in plant tissues. Therefore, the cipk9 mutant becomes less sensitive to high glucose, which enhances sucrose and glucose biosynthesis. To reduce the high glucose level, the hormone signaling is triggered, which can enhance the sugar consumption by activating anabolic processes. In the source organs, the enhanced sugar metabolism and improved IAA or GA result in larger leaves and longer siliques. In the sink organs and seed, the synchronically enhanced glucose and sucrose biosynthesis along with improved ABA biosynthesis lead to more active oil metabolism by improving the fatty acid biosynthesis in seeds. ABA, abscisic acid; IAA, indoleacetic acid; GA, gibberellin; FA, fatty acid; PUFA, polyunsaturated fatty acid; MUFA, monounsaturated fatty acid; SPP, SUC-PHOSPHATE PHOSPHATASE; SPS, SUC-PHOSPHATE SYNTHASE; INV, INVERTASE; SUS, SUCROSE SYNTHASE; ABAs, ABA DEFICIENT; ABIs, ABA INSENSITIVE; CIPK9, calcineurin B-like interacting protein kinase 9; HXK1, HEXOKINASE 1; RGS1, regulators of G protein signaling 1.
Discussion
In this study, the investigations of transcription and post-transcription levels in gene-silenced RNAi-transgene lines and loss-of-function mutant bnacipk9 lines generated through CRISPR/Cas9 indicated that BnaCIPK9 was negatively associated with oil accumulation in seeds. This was consistent with results from OE-BnaCIPK9 transgene lines (Guo et al., 2018). In Brassica napus, four homologous copies were present in the BnaCIPK9 gene. We were not able to produce a homozygous mutant line in the T0 generation by two sgRNA guides. The numbers of SgRNA may need to be increased to improve the percentage of high sgRNA activity or increase the intensity of four homologous copies of gene editing at the same time in the future to achieve the homozygous mutant in the T0 generation.
CIPK9 has potential values in crop breeding for high oil yield
In multiple-copy homologous plants, this study using the CRISPR/Cas9 technology successfully produced homozygous mutants in rapeseed. The loss-of-function mutant bnacipk9 possessed multiple desirable traits. The oil content was improved by 3%–5%, in addition to an increased 2%–3% of MUFA (18:1) and decreased PUFA (18:2 by 1%–2% and 18:3 by 2%–3%). The altered FA composition increased the diet profit of the seed oil. Additionally, agronomic traits had been investigated in the T3 generation plants under field conditions. It was found that thousand seed weight (TSW) and yield per plant significantly improved in multiple independent mutant lines (Supplemental Table 2). Moreover, the seed size and TSW were found to be larger in homozygous mutants both in T2 and T3 generations (Supplemental Figure 5). Furthermore, it displayed a series of superior performance traits during development and growth, including larger leaf size, longer silique, and delayed senescence, which suggests that the disruption of CIPK9 could increase the biomass and potentially improve oil content or yields. Although CIPKs are known to commonly play roles in balancing cellular homeostasis under abiotic stress, the bnacipk9 mutant performed reasonably well under cold and NaCl stress and was even resistant to the drought. These characteristics suggest a potential value in crop breeding for high oil yield.
Glucose signaling-regulated carbon metabolism can greatly alter physiology, a suitable target for oil improvement through genetic engineer
Results of this study highlighted that oil content could be induced by CIPK9-mediated alteration on sugar and hormone metabolism and signal transduction and provided insights on the effects on oil improvement, which contribute to the strategy of improving oil content. Carbon metabolism was a huge web, involving complicated physiology playing important roles in storage activity and oil biosynthesis. The WRINKLED 1 (WRI1) was a classic regulator of carbon metabolism and a transcription factor that largely affects many other transcription factors, improving oil content by altering glucose metabolism that affects the flux of carbon (Ruuska et al., 2002). A subtle change in carbon metabolism can greatly alter physiology, a suitable target for oil improvement through genetic engineering (Figure 8).
It had been reported that hormone and carbon metabolism played roles in the regulation of organ size and plant growth (Weselake et al., 2009; Hussain et al., 2020; Fàbregas and Fernie, 2021). In this study, the source organs, such as leaves and siliques, had a larger size, leading to our hypothesis that carbon and hormone metabolism had been changed in the bnacipk9 mutants. This was confirmed in both seeds and source organ leaves and siliques by changes in sugar and hormone contents in these tissues. Furthermore, the notion of insensitivity alteration to ABA and glucose was plausible. This was tested in our stomata experiment by exogenous application of ABA and glucose. Most glucose and ABA signals experiments were conducted with seedlings and their foci were most on root growth or germination. In Arabidopsis, it had been reported that the SUCROSE NONFERMENTING 1-RELATED PROTEIN KINASE 2.6/OPEN STOMATA 1 (SnRK2.6/OST1) involved in ABA response had a role in carbon sink strength by regulating sucrose metabolism (Zheng et al., 2010). In this study, both ABA and glucose signaling were studied in developing seeds and source tissues, which filled a void in ABA and glucose signal research in plants. The application of exogenous ABA and glucose in a certain range on Arabidopsis can improve oil content, which can be used to enhance the oil content when seeds were in the filling stage. The glucose or ABA biosynthesis and signaling- as well as oil biosynthesis-related gene expression profile analyses suggested that ABA directly affects oil metabolism. Further, in the CIPK9-mediated glucose level cascade, the ABA signaling acts downstream of glucose signaling.
Some questions about the roles of ABA and glucose playing in bnacipk9 mutants require further discussion
Seed development involves complicated regulation pathways, which cross talks with hierarchical or combinatorial interactions. The property of seed-matured processes, especially at the seed-filling stage, is sensitive to disturbance from endogeneity or exogeneity. Responses to these disturbances can result in dominant and permanent changes in oil content and FA profile as well as crop quality and productivity. Endogenous hormone and glucose metabolism were reported to highly regulate the deposition of storage during the maturation stage of the seeds (Nguyen et al., 2016). Based on the data of this study, BnaCIPK9 could play multiple roles in seed storage accumulation through regulating sugar and hormone levels. Furthermore, glucose and hormone could serve as molecular signals to control seed metabolism.
The lower sensitivity to glucose in bnacipk9 mutant allows more sucrose accumulation to support seed-filling and oil accumulation
Sugar is a carbon source first transported into the endosperm from source tissues and then up taken by the embryo, whereas hexose is the dominant sugar taken up by the early developing embryos (Rolland et al., 2006; Niu et al., 2009). Hexose produced from sucrose hydrolysis strengthens and supports seed development (Ruan, 2014). High hexose concentration has a close connection with active cellular division and morphogenesis in the early embryonic development with a high hexose-to-sucrose ratio (Weber et al., 1996; Weber et al., 1998). In bnacipk9 mutant seeds (25 DAF and 35 DAF), the higher hexose content and hexose-to-sucrose ratio indicate more vigorous activities on cellular division and elongation. This is consistent with the larger size of matured seeds observed in multiple independent bnacipk9 mutant lines from the T2 and T3 generations. This ratio decreases when the embryo ceases cell division and elongation and transits into storage lipid deposition. During this stage, high sucrose concentration was reported as a major trigger to activate storage product synthesis pathways (Ruan, 2014). High glucose levels can inhibit sucrose accumulation (Doehlert et al., 1987). However, from the mid-to-late maturation of the seeds (25 DAF and 35 DAF), both the glucose and sucrose levels are significantly increased in the bnacipk9 mutants. Combined with the observation on the reduced stomatal sensitivity to high glucose level, the decreased sensitivity to glucose might be the reason for improved sucrose accumulation even under high glucose concentration in bnacipk9 mutant developing seeds. Glucose plays dual roles in carbon metabolism, in which it serves as the molecular signal that regulates carbon metabolism and serves as the carbon nutrient that supports carbon metabolism (Ohto et al., 2005; Zhai et al., 2017). Therefore, in bnacipk9 mutant the lower sensitivity to glucose allows more sucrose accumulation to support seed-filling and oil accumulation.
CIPK9-mediated glucose level triggers the ABA regulation and further has an effect on the oil metabolism in developing seeds
ABA is also implicated in preventing seed abortion and promoting embryonic growth at early embryogenesis and positively associates with storage accumulation and seed mass (Finkelstein et al., 2002). Reports had shown that the application of exogenous ABA could enhance the deposition of storage lipids in developing embryos (Finkelstein and Somerville, 1989; Holbrook et al., 1992). In the past years, based on the co-promotion of ABA and sucrose contents and transcription level of storage-associated genes, the theory was prevailed that ABA-sucrose interaction played role in triggering storage-associated processes during seed maturation (Smeekens, 2000; Borisjuk et al., 2002; Brocard-Gifford et al., 2003). These studies emphasized the importance of sucrose on storage accumulation based on the association of sucrose content with gene expression in relation to maturation. However, the function of glucose, serving as a signal molecular, was ignored, which played a key role in regulating sucrose metabolism during the seed maturation. Glucose signaling can regulate many physiological pathways either directly or through interaction with other signaling pathways, such as hormone-mediated processes to achieve the regulation function.
Both ABA and glucose had the signal molecular properties with sensor and regulatory roles. In this study, we postulated that the interaction between glucose and ABA signaling played their signaling roles in regulating oil synthesis and accumulation. A serial knowledge concerning cross talks between glucose and hormone signal transduction pathways had been gleaned from studies on Arabidopsis. These studies focused on seed germination and early seedling development (Fàbregas and Fernie, 2021). Moreover, there were studies reported that ABA- and glucose-mediated pathways interacted with each other to regulate drought stress and cold stress (Dekkers et al., 2008). The interaction between ABA- and glucose-mediated pathways in seed oil metabolism, especially on crops, was rarely reported. In rice, high glucose suppresses ABA catabolism and delays seed germination (Zhu et al., 2009). In fruits rich in glucose, it had been reported that endogenous or exogenous ABA could enhance glucose accumulation and stimulate glucose uptake by more active transporters (Kobashi et al., 2001). In Arabidopsis, several studies have contributed to elucidating the relationship between glucose and ABA signals in the cross talk signaling network. The glucose-insensitive mutant gin1 (gin1 was allelic to aba2) was obtained, and it was suggested that GIN1/ABA2 acted downstream of the glucose sensor HXK1 (Zhou et al., 1998). GIN1 was identified as ABA2 via molecular cloning and was described to be activated by glucose (Cheng et al., 2002). During the Arabidopsis vegetative development, GIN5 and GIN6 reportedly play roles in the glucose signaling pathway. GIN5/ABA3 was involved in the ABA level regulation by glucose, and GIN6/ABI4 participated in the ABA signaling, and these two processes were mediated by the glucose sensor HXK1 and constituted parts of the glucose signaling network (Arenas-Huertero et al., 2000).
Our study suggested that the CIPK9-mediated glucose level regulates the ABA signaling; moreover, it affects oil metabolism in developing seeds. The significantly increased ABA level in the bnacipk9 mutant seeds may serve as a high glucose marker for plants to improve their glucose utilization activity for the FA and oil synthesis, which in turn can feed forwardedly enhancing sugars metabolism. Such a scenario had been described in mammals, which reported that human adipose tissue could release ABA in response to high glucose and stimulate glucose consumption in adipocytes by enhancing the glucose transport to balance blood glucose homeostasis (Bruzzone et al., 2012; Sturla et al., 2017; Spinelli et al., 2021). Various studies had reported that ABA could serve as immune-regulatory mediators by glycemic control against metabolic syndrome and comorbid diseases, such as type 2 diabetes (Zocchi et al., 2017; Kim et al., 2020; Magnone et al., 2020). For example, a study reported the participation of ABA in glucose metabolism, in which ABA could alleviate glycometabolic disturbances and reduce inflammatory status in patients with impaired fasting glucose or impaired glucose tolerance (Derosa et al., 2020). Therefore, based on the results of this study, combined with those associated with the physiological function of the ABA–glucose level cross talk, we hypothesize that the ABA and glucose interaction contributes to regulating seed oil metabolism in rapeseeds. In mutants, the loss of CIPK9 function improves the high glucose level tolerance in cells. To alleviate the negative effects of glucose overaccumulation on plant cells, the ABA accumulation is triggered, enhancing FA biosynthesis and improving TAG and oil accumulation.
Materials and methods
Plasmid construction
For the generation of RNA knockdown plants, we used two promoter types, the seed-specific (Napin, 22-RNAi) and constitutive (35S, 23-RNAi) expression promoters with the RNAi vector pRNAi-GG was used (Yan et al., 2012). The CRISPR/Ca9 system was used in this experiment to generate homozygous mutant plants as described in the study according to Xie et al. (2015) and Supplemental Table 3 summarized the primers used in this study. All completed constructs were transformed into Escherichia coli DH5α, which were then sent for sequencing to Co.Lt.QingKe in Wuhan. The sequenced-right constructs were transformed into Agrobacterium tumefaciens strain GV3101, which were then used for transformation into transgenic receptor material, Westar.
Plant materials and growth conditions
Experiment materials from Arabidopsis cipk9 (SALK_058629; MT), Col-0 (WT), and OE lines were obtained from Guo et al. (2018). Gene-edited information of loss-of-function mutant bnacipk9 lines used in this research were listed in Supplemental Figure 6. Arabidopsis plants were planted in the greenhouse under 20°C–22°C and 65%–70% humidity with a light intensity of 50 μmol m−2 s−2 and a photoperiod of 16/8 h of light/dark cycle. All constructs were transformed into WT plants (Westar) by Agrobacterium tumefaciens-mediated transformation for the experiment materials from rapeseed (Brassica napus; Cardoza and Stewart, 2003; Bhalla and Singh, 2008). The T0 generation was planted in the greenhouse under 20°C–22°C and 65%–70% humidity with a light intensity of 50 μmol m−2 s−2 and a photoperiod of 16/8 h of light/dark cycle. The T2 generation was grown in the growth chamber (Conviron PGW40) with a light intensity of 60 μmol m−2 s−2 by a 16/8 h light/dark cycle photoperiod at 22°C. T1 and T3 generations were planted in rape-transgene experiment fields at Huazhong Agricultural University, Wuhan, China, in October.
Identification of transgenic plants and potential off-targets of transgenic plants were screened by kanamycin (50 mg L−1). Selected pants from T0 to T3 generations were tested using the Hi-Tom technology (Liu et al., 2019). Polymerase chain reaction (PCR) products of target-specific barcoding were mixed in equal amounts and purified for next-generation sequencing (Illumina HiSeq platform at the Novogene Bioinformatics Institute, Beijing, China). The target-specific primer sets are listed in Supplemental Table 3. Sequenced data were decoded by a corresponding online tool to track mutations in plants (http://www.hi-tom.net/hi-tom/). To verify the precise information on gene mutation, 15–25 independent plants were selected to perform the TA clone experiment, in which per plant was sequenced again by Co.Lt.QingKe. To obtain T-DAN-free homozygous mutant plants, selected homozygous mutant plants from the T3 generation were tested by PCR using specific primer pairs (Supplemental Table 3). The potential off-target sites were identified. Specific primers surrounding potential off-target sites were designed based on CRISPR-P2.0 (http://crispr.hzau.edu.cn/CRISPR2/). About 25–35 tested-editing plants were selected to perform the off-target testing experiment. PCR products were sequenced by Co.Lt.QingKe.
Agronomic trait investigation
Homozygous mutant plants from the T3 generation were selected for agronomic trait analysis. We studied the following traits: number of effective siliques in the main inflorescence, number of effective branches, number of siliques, length of silique, number of grains, TSWs, and yield per plant. The data of every trait was collected from independent lines, with at least 10 plants from each line. The mean values of each trait were statistically analyzed.
FA composition and oil content quantification
We analyzed the oil content and FA composition using near-infrared reflectance spectroscope (NIRS) analysis and gas chromatography–mass spectrometry (GC–MS), respectively. Five to seven plants from each independent line were selected for testing. The mature rapeseed oil and protein contents were analyzed via the Foss NIR-System 5000 (NIR-Systems, Inc., Silver Spring, MD, USA) using the model parameters described by Gan and Sun (2003). Mature rape and Arabidopsis seeds were treated for FAs extraction following previously described procedures (Li-Beisson et al., 2006). Both the FA composition and seed oil content of Arabidopsis were analyzed via GC following previously published procedures (Li-Bession et al., 2006). We used heptadecanoic acid (C17:0) as a quantitative internal standard with a concentration of 200 µg. The final FA methyl esters were dissolved in hexane. The prepared samples were analyzed using GC–MS on an Agilent 6890 device with a flame ionization detector (Agilent, Santa Clara, CA, USA), with helium as the carrier gas.
RNA extraction and reverse transcription quantitative PCR (Rt–qPCR) gene expression analysis
30 DAF seeds were used for testing BnaCIPK9 expression in the RNAi lines. 15 DAF, 25 DAF, and 35 DAF seeds were used for analyzing the selected gene expressions in bnacipk9 mutant lines. All seeds were collected and frozen immediately in liquid nitrogen. Total RNA was extracted using the RNAprep Pure Plant Kit (TIANGEN Cat. #DP441) following the manufacturer's instructions. The cDNA was synthesized using the Transcript RT Kit (TaKaRa, Cat. #RR047A). For RT-qPCR, a total volume of 10 μL reaction mixture was used containing 5 μL of 29 SYBR Green Master Mix (963400, TOYOBO, Tokyo, JAPAN), 4.6 μL of 20× diluted cDNA, and 0.2 μL of each primer. The amplification experiment was performed using the CFX384 Real-Time System (786BR04835, BioRad, CA, USA). For gene normalization, BnaACTIN7 and BnaUBC2 were selected in Brassica napus and AtACTIN2 and AtUBQ10 in Arabidopsis. Primer sets were designed for testing selected gene expressions as listed in Supplemental Table 3. All samples were tested using 3–4 biological and three technical replicates. The expression level of each gene was calculated using the 2−△△CT method in Brassica napus (Livak and Schmittgen, 2001). The 15 DAF seeds were selected to perform the RT-qPCR experiment and the gene expression profiles were obtained using △CT in Arabidopsis.
Sugar and starch extraction and quantification
Glucose, fructose, sucrose, and starch were extracted by enzymatic methods described by Trethewey et al. (1998). They were extracted using commercial reagent kits from Geruisi (http://www.geruisi-bio.com/). All metabolites were transferred into standard curves of the pure substance in the same 96 well plates for quantification. All samples in 96 well plates were scanned by ELISA (TECAN, Infinite® F500 Multimodel Plate Reader), and each plate was scanned three times repeatedly every 5 min. The quantification of glucose, fructose, and sucrose were measured at 340 nm and that of starch at 510 nm.
Hormone analysis
All samples were processed with the vacuum freeze-drying technique. Three replicates per sample powder were weighed and homogenized in 80% (v/v) ethanol. The homogenizing samples were placed in an ice-water mixture imposed ultrasonic wave for 1 h. Prepared samples were centrifuged at 4°C by 12,000 rpm for 10 min. Then, all supernatant was absorbed by the injector (1.5 mL) and injected into a brown sample bottle through a 0.22μm filter membrane. The extraction samples were analyzed on an ultra-performance liquid chromatography–mass spectrometer (UPLC–MS) system, ultra-performance liquid chromatography consisting of an acuity UPLC system coupled with a mass spectrometer (AB SCIEX Q-TRAP6500plus).
Abiotic stress treatments and quantification of malondialdehyde, hydrogen peroxide, and chlorophyll
Plants under abiotic stress treatments were grown in the growth chamber, similar to the condition above (growth conditions). Moreover, WT plants and bnacipk9 mutant lines were plated individually in a plastic pot with a length of 15 cm, a width of 15 cm, and a height of 20 cm. All plants were growing for 3 weeks before the conduction of abiotic stress treatment. Seven independent mutant lines were selected for this experiment, of which five independent mutation lines were randomly selected to conduct each abiotic stress treatment. Moreover, every independent mutant line included 4–7 inbred plants. For the drought treatment, plants were irrigated directly into plastic containers every other day with the same volume of water for 3 weeks after sowing. Drought treatments started on the 3-week-old plants and lasted for 10 days until plants started exhibiting drought stress symptoms (leaf curling and color-changing). For cold-acclimation treatment, 3-week-old plants were maintained at 4°C for 7 days and 0°C for 4 days in a freezing growth chamber (the condition of light and humid as above growth condition) until the leaves became albino. For NaCl treatment, 3-week-old plants were irrigated with the same volume of water with 13.5 g L−1 NaCl or with nothing (as the control group) every other day four times. Samples finished the treatment, and all tissues above the ground were collected in liquid nitrogen for further experiments.
To determine chlorophyll content, 0.5 g of leaves was extracted using 5 mL of 80% (v/v) acetone until complete bleaching. Furthermore, the experiment was performed in triplicates. The total chlorophyll content was determined photometrically by measuring absorption at 652 nm, and the results were calculated as described previously (Arnon, 1949). MDA and H2O2 were extracted using a commercially available reagent kit (Solarbio, http://www.solarbio.com) based on the manual instructions. All samples in 96 well plates were scanned by ELISA (TECAN, Infinite® F500 Multimodel Plate Reader), and each plate was scanned three times repeatedly every 5 min. The MDA content was determined photometrically by measuring absorption at 532 and 600 nm and H2O2 content at 415 nm, and the results were calculated as described using manual instructions.
Observation of stomata from isolated guard cell-enriched epidermal fragments
The T2 generation plants grown in the growth chamber were selected to conduct this experiment. Plants of WT and bnacipk9 mutants of rapes acclimated to dark for 12 h and light for 3 h. Detached leaves from selected experiment plants were incubated in MES-KCl buffer (50 mM KCl, 10 mM MES-KOH, and pH 6.15) for 3 h in the light culture chamber for the homogeneous temperature and light condition (50 μmol photons m−2s−1, 23°C and relative humidity 65% ± 5%) to induce stomata opening. Prepared leaves were then incubated in MES-KCl buffer alone as the control groups and MES-KCl buffer with 10-μm L−1 ABA, 200-mM L−1 glucose, or 200-mM L−1 mannitol as experimental groups for another 2 h. After completing the treatment experiment, the epidermises were promptly peeled from the abaxial surface of the leaves. In all experiments, images of the epidermal fragments were taken using a Nikon camera with a microscope (Nikon ECLIPSE 80i).
Exogenous abscisic acid and glucose treatment in Arabidopsis
Plants, Arabidopsis, were planted in the greenhouse mentioned in Section “Plant materials and growth conditions”. When Arabidopsis plants were in flourishing fluorescence, the flower buds and flowers were eliminated with the initial fructification remains. Three genotype plants were planted separately in one pot (length, 15.5 cm; width, 13 cm; and height, 10.5 cm), for keeping the uniformity of growth and treatment conditions. The plants with homogeneous growing status were selected, and the remainder was cut off. Every genotype with three independent lines and each line with 5–6 plants were designed to perform this study. Every treatment was conducted in three independent experiments. Exogenous glucose (0, 100, and 200 mM L−1) and ABA (0, 20, and 80 μM L−1) were sprayed directly on those developing siliques per 3 days until most siliques went from dehydration to maturation. Moreover, during this experiment, the volume of water irrigated on plants was guaranteed to be equivalent. Seeds used for the oil extraction experiment were selected from the full-maturity seeds.
Accession numbers
Sequence data in this article can be found in the Arabidopsis Information Resource (TAIR, https://www.arabidopsis.org/) and the Brassica napus pan-genome information resource (BnPIR, http://cbi.hzau.edu.cn/cgi-bin/bnapus/search) under accession numbers. In Arabidopsis, CIPK9 (AT1g01140), CINV (AT1G35580), INV (AT1G56560), ABI3 (AT3G24650), ABI4 (AT2G40220), ABI5 (AT2G36270), ABA1 (AT5G67030), ABA2 (AT1G52340), ABA3 (AT1G16540), SUS2 (AT1G80070), HXK1 (AT4G29130), RGS1 (AT3G26090), SPP (AT3G52340), SPS (AT1G04920), ACP1 (AT3G05020), BCCP2 (AT5G15530), KAS1 (AT5G46290), FAD2 (AT3G12120), DGAT1 (AT2G19450), PDAT1 (AT5G13640), GPAT9 (AT5G60620), OLE1 (AT4G25140). In Brassica napus, BnaA09.CIPK9.1 (BnaA09G0659700WE), BnaA09.CIPK9.2 (Bnascaffold2579G0000300WE), BnaA10.CIPK9 (BnaA10G0008600WE), BnaC05.CIPK9 (BnaC05G0008400WE).
Supplemental data
The following materials are available in the online version of this article.
Supplemental Figure S1. The target sequence.
Supplemental Figure S2. Genetic analysis of CRISPR/Cas9-induced mutations in BnaCIPK9 and their transmission from T0 to T2 generations.
Supplemental Figure S3. MDA, H2O2, and chlorophyll content under abiotic stress.
Supplemental Figure S4. Leaf morphology in wild-type (WT) and bnacipk9 mutant plants during the senescence stage.
Supplemental Figure S5. Seed size and TSW in wild-type and bnacipk9 lines.
Supplemental Figure S6. Gene editing-related information on the bnacipk9 mutant lines applied in this study.
Supplemental Table S1. Off-target mutations detecting in the edited plant lines.
Supplemental Table S2. Agronomic traits in Cas9-free loss-of-function mutant bnacipk9 lines.
Supplemental Table S3. Primers used in this study.
Acknowledgments
The authors thank Fang Liu for the help on field management and Xiuli Sun and Qing Zhao for the assistant on experiments involved in fatty acid and oil measurement. We would also like to thank the editor and the two anonymous reviewers for their valuable comments to improve the quality of our work.
Funding
This study was supported by the National Natural Science Foundation of China (Grant No. 31871654).
References
Author notes
N.W. and Y-L.G. designed the experiments. T-D.F., J-X.S., and J-X.T. checked and optimized the experiment scheme. N.W., B.-L.T., J.-M.M., R.-H.L., and R-D.C. performed the experiments and analyzed the data. N.W. wrote the article and J.-T.Z., L.Z., J.W., and B.Y. contributed to revise the manuscript. J.-X.S. supervised the project.
The author responsible for distribution of materials integral to the findings presented in this article in accordance with the policy described in the Instructions for Authors (https://dbpia.nl.go.kr/plphys/pages/General-Instructions) is Jinxiong Shen.
Conflict of interest statement. The authors declare that there is no conflict of interest.
