


Abstract
Both cis- and trans-regulatory mutations drive changes in gene expression that underpin plant phenotypic evolution. However, how and why these two major types of regulatory mutations arise in different genes and how gene expression is inherited and associated with these regulatory changes are unclear. Here, by studying allele-specific expression in F1 hybrids of pink-flowered sacred lotus (Nelumbo nucifera) and yellow-flowered American lotus (N. lutea), we reveal the relative contributions of cis- and trans-regulatory changes to interspecific expression rewiring underlying petal color change and how the expression is inherited in hybrids. Although cis-only variants influenced slightly more genes, trans-only variants had a stronger impact on expression differences between species. In F1 hybrids, genes under cis-only and trans-only regulatory effects showed a propensity toward additive and dominant inheritance, respectively, whereas transgressive inheritance was observed in genes carrying both cis- and trans-variants acting in opposite directions. By investigating anthocyanin and carotenoid coexpression networks in petals, we found that the same category of regulatory mutations, particularly trans-variants, tend to rewire hub genes in coexpression modules underpinning flower color differentiation between species; we identified 45 known genes with cis- and trans-regulatory variants significantly correlated with flower coloration, such as ANTHOCYANIN 5-AROMATIC ACYLTRANSFERASE (ACT), GLUTATHIONE S-TRANSFERASE F11 (GSTF11), and LYCOPENE Ε-CYCLASE (LCYE). Notably, the relative abundance of genes in different categories of regulatory divergence was associated with the inferred magnitude of constraints like expression level and breadth. Overall, our study suggests distinct selective constraints and modes of gene expression inheritance among different regulatory mutations underlying lotus petal color divergence.
Introduction
One of the key objectives in evolutionary biology is to understand the genetic mechanisms underlying phenotypic diversification during species divergence (Romero et al., 2012; Signor and Nuzhdin, 2018; Payne and Wagner, 2019). Divergence can be caused by one of two mechanisms: (1) a change in protein-coding sequences or (2) a change in gene expression patterns. In the latter case, the change can be caused by mutations in either cis-regulatory regions of the gene itself or trans-acting regulatory genes (Carroll, 2005; Romero et al., 2012; Signor and Nuzhdin, 2018; Yocca and Edger, 2021). The expression of any given gene can be modified by either cis- or trans-regulatory variants, or both (Wittkopp et al., 2004; Signor and Nuzhdin, 2018; Hill et al., 2021). Assessing the relative contributions of cis- and trans-effects to changes in gene expression is an essential step in elucidating genetic mechanisms in intraspecific or interspecific regulatory diversity (Gaur et al., 2013). In some organisms, like fruit fly (Drosophila melanogaster and D. simulans), mice (Mus musculus and M. castaneus), maize (Zea mays), rice (Oryza sativa), there is an abundance of cis-acting sequence variation that affects gene expression levels. For other studies on hybrids including yeast (Saccharomyces cerevisiae, S. paradoxus, and S. mikatae) and Chili Pepper (Capsicum annuum), variations in transcription factors (TFs) are often found to play important roles in controlling gene expression (Gaur et al., 2013; Mack and Nachman, 2017). Identifying the genetic changes underlying expression divergence remains challenging. One goal of this study was to evaluate the relative importance of cis- and trans-effects on regulatory divergence between species at a genomic scale and to explore further whether there is any bias in the prevalence of cis- or trans-evolution in the divergence of the two parental genomes.
Apart from understanding patterns of cis- and trans-effects on regulatory evolution, a second question of interest is how cis- and trans-effects affect specific characters. Although there are many recent studies that address this issue for intraspecific divergence in plants (e.g. ear tissue in maize, Lemmon et al., 2014; fiber domestication in cotton, Gossypium hirsutum, Bao et al., 2019; and fruit morphology in chili pepper, Diaz-Valenzuela et al., 2020), many fewer examine such changes for interspecific divergence. Such studies are needed to determine the extent to which patterns revealed for intraspecific divergence also hold for interspecific divergence. Additionally, because the number of previous studies is small, it is unclear whether there are any generalizations that can be made. The second objective of this study was to address these issues by quantifying the relative importance of cis- and trans-regulatory changes associated with flower color divergence between two allopatric species using genome-wide allele-specific expression (ASE) analysis (Wittkopp et al., 2004; Signor and Nuzhdin, 2018): pink-flowered sacred lotus (Nelumbo nucifera) and yellow-flowered American lotus (N. lutea; Wang, 2005), and on their F1 hybrids.
In hybrid offspring of between-species crosses, genes exhibiting cis- and trans-regulatory substitutions in diverged species frequently differ in the degree of dominance inheritance, resulting in trait differences from parents. Theoretical analyses suggest that cis-regulatory mutations should tend to be additive, while trans-regulatory mutations should tend to be dominant or recessive, and these patterns are supported by several investigations (Lemos et al., 2008; McManus et al., 2010; Metzger et al., 2017). In addition, some investigations have identified cases of transgressive expression, in which total expression levels in hybrids lie outside of the levels of the two parental species, a phenomenon often attributed to two diverged regulatory systems merged in the same cells (Ortiz-Barrientos et al., 2007; Lopez-Maestre et al., 2017). The third objective of this study was to determine whether these expected patterns hold for Nelumbo by determining the proportion of regulatory changes that are additive, dominant or recessive, and transgressive in Nelumbo hybrids, and whether those proportions differ for cis- and trans-regulatory mutations for both all genes expressed in petals and genes specifically involved in anthocyanin biosynthetic pathway (ABP) and carotenoid biosynthetic pathway (CBP).
Finally, it is expected that the degree of pleiotropic constraint experienced by a gene will often influence whether cis- or trans-regulatory substitutions occur. This difference is expected because generally cis-mutations are expected to experience less pleiotropy, and they typically affect the expression of only one gene, often in a limited spatial or temporal domain. By contrast, trans-mutations often affect the expression of several downstream targe genes, and thus are expected to be subject to stronger pleiotropic constraints (Gibson, 1996; Prud'homme et al., 2007; Vandepoele et al., 2009). While studies on individual genes are consistent with these expected patterns (e.g. Coberly and Rausher, 2008; Streisfeld and Rausher, 2009; Kuang et al., 2018), this pattern has rarely been examined on a genomic scale (He and Zhang, 2006; Su et al., 2010). The final objective of this study was to evaluate the extent to which this pattern holds on a genomic scale. We do so by examining whether there is an association between various proxies for pleiotropy (e.g. average expression level, expression breadth, type of duplication; Park and Choi, 2010; Shi et al., 2020) and regulatory category (cis versus trans).
Results
The relative abundance of differentially expressed genes in different regulatory categories
We identified 18,420 genes that were differentially expressed for at least one of the 48 pairs of species and tissue stages, which will be used for all analyses. Genes not included in this set fall primarily into three categories: (1) genes not expressed in petal tissue; (2) genes that are inconsistently expressed among replicates; and (3) “housekeeping” genes that are expressed in most tissues. We excluded housekeeping genes because it is unlikely that they contribute specifically to petal development and are not relevant to understanding the evolutionary divergence of petal characters.
Using these DEGs, we quantified the Pearson correlation (r) of expression for each of the 1,152 species-stage-replicate combination pairs (Supplemental Figure 1A). We then calculated average correlations for subsets of these pairs. The average correlation coefficient among the replicates from the same species-stage combination (N = 48), r = 0.899, was significantly higher than all the other subsets we examined, r = 0.512 (Mann–Whitney U test, P value < 0.01), indicating consistency within a species-stage combination. A second subletting created four subsets, each of which contained all samples at the same developmental stage (4 species × 3 replicates = 12 samples), and we calculated all pairwise correlations within each subset. The overall average across all four subsets was r = 0.82. For the individual stages S1, S2, S3, and S4 the averages were 0.90, 0.84, 0.76, and 0.74, respectively, suggesting that younger petal tissues had relatively higher overall expression similarity.
Next, we assigned each DEG to one of seven regulatory categories, with assignments done separately for each of the four developmental stages. The regulatory categories indicate the nature of the regulatory changes that explain expression level divergence between species. These categories are based on two values: (1) A, which reflects the difference in gene expression level between the two lotus species and (2) B, which reflects the difference in expression level of the two parental alleles within an F1 hybrid (Figure 1, A and B). Approximately 7.10%–11.90% of genes were characterized as having between-species expression differences resulting from only cis-acting variants (category 1), while differences due exclusively to trans-acting variants (category 2) accounted for only 5.24%–8.77%. The remaining genes with differential expression were “mixed”, regulated by both cis- and trans-regulatory mechanisms. Of these, 0.35%–0.86% were categorized as “cis + trans: enhancing” (category 3, cis- and trans-effects in the same direction), 0.74%–2.15% as “cis + trans: compensating” (category 4, cis- and trans-effects in the opposite direction) and 0.86%–2.48% as “compensatory” (category 5; Figure 1, C and D; Supplemental Table 1). It appears that antagonistic cis- and trans-effects (categories 4 and 5) are more common than enhancing changes (category 3), which is in line with previous studies in Arabidopsis (Arabidopsis thaliana and A. arenosa; Shi et al., 2012), cotton (Bao et al., 2019), and Camellia (Camellia chekiangoleosa, C. azalea, and C. amplexicaulis; Zhang et al., 2019a). Approximately half of the analyzed genes (45.89%–55.46%) were assigned to the “conserved” category (category 6). The remaining 25.32%–35.48% of genes were assigned to the ambiguous category (category 7; Figure 1, C and D; Supplemental Table 1). Among the seven categories, there was a significant negative correlation between the cis- (B) and trans- (A–B) effects of all DEGs for both hybrids at each developmental stage (Pearson's correlation test, r = −0.21 to −0.42; all P values < 0.001), suggesting a tendency for cis- and trans-variants to occur in different genes (Supplemental Table 2).
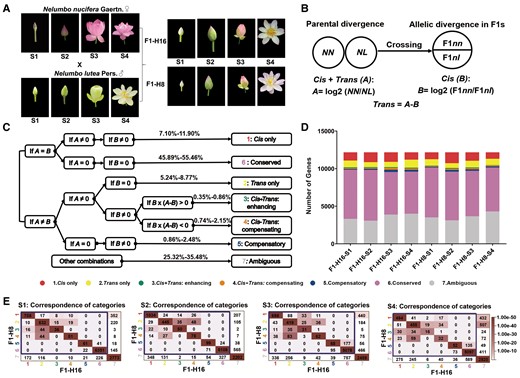
ASE analysis of petal-expressed genes in Nelumbo nucifera (NN), Nelumbo lutea (NL), and their F1 hybrids (F1–H16, F1–H8). A, Petal developmental stages (S1–S4). B, Calculation of cis- and trans-regulatory effects based on ASE of the parents and F1s. A, which represents the total contribution of cis- and trans-regulatory effects to differential gene expression, was measured by the log of the ratio of NN and NL expression levels of the two species. A > 0 indicates higher expression in N. nucifera, while A < 0 indicates higher expression in N. lutea. B, which represents the relative contribution of cis-regulatory effects to the total parental difference (A), was estimated by the log of the ratio of expression levels of the two parental alleles in F1 hybrids. B > 0 indicates a higher expression of the N. nucifera allele, while B < 0 indicates a higher expression of the N. lutea allele. The difference, A–B, represents the relative contribution of trans-regulatory variants to the total parental difference. C, Criteria for classification of genes into seven regulatory categories according to cis- and trans-regulatory effects. The percentage values indicate the ranges, across developmental stages, of the percent of genes in the different categories. D, Numbers of genes in regulatory categories 1–7 (defined in part C) from the two F1 hybrids at four developmental stages. E, Consistency of assignment of genes to regulatory categories. In each graph, the x axis shows the assignment category for hybrid H16, and the y axis shows the assignment category for hybrid H8. Numbers in cells indicate the number of genes with the associated assignment categories. A χ2 test of association yielded χ2 = 22,259.407, 22,605.091, 16,500.858, and 14,738.320 for stages 1–4, respectively, with 25 df, corresponding to P < 10−9 in each case, indicating that numbers in some cells are higher than expected. The color intensity scale in each cell indicates the statistical significance of enrichment (represented by P value) for the overlap of the number of genes (calculated as diag function in R) between F1–H16 and F1–H8 at four developmental stages (Fisher's exact test). The darkest color in diagonal cells represents the most significantly enriched overlap between the two F1 hybrids (P value < 3.35e-26 for all stages).
Genes in the two hybrids were consistently assigned to the same regulatory categories. For the four developmental stages S1–S4, 87.26%, 82.36%, 72.49%, and 73.64% of DEGs were consistently assigned to the same regulatory (Figure 1E), suggesting that patterns exhibited by the two hybrids are robust. After excluding genes exhibiting ambiguous regulation in either F1 hybrid, these consistent gene ratios increased to at least 90% (see the diagonal in the boxes in Figure 1E). Moreover, when two alleles are not expressed in equal proportions, the direction of this bias was generally consistent (the same parental allele expressed higher) between the two hybrids. Over all four stages, the average proportion of genes showing a consistent direction of allelic expression bias in both hybrids was 90.57% (Supplemental Figure 1B).
Different magnitudes of cis- and trans-effects on expression rewiring
Although there are many reports of ASE (cis-effect), in both plants and animals, reports on the trans-effect on expression differentiation at the genome-wide level are relatively scarce (Signor and Nuzhdin, 2018). Here, we found that substitutions with cis- and trans-effects on gene expression changes differ in relative frequency and magnitude. Although there were fewer trans-only than cis-only genes (Figure 1, C and D), on average, the proportional contribution to the parental expression difference of trans-regulatory effects |A–B| (51.74%–55.86%) was significantly higher than that of cis-regulatory divergence |B| (44.14%–48.26%; |A–B| > |B|, Wilcoxon rank-sum test, P value < 0.01; Supplemental Table 2). Additionally, on average, the proportional contribution of trans-regulatory divergence (A–B) had a stronger correlation with parental expression differences (A; Pearson's r = 0.56–0.70 for the four stages in both hybrids) than the contribution of cis-regulatory divergence (B; Pearson's r = 0.47–0.58; P value < 0.001 for all correlations; Supplemental Table 2).
The magnitude of the parental expression divergence (|A|) varied among different expression categories. Generally, the largest difference (|A|) was observed in cis + trans enhancing genes (category 3), followed by cis-only and trans-only genes (categories 1 and 2) at four developmental stages (Figure 2A; Supplemental Figures 2A and 3A; Wilcoxon rank-sum test, P value < 0.05 for all stages). In general, expression of the NN allele in N. nucifera was significantly higher than that of the NL allele in N. lutea only for the cis-only category for F1–H16 (all stages) and F1–H8 at S1 (Figure 2B; Supplemental Figures 2B and 3B; Student's t test, Bonferroni-corrected P values < 0.05 in all these mentioned). In contrast, the trans-only, cis + trans enhancing, and cis–trans compensating categories showed significantly higher expression of the N. lutea allele in F1–H16 stages 1–3 and in F1–H8 stages 1–4 (Figure 2B; Supplemental Figures 2B and 3B; Student's t test, Bonferroni-corrected P values < 0.05 in all these mentioned cases).
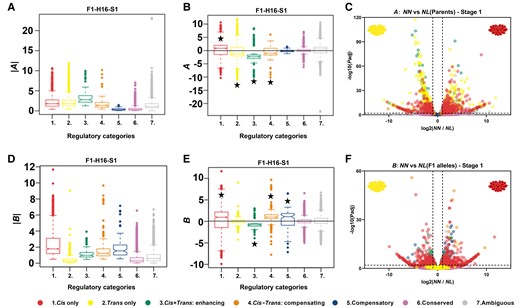
The magnitudes and directions of parental expression divergence and cis-regulatory divergence in the F1 hybrid, F1–H16, at the early flower bud stage (S1) for genes in the different regulatory categories. The elements of the boxplots are defined as follows: centerline, median; box limits, upper (Q3) and lower (Q1) quartiles; whiskers, smallest and largest nonoutliers; points, outliers. A, Absolute value of the parental expression difference (|A|). Note that assignment of genes to regulatory categories may differ depending upon which hybrid is used for the assignment. Therefore, this graph is specific to categorizations based on hybrid F1–H16. B, Parental expression difference (A). C, Significance levels for genes in different regulatory categories versus expression bias (< 0 indicates N. lutea allele is more highly expressed; > 0 indicates N. nucifera allele has higher expression). Vertical dotted lines: 2 fold changes in allele expression level in parents, |log2 (NN/NL)| = 1. Horizontal dotted lines: the significance cutoff, log10 (P value) = 1. D, Absolute value of cis-regulatory divergence (|B|). E, Cis-regulatory divergence (B). F, Significance levels of B for genes in different regulatory categories versus expression bias. The significance of deviations from 0 in b and e is indicated by a star (Student's t test, P value < 0.05). Vertical dotted lines: two-fold changes in allele expression level in parents, |log2 (NN/NL)| = 1. Horizontal dotted lines: the significant cutoff, log10 (P value) = 1. Corresponding plots for all stages in F1–H8 and stages 2–4 of F1–H16 are shown in Supplemental Figures 2–5.
As indicated above, among all DEGs, the proportion of genes in the cis-only category is greater than the proportion in the trans-only category. However, this pattern differs depending on which parent shows higher expression of the gene. For genes with higher expression in N. nucifera (A > 0), the pattern is similar to the overall pattern: a significantly higher proportion (average 19.86%) were categorized as cis-only than were categorized as trans-only (average 9.50%) at the four developmental stages (Figure 2C; Supplemental Figures 4 and 5; Supplemental Table 3; χ2 test of independence, Bonferroni-corrected P < 0.0001 for all four developmental stages based on the two hybrids). By contrast, among genes with higher expression in N. lutea (A < 0), the opposite trend occurred: more were categorized as trans-only (average 20.16%) than cis-only (average 14.47%) from stages 1–4 (Figure 2C; Supplemental Figures 4 and 5; Supplemental Table 3; χ2 test of independence, Bonferroni-corrected P < 0.0001 for all four developmental stages based on the two hybrids). This means that genes with significantly higher expression in N. lutea tend to be in the trans-only regulatory category, whereas genes with significantly higher expression in N. nucifera tend to be in the cis-only category. This is likely that there is a burst of TE insertions in one of the two species after they split, and consequently, all the promoters with the TE insertions changed their binding capacity of certain TFs for this parental genome; however, future detailed analysis is needed.
The magnitude of the cis-regulatory effect, |B|, differed significantly among the regulatory categories. It was the largest for cis-only genes (Wilcoxon rank-sum test, P values < 0.05 for all stages after Bonferroni correction). Generally, cis-only, cis–trans compensating and compensatory genes tended to have a higher expression of NN alleles than NL alleles (B > 0), whereas cis + trans enhancing genes tended to have higher expression of NL alleles (B < 0; Figure 2E; Supplemental Figures 2D and 3D; Student's t test Bonferroni-corrected P values < 0.05). Over all developmental stages, on average 26.77% of DEGs with significant allelic-biased expression in the two hybrids were in the cis-only regulator, while the proportion under trans-only regulation was only about 1/10 as much (2.31%; Figure 2F; Supplemental Figures 4 and 5). Among genes in the cis–trans compensating or compensatory categories, the direction of regulatory change in the parents tended to be opposite the direction of cis-regulatory change (i.e. the sign of A is opposite that of B; Figure 2; Supplemental Figures 2–5), implying that trans-variants could tend to act antagonistically to reverse the directional bias of cis-variants by upregulating NL allele expression in the hybrids.
Genes in different regulatory categories exhibit different inheritance modes
Genes in different regulatory categories were associated with different modes of inheritance of gene expression in F1 hybrids (see Methods and Materials for the definition of inheritance mode). For example, at stage S1 in one hybrid (F1–H16), we found that approximately 80% of DEGs in the cis-only regulatory category exhibited additive inheritance, with about 20% showing dominant inheritance (χ2 test of independence, χ2 = 157.77, df = 1, P value < 0.0001; Figure 3A). By contrast, about 60% of genes in the trans-regulatory category exhibited dominant inheritance, while only about 30% exhibited additive inheritance (χ2 = 151.69, df = 1, Bonferroni-corrected P value < 0.0001; Figure 3A). Over all developmental stages, of genes differentially expressed in the parental species (those with A ≠ 0), more than half (51.7%) exhibited additive expression, while approximately 42.6% showed dominant expression (Figure 3B). Genes under cis-only regulation were significantly enriched for additive inheritance but depleted of dominance and transgression (based on significance of cell-specific χ2 values for these categories, an indicator of which cells contribute most to the overall χ2 value; P values < 0.001, df = 1, sequential Bonferroni corrected in each case). In contrast, dominant inheritance appears to be over-represented among trans-only genes and under-represented among cis-only genes (P values < 0.001 in both cases). Genes exhibiting cis + trans compensating regulation were significantly enriched in transgressive inheritance and depleted in additive inheritance P value < 0.05 after Bonferroni correction in both cases (Figure 3B; Supplemental Table 1). Overall, the mode of inheritance for different regulatory categories of F1 hybrids is consistent with those observed in hybrid cotton that additivity and dominant inheritances were mainly over-presented in cis-only and trans-only genes, respectively (Table 1; Bao et al., 2019). And we also conclude that cis–trans compensating regulation (A ≠ 0), i.e. the evolution of cis- and trans-regulation in opposite directions, often contributes to altered expression levels or misexpression in hybrids.
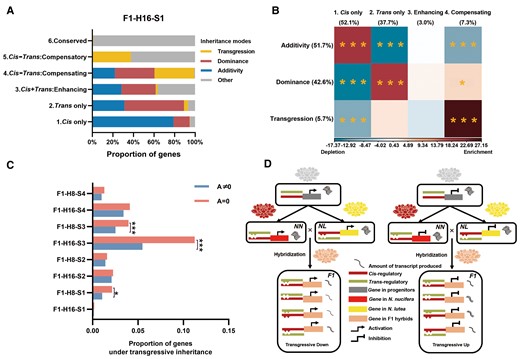
Genes from different regulatory categories exhibit different inheritance modes. A, The proportions of genes exhibiting different inheritance modes for six regulatory categories at S1 in the F1–H16 hybrid. Corresponding results for other stages in F1–H16 and S1–S4 in F1–H8 are shown in Supplemental Table 1. B, The relationship between the regulatory category and inheritance mode for genes exhibiting differential expression among the parental species (A ≠ 0). For each intersection of inheritance (rows) and regulatory category, the color indicates the intensity of gene enrichment (red) and depletion (blue) according to residuals of Pearson's χ2 test of independence. Statistical significance is based on χ2 test (overall χ2 = 2,316.19, df = 6, P value < 0.0001), as indicated by *P value < 0.05, **P value < 0.01, ***P value < 0.001, adjusted by sequential Bonferroni correction. C, Differences between genes with A = 0 and genes with A ≠ 0 in proportion showing transgressive inheritance. The sample size (N) is 24. (N = 4-time points × 2 F1 hybrids × 3 biological replicates per F1 hybrid; χ2 test of independence, *P value < 0.05, ***P value < 0.001, adjusted by sequential Bonferroni correction). D, A model for transgressive inheritance (misexpression) in genes with compensatory cis- and trans-regulatory categories (see text for explanation).
Summary of conclusions based on genes with cis- or trans-regulation effects among Nelumbo, Arabidopsis, and cotton
| Questions | Results | Interspecific hybrids | Intraspecific hybrid | |
|---|---|---|---|---|
| Nelumbo | Arabidopsis | Gossypium hirsutum | ||
| Do cis- and/or trans-regulation effects have different inheritance modes? | cis-regulatory effect: additive | ✓ | ✓ | ✓ |
| trans-regulatory effect: dominance | ✓ | ✓ | ✓ | |
| Compensatory regulation: transgressive | ✓ | N/A | ✓ | |
| Do trans-regulated genes have broader expression breadth? | trans-regulatory: expressed in more tissues | ✓ | ✓ | N/A |
| cis-regulatory: expressed in fewer tissues | ||||
| Do cis-regulated genes have lower expression levels? | trans-regulatory: higher expression level | ✓ | ✓ | N/A |
| cis-regulatory: lower expression level | ||||
| Do WGD genes tend to have trans-regulatory effects? | Genes with trans-regulatory effects are more divided into genome-wide duplication events | ✓ | × | × |
| Are orphan genes unlikely to have any cis- or trans-regulatory effects? | Orphan genes tend to show cis-only and conserved regulatory effects | ✓ | × | ✓ |
Note: ✓, results were consistent among species; ×, results were inconsistent among species.
N/A: not available.
In cases of dominant inheritance, the dominant allele tended to exhibit a bias toward one parent or the other. Overall, N. lutea (NL) dominance (accounting for 66.22% of all cases of dominance) was almost two times higher than N. nucifera (NN) dominance (33.78%; Supplemental Table 1). Among all DEGs with dominance inheritance, dominance was almost complete: expression in the hybrid was very similar to that of one of the parents. Nevertheless, the dominant allele tended to be the one from the parent with higher expression. For all stages in both hybrids, the dominant allele was from the parent with a higher expression. In particular, this pattern was exhibited by 59.21%–79.45% of dominant genes (Supplemental Table 4). This is likely because transcription activator alleles that cause higher expression of the target gene tend to be dominant over alleles causing lower expression, while repressor alleles that cause lower expression of the target gene tend to be dominant (Porter et al., 2016), which suggest that trans-regulatory divergence between the Nelumbo species primarily involves the evolution of transcription activators. Besides, a similar pattern was exhibited by genes showing transgressive inheritance. Most (91.9%) of these genes exhibited transgressive up-regulation, whereas only 8.1% exhibited transgressive down-regulation (Figure 3B; Supplemental Table 1).
Some of the 61.7% of DEGs were not differentially expressed between the parental species (i.e. A = 0). Of these, a small fraction (3.51%) exhibited transgressive expressions in hybrids (i.e. expression levels were different from that of the parents). These transgressive genes fell mostly into the two regulatory categories of conserved and compensatory, a pattern similar to that found in cotton (Figure 3C; Table 1; Supplemental Table 1; Bao et al., 2019). For all genes showing transgressive inheritance, a smaller fraction was differentially expressed in parents (A ≠ 0) than were not differentially expressed (A = 0) at the initial flowering stage (S3; χ2 test of independence, χ2 = 12.376, df = 1, Bonferroni-corrected P value < 0.001; Figure 3C). For transgressive genes with compensatory regulation, transgressive expression can be accounted for by a simple model of evolutionary divergence in binding-site recognition by TFs (Figure 3D). It is envisioned that during divergence between the two species, genetic drift or compensatory change caused both cis-regulatory binding sites and their corresponding TF binding-site recognition sequences to diverge, such that the binding site from one species is no longer recognized by the TF from the other species (a type of developmental system drift; Weiss and Fullerton, 2000; True and Haag, 2001; Payne and Wagner, 2019). When this process involves a transcription activator of a gene (Figure 3D, left), gene expression in the hybrid will be lower than that in the parents because the mismatching binding sites and TF recognition sites will produce fewer or no transcripts. In contrast, when this process involves transcriptional repression (Figure 3D, right), the mismatch reduces repression and thus allows more transcripts to be produced. By offsetting cis- and trans-effects, compensatory regulation helps the organism stabilize gene expression during species evolution (Landry et al., 2005; Takahasi et al., 2011).
Evolution of petal coloration as a consequence of regulatory changes in coexpression networks
In this section, we characterize gene regulatory networks for anthocyanin and carotenoid pigment production to determine whether trans-regulatory variants are more likely than cis-regulatory variants to contribute to the evolution of floral pigmentation. Although the enzyme-coding genes, and a few TFs, associated with pigment biosynthetic pathways are well described (Tanaka et al., 2008), little is known about the identity of upstream regulators. To identify these unknown regulators, we constructed anthocyanin and carotenoid coexpression networks using weighted correlation network analysis (WGCNA) which can help to identify key coexpressed gene modules significantly associated with petal pigment content changes (Supplemental Note 1; Figure 4; Supplemental Figures 6–16).
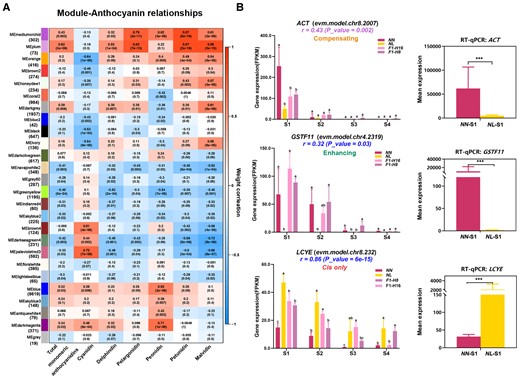
WGCNA of differentially expressed genes. A, Heatmap of relationships between genes with similar expression patterns in WGCNA modules and anthocyanin productions. Numbers in cells are the weight correlations (a measure of correlation of expression levels) between levels of specific anthocyanidins and individual modules, which consist of DEGs with similar expression patterns across samples and stages. P values of correlations are in parenthesis. Module names and the number of genes in modules are on the left of the heatmap. Anthocyanidins are indicated along the bottom of the heatmap. Cell color encodes signs of correlation (red with positive correlation; blue with negative correlation), while the intensity of the color indicates the magnitude of the correlation, as specified by the key to the right. B, Left graphs: Mean ± standard deviation (SD) of expression (as measured by FPKM) of two ABP-related genes (ACT, GSTF11) and one CBP-related gene (LCYE) at the four developmental stages (S1–S4) in the two species and the two hybrids (N = 48, 4-time points × 4 plant individuals × 3 biological replicates per individual). The r value correlations between expression level with pigment content. Different lowercase letters (a, ab, b, bc, c) above the bars indicate significant differences among taxa within a developmental stage as revealed by Duncan's multiple range test (P value < 0.017 for multiple comparisons). Means with the same letter (b and c) were not significantly different. Right graphs: the mean expression levels obtained from RT-qPCR for the same three genes in the two species (three replicates) at stage S1 (Student's t test, ***P value < 0.001). Y axis: Mean Expression (2−ΔΔCt). Error bars represent the SD for three biological replicates in the two lotus species.
As the first step in this analysis, we characterized pigment differences between the two species (Supplemental Note 1; Supplemental Figures 6–9). Malvidin, petunidin, and cyanidin synthesized via the ABP, and lycopene and lutein produced via the CBP contribute the most to the difference in coloration between the two lotus species (Supplemental Note 1; Supplemental Figures 7 and 9A).
WGCNA identified 26 network modules (a set of genes with similar expression patterns across species and stages) associated with anthocyanin production and carotenoid production, respectively (Figure 4A; Supplemental Figure 9B). We identified a total of 7,803 and 8,234 hub genes (those with the most connections to other genes in a module) in all modules (excluding the gray color module) in anthocyanin- and carotenoid-WGCNA coexpression networks, respectively (Supplemental Table 5). Notably, at stage S4, 53.51% and 55.48% of trans-only in anthocyanin-WGCNA and carotenoid-WGCNA were hub genes, respectively. Only at stage 4 were hub genes significantly associated with specific regulatory categories (Supplemental Figure 10). For both anthocyanin and carotenoid modules at stage 4, hub genes were over-represented among trans-only genes and under-represented among conserved genes, as judged by the significance of the individual cell χ2 values (Supplemental Table 6; all P values < 0.05 after sequential Bonferroni correction). This pattern suggests that trans-only genes are more likely to function as hubs in coexpression networks for the latest stage.
For hub genes in the anthocyanin and carotenoid modules, the modes of inheritance differed among regulatory categories at each stage (Supplemental Figure 11; P values < 0.0001 after Bonferroni correction for all tests; Supplemental Table 7). In general, judging by the size of the cell χ2 values (Supplemental Table 7), several general patterns emerge: (1) additivity and dominance are over-represented in cis-only and trans-only genes; (2) transgressive inheritance is over-represented in compensating and compensatory genes; (3) additivity and dominance are under-represented in conserved genes; and (4) other inheritance is over-represented in conserved genes. Separate 2 × 2 contingency tests of the association of additivity and dominance with just cis-only and trans-only genes indicate that for both anthocyanins and carotenoids, cis-only genes tend to be more associated with additive inheritance and trans-only genes with dominant inheritance (Supplemental Table 8; for all tests, P values < 0.01 after sequential Bonferroni correction).
To further understand the types of regulatory change associated with pigment divergence, we performed analyses on genes known from prior studies to be associated with pigment pathways. Among genes in the anthocyanin-WGCNA networks, 51 were identified by BLASTing Nelumbo genes to the Arabidopsis gene set to be most similar to the known anthocyanin-pathway. Of these, 22 (14 structural genes (SGs) and 8 TFs) exhibited cis- and/or trans-regulatory divergence (e.g. are categorized as being in any of the regulatory categories except conserved and ambiguous), while 29 genes (19 SGs and 10 TFs) showed no cis- and/or trans-regulatory divergence. Similarly, we identified nine genes (seven SGs and two TFs) known to be associated with the CBP and showing cis- and/or trans-regulatory divergence between the two species, while eight “known” carotenoid genes (six SGs and two TFs) showed no detectable cis- and/or trans-regulatory divergence (Supplemental Note 2; Figure 4B; Supplemental Figures 12 and 13; Supplemental Table 9). On average, the percentages of known ABP-related genes and CBP-related genes with additive inheritance were 48.82% and 52.46%, respectively, with corresponding percentages of 31.00% and 36.07%, for dominant inheritance, and 20.18% and 11.47% for transgressive (Supplemental Table 9). This pattern is also consistent with the patterns of inheritance of the number of pigments produced: additive inheritance was most frequent for both anthocyanidins (39.3% of genes with additive, dominant, or transgressive inheritance) and carotenoids (34.5%), followed by dominant inheritance (32.1% and 34.5%) and transgressive inheritance (28.6% and 31.0%; Supplemental Table 10). This consistency suggests that cis- and trans-regulatory changes in known anthocyanin and carotenoid genes contributed substantially to the divergence in flower color between the two lotus species.
To gain more insight into how changes in “known” anthocyanin and carotenoid genes may have contributed to the pigment differences between the two Nelumbo spp., we examined the expression patterns of some of these genes (Supplemental Note 2; Figure 4B; Supplemental Figures 12 and 13; Supplemental Table 9). Here, we focused on two anthocyanin genes. Although N. lutea produces substantial amounts of anthocyanidins, the lack of red pigments suggests that these compounds are either not successfully converted to anthocyanin derivatives (e.g. because of ANTHOCYANIN 5-AROMATIC ACYLTRANSFERASE, ACT, down-regulation) or the anthocyanins are not successfully transported to vacuoles (e.g. because of GLUTATHIONE S-TRANSFERASE F11, GSTF11, down-regulation; Supplemental Figures 7 and 12). Although lack of red pigments could also be caused by down-regulation of UDP-GLUCOSE: FLAVONOID 3-O-GLUCOSYLTRANSFERASE, UFGT, there was no consistent change in gene UFGT expression across stages, so we did not examine this gene. We also examined the carotenoid gene cyclase (LYCOPENE Ε-CYCLASE, LCYE), which converts lycopene to lutein, because lycopene levels were similar in the two species, but lutein levels are much lower in N. nucifera than in N. lutea (Supplemental Figures 9 and 13; Supplemental Note 1).
The expression levels, estimated by FPKM from transcriptomes, of both ABP genes ACT and GSTF11 were lower in N. lutea than in N. nucifera at S1 and S2, which may account for reduced anthocyanin production in N. lutea at these stages (Duncan's multiple range test, P value < 0.017 for these pairwise comparisons; Figure 4B; Supplemental Table 9). By contrast, the expression of the CBP gene, LCYE was higher in yellow lotus than in red lotus in all four developmental stages (Duncan's multiple range test, P value < 0.017 for these pairwise comparisons; Figure 4B; Supplemental Table 9), suggesting that the difference in expression of this gene between species may contribute to the reduced carotenoid levels in N. nucifera. As a check on these results, we quantified the expression of these genes in stage 1 using RT-qPCR and obtained similar results: ACT and GSTF11 exhibited much higher expression in N. nucifera than in N. lutea (Student's t test, P value < 0.001 for both genes); and the expression LCYE was significantly higher in N. lutea than N. nucifera (Student's t test, P value < 0.001; Figure 4B). We also quantified expression levels of these genes in one additional accession of each species (pink-flowered accession GSE57601; FPKM data from a previous study, Zhang et al., 2014; yellow-flowered accession SAMN18061995 from our laboratory; data from transcriptome analysis). Expression patterns in these accessions were similar to those reported above (Supplemental Figure 14).
GSTF11 as a critical anthocyanin gene in petal color differentiation
To determine whether differences in GSTF11 expression between species can be explained by interactions between its promoter and TFs, we used the Integrative Genomics Viewer to characterize differences in the numbers of reads from regions of the genome containing this gene. GSTF11 is regulated by cis + trans enhancing category based on F1 hybrid data, which means that both cis- and trans-effects contribute to expression differences between the species. The contribution of a cis-effect to differential expression is confirmed by read mapping: the proportion of RNA-sequencing (RNA-seq) reads corresponding to the N. nucifera and N. lutea alleles at a SNP at position 45,223,839 in the coding region on Chromosome 4 (Figure 5A, left black box) were 0.66:0.34 in F1–H16 hybrid and 0.69:0.31 in F1–H8 hybrid, respectively. A similar pattern was found in another position 45,226,248 (Figure 5A, right black box), where the NN:NL proportions were 0.60:0.40 for F1–H16 and 0.65:0.35 for F1–H8. These results suggest that the N. nucifera allele has a stronger promoter. Consistent with this suggestion, there is a 480-bp deletion in the promoter region in N. lutea (Figure 5A).
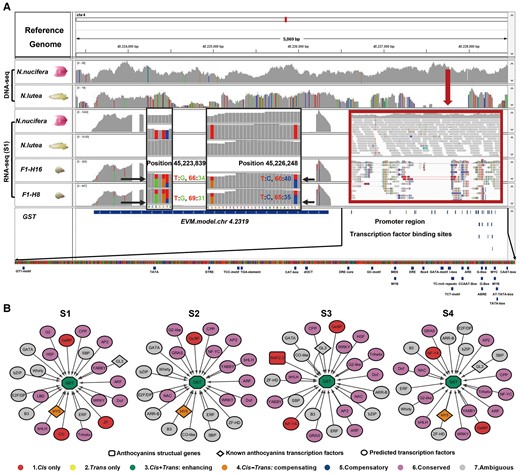
Characterization of GSTF11. A, The IGV profile of gene and promoter information for GST11. The gray histograms for each species or hybrid indicate the relative proportion of reads associated with a 50,000 bp window in the region containing the gene. Colored bars indicate sites with nonreference SNPs. The black arrows and black boxes (Positions 45,223,837–45,223,843 and Positions 45,226,223–45,223,849) indicate regions analyzed for expression divergence of GSTF11 between the two lotus species and the ASE between the two lotus hybrids. The red, blue, orange, and green bars in black boxes represent the relative proportions of T, C, A, and G bases, respectively, at individual nucleotide sites. Gray bars represent sites that were not polymorphic. “T:G” and “T:C” represent the proportions of each base at the SNP locus. The red arrow and red box indicate the deleted region of the GSTF11 promoter in N. lutea compared to N. nucifera. Blue rectangles below the expanded promoter region at the bottom indicate predicted binding-site motifs. B, Gene regulatory networks (GRNs) of GSTF11 and TFs in the “blue” module based on WGCNA as predicted by Genie 3 and Cytoscape for each developmental stage. Arrows represent the direction of regulatory interaction: from TFs to target genes. Predicted TFs were identified based on sequence similarity with Arabidopsis genes. The color of the TF indicates its regulatory category.
We used PlantCARE to identify 200 candidate transcription factor binding sites (TFBSs) in the GSTF11 promoter region and subsequently scanned for differences between the two species (Supplemental Table 11). Because anthocyanin production is often responsive to light and hormones (Grotewold, 2006), several of these motifs are of particular interest. For example, the Box4, GATA, I-box, and G-box motifs that were predicted to involve in light responsiveness might be regulated by SNPs likely influencing anthocyanin transportation in N. lutea (Figure 5A). Additionally, the auxin-responsive TGA motif, the light-responsive TCCC motif, and the abscisic-acid-responsive ABRE motif are all located in the region deleted in N. lutea, which could contribute to reduced accumulation of anthocyanin (Figure 5A).
We identified candidate direct regulatory links between TFs and GSTF11 from the “blue” WCGNA module consisting of GSTF11 and other genes associated with it using the software Genie3 (Huynh-Thu et al., 2010) and the visualization software Cytoscape3.1 (Saito et al., 2012). The majority of predicted TFs associated with GSTF11 showed conserved or ambiguous regulation, suggesting they are not relevant for expression divergence in GSTF11 (Figure 5B). The remaining predicted TFs exhibited either cis-only or cis–trans compensating regulatory variation and thus may contribute to divergence in GSTF11 expression (Figure 5B). Two of these are of particular interest. One is the TF LONG HYPOCOTYL 5 (HY5) with cis–trans compensating effect, which was predicted to interact with GSTF11 in three of the four developmental stages. It is involved in light-regulated transcriptional activation of G-box containing promoters (Burko et al., 2020) and may be relevant if anthocyanin production in Nelumbo requires light activation. The second is GL1 ENHANCER BINDING PROTEIN (GeBP), which was found in all four developmental stages and is involved in the hormone signaling pathway (Chevalier et al., 2008). Two others of perhaps lesser relevance are CONSTANS (CO; with cis-only effect), which is involved in the regulation of flowering under long days (An et al., 2004), but was present in the module only in one developmental stage; and NUCLEAR FACTOR Y, SUBUNIT A (NF-YA) which regulates photoperiod-mediated flowering time was present in only two developmental stages (Zhao et al., 2016).
Factors associated with the occurrence of different categories of regulatory mutations
The magnitude of pleiotropic constraint on a gene is believed to influence the probability that mutations in that gene contribute to divergence. In particular, it has been argued that cis-regulatory changes are less likely to incur large pleiotropic costs and are thus more likely to contribute to divergence than trans-regulatory mutations, yet there are few tests of this hypothesis (Gruber et al., 2012). Here, we quantified gene attributes that have been used as proxies for pleiotropic constraint on genes with different categories of regulation during lotus evolution (Paaby and Rockman, 2013; Auge et al., 2019). We also performed the same analyses on data from Arabidopsis and cotton to assess whether these species show similar patterns (Shi et al., 2012; Bao et al., 2019). We examined several factors that have previously shown to affect pleiotropic constraint (Paaby and Rockman, 2013), functional differences (SGs versus regulatory genes; Auge et al., 2019), differences in expression level and breadth (Pal et al., 2006), and differences in gene redundancy, which allows duplicates to escape from their original pleiotropic constraint (Des Marais and Rausher, 2008).
We first asked whether there were any functional differences among genes with various regulatory categories using gene ontology (GO) enrichment analysis because our a priori expectation was that changes in regulatory and signaling genes have a stronger impact on the expression and function of downstream genes which they regulate, and thus likely have a higher pleiotropic constraint than SGs (Supplemental Table 12, Supplemental Note 3). Intriguingly, we found biases of functional enrichment among different regulatory categories (Supplemental Table 12, Supplemental Note 3). Genes with cis-only regulatory variants were enriched in many metabolic processes, such as organic acid metabolic processes, oxidation-reduction process, and oxidoreductase activity, reflecting fewer pleiotropic constraints of SGs or gene sets enriched in enzymes. In contrast, genes with trans-only regulatory changes were enriched in GO terms such as regulation of the response to stress, small molecule biosynthetic process, and regulation of signaling, suggesting the greater pleiotropic constraints of “regulatory genes”. Among genes under other regulatory categories, genes in the cis + trans enhancing category were also enriched in many metabolic processes; genes with cis–trans compensating effects were associated with several acid metabolic processes and the stress response, and genes with compensatory effects were mainly enriched in GO terms such as oxidoreductase activity and stress response. Finally, genes with conserved regulation were enriched in the synthesis of the basic biological and molecular processes involved in maintaining growth and developmental stability, such as DNA replication and ATP binding, indicating that housekeeping functions have the greatest pleiotropic constraints.
Given the implication that genes under different regulatory categories were enriched in functions that seem to be different in pleiotropic constraint, we further tested the hypothesis that cis-only and trans-only genes differed in expression breadth, expression level, or mode of duplication, proxies for pleiotropy (Figure 6; Supplemental Figures 17–20). We confine our analyses to cis-only and trans-only genes because there were few genes in other nonconserved regulatory categories. Genes with trans-only regulation exhibited a broader expression breadth (number of tissues in which gene is expressed) based on 19 different tissues (leaf, petal, rhizome, root, etc.) from lotus cv. “China Antique” (Zhang et al., 2019b; Li et al., 2021) and a higher expression level than genes with cis-only regulation (Kruskal–Wallis test, adjusted P value < 0.01 after multiple comparisons), similar to findings in Arabidopsis (21 different tissues from Arabidopsis; Figure 6, A and B; Supplemental Figure 17; Supplemental Tables 13 and 14; Shi et al., 2012; Klepikova et al., 2016). This pattern is in line with the notion that cis-expression changes can have relatively small pleiotropic effects because their effects are often tissue-specific (Gompel et al., 2005; Hill et al., 2021).
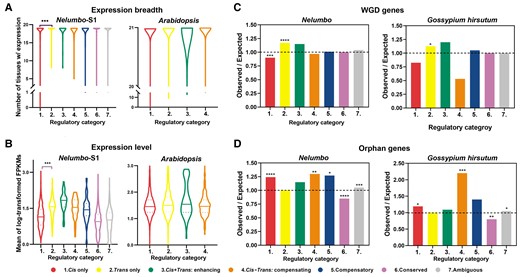
Association of genes in different regulatory categories with the proxies of pleiotropic constraint in nelumbo, Arabidopsis and Gossypium hirsutum. A, Differences in expression breadth for genes with different regulatory categories in Nelumbo with 19 different tissues and Arabidopsis with 21 different tissues (Kruskal–Wallis test, *** P value < 0.001 after Benjamini–Hochberg correction for multiple comparisons). The violin plot shows the summarizing ranges of genes with different regulatory categories in different tissues (violin contours). B, Average expression level (log-transformed FPKMs) for genes with different regulatory categories in Nelumbo with 19 different tissues and Arabidopsis with 21 different tissues (Kruskal–Wallis test, *** adjusted P value < 0.001 for multiple comparisons). Horizontal solid lines represent median values, and dashed lines represent lower/upper quartiles. C, The ratio of the observed number of WGD genes (duplicate genes retained from ancient WGD) to the expected number of WGD genes. The proportion of WGD genes that have both putative paralogs retained for genes in different regulatory categories (colored bars). D, The ratio of the observed number of orphan genes (genes that lack detectable similarity to genes in other species) to the expected number of orphan genes. The proportion of orphan genes under cis- and/or trans-regulation (colored bars). In c and d, the black dashed line indicates the ratio of 1, i.e. observed numbers = expected numbers. Ratios > 1 indicate there are more genes than expected, while ratios < 1 indicate there are fewer genes than expected (χ2 test of independence, *: P value < 0.05, **: P value < 0.01, ***: P value < 0.001). Corresponding violin plots and bar graphs for other stages and other duplications are shown in Supplemental Figures 17–19.
To test whether gene duplication status differs among genes in different regulatory categories, we classified all lotus genes into the following duplication categories (Shi et al., 2020): whole-genome duplication (WGD) genes or genes retained from WGD (10,347, ∼28.90%), dispersed duplicates (13,702, ∼38.28%), proximal duplicates (1,777, ∼4.96%), tandem duplicates (2,464, ∼7.39%), singletons (single copies; 7,320, ∼20.45%), and orphan genes (lotus genes without any homolog to other taxa; 13,241, ∼41.21%; Figure 6, C and D; Supplemental Figures 18 and 19). To infer whether genes of a specific duplication type show enrichment in one or several regulatory categories, we also compared their relative proportions in each regulatory category to the background (all DEGs) by χ2 tests. We excluded genes with cis + trans enhancing, cis–trans compensating, and compensatory regulation because their low numbers preclude statistically meaningful comparisons.
The corresponding results in lotus across all developmental stages were mostly consistent with cotton (Figure 6, C and D; Supplemental Figure 18). There was a significant over-presentation of cis-only in orphan genes and significant enrichment of trans-only in WGD (-derived) genes (χ2 test of independence, all P value < 0.05); conserved regulation was significantly enriched in singletons (χ2 test of independence, P value < 0.01) and depleted in orphan genes (χ2 test of independence, P value < 0.01). These results indicate that, for both small-scale and large-scale (WGD) duplications, genes in different regulatory categories differ in the probability of duplicate retention. The ancient WGD genes are under stronger pleiotropic constraints, which are observed to be more likely to be regulated by trans-only category (Shi et al., 2020). More importantly, single-copy genes are most conserved and are less susceptible to any regulatory changes during lotus evolution, likely because they are mostly housekeeping genes with the greatest pleiotropy (De Smet et al., 2013). Yet, for Arabidopsis, we could not reject the null hypothesis that the duplication category was independent of the regulatory category (χ2 test of independence, χ2 = 13.7189648, df = 15, P value = 0.453; Supplemental Figure 19). The absence of a significant association between regulatory categories and duplication types in Arabidopsis was perhaps due to the fact that the tissue the authors investigated was rosette leaves before bolting (flowering), which are not very divergent phenotypically. Therefore, future investigation of more phenotypically diverged tissues in Arabidopsis species might help to address this issue.
Because pleiotropy frequently influences the rate of sequence change during species divergence, we further tested whether genes in different regulatory categories differ in substitution rate in the promoter region, including in our analysis cis-only, trans-only, cis + trans (enhancing, compensating, compensatory), and conserved regulatory categories. A total of 1,734,107 biallelic “high-quality” SNPs differentiate the promoter region (2 kb upstream of genes) of genes in the two species. The average SNP occurrence rate (the number of SNPs per kb gene region) in the promoter regions of cis-only genes was significantly higher than that of trans-only genes for all four developmental stages (Kruskal–Wallis test, all adjusted P values < 0.05 after adjusting multiple comparisons; Supplemental Figure 20A). For gene coding regions, 703,513 SNPs were detected. In the coding regions, genes with cis-divergence showed significantly higher SNP occurrence rates than genes without cis-regulatory divergence (cis-only or cis + trans > trans-only, Kruskal–Wallis test, all adjusted P values < 0.05 after correction for multiple comparisons) in all developmental stages, except for trans-only genes, which showed no significant difference from cis + trans genes in stage S2 (Supplemental Figure 20B). Additionally, in all developmental stages, genes with cis-regulatory sequences tended to display higher dN/dS ratios than those exhibiting trans-only, though this trend was not statistically significant (Kruskal–Wallis test, adjusted P values > 0.05 for multiple comparisons; Supplemental Figure 20C). These differences in SNP occurrence rates indicate that genes in categories that include cis-regulation generally evolve slightly faster, on average, in both promoter and coding regions, while genes with trans-only variants evolve more slowly, which suggests that trans-only variants are subject to the stronger pleiotropic constraint than variants involving cis-regulation.
Discussion
The relative contribution of cis- and trans-variants to lotus gene expression and petal color evolution
Several recent studies have investigated the relative contribution of genes in different cis- and trans-regulatory categories to expression rewiring on a genome-wide level (Signor and Nuzhdin, 2018). These studies reveal no uniform pattern in either the number of genes in different regulatory categories among DEGs, or in the relative magnitude of effects on expression differences between species (Tirosh et al., 2009; McManus et al., 2010). In our study, the number of genes with cis-only changes was approximately 1.35 times greater than the number of the genes with trans-only changes (Figure 1, C and D), while trans-regulatory variants generally had a larger effect on the magnitude of gene expression difference between the two lotus species than cis-regulatory variants (Supplemental Table 2). Compared to a previous report of an ASE analysis within N. nucifera specifically dealing with cis-changes (Gao et al., 2021), we found that the number of genes with cis-acting substitutions between the two species (7.01% ∼ 11.90% in our current study) was two times greater than the number previously detected within a single lotus species (2.12% ∼4.50%). This difference is also in line with previous studies concluding that natural selection tends to eliminate most trans-acting mutations and favor accumulation of cis-regulatory mutations over time (Denver et al., 2005; Zhang et al., 2019a).
The relative frequency and effects of cis- and trans-regulatory variants in our study are similar to those reported for some comparisons but differ from those found in other studies. In cotton, despite the number of cis-only genes (1.65%) being higher than that of trans-only (1.01%) genes, genes with only trans-effects accounted for a larger proportion of the overall expression change (cis-effects: ∼42.5%, trans-effects: ∼57.5%) between interspecific hybridization (Bao et al., 2019). Arabidopsis exhibits yet another pattern: cis-regulatory divergence plays a larger role in expression differences both in numbers (cis-only: ∼18.86%, trans-only: ∼7.74%) and effects (cis-effects: ∼54%, trans-effects: ∼45%; Shi et al., 2012). Camellia also showed the same regulatory pattern in numbers and effects (cis-only: ∼18.86%, trans-only: ∼7.74%; cis-effects: ∼10.31%, trans-effects: ∼8.24%) as Arabidopsis (Zhang et al., 2019a). In contrast, the regulatory mode in interspecific Coffea (Coffea canephora and C. eugenioides) hybrids (cis-only: ∼15.5%, trans-only: ∼18.5%; cis-effects: ∼32%, trans-effects: ∼35%) was not consistent with interspecific hybrids for Arabidopsis and Camellia (Combes et al., 2015). There thus seems to be no general pattern for the relative numbers and effects of the genes in these two regulatory categories. What can be concluded is that both cis- and trans-regulatory mutations play important roles in gene expression rewiring (Zhang et al., 2019a).
Other than cis-only or trans-only genes, a small portion of genes in our study experienced both cis- and trans-changes during species divergence. Of these, genes in which cis- and trans-changes are in the opposite direction (genes in the cis–trans compensating and compensatory categories; effects in opposite directions) are substantially more abundant than genes for which the effects are in the same direction (e.g. the cis + trans enhancing category; Figure 1, C and D). This pattern, which is also seen in other studies (Wittkopp et al., 2004; Shi et al., 2012; Bao et al., 2019), suggests that stabilizing selection on expression is more common than divergent selection.
Our analysis of the cis- and trans-regulatory effects of genes underlying petal color change between Nelumbo species was conducted to assess the relative impact of cis- and trans-divergence on specific traits. Based on WGCNA, hub genes (those with more connections to other genes in a module) significantly associated with ABP and CBP are more likely to be trans-only than cis-only, and are more likely to contribute to the floral color divergence between N. nucifera and N. lutea, but only at developmental stage 4 (Supplemental Figure 11). This result aligns with the pattern that trans-effects have a greater impact on the magnitude of parental expression differences than cis-effects at the whole-genome level in the petal tissues (Supplemental Table 2). Because the WGCNA requires phenotypic characterization (Langfelder and Horvath, 2008), content differences in anthocyanins and carotenoids are another focus of this study. We found concentrations of anthocyanidins that were substantially higher than the concentrations of anthocyanins previously reported (Deng et al., 2013; Zheng et al., 2022). This is not surprising because anthocyanidins are precursors of anthocyanins, with the former being glycosylated and acetylated to form the latter. In biochemical pathways at equilibrium, intermediate and final compounds are not necessarily at the same concentration (Jin et al., 2016; Shih and Morgan, 2020), and this can also be true of nonequilibrium conditions. We thus attribute the higher concentrations of anthocyanidins we report compared to previous reports of anthocyanins in part to pathway kinetics. In addition, compared to other studies (Chen et al., 2013; Deng et al., 2013), which found that the main anthocyanin component was malvidin 3-O-glucoside, we found that the anthocyanidin delphinidin was substantially higher in concentration than malvidin (6,109.63 µg g−1 versus 1,738.46 µg g−1, respectively; Supplemental Figure 7). This pattern suggests that delphinidin might not fully undergo glycosylation, acetylation, and transport into the vacuole, resulting in substantially lower delphinidin 3-O-glucoside concentrations compared to the anthocyanidin delphinidin. For N. lutea, we also found slightly higher concentrations of carotenoids than reported in a previous study (Zheng et al., 2022). While carotenoid content was high early in bud development, at the final developmental stage (comparable to the stage measured by Zheng et al. 2022), our estimate of total carotenoid content was only slightly higher than previously reported (∼5.3 µg g−1 versus ∼2.0 µg g−1, respectively). One possible explanation for this small difference is the difference in experimental protocol between our studies. While Zheng et al. used a 0.22-lm membrane filter, we used a 0.45-lm filter. The larger pore size in our filter may have allowed more carotenoids to pass the filter, thus producing a higher overall concentration in our study. A second possibility is that different cultivars were used in the two studies, since Zheng et al. (2022) do not report which cultivars were used for their pigment extractions. It is thus very possible that variation among cultivars in carotenoid production explains the difference in the two estimates. In addition, we report the production of the carotenoid astaxanthin, while Zheng et al. (2022) do not. Although this compound has been previously reported only from Adonis, a genus in the eudicot group Ranunculales, we are confident that this carotenoid is also produced by Nelumbo (another eudicot) because we detected it in 15 of 16 petal samples. In Adonis aestivalis, carotenoid β-ring 4-dehydrogenase enzymes (CBFD1 and CBFD2) and carotenoid 4-hydroxy-beta-ring 4-dehydrogenase enzymes (HBFD1 and HBFD2) were shown to be involved in astaxanthin synthesis in the carotenoid biosynthesis (Cunningham and Gantt, 2011). In our study, Nelumbo genes, evm.model.chr1.1318 (ortholog of Adonis CBFDs) and evm.model.chr7.536 (ortholog of Adonis HBFDs) were expressed in all petal stages, and can thus explain astaxanthin production (Supplemental Figure 21). Nevertheless, future experiments to test the enzymatic roles of these Nelumbo genes in astaxanthin synthesis are needed.
We identified 68 known genes with cis- and trans-regulatory variants in modules significantly associated with the ABP and the CBP according to homologous annotation (Supplemental Table 9). In this study, the anthocyanin genes ACT and GSTF11 have reduced expression in N. lutea. These genes promote glycosylation of nonacylated anthocyanidins and facilitate the accumulation of anthocyanins into vacuoles (Nakayama et al., 2003; Springob et al., 2003). Multiple validation experiments in carnation and gentian have shown that ACT exhibits high expression levels in the initial stage of petal development and is expressed independently of other genes in ABP (Matsuba et al., 2010; Diretto et al., 2019), suggesting it is necessary for production of many types of anthocyanins. In many plants, like Arabidopsis and maize, the knockout of multiple GSTs genes caused a large decrease in anthocyanins due to the loss of anthocyanins transport (Wagner et al., 2002; Goodman et al., 2004). It thus seems likely that the reduced expression of these two genes contributes substantially to absence of anthocyanins in N. lutea. In our study LCYE showed lower expression in N. nucifera. Because in Arabidopsis a loss-of-function mutant in its putative ortholog LUTEIN DEFICIENT 2 (lut2) decreases lutein content substantially (Pogson and Rissler, 2000), the reduced expression of LCYE in N. nucifera can account for the reduced accumulation of lutein, the primary carotenoid in N. nucifera. In addition to the three key genes (ACT, GSTF11, and LCYE) discussed above, we also showed that expression divergence of other ABP and CBP genes was also associated with regulatory variants involved in floral coloration (Supplemental Note 2; Supplemental Figures 12 and 13; Supplemental Table 9). For example, a SG in our study, F3′5′H (in the cis-only regulatory category), showed significantly higher expression at stage 1 in pink lotus than in yellow lotus, which was consistent with observations in beardlip penstemon (Penstemon barbatus; Wessinger et al., 2014). Overall, expression differences of specific ABP-related or CBP-related genes due to cis- and trans-regulatory variants are likely linked to the evolution of flower colors between the two lotus species. Importantly, further functional validations about these genes in our study are needed in future lotus studies.
The transgressive inheritance of genes from different regulatory categories and the causes of transgressive inheritance
Previous studies in Drosophila (McManus et al., 2010), yeast (Schaefke et al., 2013), and cotton (Bao et al., 2019) concluded that genes in different regulatory categories tend to have different modes of inheritance. Moreover, theoretical investigations suggest that cis-regulatory effects are more likely to exhibit additive inheritance, while trans-regulatory effects are more likely to exhibit dominance (Gaur et al., 2013; Porter et al., 2016). Our results also support these expectations.
F1 hybrids can exhibit altered phenotypes (transgressive phenotypes), both in natural populations and in crops. A literature review (Rieseberg et al., 1999) found that 44% of 1,229 traits examined were transgressive. In our study, of genes with transgressive inheritance, the number of genes for which F1 expression was higher than that of either parent was almost 10 times the number of genes for which F1 expression less than that of either parent. This pattern is similar to that in Canada thistle (Cirsium arvense; Bell et al., 2013), whereas the opposite pattern was detected in purpleosier willow (Salix purpurea; Carlson et al., 2017). In our study, transgressive inheritance was exhibited primarily by genes in the cis–trans compensating or compensatory regulatory categories. A similar pattern is reported in a number of other studies (Landry et al., 2005; Go and Civetta, 2020; Mugal et al., 2020; Sanchez-Ramirez et al., 2021). It thus appears that transgressive expression generally tends to result from the opposing effects of cis- and trans-variants, in which compensatory evolutionary change “overshoots” the values of both parents.
Constraints on genes associated with categories of regulatory divergence
Previous case studies have suggested that cis- and trans-regulatory changes differ in the magnitude of associated pleiotropy (Gibson, 1996; Prud'homme et al., 2007). This suggestion is based on the notion that many TFs affect multiple downstream target genes, including genes that are not part of the regulatory network of the trait of interest. Trans-acting regulatory mutations are thus expected to often exhibit substantial pleiotropy (Gibson, 1996). In contrast, because cis-regulatory mutations affect only the gene in which they occur, they are expected to exhibit less pleiotropy (Prud'homme et al., 2007). Our analysis of several proxies for pleiotropy supports this expectation. We found, for example, that high expression specificity was associated with genes exhibiting cis-only regulatory changes, similar to what is observed in humans (Zhang et al., 2009; Pinter et al., 2015) and in Arabidopsis (Shi et al., 2012). Additionally, genes showing cis-only regulation had the lowest average expression level among all regulatory categories. Because it is generally believed that highly expressed genes are subject to a greater constraint than genes with lower expression levels, this result suggests that genes in the cis-only category may experience less pleiotropic constraint than genes in other categories. This inference is consistent with the higher dN/dS ratios we found for cis-regulatory genes.
Gene duplications and WGDs are common during flowering plant evolution, providing gene redundancy and contributing to gene functional diversity and adaptation (Zhang, 2003; Arsovski et al., 2015). Since duplicates from lotus WGD tend to be older and under greater dosage-balance constraints than tandem duplications (Shi et al., 2020), the pleiotropic constraints on WGD genes are expected to be stronger. Because the constraint is expected to be stronger on genes with trans-regulatory effects than on genes with cis-regulatory effects, we expect genes with trans-only effects to be associated with WGD. This is exactly the pattern we found: genes in the trans-only category are significantly associated with WGD. A previous study on yeast and Arabidopsis found a similar pattern (Dong et al., 2011; Shi et al., 2012). This pattern is also in line with our finding that hub genes in the coexpression network are prone to be regulated in trans, as we only observed in stage S4 since hub genes are believed to be preferentially retained after WGDs (Ferreira et al., 2013).
Although single-copy genes have housekeeping functions, as well as high expression and evolutionary conservation, suggesting strong pleiotropic constraints (De Smet et al., 2013; Shi et al., 2020), we found no regulatory categories enriched for single-copy genes. In contrast, the number of mutations located 2 kb upstream of the start codon was higher for genes in the cis-only category than for those in the trans-only category, similar to the findings of recent studies in cotton (Bao et al., 2019) and chickens (Wang et al., 2019). This is also in line with the conclusion in a Drosophila study that cis-acting alleles are more easily fixed by positive selection and have a higher probability of additive inheritance (Lemos et al., 2008), reflecting pleiotropic constraints differing in sequence evolution rates.
Materials and methods
Study organisms
Nelumbo (commonly known as lotus) is an early-diverging eudicot genus with one of the most conserved genomes that have undergone a single ancient WGD (Shi et al., 2020; Shi et al., 2022). Nelumbo contains only one allopatric species pair, namely, sacred lotus or Asian lotus (Nelumbo nucifera Gaertn.) with red/pink to white petals and yellow lotus or American lotus (Nelumbo lutea Willd.) with yellow petals (Li et al., 2014). The pigment intensity in the red/pink petals of Asian lotus is associated with the amount and type of anthocyanin accumulated (Deng et al., 2013; Deng et al., 2015; Sun et al., 2016). In contrast, the yellow petal color of American lotus likely results from the accumulation of nonanthocyanin flavonoids (Chen et al., 2013; Zhu et al., 2019) and carotenoids (Katori et al., 2002).
Plant materials
For analyses of ASE, a maternal line of N. nucifera (NN) with pink petals, a paternal line of N. lutea (NL) with yellow petals, and two of their F1 hybrids (F1–H16 and F1–H8; for both, N. nucifera was the maternal parent) were used in this study (Figure 1A). The parental lines and their hybrids were cultivated and subjected to conventional management outdoors at the Wuhan Institute of Landscape Architecture, China (30.50°N, 114.52°E). Young leaves were taken from parents for whole-genome resequencing and subsequent SNP detection. Petal samples of three individual flowers at four different floral developmental stages were collected from each sample (a total of 48 samples: 4-time points × 4 plant individuals × 3 biological replicates per individual) and were collected to measure the total anthocyanins and carotenoids as well as gene expression by RNA-seq. The four developmental stages are the early flower bud stage (S1), late flower bud stage (S2), initial flowering stage (S3), and full bloom stage (S4). The lengths of the petals from S1 to S4 are approximately 1–2 cm, 5–6 cm, 7–8 cm, and 9–11 cm, respectively. All samples were frozen in liquid nitrogen immediately after collection and stored at −80°C.
Genomic DNA and RNA sequencing
For whole-genome resequencing, 4 μg of genomic DNA was isolated from young leaves of the parental lines using a modified CTAB DNA extraction method (Wang et al., 2004). The integrity of the extracted DNA was verified on 1% (w/v) agarose gels, and the purity was verified by confirming that the 260/280 optical density ratio was between 1.8 and 2.0. The concentration of the extracted DNA was quantified with a Qubit® 2.0 Fluorometer (Life Technologies, CA, USA). A paired-end (PE) DNA sequencing library was prepared through genomic DNA shearing with a Covaris™ (Woburn, MA, USA) sonicator, followed by peak detection, end repair, poly A-tailing, PE adaptor ligation, and amplification. The effective concentration (>2 nM) of each constructed library was quantified with the Qubit® 2.0 Fluorometer and qPCR (KAPA Biosystems Library Quantification kit), and fragment size profiles were assessed using an Agilent 2100 BioAnalyzer to ensure library quality. The qualified library was amplified using an Illumina cBOT instrument to generate clonal clusters and sequenced on the Illumina HiSeq 2000 platform (Illumina, USA) to generate 150-bp PE reads according to the standard protocol. Raw reads were trimmed by removing the adapters and low-quality reads (Q < 20) with the FASTX-Toolkit (http://hannonlab.cshl.edu/fastx_toolkit/). Each library produced approximately 13 Gb of clean data after removing low-quality reads, N reads, and adapter sequences, which is available in the NCBI Sequence Read Archive (SRA, http://www.ncbi.nlm.nih.gov/Traces/sra) under accession number PRJNA664744.
For RNA-seq analysis, total RNA extractions were performed using an RNA purification reagent (OminiPlant RNA Kit, CWBIO, China). The degree of degradation and contamination of extracted RNA was monitored using 1% formaldehyde denaturing agarose gels. RNA purity was checked by measuring OD 260/280 using a Nanodrop spectrophotometer, and the concentration was quantified with a Qubit® RNA Assay Kit using a Qubit® 2.0 Fluorometer and the RNA Nano 6000 Assay Kit of the Agilent Bioanalyzer 2100 system (Agilent Technologies, CA, USA). Three micrograms of RNA from each sample were used for sequencing library construction using the NEBNext® Ultra TM Directional RNA Library Prep Kit for Illumina® (NEB, USA) following the manufacturer's instructions. A total of 48 libraries were sequenced on an Illumina HiSeq 2000 platform with 150-bp PE read generation. Clean reads were obtained by removing sequences containing adapters, low-quality reads (Q < 20) and reads containing poly-N. The cleaned data are available in the NCBI SRA (http://www.ncbi.nlm.nih.gov/Traces/sra) under accession number PRJNA664744.
Processing of genome and transcriptome sequencing datasets
After whole-genome resequencing, we obtained 46.7 and 43.4 million clean PE reads for N. nucifera and N. lutea, respectively (Supplemental Table 15). We obtained an average of 7.31 Gb per sample from 48 transcriptome samples for subsequent analyses (Supplemental Table 16). The clean resequencing reads were mapped against the reference lotus genome “China Antique” (nelumbo.biocloud.net; Shi et al., 2020) to generate SAM files with BWA-MEM (v0.7.12) because it can efficiently and accurately align genomic Illumina reads to a large reference (Li, 2013); transcriptome reads were aligned with Hisat2 (v2.1.0) because it is proficient in processing spliced reads given splicing events of pre-mRNA (Pertea et al., 2016). The aligned SAM files were sorted, converted to BAM files, indexed, and PCR duplicates marked using Samtools (v0.1.19; https://github.com/samtools/samtools) and Picard (version 2.0.1; https://github.com/broadinstitute/picard). The transcripts were annotated according to downloaded annotations from the Nelumbo Genome Database (http://nelumbo.biocloud.net; Shi et al., 2020; Li et al., 2021). Based on read counts, 18,420 of 32,122 genes were identified as differentially expressed genes (DEGs, adjust P value < 0.05, Benjamini–Hochberg method) with the R package DESeq2 (v1.10.1) for pairwise comparisons from the 48 RNA samples at the same developmental stage or the same individual at different developmental stages (Anders et al., 2015). Gene expression levels represented by FPKMs were calculated using StringTie with the default parameter settings. In developmental biology, DEGs are important for understanding the changes during developmental stages (Grierson and Covey, 1988; Gilbert, 2000). Because we intend to focus on genes involved in developmental changes (including coloration changes) during petal stages S1-to-S4, DEGs are used in the following ASE analyses.
Variant calling and filtration
To identify SNPs, we performed variant calling using GATK 4 with our genome sequences and GATK 3.8 for our transcriptome sequences using a standard pipeline (https://gatk.broadinstitute.org/hc/en-us). Briefly, variants (SNPs and Indels) were called and filtered using the Haplotypecaller and VariantFiltration scripts in GATK software. The filtered vcf files from the whole-genome resequencing data and the transcriptomic sequences were then combined into a single vcf file using CombineVariants in GATK for downstream analysis. In the final vcf file, only high-confidence SNP sites between maternal and paternal lines that were homozygous in each parent (genotype as 0/0 and 1/1, respectively) with >8× supporting reads were retained by using bedtools (function “intersect”). A total of 22,466,993 raw SNP sites were detected based on both whole-genome resequencing and RNA-seq data. The SNP types C ↔ T and A ↔ G were most common, and the SNP densities varied among genes (Supplemental Figure 22). Allelic expression profiling (ASE analysis) for each DEG harboring these species-specific SNPs was performed based on the average read count of all species-specific SNPs within a gene for each NN allele and NL allele. Out of 18,240 identified DEGs, 12,161 contained at least one high-quality SNP and could thus be used in the ASE analysis.
Categorization of cis- and trans-regulation
To categorize regulatory variants for all genes, DESeq2 was used with the allelic count from each RNA-seq sample to characterize cis- and trans-effects. The total effects of cis- and trans-variants were estimated as A = log2(NN/NL), where NN is the expression level in N. nucifera and NL is the expression level in N. lutea. The magnitude of the cis-effects was measured as B = log2 (F1nn/F1nl), where F1nn and F1nl are the expression levels of the N. nucifera and N. lutea alleles in the hybrids. The trans-effects were then estimated as A–B (Figure 1B). In estimating these quantities, DESeq2 accounts for variability among replicates for a given sample. A particular regulatory category was assigned to each gene according to three criteria shown in Figure 1C (i.e. A = 0, B = 0, and B × (A-B) = 0). We tested whether A = 0 with dEseq2 of expression level using the three replicates each for N. lutea and N. nucifera. Similarly, we tested whether B = 0 with DESeq2 of whether expression levels of the two paternal alleles in the hybrids were equal, again using the three replicates. Finally, we tested the third criterion by calculating A–B using Student's t test; these statistical tests were adjusted for multiple comparisons using the Benjamini–Hochberg procedure (Benjamini and Hochberg, 1995). The correlations among A, B, and A–B with Pearson test were explored. A difference was considered significant when the adjusted P value <0.05. To avoid false-negative results, Cook's distance test in DESeq2 was used to identify extreme outliers among replicates for genes with A = 0, B = 0, or A = B in parents and F1 hybrids (Love et al., 2014). GO enrichment analysis based on a Wallenius noncentral hypergeometric distribution was performed on each of the seven gene categories of genes using tBtools based on corrected P values (<0.05; Chen et al., 2020).
Determining the degree of dominance
To investigate the degree of dominance of alleles contributing to regulatory divergence, we divided genes into three categories as defined in previous publications (Lemos et al., 2008; McManus et al., 2010; Bao et al., 2019): (1) “additive” inheritance occurred if the total expression of both alleles in the hybrids showed no significant difference from the parental midpoint (average of that of the parents); (2) “dominant” inheritance occurred when expression in hybrids showed no significant difference (by DESeq 2 analysis) from the expression of only one parent; and (3) “transgressive” inheritance occurred when expression in hybrids was outside the range of the two parental expression values, being significantly higher or lower than both parents. Genes that do not belong to these inheritances are named “other inheritance”. Any comparisons of expression differences between parents and hybrids while determining the inheritance modes were counted based on R codes from cotton (Gossypium hirsutum; Bao et al., 2019). The association between regulatory divergence categories and inheritance modes was examined with a χ2 test of independence.
Identification of genes coexpressed with pigment level changes by coexpression network analysis
Based on a matrix of gene expression levels and pigment contents (anthocyanidins and carotenoids) measured by high-performance liquid chromatography (HPLC; Supplemental Note 1), weighted gene coexpression network analysis (WGCNA, v1.69; Langfelder and Horvath, 2008) was performed to identify genes belonging to highly coexpressed gene modules that were significantly related to anthocyanidins or carotenoids. Network construction and module detection were conducted with an optimized power β=20, an unsigned type of topological overlap matrix (TOM), and a branch merge cut height of 0.25. A module from WGCNA is a set of genes with a similar expression pattern. The strength of the connection (connectivity) between two genes within a module is indicated by the topological overlap measure of similarity between them. Hub genes, the genes connected to the greatest number of other genes in each module, were selected based on module membership (|MM| ≥ 0.8) and gene significance (|GS| ≥ 0.2). Pairwise between-group comparisons of known ABP- or CBP-related hub genes from modules with high epigengene significance (ES; P value < 0.05) in WGCNA among parents and hybrids were conducted with Duncan's test in SPSS 18.0 (SPSS Inc., Chicago, IL, USA). Functional annotation and enrichment analysis of hub genes under cis- or trans-acting regulation in modules with high correlations among pigment contents were performed using GO.
Reverse transcription quantitative PCR (RT-qPCR) validation of RNA-seq data
According to the above WGCNA results, three crucial genes were selected for the RT-qPCR expression analysis to quantify expression differences between the red lotus and yellow lotus at the early flower bud stage (S1) to further confirm the potential effect of gene expressions on pigment accumulation. Before RT-qPCR, we reverse-transcribed RNA using 1 µg RNA with the All-in-One First-Strand cDNA Synthesis Kit (Yugong Biolabs, Lian Yungang, China). The specific primers for the candidate genes were designed using Premier software (v.5.0). The lotus β-Actin gene was used as an internal standard. The RT-qPCR reaction was performed with SYBR Green I fluorescent dye technology on a BIOER FQD-96A instrument (Wuhan, China) in triplicate for the three genes and the control. The cycling protocol was: 95°C for 15 s, followed by 40 cycles of 95°C for 15 s, 60°C for 15 s, and 72°C for 30 s with fluorescent signal detection. The relative gene expressions were calculated using the CT (2−△△Ct)method (Livak and Schmittgen, 2001).
Comparison of evolutionary tendencies among genes under different cis- versus trans-regulatory categories
To compare the evolutionary patterns of genes of different regulatory categories, we first grouped all expressed lotus genes according to their duplication origins, including WGDs and tandem, proximal and dispersed duplications (Shi et al., 2020). In our study, single-copy genes, various types of duplicated genes and orphan genes were also detected by MCScanX (Wang et al., 2012) based on protein homology and gene coordinates. The proportions of these different types of duplicated genes within the seven regulatory categories were calculated to understand the associations between cis- or trans-regulation and genes with different types of duplication origins. Additionally, because promoter mutations could be relevant to cis-regulatory variations, SNP densities (number of SNPs per kb of sequence) were calculated for coding regions and the region 2 kb upstream of the start codon for downstream comparison of evolutionary rates among genes of different cis- and trans-regulatory categories.
Data availability
The sequencing data generated in this study have been submitted to the NCBI BioProject database (https://www.ncbi.nlm.nih.gov/bioproject/) under accession number PRJNA664744.
Accession numbers
Sequence data with key genes from this article can be found in the GenBank/EMBL data libraries: AtACT with accession number NP200924; AtGSTF11 with accession number NP186969; AtLCYE with accession number NP200513; A. aestivalis CBFD1 with accession number AY644757; A. aestivalis CBFD2 with accession number AY644759; A. aestivalis HBFD1 with accession number ABK41044; A. aestivalis HBFD2 with accession number ABK41045.
Supplemental data
The following materials are available in the online version of this article.
Supplemental Note S1. Measurement of anthocyanidin and carotenoid content in lotus petals.
Supplemental Note S2. Expression profiles and regulatory variations of known SGs and TFs associated with anthocyanin and carotenoid accumulation based on WGCNA.
Supplemental Note S3. Gene ontology (GO) enrichment analysis of unknown genes in modules significantly associated with anthocyanin and carotenoid accumulation based on WGCNA.
Supplemental Figure S1. The correlation between 48 petal tissues.
Supplemental Figure S2. The magnitudes and directions of parental expression divergence and cis-regulatory divergence in the F1 hybrid, F1-H16, at the late flower bud stage (S2), initial flowering stage (S3), and full bloom stage (S4) for genes in the different regulatory categories.
Supplemental Figure S3. The magnitudes and directions of parental expression divergence and cis-regulatory divergence in the F1 hybrid, F1-H8, at four developmental stages (S1-S4) for genes in different regulatory categories.
Supplemental Figure S4. Significance levels for genes and alleles with different regulatory categories vs. expression bias in the F1-H16 hybrid at S2-S3.
Supplemental Figure S5. Significance levels for genes in different regulatory categories vs. expression bias in the F1-H8 hybrid at four developmental stages.
Supplemental Figure S6. The calibration curves of six anthocyanin standards.
Supplemental Figure S7. The changes in anthocyanidin content based on HPLC-MS/MS analysis.
Supplemental Figure S8. The calibration curves of seven carotenoid standards.
Supplemental Figure S9. Association between carotenoid contents and DEGs.
Supplemental Figure S10. Ratio of the observed number of hub genes to the expected number of hub genes based on anthocyanin- and carotenoid-WGCNA coexpression networks.
Supplemental Figure S11. The proportion of genes with different inheritance modes and regulatory categories in WGCNA modules.
Supplemental Figure S12. Expression profile of structural genes (SGs) and transcription factors (TFs) in anthocyanin biosynthetic pathway (ABP).
Supplemental Figure S13. Expression profile of structural genes (SGs) and transcription factors (TFs) in carotenoid biosynthetic pathway (CBP).
Supplemental Figure S14. The expression patterns of two ABP-related structural genes, ACT and GSTF11, and one CBP-related gene, LCYE in one red- and one yellow- lotus samples from other studies.
Supplemental Figure S15. Enriched GO terms of genes in modules associated with anthocyanin contents based on WGCNA.
Supplemental Figure S16. Enriched GO terms of genes in modules associated with carotenoid contents based on WGCNA.
Supplemental Figure S17. Association of genes in different regulatory categories with the proxies of pleiotropic constraint in Nelumbo at S2, S3 and S4.
Supplemental Figure S18. Comparison of ratio of the observed number of genes in different duplication categories to the expected number between Nelumbo at the whole developmental stages and cotton fiber.
Supplemental Figure S19. Ratio of the observed number of duplication genes to the expected number of duplication genes under cis- and trans-regulation in Arabidopsis (N = 11).
Supplemental Figure S20. Sequence divergences (SNP density) among different cis/trans-regulatory categories.
Supplemental Figure S21. The analysis of CBFD and HBDF orthologous genes between Adonis aestivalis, Arabidopsis thaliana, Oryza sativa, and Nelumbo nucifera.
Supplemental Figure S22. Densities of the raw 22,466,993 SNPs based on whole-genome resequencing data and RNA-seq data from parents and two F1 hybrids.
Supplemental Table S1. Regulatory categories and inheritance modes of 12,161 DEGs in petal tissues at four developmental stages of two F1 hybrids.
Supplemental Table S2. Comparison of cis and trans effects in two F1 hybrids at four developmental stages.
Supplemental Table S3. The numbers of genes with A > 0 or A < 0 under cis and trans-regulatory variations in two F1 hybrids at four developmental stages.
Supplemental Table S4. Proportion of dominant genes for which dominance is in direction of parent with higher expression and lower expression.
Supplemental Table S5. Hub genes in co-expression modules being significantly associated with monomeric anthocyanin and carotenoid compounds in lotus based on WGCNA analysis.
Supplemental Table S6. Statistical analysis of distribution of hub genes among regulatory categories for Anthocyanin and Carotenoid modules at stage 4.
Supplemental Table S7. Associations between regulatory categories and inheritance modes for hub genes in anthocyanin and carotenoid regulatory modules.
Supplemental Table S8. Association between additive vs. dominant inheritance and cis-only vs. trans-only regulation for hub genes in anthocyanin and carotenoid modules.
Supplemental Table S9. Comparison of structural genes (SGs) and transcription factors (TFs) in lotus with those in Arabidopsis involved in ABP and CBP.
Supplemental Table S10. The inheritance modes of the monomeric anthocyanidin and carotenoid compounds in the two F1 hybrids based on contents.
Supplemental Table S11. The information of predicted cis-elements in the promoter of GSTF11 using PlantCARE.
Supplemental Table S12. Enriched GO terms of genes under different regulatory in petal tissues at four developmental stages of two F1 hybrids.
Supplemental Table S13. Expression breadth for genes with different regulatory categories in 19 tissues from lotus cv. ‘China Antique’.
Supplemental Table S14. Expression breadth for genes with different regulatory categories in 21 tissues from Arabidopsis.
Supplemental Table S15. Summary of mapping results with whole-genome re-sequencing for Parental lines.
Supplemental Table S16. Summary statistics of clean reads in 48 RNA samples of F1 hybrids.
Author contributions
T.S., M.D.R., and J.C. conceived and designed the project. Z.G. and X.Y. collected samples for whole-genome resequencing and transcriptome sequencing. Z.G. and T.S. performed the methodology and the formal analysis. Z.G. wrote the original draft. T.S., M.D.R., and J.C. reviewed and edited the manuscript.
Acknowledgments
We appreciate the assistance from members in the CAS Key Laboratory of Aquatic Botany and Watershed Ecology. We thank Novogene (Beijing, China) and Wuhan ProNets Biotechnology (Wuhan, China) for the technical help in sequencing and pigment extraction.
Funding
This work was supported by grants from the Strategic Priority Research Program of Chinese Academy of Sciences (No. XDB31000000), the National Natural Science Foundation of China (Nos. 32170240, 31870208, and 31700197), the Youth Innovation Promotion Association of the Chinese Academy of Sciences (No. 2019335), and Bureau of Landscaping and Forestry of Wuhan Municipality (No. WHGF2019A10).
References
Author notes
The author responsible for distribution of materials integral to the findings presented in this article in accordance with the policy described in the Instructions for Authors (https://dbpia.nl.go.kr/plphys/pages/General-Instructions) is Tao Shi ([email protected]).
Conflict of interest statement. The authors declare no conflict of interest.
