


Abstract
Plants usually suffer from phosphorus starvation because of the low inorganic phosphate (Pi) status of most soils. To cope with this, plants have evolved an adaptive phosphate starvation response (PSR) which involves both developmental and metabolic changes regulated mainly by PHOSPHATE STARVATION RESPONSE1 (PHR1) and its homologs. Here, we elucidated how perennial woody plants, such as poplars (Populus spp.), respond to low-Pi stress. We first performed RNA-seq analysis of low-Pi-treated poplars and identified PtoWRKY40 is rapidly downregulated and protein degraded after stress. Overexpressing and knocking-down PtoWRKY40 downregulated and upregulated the expression of Pi starvation signaling genes, respectively, such as PHOSPHATE TRANSPORTER1 (PHT1)-type genes and PURPLE ACID PHOSPHATASE genes. PtoWRKY40 bound to the W box in the promoter of several PtoPHT1s and repressed their expression. Moreover, PtoWRKY40 interacted with PtoPHR1-LIKE3 (PtoPHL3), a PHR1 homolog in poplar, to inhibit the latter binding to the P1BS element and thus reduced PtoPHT1s’ transcription under Pi-sufficient conditions. However, Pi deficiency decreased PtoWRKY40 abundance and therefore released its inhibition on PHT1s. In conclusion, we have uncovered a PSR mechanism mediated by PtoWRKY40 and PtoPHL3 which regulates Pi content in poplars, deepening our understanding of how poplars adapt to diverse Pi conditions and regulate appropriate responses to maintain Pi homeostasis.
Introduction
Phosphorus is a macronutrient which participates in a variety of vital biological processes in plants, including the biosynthesis of nucleic acids, ATP and phospholipids, levels of enzyme activity and photosynthesis regulation (Kuo and Chiou, 2011). Inorganic phosphate (usually H2, known as Pi) is directly taken up by plants (Marschner, 2011), but this available phosphate becomes fixed in the form of organic compounds or inorganic precipitation and thus is restricted to a low level (<10 μM) in most soils. Plants therefore exist in a state of Pi starvation for most of their life cycle (Raghothama, 1999; López-Arredondo et al., 2014), and this is one of the important abiotic factors threatening the sustainability of agriculture and forestry as well as global food security (López-Arredondo et al., 2014).
The changes that the morphology, physiology, and biochemistry of plants undergo under low-Pi conditions in order to increase Pi acquisition and utilization efficiencies are termed Pi starvation responses (PSRs), and they can manifest in forms such as root architecture modification, the secretion of acid phosphatases and organic acid anions, the accumulation of starch and anthocyanin, the remobilization of internal Pi from source to sink and symbiosis with arbuscular mycorrhizal (AM) fungi (Raghothama, 1999; Chiou and Lin, 2011; Shi et al., 2021). These PSRs in Arabidopsis (Arabidopsis thaliana) involve transcriptional reprogramming of hundreds of Pi starvation-induced (PSI) genes which are regulated by the MYB-coiled-coil (Myb-cc) family members PHOSPHATE STARVATION RESPONSE 1 (PHR1) and its homologs (PHR1-LIKE, PHL1 and PHL2) (Barragan-Rosillo et al., 2021). Under Pi sufficiency, SUPPRESSOR OF YEAST GPA1, THE YEAST PHOSPHATASE 81, AND THE HUMAN XENOTROPIC AND POLYTROPIC RETROVIRUS RECEPTOR 1 (SPX) domain proteins (harboring the SPX domain alone) bind with inositol pyrophosphate (PP-InsP, the Pi signaling molecule), then interact with PHR/PHL and inhibit the transcriptional activation activity of PHR/PHL to PSI genes. Under Pi-deficient conditions, PP-InsP declines, then SPX proteins release PHR/PHL to induce PSI gene expression (Puga et al., 2014, 2017; Lorenzo-Orts et al., 2020; Ried et al., 2021). PSR is controlled by a classic PHR1-microRNA399s (miR399s)-PHOSPHATE2 (PHO2) module (Fujii et al., 2005; Bari et al., 2006; Nilsson et al., 2007; Lin et al., 2008). PHO2 encodes an E2 ubiquitin (UBQ)-conjugating enzyme that is enriched in the roots to inhibit the expression of PSI genes and prevent phosphorus poisoning when Pi is sufficient (Bari et al., 2006; Liu et al., 2012). MiR399s, especially miR399f, are activated by PHR1 and are therefore rapidly upregulated under Pi-deficient conditions (Bari et al., 2006). MiR399 precursors are generated in the phloem when Pi is deficient, and then are transported to the root for processing to mature miR399 which binds to the target site of the 5′-UTR of the PHO2 mRNA and mediates its degradation (Fujii et al., 2005;,Bari et al., 2006; Pant et al., 2008). In addition, plant’s Pi status also shapes plant-associated microbiota through regulation of the plant immune response (Castrillo et al., 2017; Finkel et al., 2019; Ma et al., 2021; Shi et al., 2021). These effects ensure that host plants under Pi-limiting conditions can activate their immune system to restrict symbiosis with soil microbes that endanger their Pi status, but preferentially interact with soil microbes able to provide them with soluble Pi (Isidra-Arellano et al., 2021).
WRKY transcription factors participate extensively in biotic response and immunity in plants (Rushton et al., 2010), and many members are also involved in PSR of plants (Puga et al., 2017). In Arabidopsis, AtWRKY75 positively regulates PSR but negatively regulates root hair and lateral root development (Devaiah et al., 2007). AtWRKY6 and AtWRKY42 directly downregulate tolerance of Pi starvation by inhibiting the expression of AtPHO1 (Chen et al., 2009a, 2009b; Su et al., 2015; Wege et al., 2016). AtWRKY45 activates expression of AtPHT1;1 in response to Pi starvation to enhance the Pi uptake (Wang et al., 2014). In rice (Oryza sativa L.), overexpression of OsWRKY74 can increase the number of tillers and Pi content (Dai et al., 2016). OsWRKY21 and OsWRKY108 interact with each other and redundantly upregulate OsPHT1;1 (Zhang et al., 2021a, 2021b). The cotton (Gossypium barbadense) WRKY1 can enhance adaptability to Pi deficiency in transgenic Arabidopsis (Xu et al., 2012).
In this study, we found that the WRKY transcription factor gene PtoWRKY40 from poplar (Populus × tomentosa Carr. (clone 741)) is predominantly expressed in roots and repressed by low-Pi treatment. PtoWRKY40 and its homologs participate in disease-resistance responses through the formation of homodimers or heterodimers in many plant species (Xu et al., 2006; Shen et al., 2007; Karim et al., 2015; Abeysinghe et al., 2019). Overexpression of poplar PtoWRKY40 resulted in more sensitivity to Pi deficiency, whereas knocking-down PtoWRKY40 by RNA interference (RNAi) enhanced tolerance of low-Pi conditions. Furthermore, PtoWRKY40 can interact with PtoPHL3 in vitro and in vivo. These phenotypical observations of poplars overexpressing and knocking-down PtoPHL3 were opposite to the effects of PtoWRKY40 with respect to low-Pi tolerance. We found that the interaction and self-interaction of PtoWRKY40 and PtoPHL3 regulate PtoPHT1s’ expression (PtoPHT1;3, PtoPHT1;4, PtoPHT1;5) through binding to, respectively, W-box and P1BS elements in PtoPHT1s’ promoter, thus, dynamically fine-tune Pi content. In addition, PalWRKY40 overexpressing poplars exhibited more tolerance to high Pi toxicity compared to wild-type (WT) plants. These results demonstrate that the PtoWRKY40–PtoPHL3 module regulates Pi acquisition and sustains Pi homeostasis in poplar adapting to various soils. Our findings therefore provide insight to assist in elevating the efficiency of phosphorus fertilizer utilization in afforestation, and these genes may also serve as potentially important targets of modification in breeding programs.
Results
The defense-related gene PtoWRKY40 is downregulated and protein degraded by low-Pi treatment
To explore the transcriptional reprogramming of poplars in response to Pi deficiency, 2-week-old rooted P. × tomentosa Carr. (clone 741) cuttings with a height of 5 cm were transplanted into sterilized tubes with liquid MS (1.25 mM Pi) or Pi-deficient (10 μM Pi) medium for 7 days. Total RNA of stressed and control materials was extracted for RNA-seq analysis based on the genomic data available for P. alba var. pyramidalis (Zhang et al., 2021a, 2021b). The results showed that there were 1,941 differentially expressed genes (DEGs) in the stressed poplars compared to the controls, of which 949 were upregulated and 992 were downregulated (Supplemental Table S1). Gene ontology (GO) enrichment analysis showed that these DEGs are involved in response to Pi starvation, anthocyanin biosynthesis, phytohormone (salicylic acid; jasmonic acid; auxin; abscisic acid [ABA]) response, and fungus response (Supplemental Figure S1A). Expression analysis showed that many relevant genes were induced by Pi deficiency (Supplemental Figure S1B), such as PHOSPHATE TRANSPORTER1 (PHT1)-type genes and PURPLE ACID PHOSPHATASE (PAP) genes whose products catalyze the hydrolysis of phosphorylated substrates to enhance Pi acquisition (Vincent and Averill, 1990; Olczak et al., 2003; Nussaume et al., 2011); the homologs of TRANSPARENT TESTA(TT)4, TT7, TT12, DIHYDROFLAVONOL 4-REDUCTASE , FLAVONOL SYNTHASE, and FLAVONOID 3-HYDROXYLASE are involved in anthocyanin and flavonoid biosynthesis (Bowerman et al., 2012; Zhang et al., 2014); and ROOT HAIR SPECIFIC (RHS)12, RHS13, RHS14, and RHS18 are associated with root hair growth (Won et al., 2009). In addition, we used reverse transcription–quantitative PCR (RT–qPCR) to examine the spatio-temporal expression pattern of nine PSI genes: PtoPAP10, PtoPAP15, PtoPAP17, PtoPAP22, PtoPS3, PtoPS3a, PtoPEPC1, PtoMGD2, and PtoPHL3. Most of them were significantly induced by Pi deficiency in either shoot or root of poplar, findings which are consistent with the RNA-seq data (Supplemental Figure S1C). Interestingly, we found the expression of a defense-related gene, PtoWRKY40, was rapidly downregulated and it subsequently maintained a low mRNA abundance in continuously low-Pi stressed shoots and roots (Supplemental Figure S1, B and C). PtoWRKY40 is homologous to AtWRKY40 and this WRKY transcription factor is conserved in Populus spp. (Supplemental Figure S1D). We also expressed a β-glucuronidase encoding gene (GUS or uidA) in poplar driven by the promoter of PtoWRKY40. The results indicated that PtoWRKY40 was predominantly expressed in petioles (parenchymal cell, xylem fiber cell, and sclerenchyma cell) and lateral roots, however, in the stems, this gene showed a comparative high expressed in parenchymal cell, primary xylem fibers, and pitch than other cell types (Figure 1A). The abundance of PtoWRKY40 mRNA was reduced in all tissues of low-Pi-treated poplar (Figure 1B). In addition, the recombinant protein GST-PtoWRKY40 could be degraded by an extract of low-Pi stress poplars, but the nonstressed extract cannot (Figure 1C). This degradation can be alleviated by a 26S proteasome inhibitor MG132 (Figure 1C), indicating that PtoWRKY40’s degradation under low-Pi condition is mediated by the UBQ/26S proteasome pathway. Green fluorescent protein (GFP)-tagged PtoWRKY40 was subcellularly located in the nuclei of poplar mesophyll protoplasts (Figure 1D). These findings suggested a potential function of PtoWRKY40 in PSR of poplar.
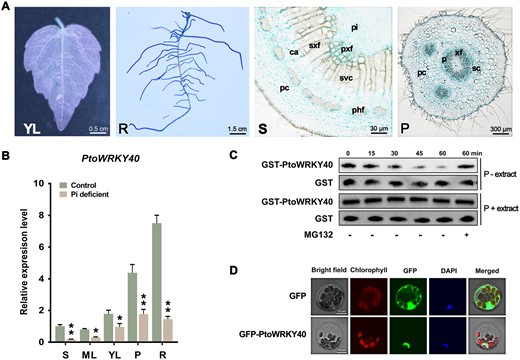
PtoWRKY40 is negatively regulated at the transcript and protein levels by low-Pi stress. A, The construct containing a GUS reporter gene driven by the promoter of PtoWRKY40 was introduced into poplars. GUS staining showing the tissue expression pattern of PtoWRKY40 in young leaves (YL), root (R), stem (S), and petiole (P). pc: parenchymal cell; ca: cambium; sxf: secondary xylem fibers; phf: phloem fibers; svc: secondary xylem vessel cell; pxf: primary xylem fibers; pi: pitch; xf: xylem fibers; p: phloem; sc: sclerenchyma cell. B, RT–qPCR confirmation of the tissue expression pattern of PtoWRKY40 before and after low-Pi treatment. Including S, mature leaves (MLs), YL, P and R. Error bars indicate SD values from three independent biological replicates. Student’s t test was used to determine significance statistics; *P < 0.05, **P < 0.01. The poplar UBQ gene was used as an internal reference. C, Extract of low-Pi (P−) treated plantlets degrade GST-PtoWRKY40 recombinant protein (Row 1); this can be inhibited by the 26S proteasome inhibitor MG132. The nontreated (P+) extract (Row 3) and the GST protein (Rows 2 and 4) were used as negative controls, respectively. D, Subcellular localization of PtoWRKY40 in poplar mesophyll protoplasts. Empty pBI221 was used as negative control.
PtoWRKY40 negatively regulates low-Pi tolerance of poplar
To determine the biological function of PtoWRKY40 in PSR of poplar, we generated two RNAi-mediated gene knockdown lines (PtoWRKY40-RNAi2 and PtoWRKY40-RNAi5) and two overexpression lines (PtoWRKY40-OE6 and PtoWRKY40-OE9) (Supplemental Figure S2). In Pi-sufficient condition, the Pi content of PtoWRKY40-OE plantlets displayed a significant decrease in root compared to WT and PtoWRKY40-RNAi (Figure 2, A and B). After Pi deprivation (0 μM Pi) for 1 month by a hydroponic method, the PtoWRKY40-OE plantlets also showed more anthocyanin content than that of others, indicating these poplars were more stressful (Figure 2, A and C). Additionally, the PtoWRKY40-RNAi plantlets exhibited bigger leaves and longer adventitious roots than those of WT and PtoWRKY40-OE plantlets after stress (Figure 2, A and C), indicating their enhanced Pi starvation tolerance. Similar results were observed when the low-Pi (10 μM) treatment was applied in test tubes (Supplemental Figure S3). Therefore, PtoWRKY40 negatively regulates the tolerance of poplar to Pi-deficient conditions.
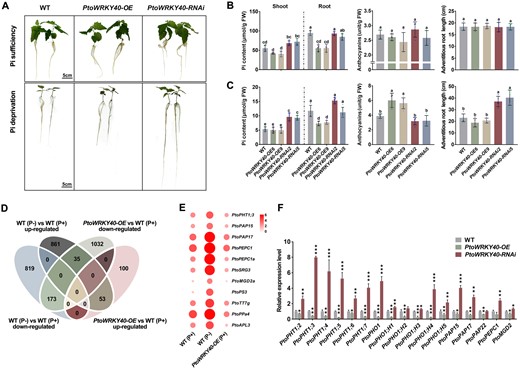
PtoWRKY40 negatively regulates low-Pi tolerance in poplars. A, Phenotypes of PtoWRKY40 overexpressing and RNAi lines subjected to Pi deprived (0 μM Pi) or sufficient (1.25 mM Pi) conditions hydroponically for 1 month. B and C, Pi contents of shoot and root, anthocyanin contents and adventitious root lengths of PtoWRKY40 overexpressing and RNAi poplars under Pi sufficient (B) and deprived (C) conditions. Error bars represent sd values(n ≥ 4). Letters above bars represent statistically significant differences between groups (P < 0.05) as determined by one-way ANOVA Duncan’s test. D, Venn diagram indicating DEGs in PtoWRKY40 overexpressing poplar and WT treated with low-Pi compared to controls. The data of RNA-seq come from at least two independent replicates. E, Heat map indicating the expression levels of PSI genes among 35 DEGs that are upregulated in stressed WT and downregulated in PtoWRKY40 overexpressing lines. Both circle size and color saturation indicate gene expression level expressed as the mean value of the log2FC of each gene in all independent replicates. F, RT–qPCR analysis of PSI gene expression levels in PtoWRKY40 overexpressing and RNAi transgenic poplars. Error bars indicate sd values from three independent biological replicates. Student’s t test was used to determine significance statistics; *P < 0.05, **P < 0.01, ***P < 0.001. The poplar UBQ gene was used as an internal reference.
Furthermore, we analyzed and compared the transcriptomes of PtoWRKY40-OE and WT poplars under normal condition. There were 1,393 DEGs detected in overexpressing plants compared to WT, of which 153 were upregulated and 1,240 were downregulated (Supplemental Table S2). The downregulated DEGs included many PSI genes (Supplemental Figure S4). In addition, we compared the DEGs in PtoWRKY40-OE and the low-Pi stressed WT, there were 53 and 173 genes upregulated and downregulated both by overexpressing PtoWRKY40 and low-Pi treatment, respectively (Figure 2D). GO enrichment and functional annotation showed that these 53 DEGs are dominantly involved in glutathione metabolic process, response to karrikin, benzene-containing compound metabolic process, etc. (Supplemental Tables S3 and S4). The 173 DEGs are associated with response to cold, DNA-binding transcription factor activity, response to chitin, etc. (Supplemental Tables S5 and S6). We noticed that there were 35 DEGs that were induced in the low-Pi stressed poplars but repressed in PtoWRKY40-OE lines, and 11 of these were well investigated to play important roles in Pi starvation response and tolerance (Figure 2, D and E; Supplemental Tables S7 and S8). The promoter analysis of these overlapped genes showed that most of them (239 in 261) contain at least one W box (Supplemental Tables S9–S11), suggesting that they could be regulated directly by PtoWRKY40. Therefore, PtoWRKY40 could act as a negative and positive regulator of these genes. Moreover, we analyzed the expression levels of additional PSI genes in transgenic poplars by RT–qPCR, and the PHT1-type genes (PtoPHT1;2, PtoPHT1;3, PtoPHT1;4, PtoPHT1;5, PtoPHT1;6, and PtoPHT1;7) showed significantly enhanced expression in PtoWRKY40-RNAi but decreased expression in the PtoWRKY40-OE lines (Figure 2F). Additionally, the expression level of these genes was downregulated in the low-Pi stressed PtoWRKY40-OE lines compared to the stressed WT (Supplemental Figure S5). These results suggested that PtoWRKY40 reduces Pi content through negatively regulating the expression of PtoPHT1s.
PtoWRKY40 physically interacts with PtoPHL3
To understand the mechanism by which PtoWRKY40 acts on PSI genes, we carried out a yeast two-hybrid (Y2H) screening using PtoWRKY40 as bait. A Myb-cc transcription factor, PtoPHL3, which is a homolog of AtPHL2 and AtPHL3, can interact with PtoWRKY40 in yeast cells (Figure 3, A and B; Supplemental Table S12). We selected additional four members of the poplar Myb-cc family and tested whether they could interact with PtoWRKY40. The results showed that pal_pou23778 and pal_pou27050, which are similar to PtoPHL3, can interact with PtoWRKY40, but these interactions are weaker than that with PtoPHL3 (Figure 3B). In addition, PtoWRKY77 is a homolog of PtoWRKY40 (Jiang et al., 2014), but this protein showed no interaction with PtoPHL3 (Figure 3B). In vitro pull-down assays using GST-PtoWRKY40 recombinant proteins showed direct interaction with MBP-PtoPHL3, and this interaction seems to have nothing to do with Pi (Figure 3C).
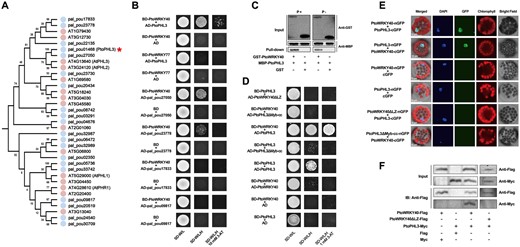
PtoWRKY40 interacts with PtoPHL3 in vivo and in vitro. A, Phylogenetic analysis of Myb-cc family from Arabidopsis and P. alba var. pyramidalis. Full-length amino acid sequences of 15 Arabidopsis and 20 poplar Myb-cc proteins were aligned by Clustal X1.81, and the Neighbor-Joining method was used to construct a phylogenetic tree by MEGA with 1,000 bootstrap replicates. The red star indicates PtoPHL3. B, A Y2H assay verifying the interaction of PtoWRKY40 with PtoPHL3 and its homologs; the interaction between PtoWRKY40’s homolog PtoWRKY77 and PtoPHL3 was also examined. C, Pull-down assay showing interaction between PtoWRKY40 and PtoPHL3 with or without phosphorus addition in vitro. The GST-PtoPHL3 and MBP-PtoWRKY40 recombinant proteins were mixed with a pull-down binding buffer with or without phosphorus addition, and incubated with GST beads. The pulled-down protein was detected by immunoblotting. A mixture of GST and MBP-PtoWRKY40 was used as a negative control. D, Y2H assay verifying the interacting regions of PtoWRKY40 and PtoPHL3. PtoWRKY40 with the LZ domain deleted (PtoWRKY40ΔLZ) and PtoPHL3 without the Myb-cc domain (PtoPHL3ΔMyb-cc) were used in this assay. E, BiFC assay of PtoWRKY40–PtoPHL3 interaction in vivo. The CDS fragments of PtoWRKY40, PtoPHL3, PtoWRKY40ΔLZ, and PtoPHL3ΔMyb-cc were ligated into pSAT1-cGFP-N and pSAT1-cGFP-C vectors, respectively, these vectors were co-introduced into poplar mesophyll protoplasts and the GFP signals were detected with a confocal laser microscope. The combinations including PtoWRKY40-nGFP + cGFP, PtoPHL3-nGFP + cGFP, PtoWRKY40ΔLZ-nGFP + PtoPHL3-cGFP, and PtoPHL3ΔMyb-cc-nGFP + PtoWRKY40-cGFP were used as negative controls. DAPI staining indicates the nucleus. F, Co-IP assay to identify the interaction between Myc-tagged PtoPHL3 and Flag-tagged PtoWRKY40 in vivo. The 35S:PtoWRKY40-Flag and 35S:PtoWRKY40ΔLZ-Flag were transiently expressed in N. benthamiana leaves with 35S:PtoPHL3-Myc or empty Myc vector, respectively, and immunoblot analysis was carried out to examine the tagged proteins using anti-Flag and anti-Myc antibodies.
In Arabidopsis, AtWRKY40 functions through interacting with itself and its homologs. This interaction is mediated by an N-terminal leucine (Leu) zipper (LZ) domain of AtWRKY40 (Xu et al., 2006). AtPHR1 forms homo-dimers through the Myb-cc domain in order to bind to P1BS elements (Ried et al., 2021), and PtoPHL3 can interact with itself (Supplemental Figure S6; Figure 3D). Therefore, we speculated that these domains also mediate the physical interaction between PtoWRKY40 and PtoPHL3. To check this, we generated an LZ-lack PtoWRKY40 (PtoWRKY40ΔLZ) and a Myb-cc-lack PtoPHL3 (PtoPHL3ΔMyb-cc) and carried out an Y2H assay. The results showed that either LZ or Myb-cc is required for this interaction (Figure 3D). Additionally, we employed a bimolecular fluorescence complementation (BiFC) assay in which PtoWRKY40 was fused with a split N-terminal of GFP (nGFP) and PtoPHL3 with a split C-terminal of GFP (cGFP). When we transiently co-expressed PtoWRKY40-nGFP and PtoPHL3-cGFP in poplar mesophyll protoplasts, strong GFP signals were observed. However, the combinations containing PtoWRKY40ΔLZ-nGFP or PtoPHL3ΔMyb-cc-nGFP did not show any GFP signal (Figure 3E). Finally, a co-immunoprecipitation (Co-IP) confirmed again the interaction between PtoWRKY40 and PtoPHL3 in vivo. The results showed that PtoWRKY40-Flag, but not PtoWRKY40ΔLZ-Flag or Flag alone, pulled down PtoPHL3-Myc (Figure 3F). These results indicated that PtoWRKY40 physically interacts with PtoPHL3 in vitro and in vivo.
PtoPHL3 is a positive regulator of poplar Pi starvation tolerance
We cloned the 1,500-bp length of PtoPHL3 promoter to drive a GUS reporter gene and introduced this construct into poplar. The GUS staining indicated that this promoter’ transcription was mainly in leaves, lateral petioles (parenchymal cell, xylem fibers, and sclerenchyma cell), and roots; however, low GUS activity was also detected in the stem parenchymal cell, primary xylem fibers, cambium, and pitch (Supplemental Figure S7A). The expression of PtoPHL3 was not so significantly influenced by low-Pi treatment compared to other PSI genes (Supplemental Figures S1, C and S7, B). PtoPHL3 is highly conserved in Populus species and its subcellular localization is in the nucleus (Supplemental Figure S7, C and D). To determine the role of PtoPHL3 in Pi starvation tolerance, we generated PtoPHL3-OE (PtoPHL3-OE19 and PtoPHL3-OE20) and PtoPHL3-RNAi (PtoPHL3-RNAi3 and PtoPHL3-RNAi5) transgenic lines (Supplemental Figure S8), and carried out Pi starvation treatments. In hydroponic tanks filled with Pi-deprived nutrient solution, the PtoPHL3-OE cuttings showed longer adventitious roots than RNAi and WT lines, and the leaves of PtoPHL3-RNAi lines were dark green (Figure 4A), whereas the PtoPHL3-OE also showed most Pi content in roots among all controlled plantlets (Figure 4B). Under Pi-deficient conditions, the shoot Pi contents in the overexpression lines were higher than those in WT and RNAi lines; the roots of RNAi lines displayed the lowest Pi level (Figure 4C). In addition, Pi deficiency led to a lower anthocyanin level in PtoPHL3-OE than in other lines, indicating alleviation of stress in these overexpression lines (Figure 4C). Similar results were observed when the low-Pi treatment was performed in test tubes (Supplemental Figure S9). These results indicated that overexpressing PtoPHL3 can alleviate the negative effects of Pi starvation in poplars. The similar phenotypes of PtoPHL3-RNAi and WT may be due to functional redundancy of the PtoPHL3 homologs. Finally, we examined the expression of PSI genes in PtoPHL3 transgenic plants and the results showed that PHT1s, PHO1s, and other PSI genes were upregulated in the PtoPHL3-OE lines, but downregulated to a certain extent in the RNAi lines (Figure 4D). Therefore, PtoPHL3 positively regulates Pi starvation tolerance in poplar, which is opposite to the function of PtoWRKY40, implying that there is an opposite effect between PtoWRKY40 and PtoPHL3 in poplar’s response to Pi starvation.
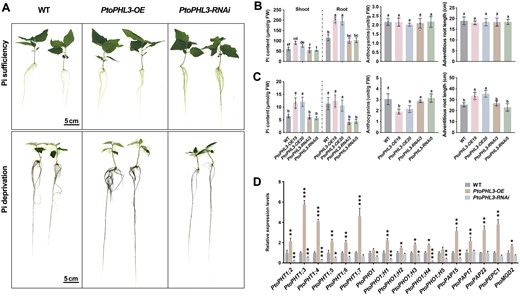
PtoPHL3 is a positive regulator of low-Pi tolerance in poplar. A, Visible phenotypes of PtoPHL3 overexpressing and RNAi lines grown in Pi deprived (0 μM Pi) and sufficient (1.25 mM Pi) Hoagland solution for 1 month. B and C, Pi contents (in shoot and root), anthocyanin contents and adventitious root lengths of PtoPHL3 overexpressing and RNAi poplars respectively. Error bars represent SD values (n ≥ 4). Letters above bars represent statistically significant differences between groups (P < 0.05) as determined by one-way ANOVA Duncan’s test. D, RT–qPCR analysis showing PSI gene expression levels in PtoPHL3 overexpressing and RNAi poplars. Error bars indicate SD values from three independent biological replicates. Student’s t test was used to determine significance statistics; *P < 0.05, **P < 0.01, ***P < 0.001. The poplar UBQ gene was used as an internal reference.
PtoPHT1s respond to Pi deficiency and PtoPHT1;3 mediates Pi content increase
The expression of PtoPHT1s significantly changes in both PtoWRKY40 and PtoPHL3 transgenic poplars. To determine whether these PtoPHT1s are responsible for Pi content, we selected and examined the spatio-temporal expression patterns of three PtoPHT1s (PtoPHT1;3, PtoPHT1;4, and PtoPHT1;5). These genes were expressed in leaves and roots, and induced by Pi deficiency (Figure 5A). Their expression levels rose in both shoot and root parts under continuous low-Pi treatment, especially, PtoPHT1;3 in two tissues showed similar induction intensity by low-Pi treatment (Figure 5B). Therefore, we generated PtoPHT1;3 overexpressing (PtoPHT1;3-OE9 and PtoPHT1;3-OE13) and RNAi (PtoPHT1;3-RNAi2 and PtoPHT1;3-RNAi9) poplars and subjected them to a low-Pi treatment (Supplemental Figure S10). The PtoPHT1;3-OE cuttings were larger scale and had a higher Pi content in both shoot and root than WT and RNAi lines after low-Pi treatment (Figure 5, C and D). The anthocyanin contents of the overexpressing poplars were also reduced compared to WT and RNAi (Figure 5D), indicating that they are more tolerant to Pi deficiency. We observed that PtoPHT1;3-RNAi poplars showed no significant differences in Pi and anthocyanin contents; this might be because of the existence of functionally redundant genes, such as PtoPHT1;4 and PtoPHT1;5. Our findings thus indicated that the expression of PtoPHT1;3, PtoPHT1;4 and PtoPHT1;5 is responsive to Pi deficiency, and that PtoPHT1;3 mediates Pi content enhancement to facilitate adaptation to low-Pi condition.
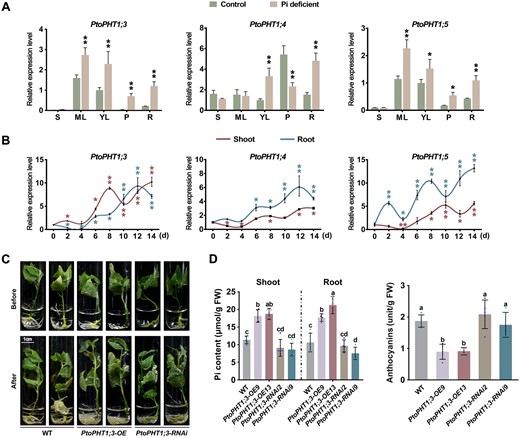
PtoPHT1;3, PtoPHT1;4, and PtoPHT1;5 are induced by low-Pi treatment and positively regulate tolerance of this stress in poplar. A, Expression levels of PtoPHT1;3, PtoPHT1;4, and PtoPHT1;5, determined by RT–qPCR analysis, in different tissues of low-Pi (10 μM Pi) stressed and control poplars: stem (S), ML, young leaves (YL), petiole (P), and root (R). B, Temporal expression patterns of these PtoPHT1 genes in shoot and root parts of poplars subjected to low-Pi treatment. Student’s t test was used to determine significance statistics; *P < 0.05, **P < 0.01. The poplar UBQ gene was used as an internal reference. Error bars indicate SD values from three independent biological replicates (A and B). C, Phenotypes of PtoPHT1;3 overexpressing and RNAi lines subjected to low-Pi treatment (10 μM Pi) for 1 month. D, Pi and anthocyanin contents of treated poplar shoot and root parts. Error bars represent SD (n ≥ 4). Different letters above bars represent statistically significant differences between groups (P < 0.05) as determined by one-way ANOVA Duncan’s test.
PtoPHT1s are the targets of PtoWRKY40 and PtoPHL3
To verify that PtoPHT1s are potential targets of PtoWRKY40 and PtoPHL3, a dual-luciferase (LUC) assay in which the LUC reporter gene driven by the promoters of these PtoPHT1s was performed (Figure 6A). Results showed that LUC expression driven by the promoters of PtoPHT1;3 and PtoPHT1;5 (PtoPHT1;3pro and PtoPHT1;5pro) was repressed by PtoWRKY40, while the PtoPHT1;4 promoter (PtoPHT1;4pro) resulted in no significant difference compared to the control. These three promoters were activated by PtoPHL3, but activation could be abolished by co-expressing PtoWRKY40 (Figure 6B). These results are consistent with the patterns of expression of PtoPHT1 in transgenic poplars.
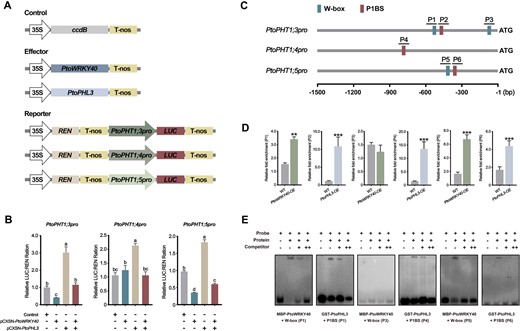
PtoWRKY40 and PtoPHL3 directly regulate expression of PtoPHT1s. A, The structure of vectors constructed for a dual-LUC assay. B, Dual-LUC assay demonstrating that PtoWRKY40 and PtoPHL3 could regulate transcriptional activity governed by the promoters of PtoPHT1;3, PtoPHT1;4, and PtoPHT1;5 (1,500-bp length regions) in N. benthamiana leaves. Error bars indicate SD values from three independent biological replicates. Different letters above bars represent statistically significant differences between groups (P < 0.05) as determined by one-way ANOVA Duncan’s test. C, Distribution of W-box and P1BS elements in 1,500-bp length promoter regions of PtoPHT1;3, PtoPHT1;4, and PtoPHT1;5. Blue and brown boxes represent W-box and P1BS elements, respectively. D, ChIP-qPCR analysis showing the binding of PtoPHL3 and PtoWRKY40 to, respectively, P1BS and W-box in the promoters of PtoPHT1;3, PtoPHT1;4, and PtoPHT1;5 in vivo. Error bars indicate SD values from three independent biological replicates. Asterisks above bars indicate statistically significant differences between the WT and transgenic plants. Student’s t test was used to determine significance statistics; *P < 0.05, **P < 0.01, ***P < 0.001. E, EMSA assay verifying that PtoPHL3 and PtoWRKY40 bind to, respectively, the P1BS and W-box elements in vitro.
In Arabidopsis, AtWRKY40 binds to the W-box (TTGACT/C) in target promoters (Shang et al., 2010), and the Myb-cc family members, such as AtPHR1, AtPHL2, and OsPHR2, participate in the regulation of the plant PSR by combining with the P1BS element (GNATATNC) (Zhou et al., 2008; Sun et al., 2016). We therefore analyzed a 1,500-bp length the promoter region in each of PtoPHT1;3, PtoPHT1;4, and PtoPHT1;5, and found that each of these promoters contains one P1BS element. There are two W-box in the PtoPHT1;3 promoter and one in the PtoPHT1;5 promoter and we numbered these regions containing a W-box or P1BS (P1–P6) (Figure 6C). A chromatin immunoprecipitation-qPCR (ChIP-qPCR) assay was performed to determine the interaction between proteins and cis-elements in vivo and it showed that all P1BS elements can be bound by PtoPHL3 and that the W-box in P1 and P5 regions can be bound by PtoWRKY40 (Figure 6D). An electrophoretic mobility shift assay (EMSA) supported these results in vitro (Figure 6E). Therefore, the findings demonstrated that these three PtoPHT1s are targets of PtoPHL3 and/or PtoWRKY40. In addition, we found that the W-box and P1BS distributes widely in the promoters of many PHT1s from Populus species (Supplemental Figures S11 and S12).
PtoWRKY40 represses PtoPHL3 binding to P1BS elements via their interaction
To determine whether the interaction of PtoWRKY40 and PtoPHL3 is indispensable for transcriptional regulation of target genes, a dual-LUC assay using LUC driven by PtoPHT1;3pro was performed (Figure 7A). We found that the LUC intensity was significantly lower when the reporter co-expressing with PtoPHL3ΔMyb-cc than with PtoPHL3. Co-expressing PtoWRKY40ΔLZ and PtoPHL3 gave a similar LUC level to that produced by expressing PtoPHL3 alone. Moreover, expressing PtoWRKY40ΔLZ did not repress PtoPHT1;3pro any further (Figure 7B). These results determined that the interaction of PtoWRKY40 and PtoPHL3 are critical for their regulation of PtoPHT1;3 transcription. When the W-box was mutated, the negative effect of PtoWRKY40 on promoter expression disappeared, but the LUC intensity in lines co-expressing PtoWRKY40 and PtoPHL3 displayed no significant differences compared to nonmutated promoter lines (Figure 7B), indicating that PtoWRKY40 has a limited ability to repress PtoPHT1;3 through binding to the W-box. The PtoWRKY40–PtoPHL3 complex is therefore the dominant molecule inhibiting the transcriptional activation of PtoPHT1;3. In addition, we examined and compared the binding activity of this complex to P1BS elements in PtoPHT1;3pro, PtoPHT1;4pro, and PtoPHT1;5pro. The results of an EMSA indicated that the P1BS-binding ability of PtoPHL3 can be attenuated or even eliminated by supplementing with PtoWRKY40 (Figure 7C). Therefore, PtoWRKY40 is a negative regulator for PtoPHL3 in terms of PtoPHT1s promoter binding and PtoPHT1s promoter trans-activation. A pull-down assay indicated that increasing the concentration of GST-PtoWRKY40 recombinant protein resulted in a decreased amount of MBP-PtoPHL3 pulled down by His-PtoPHL3 (Figure 7D). PtoWRKY40 can therefore compete for PtoPHL3 with itself.
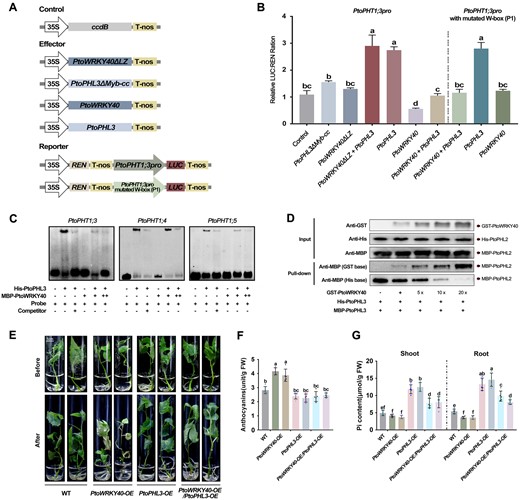
PtoWRKY40 competes for PtoPHL3 to repress its self-interaction and P1BS-binding activity. A, The structure of vectors constructed for a dual-LUC assay. B, Dual-LUC assay showing the transcriptional activities of the PtoPHT1;3 promoter and its W-box mutated form transiently co-expressed with different combinations of PtoWRKY40, PtoWRKY40ΔLZ, PtoPHL3, and PtoPHL3ΔMyb-cc constructs in N. benthamiana leaves. Error bars indicate SD values from three independent biological replicates. Different letters above bars represent statistically significant differences between groups (P < 0.05) as determined by one-way ANOVA Duncan’s test. C, EMSA assays showing that the addition of MBP-PtoWRKY40 reduced the binding of PtoPHL3-His tagged protein to P1BS elements in the promoters of PtoPHT1;3, PtoPHT1;4, and PtoPHT1;5. ++ and + represent increasing concentration of MBP-WRKY40 protein in the reactions; ++ means that 5 times more was added than in +. D, Pull-down assay showing that PtoWRKY40 competes for PtoPHL3 to inhibit self-interaction of PtoPHL3. E, Low-Pi tolerance of PtoWRKY40 and PtoPHL3 double overexpressing poplars compared to WT, PtoWRKY40-OE and PtoPHL3-OE lines. Cuttings of a similar status in Pi-sufficient conditions were transplanted into low-Pi medium for 1 month. F and G, anthocyanin contents and Pi contents in shoot and root parts of the stressed poplars. Letters above bars represent statistically significant differences between groups (P < 0.05) as determined by one-way ANOVA Duncan’s test. Error bars indicate SD values from five independent samples.
To ascertain whether PtoWRKY40 can regulate PtoPHL3 function in poplar, we generated PtoWRKY40 and PtoPHL3 double overexpression lines by overexpressing PtoWRKY40 under the background of the PtoPHL3-OE19 line (PtoWRKY40-OE/PtoPHL3-OE). The double overexpression lines grew better and had lower anthocyanin content than those of PtoWRKY40-OE lines under low-Pi condition (Figure 7, E and F). Moreover, Pi content of PtoWRKY40-OE/PtoPHL3-OE lines was significantly reduced compared to PtoPHL3 overexpression lines after low-Pi stress, but were still higher than that of PtoWRKY40-OE lines (Figure 7G), indicating that overexpression of PtoWRKY40 partially restricts the increased low-Pi tolerance of PtoPHL3-OE. Therefore, PtoWRKY40 functions as a negative regulator of PtoPHL3 function in poplar.
PalWRKY40, the PtoWRKY40 homolog in P. alba var. pyramidalis, negatively modulates Pi content
To determine whether the function of PtoWRKY40 and its homologs is conserved in Populus species tolerant to Pi deficiency, we overexpressed PalWRKY40 in P. alba var. pyramidalis and selected two transgenic lines (PalWRKY40-OE10 and PalWRKY40-OE12) for low-Pi treatment (Supplemental Figure S13). In comparison to WT, the PalWRKY40-OE poplars exhibited greater sensitivity to continuous Pi starvation because of the downregulation of PalPHT1s, leading to reduced Pi content and increased anthocyanin content (Supplemental Figure S14; Figure 8, A–C). These results are consistent with the findings in PtoWRKY40 transgenic poplars, indicating conservation of function of these genes in Populus species. In addition, we speculated that the decreased Pi content resulting from overexpression of these WRKY40s might increase tolerance to Pi toxicity. Accordingly, we examined the phenotype of PalWRKY40-OE poplars under high Pi conditions. After 2 months of treatment, the overexpression lines showed greater height and less Pi content compared to WT (Figure 8, D–F), indicating enhanced tolerance to high-Pi treatment.
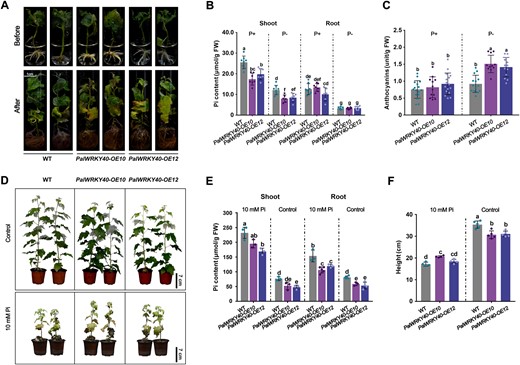
PalWRKY40 negatively modulates Pi content in P. alba var. pyramidalis. A, Phenotype of PalWRKY40 overexpressing poplars exposed to low-Pi (10 μM Pi) treatment for one month. B and C, Pi and anthocyanin contents of PalWRKY40 overexpressing poplars before and after treatment. Error bars represent SD (n ≥ 6). Different letters above bars represent statistically significant differences between groups (P < 0.05) as determined by one-way ANOVA Duncan’s test. D, Overexpression of PalWRKY40 increased tolerance of Pi toxicity. PalWRKY40-OE and WT plants grown for two months in high Pi conditions generated by watering with 10-mM KH2PO4 solution every 5 days. Plants watered with ddH2O acted as control. Scale bar = 7 cm. E and F, Pi content and plant height of PalWRKY40 overexpressing and WT poplars after 2 months of treatment. Error bars represent SD values (n ≥ 4). Different letters above bars represent statistically significant differences between groups (P < 0.05) as determined by one-way ANOVA Duncan’s test.
Discussion
How plants sense and respond to Pi deficiency has been widely investigated in Arabidopsis and rice, but has so far received little attention in the perennial woody species in which species-specific and alternative Pi up-take pathways have developed (Loth-Pereda et al., 2011). In this study, we find that a defense-related WRKY transcription factor, PtoWRKY40, plays a role in Pi starvation signaling and Pi homeostasis in poplar, acting as a negative regulator of the hub transcription factor PtoPHL3. This finding is substantiated by three lines of evidence. First, Pi deficiency downregulates expression of PtoWRKY40 and the abundance of the protein it encodes. Second, the negative effects of PtoWRKY40 affect the expression of systemically and locally controlled PSR and PSI genes. Finally, PtoWRKY40 competes with PtoPHL3 for binding to the recognition sequence. Based on these results, we propose a working model of the response to Pi starvation in poplar (Figure 9): under conditions of Pi sufficiency, PtoWRKY40 binds to W-box elements in the promoters of PtoPHT1s to repress their expression. In addition, PtoWRKY40 interacts with PtoPHL3 to impede PtoPHL3 self-interaction and bind to P1BS elements in promoters of PtoPHT1s. Both strategies avoid toxicity caused by excessive Pi. Under low-Pi conditions, in contrast, through the downregulation of PtoWRKY40 at transcription and protein level, poplar releases this inhibition of the transcription of PtoPHT1s, and thus enhances Pi content of poplar. This guarantees highly efficient usage of Pi in poplar.
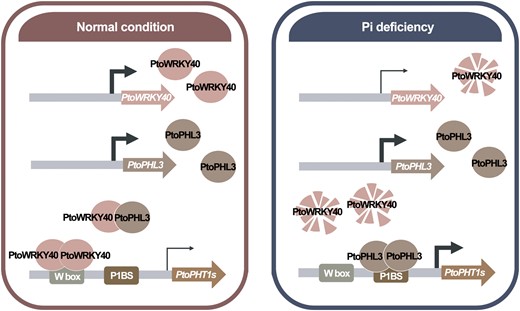
Proposed working model of the way in which the PtoWRKY40–PtoPHL3 module regulates PSR in poplar. Under Pi-sufficient conditions, PtoWRKY40 interacts with itself to bind to the W-box of the PtoPHT1s promoter and to inhibit gene expression, while PtoWRKY40 interacts with PtoPHL3 to prevent the binding of PtoPHL3 to P1BS and further to inhibit the expression of PtoPHT1s. Under Pi starvation conditions, PtoWRKY40 is inhibited at the transcriptional level, and the PtoWRKY40 protein can be degraded via the ubiquitination-mediated 26S proteasome degradation pathway. PtoPHL3 is therefore released to interact with itself and promotes expression of PtoPHT1s.
Though PHR1 is a major regulator in low-Pi responses, it shows partial functional redundancy with PHL1 and PHL2 (Barragan-Rosillo et al., 2021), as phr1 phl1 and phr1 phl2 double mutant Arabidopsis seedlings are less responsive than phr1 seedlings to Pi starvation (Cruz-Ramirez et al., 2006; Bustos et al., 2010; Sun et al., 2016). Poplar PtoPHL3, close to AtPHL2 and AtPHL3 (Figure 3A), positively regulates PSR and PSI genes (Figure 4), but Pi deficiency has a limited influence to its transcription (Supplemental Figure S7B). A phylogenetic tree indicates that these two Myb-cc transcription factors belong to different clusters (Figure 3A), and we found that PtoWRKY40 specifically interacts with PtoPHL3 homologs, not with PtoPHR1 (Figure 3B), suggesting functional differentiation between PtoPHR1 and PtoPHL3 in poplar. Therefore, the participation of PtoWRKY40 in PSR is specifically dependent on PtoPHL3 or its homologs.
In plant and yeast, SPX domain proteins show a high affinity with PP-InsP, and thus act as receptors of Pi signals (Lorenzo-Orts et al., 2020; Ried et al., 2021). In Arabidopsis, PP-InsP promotes the interaction between the SPX domain and the Myb-cc domain of PHR1 to inhibit PHR1 homo-dimerization, leading to abolition of its binding to P1BS elements (Ried et al., 2021). In rice, the cytosol-located OsSPX4, an OsSPX1 homolog, inhibits the traffic of OsPHR2, the rice PHR1 homolog, to the nucleus through hetero-dimerization of the SPX domain and OsPHR2 in cytoplasm, when Pi sufficiency (Lv et al., 2014). Our findings showed that the nucleus-localized PtoWRKY40 and PtoPHL3 interact in the nucleus through their respective LZ and Myb-cc domains (Figures 1, D and 3, E; Supplemental Figure S7C). However, we found no typic SPX domain in PtoWRKY40, and a pull-down assay demonstrated that this interaction is not involved in regulation by Pi (Figure 3C). In rice, another two mechanisms have been found to rule out the inhibition of OsPHR2 by OsSPX4: one is via a PSI bHLH transcription factor, OsbHLH6, which competes for OsSPX4 with OsPHR2 (He et al., 2021); the other is that SPX4 is degraded by the 26S proteasome proteolytic pathway, releasing OsPHR2 to shuttle into the nucleus and bind to the P1BS elements to upregulate PSI genes (Lv et al., 2014; Zhong et al., 2018). In our study, low-Pi treatment downregulated PtoWRKY40 transcription (Figure 1B; Supplemental Figure S1C) and promoted degradation of PtoWRKY40 by the 26S proteasome proteolytic pathway (Figure 1C), leading to a reduction in PtoWRKY40 abundance and thus releasing inhibition of PtoPHL3 by PtoWRKY40. How poplars negatively regulate PtoWRKY40 at both transcriptional and posttranscriptional levels in response to Pi deficiency is an interesting subject to be explored. Our results from Y2H screening showed that PtoWRKY40 could interact with PtoSIBP1, containing a BRIC-A-BRAC, TRAMTRACK AND BROAD (BTB)/COMPLEX/POX VIRUS AND ZINC FINGER (POZ) (BTB/POZ hereafter) domain (Supplemental Table S12), which predominantly acts as the substrate receptor of multi-subunit E3 ligases, providing a potential candidate for the degradation of PtoWRKY40 when Pi starvation occurs (Thomann et al., 2005; Wan et al., 2019).
Land plants establish mutualistic associations with soil microbes that can solubilize Pi from plant-inaccessible soil complexes and transfer it to the host plant (Isidra-Arellano et al., 2021). The shaping of plant-associated microbiota involves modulation of the plant immune system and the PSR system, and the outputs of these two systems are tightly integrated by PHR1 (Castrillo et al., 2017; Finkel et al., 2019). In Arabidopsis, phr1 mutant plants display increased expression of genes associated with the plant immune response (Castrillo et al., 2017; Finkel et al., 2019), indicating that PHR1 negatively modulates components of the plant immune system. However, PHR1 acts as a transcriptional activator of target genes involved in PSR (Barragan-Rosillo et al., 2021). This dual character of PHR1 can be explained by its interaction with an immunity-associated transcriptional regulatory protein, or binding to different cis-elements such as BES1 in the brassinosteroid signaling pathway (Ye et al., 2017). WRKY40 and homologs in Arabidopsis and poplar negatively regulate defense against biotrophic pathogens (Shen et al., 2007; Karim et al., 2015). These observations suggest an underlying regulatory mechanism for PSR and plant immunity tradeoff mediated by PtoPHL3 and PtoWRKY40 in poplar. How PtoPHL3 affects PtoWRKY40 in the regulation of plant immunity demands further elucidation, and the findings of such a study should provide an insight into how plants control and shape their associated microbiota to ensure beneficial effects.
Materials and methods
Plant materials and growth conditions
Sterile cuttings of Populus alba var. pyramidalis and P. × tomentosa Carr. (clone 741) were cultivated in WPM solid medium at 24°C under a light/dark cycle (16-h light/8-h dark, 4,500 lux). For examination of tolerance to continuous low-Pi treatment in tubes, the cuttings of WT and transgenic poplars were rooted in the normal MS medium with 0.1-mg L−1 NAA for 10 days, and then these rooted cuttings were transplanted in the low-Pi MS liquid medium (10 μM Pi). For Pi-deprivation treatment using a hydroponic method, rooted poplar cuttings were transplanted to Hoagland solution (Hope Bio, Qindao, China) containing 1.25 mM and without (0 μM) Pi for 4 weeks. For high Pi treatment of P. alba var. pyramidalis, rooted poplar cuttings with a height of 4 cm were transplanted into soils under normal conditions for 10 days, then half of these poplars were watered with 10-mM KH2PO4 solution every 5 days, while the other half were watered with ddH2O as the control. After 2 months, the phenotypes of the stressed and control plants were observed and the physiological data were measured. For the temporal–spatial expression patterns of genes under low-Pi conditions, rooted P. × tomentosa Carr. (clone 741) cuttings were cultured continuously in low-Pi MS medium, shoot, and root parts of these stressed poplars were collected every two days for RT–qPCR analysis. In addition, cuttings stressed for 0 and 7 days were divided into young leaves, mature leaves, petioles, stems, and roots for RNA extraction followed by RT–qPCR.
Nucleic acid extraction and RT–qPCR analysis
Total RNA was extracted from poplars with a Plant RNA Extraction Kit V1.6 (BIOFIT, Chengdu, China) and 1 μg total RNA was used to generate complementary DNA (cDNA) with a Goldenstar RT6 cDNA Synthesis Mix kit (Tsingke, Beijing, China). Gene expression levels were analyzed by RT–qPCR with a Real Time PCR East-SYBR Green I kit (Foregene, Chengdu, China). UBQ was used as reference gene to calculate the relative levels of gene expression. The RT–qPCR program was as follows: 95°C for 5 s, 60°C for 30 s, and 72°C for 30 s. For positive transgenic lines validation and promoters cloning, poplar genomic DNA (gDNA) were extracted by a CTAB method (Rogers and Bendich, 1985). All the primers used are listed in Supplemental Table S13.
Gene cloning and poplar transformation
For coding sequence (CDS) cloning of PtoWRKY40, PtoPHL3, PtoPHT1;3, and PalWRKY40 from cDNA, the PCR parameters were as follows: initial denaturation 98°C for 30 s, 34 cycles of 98°C for 10 s, 56°C for 15 s, and 72°C for 60 s, and final extension at 72°C for 5 min. The inNova II High-Fidelity DNA polymerase (Innovagene, Hunan, China) was used in these PCR reactions. The Xcm I-digested pCX-DG vector (Chen et al., 2009a, 2009b) was used to construct the overexpression and RNAi recombination vectors with a Seamless Cloning Mix kit (Biomed, Beijing, China). Subsequently, these constructs were introduced into Agrobacterium strain GV3101 by a freeze–thaw method (Jyothishwaran et al., 2007). The Agrobacterium-mediated transformation of P. alba var. pyramidalis and P. × tomentosa Carr. (clone 741) was carried out using a leaf disc method (Jia et al., 2010). Hygromycin-screened poplars were checked for the presence of transgenes by PCR and the gene expression level was determined by RT–qPCR. The promoter regions of genes were isolated from the poplar gDNA using sequence-specific primers. All the primers used are listed in Supplemental Table S13.
GUS staining
The 1,500-bp length of the promoter regions of PtoWRKY40 and PtoPHL3 were isolated and ligated into the Xcm I-digested pCX-GUS-P vector (Chen et al., 2009a, 2009b), and the constructs were introduced into poplar. The transgenic poplar was detached into roots, stems, leaves, and petioles which were submerged in GUS dye solution (0.1 M PBS, pH 7.0; 10 mM EDTA, pH 8.0; 0.1% (v/v) Triton X-100; 1 mM K3Fe(CN)6; 2 mM X-Gluc) at 37°C. Decolorization of stained tissues was carried out with 100% alcohol at 60°C overnight, and observed GUS staining using a stereoscopic microscope (SteREO Discovery.V12, ZEISS).
Y2H assay
To perform Y2H screening, the CDS of PtoWRKY40 ligated to the EcoR I/BamH I-digested pGBKT7 vector (BD, Clontech, Dalian, China) as a bait and the specific experimental method follows the previous description (Maple and Møller, 2007). To confirm the interaction between PtoWRKY40 and PtoPHL3 (or its homologs), CDS fragments of PtoPHL3 or its homologs were cloned into EcoR I/BamH I-digested pGADT7 (AD) and co-introduced with BD-PtoWRKY40 into Saccharomyces cerevisiae strain AH109. Synthetic dropout (SD) medium lacking tryptophan (Trp, W), Leu, L, and histidine (His, H) with 3-amino-1,2,4-triazole (3-AT) (Sangon, Beijing, China) was used as the screening medium. In addition, the homolog of PtoWRKY40, PtoWRKY77, was also constructed into BD to verify the protein interaction with PtoPHL3. PtoWRKY40ΔLZ without the LZ domain (truncated from 54th to 92th amino acid residues) and PtoPHL3ΔMyb-cc without the Myb-cc domain (truncated from 138th to 185th amino acid residues) were fused with AD, and co-introduced into AH109 with different recombinant BD or empty BD vector, respectively. All the primers used are listed in Supplemental Table S13.
Subcellular localization and BiFC assay
For subcellular localization, CDS fragments of PtoWRKY40, PtoPHL3, and their truncated fragments were ligated into the Xba I/Kpn I-digested pBI221 vector. For BiFC assay of PtoWRKY40 and PtoPHL3, two genes were ligated with Bgl II/Xba I-digested pSAT1-cGFP-N (nGFP) and Bgl II/Xba I-digested pSAT1-cGFP-C (cGFP) vectors respectively. For BiFC assay of PtoPHL3 itself, PtoPHL3 were constructed into pSAT1-cGFP-N and pSAT1-cGFP-C vectors, respectively, and co-expressed in poplar mesophyll protoplasts. The combinations of PtoPHL3-nGFP with empty cGFP and PtoPHL3-cGFP with empty nGFP vector served as negative controls. Based on a previous method (Guo et al., 2012), mesophyll protoplasts were isolated from poplar leaves with an enzymic solution containing CELLULASE R10 and MACEROZYME R10 (YAKULT, Honsha, Japan). The observation of transiently transformed protoplasts was carried out using a confocal laser microscope (Leica TCS SP5 II system). The GFP was excited at 488 nm, 35% transmissivity, 100 nm collection bandwidth, and gain was 1. The marker 4′,6-diamidino-2-phenylindole (DAPI) was used to stain the cell nuclei and its excitation wavelength is 340 nm. The chlorophyll b was excited at 670 nm.
Detection of PtoWRKY40 protein degradation
The following experiment was carried out to test whether PtoWRKY40 is degraded through the ubiquitination degradation pathway. Extracts of nucleoproteins from normal condition and low-Pi treatment poplars were prepared. About 10 μg of GST-PtoWRKY40 recombinant protein and GST protein purified from Escherichia coli were mixed with 40 μL of nucleoprotein extract, and incubated at 37°C for 0, 15, 30, 45, and 60 min. The subsequent immunoblot analysis to detect proteins was carried out using an anti-GST (1:5,000, v/v) monoclonal antibody (Abcam, Cambridge, UK). In addition, 3 μL of 50 μM 26S proteasome inhibitor MG132 was added to the mixture and incubated for 60 min to detect protein degradation.
Pull-down assay
CDS fragments of PtoWRKY40 and PtoPHL3 were ligated to the EcoR I/Sal I-digested pMal-C2x, EcoR I/Xho I-digested pGEX-4T-1, and BamH I/Hind III-digested pET30a-1 vectors and introduced into E. coli strain BL21. The MBP-PtoWRKY40, GST-PtoWRKY40, MBP-PtoPHL3, and His-PtoPHL3 recombinant proteins were purified by an affinity method using Amylose Resin (NEB, Ipswich, USA), Glutathione-Sepharose beads (Abcam, Cambridge, UK) and Ni-NTA agarose (Qiagen, Hilden, Germany), respectively. To verify the self-interaction of PtoPHL3, 2 μg MBP-PtoPHL3 fusion protein or MBP protein was incubated with Amylose Resin beads in binding buffer (5 mM Tris–HCl pH 7.5, 100 mM NaCl, 0.25% Triton X-100 and 35 mM β-mercaptoethanol). After rotating the mixture at 4°C for 4 h, 2 μg His-PtoPHL3 fusion protein was added to each of these mixtures and incubated at 4°C for 3 h. The mixtures were centrifuged at 150g to remove the supernatant and pellets were washed 5 times with a binding buffer. 5 × SDS loading buffer was added to each of the washed samples, which were then heated at 100°C for 10 min. After centrifugation at 12,000g for 1 min, the supernatant of the samples was separated by 12% SDS–PAGE, and visualized by immunoblot analysis with anti-His antibody (NEB, Ipswich, USA). To verify the interaction between PtoPHL3 and PtoWRKY40 in the absence or presence of Pi, 2 μg GST-PtoWRKY40 and GST protein were incubated with Glutathione-Sepharose beads in binding buffer with or without Pi. Afterward, the MBP-PtoPHL3 fusion protein was added, respectively, pull-down was carried out according to the above description, and immunoblot analysis was carried out with anti-MBP antibody (NEB, Ipswich, USA). To assess PtoWRKY40 competing for PtoPHL3, 10 μg MBP-PtoPHL3 and His-PtoPHL3 recombinant proteins were mixed with different concentrations of GST-PtoWRKY40 (1×, 5×, 10×, and 20×) in binding buffer. These mixtures were incubated at 4°C for 1 h. Each was divided into two equal volumes, 30 μL Ni-NTA Agarose and Glutathione-Sepharose beads were added and the reaction was carried out for 1 h. The supernatant was removed by centrifugation at 150g and the pellets were washed 5 times with binding buffer. An immunoblot analysis was carried out using an anti-MBP antibody after denaturation of the samples at 95°C.
Co-IP assay
For the Co-IP assay, 35S:PtoWRKY40-Flag with 35S:PtoPHL3-Myc and 35S:PtoWRKY40ΔLZ-Flag with 35S:PtoPHL3-Myc were transiently co-expressed in Nicotiana benthamiana leaves, respectively. After darkness for 2 days and light for 1 day, 2 g infiltrated leaves were ground with liquid nitrogen. To each sample 2 mL IP buffer (20 mM HEPES pH 7.5, 40 mM KCl, 1 mM EDTA and 1% Triton X-100) was added and the supernatants were collected after centrifugation at 12,000g. These supernatants were then incubated with 15 μL anti-Flag affinity beads (Engibody, Dover, USA) at 4°C for 20 min and washed 4 times with IP buffer followed by 500g centrifugation for 1 min every time. Finally, the proteins in the washed samples were separated by 12% SDS–PAGE, and visualized by immunoblotting with anti-Flag and anti-Myc antibodies (Abcam, Cambridge, UK). Nicotiana benthamiana leaves co-infiltrated combination of 35S:PtoWRKY40-Flag or 35S:PtoPHL3-Myc with empty vector as controls.
EMSA
The recombinant proteins MBP-PtoWRKY40 and GST-PtoPHL3 were used in an EMSA. Biotin-labeled probes were synthesized by Ykang company (Hangzhou, China) based on the sequence of the W-box or P1BS element from the promoter of PtoPHT1;3, PtoPHT1;4 and PtoPHT1;5 (Supplemental Table S13). Unlabeled cold probes were also synthesized as competitors. Following the protocol for the LightShift Chemiluminescent EMSA Kit (Thermo Scientific, Waltham, USA), the recombinant proteins were incubated with the probes at room temperature and the corresponding cold probes at a range of concentrations were used for the competition experiments. To test whether PtoWRKY40 affects PtoPHL3 binding to the P1BS element, His-PtoPHL3 and MBP-PtoWRKY40 were used in a competition-binding assay. His-PtoPHL3 recombinant protein was incubated with P1BS probes and competition was increased by adding different amount of MBP-PtoWRKY40. All the primers and probes used are listed in Supplemental Table S13.
Dual-LUC assay
The 1,500-bp length promoter regions of PtoPHT1;3, PtoPHT1;4, and PtoPHT1;5 were cloned by PCR and ligated with the Hind III/BamH I-digested pGreen II 0800-LUC vector to drive expression of a firefly LUC gene as a reporter. Recombinant pCX-DG vectors containing PtoPHL3, PtoWRKY40, PtoWRKY40ΔLZ, and PtoPHL3ΔMyb-cc driven by a 35S promoter were used as the effectors in this assay. The effector and reporter constructs were transiently expressed in N. benthamiana leaves. After incubation in the dark for 2 days and the light for 1 day, the fluorescence intensity was measured using a Luciferase Reporter Assay Kit (Promega, Madison, USA). The empty vector pCX-DG co-expressed with the reporters served as a control. To analyze the effect of the W-box (P1) from the PtoPHT1;3 promoter, we mutated the core sequence of this element from 5′-TTGACT-3′ to 5′-AAAAAA-3′ by PCR. All the primers used are listed in Supplemental Table S13.
ChIP-qPCR assay
To confirm the binding of PtoWRKY40 and PtoPHL3 to the W-box and the P1BS element in the promoters of target genes in vivo, respectively, the following experiment was performed. CDS fragments of PtoWRKY40 and PtoPHL3 were fused with a GFP gene in the pCX-DG vector, and introduced into poplars for ChIP. An amount of 3 g fresh poplar leaves were cut into pieces and submerged in 37 mL 1% formaldehyde solution for 15 min under vacuum. After that, 2.5 mL 2 M glycine solution was added and the sample was ground to powder with liquid nitrogen. Then 30 mL of solution I (0.4 M sucrose; 10 mM Tris–HCl, pH 8.0; 5 mM β-mercaptoethanol; 0.1 mM PMSF; 10 μL protease inhibitor) was added, and the mixture was filtered through Miracloth (Calbiochem, Darmstadt, Germany). The filtrate was centrifuged at 2,880g for 20 min at 4°C, and the precipitate was resuspended in 1 mL of solution II (0.25 M sucrose; 10 mM Tris–HCl, pH 8.0; 10 mM MgCl2; 1% Triton X-100; 5 mM β-mercaptoethanol; 0.5 mM PMSF; 10 μL protease inhibitor). After centrifugation again at 12,000g for 10 min at 4°C the precipitate was resuspended in 600 μL of solution III (1.7 M sucrose; 10 mM Tris–HCl, pH 8.0; 2 mM MgCl2; 0.15% Triton X-100; 5 mM β-mercaptoethanol; 0.1 mM PMSF; 10 μL protease inhibitor). The suspension was centrifuged at 4°C 16,000 × g for 1 h and the supernatant discarded. Finally, the precipitate was suspended in 400 μL nuclear lysate solution, and the DNA was sheared by an ultrasonic DNA shearing system (Q800R2, Qsonica, Newtown, USA). The sheared DNA was diluted 10 times to a volume of 3 mL with ChIP diluent (16.7 mM Tris–HCl, pH 8.0; 1% Triton X-100; 1.2 mM EDTA; 167 mM NaCl; 0.1 mM PMSF; 10 μL protease inhibitor) and protein A agarose (Abcam, Cambridge, UK) was added to eliminate nonspecific binding. After taking 10% of the mixture as the input, the remaining liquid was divided into two parts, one with anti-GFP antibody (Songon, Shanghai, China) and protein A agarose to immunoprecipitate DNA, and the other with protein A agarose only as the mock. Unbound protein was removed after co-incubation. The immunoprecipitated DNA was purified by a phenol/chloroform DNA extraction method (Köchl et al., 2005). qPCR was carried out to test that the specified DNA fragment had been enriched by ChIP, using the input and mock treatment DNA as references. All the primers used are listed in Supplemental Table S13.
Measurement of anthocyanin content
An amount of 0.1 g fresh leaves were submerged in 1 mL hydrochloric acid/methanol (v/v, 1/99) at 4°C until they turned white. Then 200 μL of supernatant was taken and the absorption values A530 and A657 were measured in a microplate reader (Synergy H1, BioTek, Vermont, USA). The formula used for anthocyanin concentration calculation was as follows: (A530-0.25*A657)/fresh weight (Rabino and Mancinelli, 1986).
Measurement of Pi content
Following a previous report (Ames, 1966), fresh tissues were homogenized in a high-throughput grinder (SCIENTZ-48, Ningbo, China) with 100 μL of phosphorus extraction buffer (0.2922 g L−1 EDTA; 1.21 g L−1 Tris; 5.844 g L−1 NaCl; 700 μL L−1 β-mercaptoethanol; 100 mM PMSF) and 900 μL of 1% acetic acid, followed by incubation at 42°C for 30 min. The homogenate was centrifuged at 12,000g for 5 min. To 150 μL supernatant 350 μL color buffer (0.35 g ammonium molybdate, 2.339 mL concentrated sulfuric acid, and 1.4 g ascorbic acid adjusted to a constant volume of 100 mL with ddH2O) was added. The mixture was incubated at 42°C for 30 min and the absorption value at 820 nm was determined in order to calculate the Pi content according to a standard curve.
RNA-Seq
For RNA-seq, rooted cuttings of WT and PtoWRKY40-OE poplars were cultured in liquid MS or low-Pi MS medium (10 μM Pi) in sterilized test tubes for 7 days; after that, the whole WT and PtoWRKY40-OE plants (including shoot and root) were quick-frozen in liquid nitrogen for the extraction of total RNA. The cDNA library revered from the RNA, following library quality inspection and sequencing were completed in Novogene (Beijing, China) by Illumina HiSeqTM2000 platform. The raw reads of RNA-seq were quality assessment by FastQC version 0.11.9, and Transcripts Per Million be counted by Stringtie-2.1.6 (Kovaka et al., 2019). Then EdgeR and DESeq2 were used to analysis DEGs (P < 0.05, Fold Change values ≥ 1.5) and annotation (Love et al., 2014). GO functional classification for DEGs was performed using the Web Gene Ontology Annotation Plotting (https://wego.genomics.cn/; Ye et al., 2018). There were at least two independent plants for the RNA-seq. All RNA-seq data generated in this study have been submitted to the National Genomics Data Center (NGDC; https://bigd.big.ac.cn/bioproject) under BioProject accession number CRA007085.
Statistical methods
Statistical analysis was performed with SPSS Statistics version 17. Different letters such as a, b, c, and d represent statistically significant differences according to one-way ANOVA (P < 0.05). Student’s t test was also used in the study. Asterisks indicate significant differences compared to controls in Student’s t test. *P < 0.1; **P < 0.05; ***P < 0.01.
Accession numbers
All sequencing data about the P. × tomentosa Carr. (clone 741) from the NGDC (https://bigd.big.ac.cn/bioproject) under BioProject accession number PRJCA009569 (Tong et al., 2022): PtoWRKY40 (P.x_tomentosa12171), PtoPHL3 (P.x_tomentosa10101), PtoPHT1;3 (P.x_tomentosa23303), PtoPHT1;4 (P.x_tomentosa39705), and PtoPHT1;5 (P.x_tomentosa68647). The sequencing data about the P. alba var. pyramidalis from the NGDC (https://bigd.big.ac.cn/bioproject) under BioProject accession number PRJCA002423 (Zhang et al., 2021a, 2021b).
Supplemental data
The following materials are available in the online version of this article.
Supplemental Figure S1. Characteristics of PtoWRKY40.
Supplemental Figure S2. Relative expression levels identification of PtoWRKY40 overexpression and RNAi transgenic P. × tomentosa Carr. (clone 741).
Supplemental Figure S3. Tolerance of PtoWRKY40 overexpressing and RNAi poplars to low-Pi conditions.
Supplemental Figure S4. Heat map indicating the expression levels of genes involved in PSR, anthocyanin and flavonoid biosynthesis, and regulation of root and root hair development in PtoWRKY40 overexpressing poplars compared to WT in Pi-sufficient conditions.
Supplemental Figure S5. The expression levels of several PSI genes in the low-Pi stressed PtoWRKY40-OE (L6 and L9) and WT poplars compared to the nonstressed WT.
Supplemental Figure S6. Pull-down and BiFC assays determined self-interaction of PtoPHL3.
Supplemental Figure S7. Characteristics of PtoPHL3.
Supplemental Figure S8. Relative expression levels of PtoPHL3 in overexpressing and RNAi transgenic P. × tomentosa Carr. (clone 741).
Supplemental Figure S9. Low-Pi-treated PtoPHL3 overexpressing and RNAi poplars.
Supplemental Figure S10. Relative expression levels of PtoPHT1;3 in overexpressing and RNAi transgenic P. × tomentosa Carr. (clone 741).
Supplemental Figure S11. Distribution of W-box and P1BS elements in the P. trichocarpa PHT1 promoters.
Supplemental Figure S12. Distribution of W-box and P1BS elements in the PHT1 promoters of P. alba var. pyramidalis.
Supplemental Figure S13. Identification of PalWRKY40 overexpressing transgenic P. alba var. pyramidalis.
Supplemental Figure S14. Expression levels of PalPHT1s in PalWRKY40 overexpressing lines.
Supplemental Table S1. Genes differentially expressed in low-Pi treated WT poplars compared to unstressed plants.
Supplemental Table S2. Genes differentially expressed in PtoWRKY40-OE lines compared to WT under normal conditions.
Supplemental Table S3. The GO enrichment of the 53 DEGs upregulated in WT (P−) and in PtoWRKY40-OE (P+) poplars.
Supplemental Table S4. The functional annotation of the 53 DEGs upregulated in WT (P−) and in PtoWRKY40-OE (P+) poplars.
Supplemental Table S5. The GO enrichment of the 173 DEGs downregulated in WT (P−) and in PtoWRKY40-OE (P+) poplars.
Supplemental Table S6. The functional annotation of 173 DEGs downregulated expression level in WT (P−) and PtoWRKY40-OE (P+) poplars.
Supplemental Table S7. The GO enrichment of the 35 DEGs upregulated in WT (P−) but downregulated in PtoWRKY40-OE (P+) poplars.
Supplemental Table S8. The 35 genes significantly upregulated in WT (P−) but downregulated in PtoWRKY40-OE (P+) poplars.
Supplemental Table S9. Distribution of W box on promoters of 53 genes upregulated simultaneously in WT(P−) and PtoWRKY40-OE (P+).
Supplemental Table S10. Distribution of W box on promoters of 173 genes downregulated simultaneously in WT(P−) and PtoWRKY40-OE (P+).
Supplemental Table S11. Distribution of W box on the promoters of 35 genes upregulated in WT(P−) but downregulate in PtoWRKY40-OE(P+).
Supplemental Table S12. Proteins potentially interacting with PtoWRKY40 according to Y2H screening assay.
Supplemental Table S13. Primers used in this study.
Acknowledgments
The authors appreciate Prof. Tao Ma from Sichuan University for the supports of the RNA-seq analysis.
Funding
This work was supported by National Key Research and Development Program of China (2021YFD2201100, 2021YFD2200202 and 2016YFD0600101), the National Natural Science Foundation of China (32071732 and 31700528), Fundamental Research Funds for the Central Universities (2020SCUNL207, SCU2019D013, SCU2021D006 and 2020SCUNL103), and China Postdoctoral Science Foundation (2017M623037).
Conflict of interest statement. None declared.
These authors contributed equally (N.C., S.T., and J.Y.).
J.Q.L., Y.Z.J., N.N.C., and J.Y. designed the research. N.N.C., S.F.T., K.C., W.S.S., and J.C.L. performed the research. J.J.Q. and W.W.W. analyzed the RNA-seq data. Y.Z.J. and N.N.C. analyzed all results and data. Y.Z.J and J.Q.L wrote the article.
The author responsible for distribution of materials integral to the findings presented in this article in accordance with the policy described in the Instructions for Authors (https://dbpia.nl.go.kr/plphys/pages/general-instructions) is Ningning Chen ([email protected]) or Yuanzhong Jiang ([email protected]).
