


Abstract
Cucurbitales are an important order of flowering plants known for encompassing edible plants of economic and medicinal value and numerous ornamental plants of horticultural value. By reanalyzing the genomes of two representative families (Cucurbitaceae and Begoniaceae) in Cucurbitales, we found that the previously identified Cucurbitaceae common paleotetraploidization that occurred shortly after the core-eudicot-common hexaploidization event is shared by Cucurbitales, including Begoniaceae. We built a multigenome alignment framework for Cucurbitales by identifying orthologs and paralogs and systematically redating key evolutionary events in Cucurbitales. Notably, characterizing the gene retention levels and genomic fractionation patterns between subgenomes generated from different polyploidizations in Cucurbitales suggested the autopolyploid nature of the Begoniaceae common tetraploidization and the allopolyploid nature of the Cucurbitales common tetraploidization and the Cucurbita-specific tetraploidization. Moreover, we constructed the ancestral Cucurbitales karyotype comprising 17 proto-chromosomes, confirming that the most recent common ancestor of Cucurbitaceae contained 15 proto-chromosomes and rejecting the previous hypothesis for an ancestral Cucurbitaceae karyotype with 12 proto-chromosomes. In addition, we found that the polyploidization and tandem duplication events promoted the expansion of gene families involved in the cucurbitacin biosynthesis pathway; however, gene loss and chromosomal rearrangements likely limited the expansion of these gene families.
Introduction
Among the eudicots, Cucurbitales is an important order of flowering plants with unisexual flowers, with more than 2,680 species belonging to 128 genera (Matthews and Endress, 2004; Schaefer et al., 2009; Filipowicz and Renner, 2010). Cucurbitales plants are mostly annual or perennial vines and herbs, and the remainder are thorny shrubs or trees (Schaefer et al., 2009). Cucurbitales includes many important edible and medicinal plants, such as cucumber (Cucumis sativus) (2n = 2x = 14), melon (Cucumis melo) (2n = 2x = 24), and pumpkin (Cucurbita moschata) (2n = 2x = 40) (Xie et al., 2019), as well as many ornamental plants, such as Begonia masoniana (2n = 2x = 30) and Begonia loranthoides (2n = 2x = 38) (Li et al., 2022). Because of their high economic and horticultural value, genome sequences of 24 species have been obtained in the two largest families, Cucurbitaceae and Begoniaceae, in Cucurbitales. Cucurbitaceae is the second largest fruit and vegetable family among angiosperms after Solanaceae, containing more than 115 genera and 960 species (Wang et al., 2018a; Guo et al., 2020; Ma et al., 2022). Begoniaceae has more than 2 genera and 1,601 species (http://www.theplantlist.org/) and is known for its great diversity in leaf shapes, colors, patterns, and textures (Dewitte et al., 2011). Based on its rich species diversity, Begoniaceae is also expected to be a model species in the field of floral research. Deciphering the genomes of Cucurbitaceae and Begoniaceae provides important data materials for studying the evolutionary trajectory of Cucurbitales plants.
Recursive polyploidization or whole-genome duplication (WGD) is an important driver of plant evolution and is widely present in the evolution of angiosperms (Soltis et al., 2015; Soltis and Soltis, 2016). Polyploidization results in the generation of a large number of duplicated genes, leading to genome instability (Wang et al., 2009), which is characterized by extensive chromosomal rearrangements and massive gene loss (Paterson et al., 2004; Wang et al., 2005, 2017, 2018a; Murat et al., 2017; Zhuang et al., 2019). Similar to most plant clades in eudicots, Cucurbitales have experienced the core eudicot common hexaploidization (ECH or gamma) event (The Angiosperm Phylogeny Group, 2016). The ECH event was detected in the Arabidopsis thaliana genome and subsequently better characterized in the Vitis vinifera genome, which revealed the triplication of seven ancestral eudicot chromosomes at ∼115–130 million years ago (MYA) (Bowers et al., 2003; Jaillon et al., 2007). Previously, by analyzing the molecular distance of homologous genes generated by polyploidy in Cucurbitaceae, it was found that Cucurbitaceae experienced a paleotetraploidization event after the ECH; this WGD event occurred at approximately 90–102 MYA (Wang et al., 2018a). The tetraploidization event of Cucurbitaceae occurred at a time close to the ECH event. Considering the relatively close phylogenetic position of Cucurbitaceae and Begoniaceae (The Angiosperm Phylogeny Group, 2016), we speculate that Begoniaceae may also share this polyploidization event. However, recent studies on the estimates of the age of molecular differentiation based on DNA sequence data suggest that, apart from the ECH, Begoniaceae experienced only one duplication event at ∼35 ± 8 MYA (Li et al., 2022). Therefore, whether Cucurbitaceae and Begoniaceae experienced two polyploidization events independently or shared one polyploidization event is a question worth investigating.
Chromosomal rearrangements are extensive in eukaryote genomes and involve chromosome inversions, translocations, and fusions (Zhao et al., 2021). Extensive rearrangements can promote genome remodeling and provide opportunities for genetic innovation (Pont et al., 2019). Among all patterns of chromosomal rearrangements, chromosome fusion is the main reason for the general reduction in chromosomes following recursive polyploidization (Pont et al., 2019). Fusion involves two patterns, chromosome end-to-end joining (EEJ) and nested chromosome fusion (NCF) (Schubert and Lysak, 2011; Wang et al., 2015b, 2016a). The specific mechanisms of ancestral karyotype evolution and the impact of chromosomal rearrangements on the structure and function of extant genomes are still very important questions (Schubert, 2007). Previous studies have shown that the ancestral eudicot karyotype (AEK) has seven chromosomes (Jaillon et al., 2007). However, there is still no uniform conclusion for the construction of the ancestral Cucurbitaceae karyotype (ACK-II), which is considered to have 12 or 15 proto-chromosomes (Wu et al., 2017; Xie et al., 2019), which has motivated us to conduct this study. Moreover, the ancestral Cucurbitales karyotype (ACK-I) has still not been studied. The evolutionary trajectory of karyotypes is an answer to the question of how the ancestors of Cucurbitales originated and evolved. Thus, it is crucial to reconstruct the ancestral karyotypes of Cucurbitales and Cucurbitaceae.
Here, by performing our previously developed comparative genomic pipeline (Wang et al., 2018a), we compared all available genomes with a chromosome-level assembly from the Cucurbitales and the well-characterized eudicot reference genome V. vinifera (Figure 1A). We aimed to determine the times of the Cucurbitales common tetraploidization (CCT) and other polyploidization events in Cucurbitales; to construct a multigenome alignment framework for Cucurbitales through identified orthologs and paralogs produced by polyploidization and species divergence; to construct the ACK-I and clarify the ACK-II; to explore gene retention and loss and the situation of biased genomic fractionation in Cucurbitaceae and Begoniaceae; and to explore the gene expansion patterns of families in the cucurbitacin synthesis pathway.
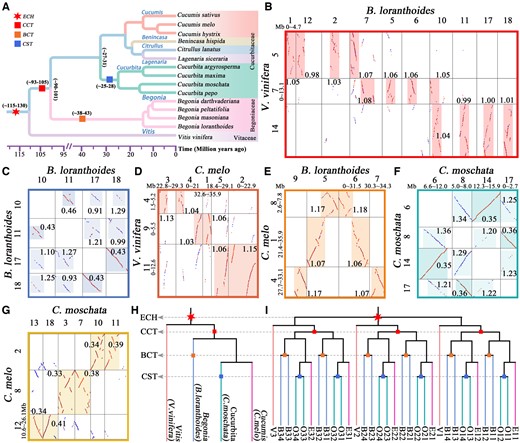
Phylogenetic tree and examples of homologous gene dotplots in Cucurbitales. A, Phylogenetic relationships of the Cucurbitales plants and V. vinifera. B–G, Identified orthologous and paralogous regions between and within genomes of V. vinifera, C. melo, C. moschata, and B. loranthoides. Dark highlighted boxes represent the identified orthologous and paralogous regions, and the highlighted paralogous regions became lighter as the time of the WGD event gets older. The best BLAST-hits are plotted as red dots, and other hits are plotted as blue dots. The Ks median of collinear gene pairs in homologous regions is marked near to the boxes. The lengths of compared chromosome regions are shown in Mb. H, Species phylogenetic trees for the V. vinifera, C. melo, C. moschata, and B. loranthoides genomes. The red six-pointed star represents the ECH event, and the red, orange, and blue squares represent the CCT, BCT, and CST events, respectively. ECH, core-eudicot-common hexaploidization. I, Three ECH-produced paralogous genes in V. vinifera (V) are denoted V1, V2, and V3, each having four orthologous genes in the B. loranthoides (B) or C. moschata (O) genomes and two in the C. melo (E) genome.
Results
Cucurbitaceae common tetraploidization event shared by Cucurbitales
To infer the placement of previously identified Cucurbitaceae common tetraploidization event in Cucurbitales, we performed a comparative analysis of the 14 genomes in six genera from two families Cucurbitaceae and Begoniaceae by using V. vinifera as outgroup (Figure 1A and Supplemental Table S1). Through genome collinearity comparisons, we identified the homologous genes and blocks within and between the studied species (Supplemental Table S2). We found that the Begoniaceae genomes contain better intragenomic collinearity than Cucurbitaceae genomes, and the plants from these two families maintain excellent intergenomic collinearity. Notably, for blocks with four or more collinear gene pairs, the similar numbers of identified collinear gene pairs were found in the plants of genus Begonia and Cucurbita, which are including 19,892–34,215 collinear gene pairs located in 2,226–2,647 blocks. Then, we characterized the synonymous nucleotide substitution rate (Ks) between collinear gene pairs, and estimated that the peaks of Ks distributions were related to the polyploidization and speciation events (Figure 2A and Supplemental Table S3). Clearly, we found that the three Ks peaks of B. loranthoides at 0.425, 1.034, and 1.174, and the two younger peaks are likely corresponding to the two rounds of WGDs occurred in Begonia after the ECH event, rather than the one WGD event reported previously (Li et al., 2022).
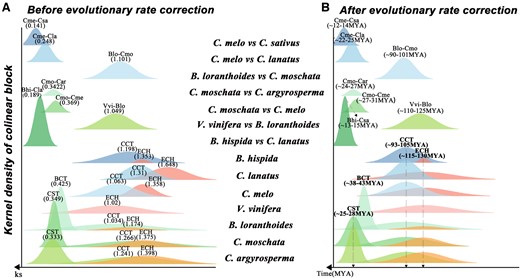
Original and corrected Ks distribution among collinear genes of the studied genomes. A, Distribution of average synonymous substitution levels (Ks) between collinear gene pairs in intergenomic blocks and intragenomic blocks. The different colored peaks indicate the normal distribution of the Ks values of collinear gene pairs. The values in parentheses are the Ks peaks corresponding to the events. B, Correction to the Ks distribution and the time of occurrence of key evolutionary events. The values in parentheses are the times corresponding to the events. Vitis vinifera (Vvi), B. loranthoides (Blo), C. moschata (Cmo), C. argyrosperma (Car), C. melo (Cme), B. hispida (Bhi), C. sativus (Csa), and C. lanatus (Cla).
Further, the homologous gene dotplots were produced by our custom software (Wang et al., 2017, 2019b) and used to identify the orthologous and paralogous regions (Figure 1, B–G). The orthologous regions and paralogous regions can be identified according to the peaks of Ks distributions related to the specific speciation and polyploidization event (see “Materials and methods” for details). We observed an orthology ratio of 1:4 between the V. vinifera and B. loranthoides genomes (Figure 1B and Supplemental Figures S1 and S2), and detected a genomic region of B. loranthoides, matched to one paralogous region generated from the most recent WGD and two paralogous regions generated from the older WGD event (Figure 1C and Supplemental Figures S3 and S4). These results indicate that the B. loranthoides experienced two successive polyploidization events after the ECH. Then, we obtained an orthology ratio of 1:2 between the V. vinifera and C. melo genomes and an orthology ratio of 1:2 between the C. melo and B. loranthoides genomes (Figure 1, D and E and Supplemental Figures S5–S8). These results indicate that the Cucurbitaceae common tetraploidization also shared by Begoniaceae, which can be called the CCT event. If the CCT is shared only by Cucurbitaceae, the orthology ratio between C. melo and B. loranthoides should be 2:4, rather than 1:2. Similarly, we confirmed that the C. moschata experienced two successive polyploidization events after the ECH (Figure 1, F and G and Supplemental Figures S9–S12). Based on this analysis, we obtained an expected topology of homologous gene tree related to the WGDs and divergence of V. vinifera and three representative species of Cucurbitales, and showed the placements of the key polyploidization events on the species tree (Figure 1, A, H, and I).
Evolutionary rates and dates of key events in Cucurbitales
By analyzing the Ks distributions of collinear genes within and between the genomes, we characterized the divergence of evolutionary rates between Cucurbitales plants (Figure 2A and Supplemental Table S3). Within genomes, the Ks of paralogous gene pairs generated from the polyploidization events with very close time often show an overlapping distribution and with abnormally long tails. This makes it difficult to identify the Ks peaks corresponding to the polyploidization events. Here, we employed a comprehensive statistical approach to identify the major normal distributions within the observed Ks distributions, as proposed in previous studies (Wang et al., 2017, 2019b, 2020a). We found that the ECH-related Ks peaks from the different genomes varied and were present at ∼1.02 for V. vinifera, ∼1.174 for B. loranthoides, and ∼1.358 for C. melo (Supplemental Table S3). This result indicates that in Cucurbitales, the B. loranthoides from Begoniaceae had the slower evolutionary rate and that C. melo from Cucurbitaceae evolved faster, 15.67% faster than B. loranthoides. Further, comparing the CCT-related Ks peaks within the different genomes were also divergent, peaking at ∼1.034 in B. loranthoides, ∼1.266 in C. moschata, and ∼1.063 in C. melo. This result again demonstrated that the B. loranthoides has a slower evolutionary rate than C. melo, and the C. melo has been proved to be the slowest plant in Cucurbitaceae (Wang et al., 2018a). Therefore, we conclude that the evolutionary rate of the genomes of Begoniaceae is slower than that of Cucurbitaceae.
Differences in the rate of evolution can lead to the temporal distortion of evolutionary events. To date the key evolutionary events in Cucurbitales, we used an algorithm similar to the one proposed previously (Wang et al., 2015b, 2016a, 2016b, 2017; Liu et al., 2017; Sun et al., 2017b) to correct the Ks distributions related to the polyploidizations and speciation. After three rounds of correction, we aligned the Ks peaks of the ECH, CCT, and Cucurbita-specific tetraploidization (CST) events in each genome to the 1.02, 0.824, and 0.22, respectively (Figure 2B and Supplemental Table S4). Based on the occurrence time of the ECH event at ∼115–130 MYA (Paterson et al., 2004; Jaillon et al., 2007; Jiao et al., 2012; Vekemans et al., 2012), we infer that the CCT event occurred at ∼93–105 MYA and that the divergence of Begoniaceae from Cucurbitaceae (with a Ks peak of ∼0.798) occurred shortly after the CCT event at ∼90–101 MYA. In addition, we inferred that the Begoniaceae common and Cucurbita-specific polyploidizations (Begoniaceae common tetraploidization [BCT] and CST) occurred at ∼38–43 and ∼25–28 MYA, and the divergence of C. moschata and cushaw pumpkin (Cucurbita argyrosperma) occurred at ∼24–27 MYA, suggesting that the CST occurred closer to the time of C. moschata and C. argyrosperma divergence. Divergence of C. melo from C. moschata, watermelon (Citrullus lanatus), and C. sativus occurred at ∼27–31, ∼22–25, and ∼12–14 MYA, respectively (Figures 1A and 2B).
Multigenome alignment framework and online resource for Cucurbitales
Clarifying the origin and collinearity of diverse homologous genes is critical to investigating the evolution of essential genes (Soltis et al., 2015). Based on intergenomic and intragenomic comparisons, we identified the orthologous genomic regions produced by species divergence among the 14 genomes from Cucurbitales and V. vinifera (Supplemental Tables S5–S21). We found 12,307 orthologous gene pairs produced by the divergence of Begoniaceae and Cucurbitaceae when comparing the B. loranthoides and C. moschata genomes and 20,066 orthologous gene pairs produced by the divergence of two Cucurbita genomes (C. moschata and C. argyrosperma) (Supplemental Table S21). These results indicated that there is better collinearity between the Cucurbitaceae genomes. Likewise, we identified the paralogous genes produced by ECH, CCT, and CST events within the 15 genomes (Supplemental Table S20). Despite Cucurbitales having experienced at least one more WGD event than V. vinifera, many Cucurbitales plants have fewer ECH-related genes; for example, 1,603 ECH-related paralogous genes were identified in the wax gourd (Benincasa hispida) genome, which is barely half that of V. vinifera. We found obvious differences in the number of CCT-related paralogous genes in Cucurbitaceae, which ranged from 1,910 to 10,435, and small differences in that number in Begoniaceae, ranging from 2,968 to 6,208. We identified 4,151–10,435 paralogous genes in Cucurbita, which is twice that in Begoniaceae, probably due to the late occurrence of the specific polyploidization event in Cucurbita resulting in less genome fractionation.
To explore the homologous genes among species at the Cucurbitales scale, we constructed a hierarchical and event-related multigenome alignment for Cucurbitales by identifying paralogous and orthologous genes, with the V. vinifera genome as the reference (Figure 3 and Supplemental Tables S22 and S23). We filled in the first column with all the gene IDs of V. vinifera and then added the gene IDs of the other species column by column based on genomic homology, creating a multigenome collinear gene table of 135 = (1 + 8 × 4 + 6 × 2) × 3 columns. Without taking gene loss into account, each of the three V. vinifera paralogous genes produced by the ECH has four orthologous genes in Begoniaceae and Cucurbita and two orthologous genes in Benincasa and Cucumis. This multigenome alignment associated the paralogs within each genome and out-paralogs between genomes with each polyploidization event and associated the orthologs between genomes with their ancestral populations. Furthermore, to facilitate the utilization of this comparative genome resource, we built an online platform to store the collinear gene table and provided a user-friendly search function (http://www.cgrpoee.top/Cucurbitales/index.html).
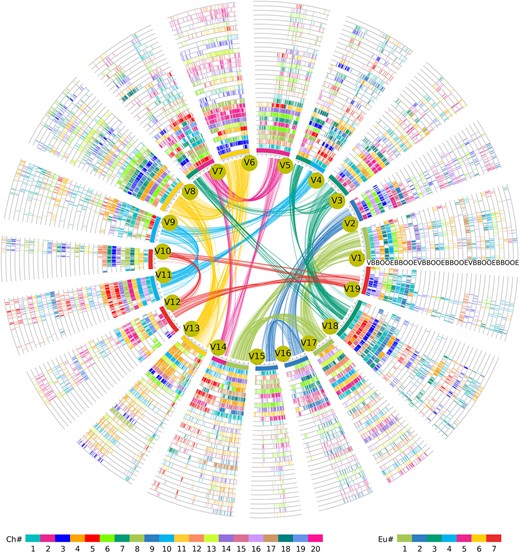
Genomic alignment of representative species in Cucurbitales. The chromosomes of V. vinifera constitute the innermost circle, and their collinear paralogous genes are linked by curved lines and correspondingly colored according to the previously inferred seven core-eudicot-common ancestor chromosomes. Cucumis melo is denoted by E, C. moschata is denoted by O, B. loranthoides is denoted by B, and V. vinifera is denoted by V. Each chromosomal region had 2, 4, and 4 orthologous regions in the C. melo, C. moschata, and B. loranthoides genomes, respectively; these regions are displayed as 33 circles, where each circle represents one subgenome. Short lines between two circles show collinear genes, which correspond to the colors of the encoded Ch#. The color scheme is shown at the bottom.
Genomic fractionation and likely auto- and allopolyploidization events in Cucurbitales
To investigate the fractionation patterns of BCT-produced subgenomes in Begoniaceae and CST-produced subgenomes in Cucurbita, we estimated that the gene retention and loss levels of the subgenomes in four Begoniaceae genomes (B. loranthoides, Begonia darthvaderiana, B. masoniana, and Begonia peltatifolia) with V. vinifera as reference genome and the C. moschata subgenomes with C. melo as reference genome (Supplemental Tables S24–S27). All these polyploidy-produced subgenome alignments of Begoniaceae and Cucurbita are stored in our bioinformatics research platform (http://www.cgrpoee.top/Cucurbitales/Polyploidy_subgenome.html). Compared with the reference genomes, we found that a large number of genes from Cucurbitales genomes are absent from the collinear locations. Genes from each chromosome of the reference showed a varying retention rate ∼10%–45% in five Cucurbitales genomes, and the subgenomes of B. loranthoides produced by BCT showed a highly similar retention pattern (Figure 4, A and B). Based on these results, we calculated the gene loss differences between subgenomes of considered species relative to each chromosome from reference genome and then took the average of these values (Supplemental Tables S24 and S25). We found that the BCT-produced subgenomes in four species from Begoniaceae have more balanced gene loss than the CST-produced subgenomes in C. moschata from Cucurbitaceae. For example, we obtained the values of 0.024 for the B. masoniana BCT-produced subgenomes and 0.038 for the C. moschata CST-produced subgenomes (Figure 4, A and B and Supplemental Tables S24 and S25). Further, we performed a statistical analysis of the lengths of chromosome segments with continuous loss of genes in B. loranthoides (Figure 4C andSupplemental Figure S13). Comparing with the V. vinifera genome, the deletions of 15 or fewer consecutive genes accounted for 48.87% of all lost genes in B. loranthoides. However, using the C. melo as reference, the percentage of genes lost reached 55.30%. This result shows that the length of chromosomal regions of genes lost continuously accumulates with the increase of time, which may have changed the fractionation pattern of subgenomes produced by WGDs during the process of species evolution.
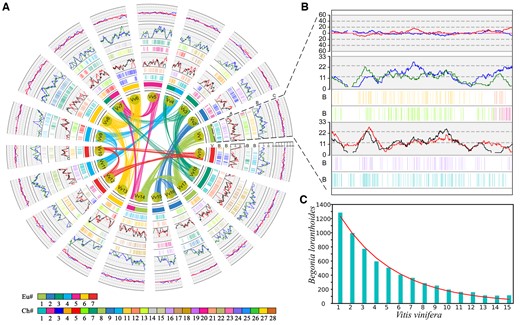
A specific polyploidization event in Begoniaceae generates intersubgenome retention level balance. A, Gene retention of B. loranthoides subgenomes along orthologous regions corresponding to the V. vinifera chromosome. Retention rates of genes in sliding windows of B. loranthoides homologous region group 1 (red line) and homologous region group 2 (black line), using V. vinifera as the reference. B, Retention rates of genes in sliding windows of B. loranthoides homologous region group 3 (blue line) and homologous region group 4 (green line) and C, difference in gene retention between sliding windows of B. loranthoides homologous groups 1 and 2 (blue line), where the red line is the difference between homologous groups 3 and 4. B, The retention pattern of B. loranthoides, using V. vinifera chromosome 1 as a reference, is consistent with that in the subfigure A. C, The gene loss rates of B. loranthoides with the V. vinifera genome as a reference. The x-axis indicates the number of consecutive lost genes, the y-axis indicates the number of lost fragments, and the red curve is the model fit of gene loss.
Using a sliding window along chromosomes, we further compared gene retention levels of BCT- and CST-produced paralogous regions in four Begoniaceae genomes and C. moschata. If the windows with retention rate difference ≤0.05 are not considered, in B. loranthoides, we found that the percentages of dominant windows to preserve more genes of the two BCT-related subgenomes were 33.93% and 28.90%, with little difference in the retention levels (Figure 4, A and B and Supplemental Table S26). However, in C. moschata, the difference in the retention levels between the CST-related subgenomes was obvious, with a nearly two-fold difference of 53.54% and 27.16% (Supplemental Figure S14 and Supplemental Table S27). These results suggest that the gene retention of Begoniaceae BCT-produced subgenomes was balanced, while the CST-produced subgenomes in C. moschata was obviously imbalanced.
To quantify the balance of subgenome fractionation, we used the previously developed mathematical measurement algorithm P-index (Wang et al., 2019a). The value of P-indices must be falling in the range of [0–1]. Small values of P-indices indicate the similar fractionation patterns (retained gene content, density, and orders) shared by considered subgenomes comparing with the selected reference genome. Here, by using the V. vinifera genome as a reference, we estimated that the P-index values of BCT subgenomes in four Begoniaceae genomes are 0.230, 0.274, 0.207, and 0.276, respectively. The CST subgenomes in C. moschata have the P-indices of 0.348 with C. melo as a reference. According to the previous study, the P-index ∼0.3 could be used as a threshold to classify auto- and allopolyploidies. Because the known and previously inferred alloploidies always have larger P-index > 0.3, including that the Brassica napus, Zea mays, Gossypium hirsutum, and Brassica oleracea (Schnable et al., 2011; Chalhoub et al., 2014; Li et al., 2014; Wang et al., 2015a; Renny-Byfield et al., 2017) Those inferred autopolyploidy of Glycine max, Populus trichocarpa, and Actinidia chinensis (Murat et al., 2017; Wang et al., 2017, 2018b) have P-indices < 0.3. Together with prior knowledge and our analysis results, it suggests that the BCT to be a likely autopolyploidy event, while the CST to be a likely allopolyploidy event.
Ancestral karyotypes of Cucurbitales and chromosome evolutionary trajectory
The reconstruction of ancestral chromosomes can help reveal the evolutionary process of species that have experienced recursive polyploidizations and the possible effects of chromosome rearrangement. It provides an important reference resource for inferring the evolution of modern genomes. By comparing the 14 Cucurbitales genomes with the V. vinifera genome, we reconstructed the ACK-I before CCT event, which contains 17 proto-chromosomes (H1–H17) when the minor fragment of chromosome inversions and deletions are ignored (Figure 5, A and B and Supplemental Figures S15 and S17). To reconstruct the ancestral karyotype of Cucurbitales, we defined the 7 pre-ECH chromosomes of the AEK as G1–G7 and the 21 post-ECH chromosomes as A1–A7, B1–B7, and C1–C7, which correspond to the 19 chromosomes of V. vinifera (Figure 5, A and B). Then, we inferred that the 21 chromosomes of the tripled AEK went through two EEJ fusions, two nested chromosome (NCF) fusions, and three nonreciprocal translocations to form ACK-I. For example, we found that the orthologous chromosomes Bhi4 of B. hispida and Blo1 of B. loranthoides shared the orthologous regions Vv4 (C2) and Vv18 (B4) in V. vinifera, which were preserved the full ancestral structure of Cucurbitales; we can define this region (C2+B4) as H15 (Figure 5A). The orthologous chromosomes Bhi10 and Blo14 shared the orthologous region Vv6 (A6), which were preserved the full ancestral chromosome A6 structure of AEK; we can define this region as H3 (Figure 5A). The orthologous regions of chromosome H3 in Bhi2 and Bhi8 can be explained by chromosome translocation (Figure 5A). Similarly, we inferred the other 15 ancestral chromosomes (H1–H2, H4–H14, and H16–H17) in the ACK-I (Node A) (Figure 5B). After the CCT, the chromosomes of ACK-I doubled, and then the chromosomes with 2 EEJ fusions formed 32 chromosomes in the common ancestor of Cucurbitaceae and Begoniaceae (Node B).
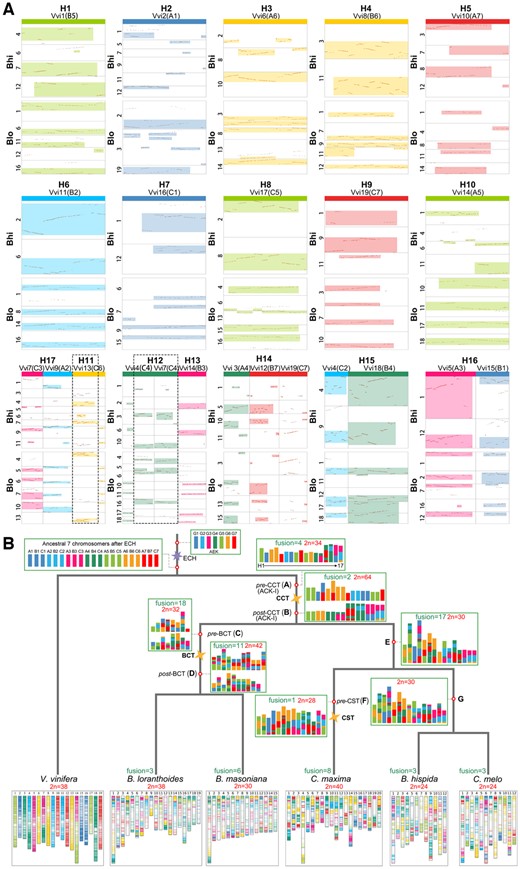
Inference of the ancestral karyotypes and chromosome evolutionary trajectory of major Cucurbitales species. A, Inference of the chromosomal karyotype of the Cucurbitales ancestor with the V. vinifera genome as a reference. Bhi, B. hispida and Blo, B. loranthoides. Highlighted boxes represent the identified orthologous regions between selected chromosomes among compared genomes. If the inferred proto-chromosomes in ACK-I involved rearrangement event before the CCT event, then the regions circled by the dotted lines. The identified chromosomal fusions of the 21 chromosomes of the AEK contain two EEJ fusions, two nested chromosome (NCF) fusions, and three nonreciprocal translocations to form ACK-I of 17 proto-chromosomes (H1–H17). B, Phylogeny and Cucurbitales ancestor karyotype reconstruction. Each polygon represents a polyploidization event. The chromosomal regions in each genome are colored based on the seven ancestral eudicot chromosomes.
Surprisingly, although Begoniaceae experienced additional WGD after the CCT event, we found that the chromosome numbers of four species in this family ranged from 15 to 19, which are far less than the number of chromosomes in ancestor of Node B. This indicates that the Begoniaceae genomes have affected by large-scale chromosomal rearrangements after the divergence of Cucurbitaceae and Begoniaceae. By comparing the Begoniaceae genomes with the V. vinifera genome, we deduced the ancestral Begoniaceae karyotype (ABK) pre-BCT (Node C) and post-BCT (Node D) (Figure 5B andSupplemental Figures S18–S21). After the CCT event, through 12 EEJ fusions and 4 NCF fusions, the 32 chromosomes of the ACK-I were reduced to the 16 chromosomes of ABK (Node C). After the BCT event, the ancestral Begoniaceae genome doubled, and through nine EEJ fusions and two NCF fusions, the ABK reduced to 21 chromosomes (Node D). Among four Begoniaceae genomes, we found that the B. loranthoides has the fewest specific chromosomal rearrangements, involving three EEJ chromosome fusions and five nonreciprocal translocations (Supplemental Figures S18–S21).
Further, to investigate previous studies reported that the ACK-II has 15, or 12 chromosomes (Wu et al., 2017; Zhao et al., 2021), we compared the Cucurbitaceae genomes with the V. vinifera genome to reanalyze the most recent common ancestor of Cucurbitaceae. We confirmed that the ACK-II (Node E) has 15 chromosomes, which were reduced from the 32 chromosomes in ancestor of Node B through 12 EEJ fusions, 5 NCF fusions, and 2 nonreciprocal translocations (Figure 5B andSupplemental Figures S22–S31). Then, we checked that the chromosome fissions in identified previous study (Wu et al., 2017), and found that the many regions involving in fission events were independent ancestral chromosomes of Cucurbitaceae rather than the regions derived from species-specific fissions (Supplemental Figure S32). For example, the chromosome Cme11 of C. melo evolved from an ancestral chromosome of ACK-II in previous study. However, we found that the orthologous regions of Cme11 are separated in Cmo2, Cmo20, Cmo8, and Cmo17 of C. moschata, and the orthologous regions of Cme11 are also separated in different chromosomes in bottle gourd (Lagenaria siceraria) and C. lanatus. Further, we detected that the location of the breakpoint of Cme11 (∼27.5 Mb) is similar when comparing C. melo with the genomes of C. moschata, L. siceraria, and C. lanatus, indicating that the Cme11 was fused by at least two ancient chromosomes of ACK-II. We also inferred that the most recent common ancestor of Benincasa and Cucumis (Node G) contains 15 chromosomes involving 7 nonreciprocal translocations from ACK-II. We further confirmed that the ancestral Cucumis karyotype (ACK-IV) contains 12 chromosomes, clearly confirming that the melon maintained the ancestral chromosome structure of ACK-IV (Figure 5, B and Supplemental Figures S25–S27, S33, and S34).
Lastly, we found that the ABK pre-BCT and ACK-II had similar numbers of chromosomes (16 and 15), respectively. A large number of chromosome fusions occurred in the Begoniaceae after the BCT event, which made the number of modern chromosomes close to that the ABK pre-BCT, while the more chromosome translocations occurred in Cucurbitaceae plants. We found that the genomes of Begoniaceae retain the chromosome structure of the AEK more completely than that of the Cucurbitaceae genomes (Figure 5, B and Supplemental Figures S18–S31). In addition, Cucurbita experienced additional WGD event after the CCT, which was resulted in the most chromosomal rearrangements among Cucurbitaceae; these rearrangements involved one chromosome fusion and four nonreciprocal translocations before the CST events and eight chromosome fusions, four nonreciprocal translocations, and one reciprocal translocation after the CST event (Figure 5, B and Supplemental Figures S28–S31).
Expansion and diversity evolution of the gene families involved in the cucurbitacin synthesis pathway
Cucurbitacins constitute a group of diverse triterpenoid substances that are well known for their bitterness, and they have been mainly reported in Cucurbitaceae plants (Chen et al., 2005). According to the chemical formula, the cucurbitacins can be divided into 14 types (A–N), of which the most famous is cucurbitacin B, which has been proved to have anticancer effects (Andeweg and Bruyn, 1959; Kaushik et al., 2015). The studies reported that the eight gene families of cytochrome P450 (P450), squalene epoxidase (SQE), squalene synthase (SQS), oxidosqualene cyclase (OSC), isopentenyl diphosphate isomerase, farnesyl diphosphate synthase (FPS), geranyl pyrophosphate synthase (GPS), and acetyltransferase (ACT) proteins play a crucial role in the regulation of cucurbitacin synthesis (CS), especially P450, ACT, and OSC have a decisive role in determining the final class of cucurbitacin synthesized (Osbourn, 2010; Hamberger and Bak, 2013; Thimmappa et al., 2014; Figure 6A).
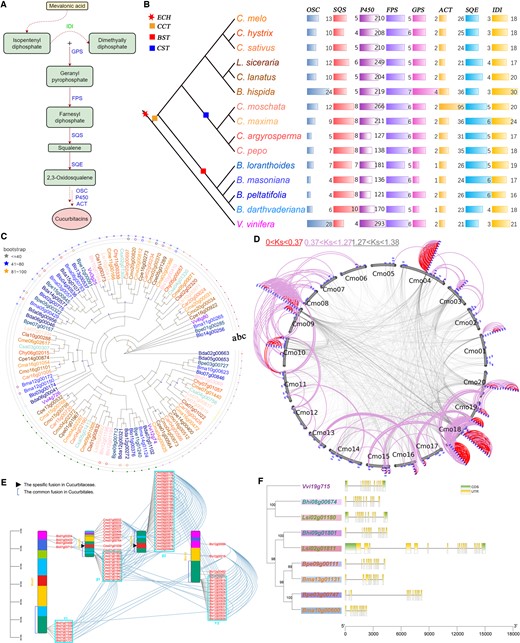
Evolution and diversification of gene families involved in the CS pathway in Cucurbitales. A, Cucurbitacin synthesis pathway. B, Identification of the gene families involved in the CS pathway in the studied genomes. C, Phylogenetic tree of the genes in FPS family of the Cucurbitales and V. vinifera genomes. Genes from different species are marked with different colors. The dots on the three layers represent the gene tandem duplication, paralogous, and orthologous relationships (marked with a, b, and c, respectively), and the same color represents the same group of relationships within and between genomes. D, P450 gene amplification model related to gene duplication events in C. moschata. P450 genes are displayed in blue patches. Curved lines (gray) link the collinear gene pairs generated at the period from the divergence between V. vinifera and Cucurbitales to the CCT event. Curved lines (red and plum) link gene pairs generated at the period from now to the CST and from the CST to the CCT event, respectively. E, The chromosomal distributions of P450 genes in the selected genomes. The lines between gene pairs on the same chromosome represent homologous genes generated at the period from the divergence between V. vinifera and CCT event. The lines between gene pairs on the different chromosome represent homologous genes generated by the divergence between the species. The β1, β2, γ1, and γ2 represent the gene clusters. F, The CDS–UTR structures of a set of orthologous FPS genes in selected genomes. The genes with different colors present the different species, and the shadow in one species shows that they come from the different subgenomes generated by the polyploidization event.
To explore the expansion patterns of these families, we identified a total of 4,074 family members in the genomes of V. vinifera and 14 Cucurbitales plants (Figure 6B andSupplemental Table S28). We found that the number of family members varied between two Cucurbitales families; for example, the number of P450 family members (mean: 202.3) in Cucurbitaceae was greater than that in Begoniaceae (mean: 152.0). Within the genomes, the number of family genes varied considerably; for example, the P450 family of L. siceraria has 249 members, substantially more than the GPS family has only 2 members. When comparing Cucurbitales plants with V. vinifera, we found that the genes in families SQS, ACT, and SQE show expansion pattern, which may be contributed by the CCT events. However, the genes of families OSC and P450 show reduced pattern, and the other three families have a similar number of genes. Then, combined with the identified homology information and the phylogenetic relationship of genes in families, we calculated the WGD expansion rate (WGD-ER), tandem duplication expansion rate (TD-ER), and the contraction rate (CR) caused by gene loss for each family (Figure 6C;Supplemental Figures S35–S37 and Supplemental Table S29) (see “Materials and methods” for details). We detected that the families with expansion patterns in Cucurbitales genomes often show that the duplication expansion rate is higher than the CR. For example, the SQS of B. darthvaderiana has a duplication expansion rate 100% (WGD-ER: 50% and TD-ER: 50%, respectively), which is higher than that the CR with 75%. In contrast, the families with contraction patterns often show that the duplication expansion rate is lower than the CR. For example, the OSC of B. darthvaderiana has a duplication expansion rate of 50% (TD-ER), which is lower than that the CR with 200%. Surprisingly, we also found that the OSC has a very active TD-ER to be 600% in V. vinifera. All these results suggest that the WGD and tandem duplication events provided the genetic basis for the expansion of the families in Cucurbitales, but the loss of duplicated genes limited the family expansion, and even appears contraction. Additionally, the families in Cucurbitales show contraction patterns most likely explained by the high frequency of gene loss in Cucurbitales and active tandem gene duplication in V. vinifera.
Further, we identified the gene clusters in family P450, a largest family in CS pathway, and found that the most clusters gradually “growing” during the diversification of Cucurbitales plants (Figure 6D and Supplemental Figures S38–S40). In C. moschata, we detected four largest clusters of P450 located on the Cmo04, Cmo09, and Cmo18 chromosomes, which are containing 14, 20, 11, and 15 genes, respectively (Figure 6D). Within the four representative genomes of L. siceraria, C. moschata, B. loranthoides, and V. vinifera, the sparse family genes and few clusters in P450 were distributed near the location of chromosomal rearrangements, and the clustered genes seem to prefer to nest in the middle regions of their ancestral chromosomes (Supplemental Figures S41–S44). Through intergenomic comparisons of these genomes, we found that the clusters of one species in another often show a decrease in the number of genes associated with chromosomal rearrangements (Figure 6E and Supplemental Figure S45). For example, the two clusters α1 and α2 on paralogous chromosomes 4 and 18 of V. vinifera have 14 and 34, respectively. In C. moschata, the two orthologous clusters β1 and β2 of α1 and α2 on chromosomes 1 and 9, which are related to an ancestral rearrangement at the base of Cucurbitales; while the two clusters β1 and β2 only have 10 and 27 genes, respectively (Figure 6E). These results suggested that the chromosomal rearrangements have an inhibitory effect on gene family expansion.
In addition to the change of gene copy numbers, the gene structure variations (GSVs) in these families present another prominent evolutionary feature. To clearly compare the GSVs in Cucurbitales, we selected five relatively small families (FPS, GPS, OSC, SQS, and SQE) and visualized the coding sequence (CDS) and untranslated region (UTR) of all genes on the phylogenetic trees (Supplemental Figures S46–S50). Among the five families, the gene structure in FPS is relatively conservative, because the genes in FPS can be clustered into two categories according to the number of CDS and phylogenetic relationship, while the genes in other families are clustered into three to five categories. For CDS–UTR structures, we found that the diversity of genes in Cucurbitaceae (each gene contains 1–6, or 9–33 CDS) was higher than Begoniaceae (each gene contains 1–3, or 10–12 CDS), and the Cucurbitaceae genes often contained 1–2 UTR (Supplemental Figures S46–S50). Next, we detected that the structures of genes in CCT-produced subgenomes of Begoniaceae with more conservative than their orthologous gene structures in Cucurbitaceae. For example, the paralogous gene pairs Bpe09g00111 and Bpe03g00747 in B. peltatifolia contain 12 and 12 CDS, respectively; but their orthologous genes Lsi02g01811 and Lsi02g01180 in L. siceraria contain 18 and 12 CDS, respectively, and have 0–2 UTR distributed in each gene (Figure 6F). These results implied that the chromosomal rearrangements might result in the biased genomic fractionation which likely promoted the diversity of gene structures.
Discussion
Overlooked CCT in Begoniaceae
Polyploidy is important in genome evolution and functional innovation and is common in flowering plants (Jiao et al., 2012; Soltis et al., 2015; Van de Peer et al., 2017; Landis et al., 2018); however, increasing genome complexity makes polyploidization events difficult to identify (Paterson et al., 2004; Soltis et al., 2015). For a recently sequenced genome, comparison to well-characterized genomes of related plants helps deconvolute the genome structure and evolutionary history (Schnable et al., 2011; Murat et al., 2014; Wang et al., 2016b). Here, we performed a comparative whole-genome analysis of Cucurbitaceae and the recently sequenced genomes of Begoniaceae, and confirmed that Begoniaceae underwent two consecutive polyploidizations after the ECH event, rather than only one polyploidization (Li et al., 2022). Our previous study showed that all Cucurbitaceae species share a tetraploidization event (Wang et al., 2018a). Based on homology comparison analysis, we found that the common tetraploidization of Cucurbitaceae was the same WGD event that was overlooked in Begoniaceae (Li et al., 2022), which we re-defined as the CCT.
In this study, we detected that the ECH and CCT events occurred at ∼115–130 and ∼93–105 MYA, respectively. Additional paralogs from more ancient polyploidization events are sometimes found within homologous regions formed in some well-characterized genome duplications, but they are more often obscured by subsequent reduplications and rediploidizations (Jiao et al., 2014). Thus, it is likely that the paralogous homologous regions generated by the CCT mask the paralogous homologous regions generated by the ECH, and the two polyploidy events are close in time, which eventually makes the two polyploidization events indistinguishable. In addition, we infer that Cucurbitaceae split from Begoniaceae at ∼90–101 MYA. The corrected Ks distributions of the Cucurbitaceae–Begoniaceae orthologs and the Cucurbitales CCT paralogs overlap with one another. This implies that CCT events may have directly contributed to the split of Cucurbitaceae from Begoniaceae. Similarly, it is possible that the CST event led to the split of two branches of C. moschata and C. argyrosperma.
Hypothesis of the nature of polyploidization events in Cucurbitales
Polyploidy is indispensable in the evolutionary process of plants, with nearly 90% of species possibly being allopolyploid and only a small fraction being autopolyploid (Chen, 2010; Wang et al., 2019a). Autopolyploid was formed by duplication of genomes, whereas allopolyploid was generated from the crosses between different species with independent evolutionary histories, both of which are followed by chromosome doubling or fusion of unreduced gametes. It suggests that the WGD events can be divided into auto- and allopolyploidies, according to the unbiased and biased fractionation of subgenomes produced by the genome doubling (Garsmeur et al., 2014). Here, our findings on gene retention and loss among BCT-generated subgenomes suggest that there is little dominance among individual subgenomes in Begoniaceae, which raised the possibility that the BCT event was likely autotetraploidy in nature, as demonstrated in soybean and Salicaceae (Liu et al., 2017; Wang et al., 2017). In contrast, the CST-produced subgenomes of C. moschata showed a biased fractionation pattern, once again demonstrates that the genus Cucurbita has a likely common allotetraploid ancestor (Sun et al., 2017a). All of these Cucurbitales plants shared a likely allopolyploidization event has demonstrated by previous study (Wang et al., 2018a).
We observed that the Begoniaceae has a lower evolutionary rate than the Cucurbitaceae. The most likely explanation is that the Begoniaceae affected by an additional autotetraploidization BCT after the CCT event. As a sharp contrast, the Cucurbita evolved faster than Begoniaceae and almost all other Cucurbitacece species (Figure 2A), probably because they experienced another round of allotetraploidization CST after the CCT event. Generally, allopolyploidization would increase the evolutionary rate of genomes due to homologous recombination and the presence of additional gene copies (Wang et al., 2018b). However, autotetraploidization results in multiple copies of chromosomes, which may prolong cell cycle time and thus generation time. Allopolyploids, doubled chromosomes, exhibiting diploid inheritance, but absent an evidence for prolonging the time of cell cycle and generation (Doyle and Egan, 2010). Plants with slower rates of molecular evolution tend to be perennial, have long generation times, and produce taller plants (Gaut et al., 2011; Lanfear et al., 2013), which once had the characteristics of autopolyploidy history, such as Salicaceae and Rosaceae (Liu et al., 2017; Li et al., 2019b; Wang et al., 2019a). Begoniaceae species with slower rates of evolution tend to have these characteristics.
Although we used the method of genome fractionation bias commonly used in angiosperms to infer the nature of polyploidization events in Cucurbitales, and found some evolutionary characteristics of the genome consistent with the nature of the corresponding paleopolyploid, it is still insufficient as evidence to distinguish auto- and allopolyploidy. First, subgenomes produced by similar polyploidization events may result in different fractionation patterns in different linages. For example, the allotetraploid Ethiopian cereal teff without clear signs of fractionation (VanBuren et al., 2020), but in the autotetrapolyploid Teleost fish, it is surprising that the biased fractionation exists between subgenomes (Parey et al., 2022). Second, the neopolyploids differences in gene content between extant and progenitor species complicate simple interpretation of gene content patterns. One possible reason is that the biased subgenome of extant species mainly reflects inherit from the progenitors, and this difference can be detected before the polyploidization events (Liu and Wang, 2022). Finally, it should be noted that paleopolyploidization events often occurred a few, or even tens of MYA, which brings great challenges to assign collinear blocks to the subgenomes of polyploidy association (Emery et al., 2018). Although the current work utilizes the recently constructed pipeline of complex genome structure analysis (Wang et al., 2018a, 2019a), more effective tools are still need to be developed to clearly differentiate auto- and allopolyploidy.
Paleochromosomes and the chromosome evolutionary trajectory of Cucurbitales
Ancestral chromosome reconstruction is important for confirming the phylogenetic position of species and revealing the impact of different polyploidy events on genomic diversification (Murat et al., 2017). The karyotypes of Cucurbitales have complex chromosomal rearrangements (inversions, translocations, fusions, and fissions) resulting from recursive polyploidization events that are difficult to deduce clearly (Ren et al., 2019). Here, we reconstructed the 17 proto-chromosomes ancestral karyotype of Cucurbitales plants and investigated the karyotype evolutionary trajectory of representative Cucurbitales plants. The reconstruction of the ACK-I provides a reference for studying the origin and evolution of Cucurbitales plants, enabling us to better understand the evolutionary history of Cucurbitales plants at the chromosome level.
In addition, based on the AEK (Jaillon et al., 2007), we clarified the 15 proto-chromosomes of the ACK-II, and rejected the previous hypotheses of the ACK-II with 12 proto-chromosomes (Wu et al., 2017). We also confirmed that the ancestral Cucumis karyotype has 12 chromosomes, which is consistent with a recent report (Zhao et al., 2021). Using the same approach, we also deduced the ABK before and after the BCT event, that filling a gap in the chromosome karyotype evolution of Begoniaceae plants. Furthermore, we found that Cucurbitaceae exhibited more chromosomal rearrangements than Begoniaceae, resulting in greater species diversity, and Begoniaceae genomes contained more complete ancestral chromosomal structures, which suggest they may become model plants for future genomic studies in the Cucurbitales. Notably, the main mode of chromosome fusions in Cucurbitales is the EEJ pattern, which is the same as that in most eudicots, such as V. vinifera and coffee (Jaillon et al., 2007; Li et al., 2019a).
Genetic evolution and diversity of important gene families
Cucurbitacin has excellent antitumor and antipest qualities, and its synthetic pathway involves many important proteases. Based on its functional importance, cucurbitacin has been studied in cucumber and muskmelon (Qing et al., 2022; Zhang et al., 2022). Cucurbitacins have been mainly reported in the Cucurbitaceae plants and can cause bitterness in many plants (Chen et al., 2005). We explored the expansion patterns of gene families involved in the Cucurbitacin synthesis pathway, and found the three expansion patterns of families including the increase, decrease, and basically stable maintenance of gene copy number. Our findings revealed that the WGD and tandem duplication events provided the genetic basis for the expansion of the families in Cucurbitales, but the gene loss and chromosomal rearrangements may be inhibiting the family expansion.
Gene structural diversity may promote protein functional diversity. The CDS contains exons that encode protein sequences, and the UTR is a noncoding region at either end of the mRNA that contains many different regulatory elements involved in variable splicing (Mayr, 2019; Navarro et al., 2021). For the gene structures of the families in Cucurbitales involved in the CS pathway, we found that the Cucurbitaceae shows more diversity than Begoniaceae. Although the chromosomal rearrangements limit the family expansion, we suggested that it is like a booster for the structural diversity of family genes. The reason for this speculation is that the biased subgenome fractionation of species may require more structural variations of genes to compensate for their adaptability to the environment. In this study, we demonstrated that the biased fractionation exists in Cucurbitaceae and the balanced fractionation in Begoniaceae. The difference of subgenome fractionation may be positively related to the degree of chromosomal rearrangement, as we here detected that the Cucurbita genomes have more rearrangements than that the Begoniaceae genomes. Based on this analysis, although preliminary evidence supports our hypothesis, more in-depth research is needed in the future on how chromosome rearrangement affects the genetic diversity and adaptability of gene families.
Materials and methods
Availability of data and materials
Genome sequences and annotation files were downloaded from their respective online public databases. Detailed data sources are provided in Supplemental Table S1.
Inference of gene collinearity
For gene collinearity analyses, we used BLASTP (Altschul, 2012) software to search the potential homologous gene pairs for each protein within and between genomes and set strict parameters (e-value < 1e−5 and score > 100). Then, the top 10 BLAST matches were selected as input for ColinearScan (Wang et al., 2006) to infer the collinear blocks. We set the maximum gap between the anchored genes to 50, and removed the gene copies more than 30 in a large gene family. This method has been commonly used in the comparative genome research of many angiosperms (Wang et al., 2018a, 2019b, 2020b).
Calculation and kernel function analysis of the Ks
The Ks of collinear gene pairs was calculated by the Nei–Gojobori approach (Nei and Gojobori, 1986) implementing the Bioperl statistical module (https://bioperl.org/). For the Ks density distribution curve of collinear gene pairs, we used the kernel smoothing density function ksdensity (the parameter set to 0.5) in MATLAB (Cichosz et al., 2020) to evaluate the probability density of each Ks list. Then, we used the Gaussian approximation function Gaussian in the fitting toolbox cftool to perform a Gaussian multipeak fitting of the curve (https://www.mathworks.com/help/curvefit/index.html), and analyzed the distribution of Ks for homologous genes within and between genomes. The parameter R-squared was used to evaluate the goodness of fit and set to at least 95%, the minimum number of positive-terminus distributions was used to represent the complex Ks distribution, and principle 1 was used to represent the corresponding evolutionary event.
Identification of orthology and paralogy
The gene collinearity dotplots are helpful for identifying the orthologous and paralogous chromosomal regions within and between genomes. We plotted the collinear gene pairs according to their genomic locations in dotplots, and used different color-coded dots to distinguished whether the anchor gene pairs are the best BLAST hit among the genomes. For collinear regions between genomes, if the median Ks of gene pairs is approximately equal to the Ks peak value of speciation, then this region is identified as an orthologous region. For a collinear region within genome, if the median Ks of gene pairs is approximately equal to the Ks peak value of polyploidization, then this region is identified as a paralogous region.
Correction of the evolutionary rates
After a correction of Ks of ECH-produced genes, the CCT-produced homologs in Cucurbitales still had very divergent Ks distribution. Therefore, similar to the first step correction, a further round of corrections was performed by aligning the Ks distributions peaks of CCT-produced homologs of Cucurbitales to have the same distribution means. After two rounds of correction, we performed a third round of correction for Cucurbita based on CST event. This correction algorithm has been compiled into a calculation script with a detailed operation process noted and deposited in Github (https://github.com/wangjiaqi206/corrected-evolutionary-dating).
Construction of the event-related collinear gene table
The table was constructed using the V. vinifera genome as a reference, and all V. vinifera genes were placed in the first column. Each V. vinifera gene has two additional collinear genes due to the ECH event, and we specified two additional columns in the table to contain this information. For a gene in V. vinifera, if a corresponding orthologous gene appears in the expected position of Cucurbitales plants, the gene ID is filled into the cell of the corresponding column. When it is missing, usually owing to the absence or translocation of a gene in the genome, we place a dot in the cell of the corresponding column. Thus, for each species in Cucurbitales, a 135-column table was constructed with the gene IDs of these species filled sequentially according to homology (Supplemental Table S23). We also constructed a collinear gene table containing 33 columns of the three major Cucurbitales species, with V. vinifera as the reference (Supplemental Table S22).
Gene losses
The fitting functions curve-fit and NumPy were run using Python scripts.
Calculation of the P-index
More details can be found in previous article (Wang et al., 2019a).
Inference of ancestral karyotype and chromosome evolution
In the case of inference of the evolutionary trajectories of chromosomes, we used a “Telomere-centric genome repatterning model” proposed in previous study (Wang et al., 2015b). The main steps for tracking the chromosome rearrangements including: (1) generating syntenic dotplots and identifying orthologous genomic regions between the genomes of Cucurbitales and V. vinifera; (2) inferring the involved regions of the genomic rearrangements in compared genomes and revealing the connection and order of these orthologous regions; (3) reconstructing the ancestral state of these involved regions for the compared species based on orthologous regions in living species; and (4) comparing the chromosomes in each considered species with the predicted pattern of the most common ancestor of extant plants and identifying the genomic rearrangements during the evolution of Cucurbitales plants.
The dynamic evolutionary trajectory of chromosomes for the Cucurbitales plants was illustrated using the Adobe Animate (Adobe) software (Tepla and Klimova, 2015). The colors in the produced video match the colors assigned for the seven chromosomes in the AEK. The dynamic evolutionary trajectory of chromosomes in Cucurbitales has been deposited in the online platform (http://www.cgrpoee.top/Cucurbitales/index.html).
Identification and evolutionary analysis of the gene families
To identify the protein sequences of gene families involved in the CS pathway, the domains for eight families were downloaded from the PFAM protein dataset (http://pfam.xfam.org/) (Mistry et al., 2021; Supplemental Table S28). The hidden Markov model of HMMscan software (Chai et al., 2019) was employed to search the proteins of family genes from the genomes of Cucurbitales plants and V. vinifera, and setting a strict expectation (E-value < 1e−10).
For the phylogenetic analysis of gene families, we performed a multiple sequence alignment on the proteins of each family using the MAFFT program (Katoh et al., 2002; Katoh and Standley, 2013), and constructed the gene trees using the IQ-Tree software (Nguyen et al., 2015). Through the ModelFinder module in IQ-Tree, we obtained the best nucleotide substitution model for each family (Supplemental Table S29). Finally, the ML algorithm was employed to construct gene trees, and the bootstrap value was set to 1,000 to test the stability of the family gene trees. The gene tree of each family was displayed using an online tool Evolview (https://www.evolgenius.info/evolview/#/treeview) (Subramanian et al., 2019). Moreover, for the expansion rates of the whole-genome and tandem duplication (WGD-ER and TD-ER) and CRs of the family in Cucurbitales, supposing that the family of V. vinifera has N = [(total number of genes) – (number of the newly gained genes from tandem duplication)] genes, we designed the following algorithm:
WGD-ER = (total number of the newly gained genes from polyploidizations/N) × 100%.
TD-ER = (number of the newly gained genes from tandem duplication/N) × 100%.
CR = (number of V. vinifera genes lost in Cucurbitales/N) × 100%.
In addition, identification of the gene clusters in families, we assigned the genes on each genome according to the physical positions. Then, we grouped all the genes into potential clusters, if the distance of a query gene to genes in potential clusters less than 2 Mb. To explore the relationship of chromosomal rearrangements and the expansion of gene cluster in families, we visualized the inferred paleochromosome rearrangements, homologous information, and the gene locations using TBtools (Chen et al., 2020). The gene structures of the families were analyzed through an online tool GSDS (http://gsds.cbi.pku.edu.cn/) (Hu et al., 2015).
Accession numbers
Sequence data from this article can be found in their respective online data libraries. The accession number of genome sequence is provided in Supplemental Table S1. The detailed DNA sequences sources involving in studied families are provided in Supplemental Table S28.
Supplemental data
The following materials are available in the online version of this article.
Supplemental Figure S1. Intergenomic comparison analyses of the V. vinifera and B. loranthoides genomes.
Supplemental Figure S2. Intergenomic comparative analyses: syntenic dotplot between the V. vinifera and B. loranthoides genomes.
Supplemental Figure S3. Intragenomic comparison analyses of the B. loranthoides genome.
Supplemental Figure S4. Intragenomic comparative analyses: syntenic dotplot within the B. loranthoides genome.
Supplemental Figure S5. Intergenomic comparison analyses of the V. vinifera and C. melo genomes.
Supplemental Figure S6. Intergenomic comparative analyses: syntenic dotplot between the V. vinifera and C. melo genomes.
Supplemental Figure S7. Intergenomic comparison analyses of the C. melo and B. loranthoides genomes.
Supplemental Figure S8. Intergenomic comparative analyses: syntenic dotplot between the C. melo and B. loranthoides genomes.
Supplemental Figure S9. Intragenomic comparison analyses of the C. moschata genome.
Supplemental Figure S10. Intragenomic comparative analyses: syntenic dotplot within the C. moschata genome.
Supplemental Figure S11. Intergenomic comparison analyses of the C. melo and C. moschata genomes.
Supplemental Figure S12. Intergenomic comparative analyses: syntenic dotplot between the C. melo and C. moschata genomes.
Supplemental Figure S13. Gene loss rates of the B. loranthoides genome.
Supplemental Figure S14. Gene retention of C. moschata subgenomes along orthologous regions corresponding to C. melo chromosomes.
Supplemental Figure S15. Inference of the ancestral Cucurbitales karyotype (ACK-I) by comparing the genomes of C. melo (Cme), Cucumis hystrix (Chy), Cucumis sativus (Csa), and L. siceraria (Lsi) with the V. vinifera (Vvi) genome. ACK-II, ancestral Cucurbitaceae karyotype.
Supplemental Figure S16. Inference of the ancestral Cucurbitales karyotype (ACK-I) by comparing the genomes of C. moschata (Cmo), Cucurbita maxima (Cma), C. argyrosperma (Car), and Cucurbita pepo (Cpe) with the V. vinifera (Vvi) genome.
Supplemental Figure S17. Inference of the ancestral Cucurbitales karyotype (ACK-I) by comparing the genomes of C. lanatus (Cla), B. masoniana (Bma), B. peltatifolia (Bpe), and B. darthvaderiana (Bda) with the V. vinifera (Vvi) genome.
Supplemental Figure S18. Chromosome evolutionary trajectories of the B. loranthoides genome.
Supplemental Figure S19. Chromosome evolutionary trajectories of the B. masoniana genome.
Supplemental Figure S20. Chromosome evolutionary trajectories of the B. peltatifolia genome.
Supplemental Figure S21. Chromosome evolutionary trajectories of the B. darthvaderiana genome.
Supplemental Figure S22. Chromosome evolutionary trajectories of the B. hispida genome. ACK-II, ancestral Cucurbitaceae karyotype.
Supplemental Figure S23. Chromosome evolutionary trajectories of the L. siceraria genome.
Supplemental Figure S24. Chromosome evolutionary trajectories of the C. lanatus genome.
Supplemental Figure S25. Chromosome evolutionary trajectories of the C. melo genome.
Supplemental Figure S26. Chromosome evolutionary trajectories of the C. hystrix genome.
Supplemental Figure S27. Chromosome evolutionary trajectories of the C. sativus genome.
Supplemental Figure S28. Chromosome evolutionary trajectories of the C. maxima genome.
Supplemental Figure S29. Chromosome evolutionary trajectories of the C. moschata genome.
Supplemental Figure S30. Chromosome evolutionary trajectories of the C. pepo genome.
Supplemental Figure S31. Chromosome evolutionary trajectories of the C. argyrosperma genome.
Supplemental Figure S32. Intergenomic comparison of C. hystrix (Chy), C. moschata (Cmo), C. lanatus (Cla), and L. siceraria (Lsi) genomes with the C. melo (Cme) genome.
Supplemental Figure S33. Intergenomic homologous structure comparison analyses between the C. melo and C. hystrix genomes.
Supplemental Figure S34. Intergenomic homologous structure comparison analyses between the C. melo and C. sativus genomes. ACK-IV, ancestral Cucumis karyotype.
Supplemental Figure S35. Inference of the expansion pattern of GPS (A) and FPS (B) gene families by comparing Cucurbitales with V. vinifera genes.
Supplemental Figure S36. Inference of the expansion pattern of SQS (A) and OSC (B) gene families by comparing Cucurbitales with V. vinifera genes.
Supplemental Figure S37. Inference of the expansion pattern of the SQE gene family by comparing Cucurbitales with V. vinifera genes.
Supplemental Figure S38. P450 gene amplification model related to gene duplication events in B. masoniana (A), B. loranthoides (B), B. darthvaderiana (C), and B. peltatifolia (D).
Supplemental Figure S39. P450 gene amplification model related to gene duplication events in C. argyrosperma (A), C. maxima (B), C. pepo (C), and V. vinifera (D).
Supplemental Figure S40. P450 gene amplification model related to gene duplication events in B. hispida (A), C. lanatus (B), L. siceraria (C), C. melo (D), C. hystrix (E), and C. sativus (F).
Supplemental Figure S41. Chromosomal distributions of P450 genes in L. siceraria.
Supplemental Figure S42. Chromosomal distributions of P450 genes in C. moschata.
Supplemental Figure S43. Chromosomal distributions of P450 genes in B. loranthoides.
Supplemental Figure S44. Chromosomal distributions of P450 genes in V. vinifera.
Supplemental Figure S45. Chromosomal distributions of P450 genes in V. vinifera and three representative Cucurbitales genomes.
Supplemental Figure S46. CDS–UTR structures of FPS family genes in the studied genomes.
Supplemental Figure S47. CDS–UTR of GPS family genes in the studied genomes.
Supplemental Figure S48. CDS–UTR structure of SQE family genes in the studied genomes.
Supplemental Figure S49. CDS–UTR structure of SQS family genes in the studied genomes.
Supplemental Figure S50. CDS–UTR structure of OSC family genes in the studied genomes.
Supplemental Table S1. Information on genomic data.
Supplemental Table S2. Number of homologous genes and blocks within a genome and between genomes.
Supplemental Table S3. Kernel function analysis of Ks distribution related to duplication events within each genome and between selected genomes (before evolutionary rate correction).
Supplemental Table S4. Kernel function analysis of Ks distribution related to duplication events within each genome and between selected genomes (after evolutionary rate correction).
Supplemental Table S5. Orthologous genomic regions between C. melo and C. moschata.
Supplemental Table S6. Orthologous genomic regions between V. vinifera and B. darthvaderiana.
Supplemental Table S7. Orthologous genomic regions between V. vinifera and B. hispida.
Supplemental Table S8. Orthologous genomic regions between V. vinifera and B. loranthoides.
Supplemental Table S9. Orthologous genomic regions between V. vinifera and B. masoniana.
Supplemental Table S10. Orthologous genomic regions between V. vinifera and B. peltatifolia.
Supplemental Table S11. Orthologous genomic regions between V. vinifera and C. argyrosperma.
Supplemental Table S12. Orthologous genomic regions between V. vinifera and C. hystrix.
Supplemental Table S13. Orthologous genomic regions between V. vinifera and C. lanatus.
Supplemental Table S14. Orthologous genomic regions between V. vinifera and C. maxima.
Supplemental Table S15. Orthologous genomic regions between V. vinifera and C. melo.
Supplemental Table S16. Orthologous genomic regions between V. vinifera and C. moschata.
Supplemental Table S17. Orthologous genomic regions between V. vinifera and C. pepo.
Supplemental Table S18. Orthologous genomic regions between V. vinifera and C. sativus.
Supplemental Table S19. Orthologous genomic regions between V. vinifera and L. siceraria.
Supplemental Table S20. Number of duplicated genes within selected genomes related to WGD events.
Supplemental Table S21. Number of duplicated genes within selected genomes related to divergence between genomes.
Supplemental Table S22. Homologous alignments of B. loranthoides, C. moschata, and C. melo with V. vinifera as the reference.
Supplemental Table S23. Homologous alignments of Cucurbitales genomes with V. vinifera as the reference.
Supplemental Table S24. Gene loss and gene translocation rates with V. vinifera as the reference genome.
Supplemental Table S25. Gene loss and gene translocation rates with C. melo as the reference genome.
Supplemental Table S26. Gene retention in homoeologous plant regions with reference to V. vinifera genomes.
Supplemental Table S27. Gene retention in homoeologous plant regions with reference to C. melo genomes.
Supplemental Table S28. Gene IDs of gene families within the cucurbitacin biosynthesis pathway in selected genomes.
Supplemental Table S29. Nucleotide substitution models for phylogenetic trees within different gene families.
Funding
This work was supported by the National Natural Science Foundation of China (32170236 and 31501333 to J.P.W.); the Natural Science Foundation of Hebei Province (C2020209064 to J.P.W. and C2020209020 to M.Y.).
Conflict of interest statement. The authors declare no competing interests.
These authors contributed equally (J.Q.W., M.Y., Y.F., and Y.Z.)
J.P.W. conceived the project and was responsible for the project initiation. J.P.W., J.Q.W., C.X., and Y.L. supervised and managed the project and research. The data collection, genomic collinearity analyses, and animation of chromosome karyotype were led by S.B., Y.H., and Y.D. X.G., Z.Y., and Q.X. contribution to the programming and database construction. Evolutionary analysis was performed by J.Z., Q.Z., P.W., J.Y.W., and C.W. The manuscript was organized, written, and revised by J.P.W., J.Q.W., M.Y., Y.F., and Y.Z. All authors read and approved the manuscript.
The author responsible for distribution of materials integral to the findings presented in this article in accordance with the policy described in the Instructions for Authors (https://dbpia.nl.go.kr/plphys/pages/general-instructions) is: Jinpeng Wang ([email protected]).
References
The Angiosperm Phylogeny Group,
Author notes
Senior authors
