


Abstract
Vernalization, influenced by environmental factors, is an essential process associated with the productivity of temperate crops, during which epigenetic regulation of gene expression plays an important role. Although DNA methylation is one of the major epigenetic mechanisms associated with the control of gene expression, global changes in DNA methylation in the regulation of gene expression during vernalization-induced flowering of temperate plants remain largely undetermined. To characterize vernalization-associated DNA methylation dynamics, we performed whole-genome bisulfite-treated sequencing and transcriptome sequencing in orchardgrass (Dactylis glomerata) during vernalization. The results revealed that increased levels of genome DNA methylation during the early vernalization of orchardgrass were associated with transcriptional changes in DNA methyltransferase and demethylase genes. Upregulated expression of vernalization-related genes during early vernalization was attributable to an increase in mCHH in the promoter regions of these genes. Application of an exogenous DNA methylation accelerator or overexpression of orchardgrass NUCLEAR POLY(A) POLYMERASE (DgPAPS4) promoted earlier flowering, indicating that DNA hypermethylation plays an important role in vernalization-induced flowering. Collectively, our findings revealed that vernalization-induced hypermethylation is responsible for floral primordium initiation and development. These observations provide a theoretical foundation for further studies on the molecular mechanisms underlying the control of vernalization in temperate grasses.
Introduction
DNA methylation, a major and conserved type of epigenetic regulation, plays prominent roles in environmental responses, developmental regulation, inactive transcription, and genome stability (Zhu, 2009; Law and Jacobsen, 2010). In plants, DNA methylation is characterized by the symmetric CG and CHG (H represents A, T, or C) and asymmetric CHH patterns (Cokus et al., 2008; Lister et al., 2008), and the establishment, maintenance, and removal of DNA methylation marks involving distinct mechanisms. In Arabidopsis (Arabidopsis thaliana), the methylation of CG, CHG, and CHH sites is maintained by different DNA methyltransferases, including MET1 (METHYLTRANSFERASE 1), CMTs (CHROMOMETHYLASEs), and DRMs (DOMAINS REARRANGED METHYLASEs; Zhu, 2009). De novo DNA methylation in all three contexts can be established via the small RNA-directed DNA methylation (RdDM) pathway (Cheng et al., 2018), which involves Pol IV (RNA polymerase IV), DCLs (DICER-LIKEs), AGO4/6 (ARGONAUTE 4/6), and DRMs (Matzke and Mosher, 2014; Matzke et al., 2015). In addition, the canonical NUCLEAR POLY(A) POLYMERASE (PAPS) can interact with the RdDM pathway via components of mRNA processing (Zhang et al., 2019). Furthermore, the initiation of DNA demethylation has been shown to be promoted by DNA demethylases, including DEMETER (DME), DEMETER-LIKEs (DMLs), and REPRESSOR OF SILENCING 1 (ROS1; Zhu, 2009).
It has been established that vernalization treatment can potentially have beneficial effects on crop productivity, and it was primarily explored in temperate crops, such as wheat (Triticum aestivum) and rye (Secale cereale; Chouard, 1960). Numerous temperate plant species, including annuals, biennials, and perennials, require a period of vernalization to break dormancy and initiate flowering. In Arabidopsis, the key gene blocking pre-vernalization flowering is FLOWERING LOCUS C (FLC; Michaels and Amasino, 1999). In this regard, floral integrator genes, such as FLOWERING LOCUS T (FT) and SUPPRESSOR OF OVEREXPRESSION OF CONSTANS 1 (SOC1) were repressed by FLC and its clade members to prevent flowering (Sheldon et al., 2000; Hepworth et al., 2002; Moon et al., 2003; Michaels et al., 2005; Helliwell et al., 2006; Searle et al., 2006; Gu et al., 2013). Comparatively, in monocots such as wheat, rye, and barley (Hordeum vulgare), VERNALIZATION1 (VRN1) and VRN2 are two key genes in the regulation of the flowering integrator VRN3 during vernalization, and these genes are core regulators in a network controlling the vernalization response (Yan et al., 2003; Yan et al., 2004; Yan et al., 2006; Trevaskis, 2010; Chen and Dubcovsky, 2012; Deng et al., 2015). VRN1, an activator of flowering in temperate grasses, encodes a MADS-box transcription factor putatively orthologous to FRUITFULL (FUL), APETALA1 (AP1), and CAULIFLOWER (VAL) in Arabidopsis (Yan et al., 2003), whereas VRN2, a potent floral repressor, encodes a zinc finger protein (Yan et al., 2004), and VRN3 also referred to as FT1, is a common mobile florigen that is evolutionarily conserved across angiosperms (Yan et al., 2006; Lv et al., 2014).
Vernalization is a natural epigenetic phenomenon in both dicots and monocots (Shrestha et al., 2014), and is mediated via distinct gene networks. In Arabidopsis, the downregulation of FLC during vernalization is associated with changes in chromatin structure, attributable to histone modification of the trimethylation of lysine 27 (H3K27me3) and lysine 36 (H3K36me3) on histone H3 (Milec et al., 2014). In monocots, the expression of VRN1 in vernalization is associated with an increase and reduction in H3K4me3 and H3K27me3, respectively, in the chromatin of VRN1 (Oliver et al., 2009; Huan et al., 2018). Additionally, DNA methylation may also play role in vernalization-induced flowering. For example, it has previously been reported that methylation of genomic DNA is reduced during the prolonged vegetative growth at low temperatures (Burn et al., 1993; Dennis et al., 1998; Finnegan et al., 1998). In vernalization-sensitive Arabidopsis, flowering can be promoted by application of the DNA methylation inhibitor 5-azacytidine, although not in non-vernalization sensitivity lines (Burn et al., 1993; Dennis et al., 1998). 5-Azacytidine has also been observed to promote heading in winter wheat (Brock and Davidson, 1994). Furthermore, it has been established that in Arabidopsis, there is an increase in the levels of DNA methylation from the meristem to the early flowering stage, which is followed by a reduction in levels from early to late flowering (Yang et al., 2015). However, in temperate grasses the global changes of DNA methylation associated with the regulation of genes in response to vernalization-induced flowering of plants remains largely undetermined.
As one of the top four economically important forage grasses cultivated worldwide, orchardgrass (Dactylis glomerata) is essential for the production of forage-based meat and dairy throughout the temperate regions (Stewart and Ellison, 2011). Orchardgrass-alfalfa mixtures are one of the best combinations in rangelands establishment for grazing (Bi et al., 2019). However, the flowering time of orchardgrass, which is one of the main factors for determining the mixture and is quite variable, makes it ideal for the study of flowering regulation (Bushman et al., 2012; Zhao et al., 2016). As a vernalization-sensitive plant, floral induction in orchardgrass is dependent upon a combination of short days and low temperatures (Gardner and Loomis, 1953). Additionally, in evolutionary terms, orchardgrass is closely related to temperate cereals (Huang et al., 2020). To investigate the dynamic changes in DNA methylation during vernalization, we characterized the DNA methylomes and transcriptomes of orchardgrass at different stages of vernalization. We observed global increases in DNA methylation during the early stages of orchardgrass vernalization, and found that the dynamics of vernalization-induced DNA methylation are associated with changes in the transcription of DNA methyltransferase and demethylase genes. In particular, we found that the promoter regions of five vernalization-related genes are characterized by DNA hypermethylation. The application of a DNA methylation accelerator caused early flowering by upregulating the expression of vernalization-related genes. Furthermore, overexpression of an RdDM-related gene DgPAPS4 in Arabidopsis promoted GAMOUS-LIKE 20 (AtAGL20) expression by increasing DNA methylation in the promoter region during vernalization, leading to an early flowering phenotype in transgenic Arabidopsis. These findings suggest that DNA hypermethylation potentially contributes to the epigenetic regulation of vernalization-induced floral development. Our study reveals the dynamics of DNA methylation in vernalization-induced flowering, and highlights orchardgrass as an example of vernalization-induced hypermethylation regulating floral primordium initiation and development in temperate grasses, and reinforces an epigenetic mechanism for vernalization-induced flowering.
Results
Genome-wide DNA methylation profiles of orchardgrass during vernalization
To characterize dynamic changes in the patterns of DNA methylation during vernalization, we performed WGBS and constructed a single-base high-resolution DNA methylation map for the young leaves of orchardgrass during different stages of vernalization: V0 (no vernalization), V4 (vernalized for 4 weeks), and V8 (vernalized for 8 weeks; Figure 1A). For each bisulfite sequencing library, we generated more than 359 million 150-bp paired-end clean reads, covering > 94% of the orchardgrass genome, with a conversion rate greater than 99.3% (Supplemental Tables S1 and S2). All samples were sequenced with an average > 29-fold coverage per DNA strand, and we obtained more than 107 million cytosines in each sample. The sequencing coverage and depth thus obtained are greater than those of the published methylomes of strawberry (Fragaria × ananassa), orange (Citrus sinensis Osbeck) fruit, and switchgrass (Panicum virgatum; Cheng et al., 2018; Yan et al., 2018; Huang et al., 2019; Yan et al., 2019), indicating the data were sufficient for downstream analysis. The correlation between the replicates of each sample was evaluated by MethylKit (Akalin et al., 2012), and both replicates presented high correlation coefficients (> 0.93; Supplemental Figure S1).
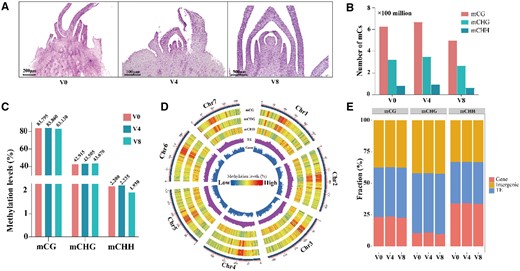
The floral primordium of orchardgrass after vernalization stimulation and the genomic landscape of DNA methylation in orchardgrass after different vernalization stages. A, Picture of orchardgrass floral primordium at different vernalization stages. V0, no vernalization; V4, vernalized for 4 weeks; V8, vernalized for 8 weeks. B, Number of methylated cytosines (mCs) identified in V0, V4, and V8. V0, no vernalization; V4, vernalized for 4 weeks; V8, vernalized for 8 weeks. C, Percentages of methylated cytosines (mCs) in the different vernalization stages. V0, no vernalization; V4, vernalized for 4 weeks; V8, vernalized for 8 weeks. D, Circos plot showing gene density, TE density, and ratios of CG, CHG, and CHH methylation levels in orchardgrass during vernalization using 1-Mb sliding 100-kb windows among the chromosomes. E, Relative proportions of gene, intergenic, and TE regions for mCG, mCHG, and mCHH sites.
A total of approximately 483–837 million mCs (59.63%–60.65% of total mCs) were associated with mCG sites, 260–432 million (31.25%–31.58% of total mCs) with mCHG sites, and 60–112 million 7.16%–8.09% of total mCs) with mCHH sites in the orchardgrass genome (Figure 1B;Supplemental Table S3). Cytosines associated with the CG and CHG sites were found to be strongly methylated, whereas comparatively few of the cytosines in the CHH sites had undergone methylation (Figure 1C). DNA methylation in the CG, CHG, and CHH context presented similar distribution at different vernalization stages of orchardgrass (Supplemental Figure S2). To characterize the DNA methylation of orchardgrass, we combined the methylation of the three stages (V0, V4, and V8; Figure 1D). At the chromosome scale, we detected a high level of methylation at CG and CHG sites within TE-rich regions, whereas comparatively lower levels were detected at the CHH sites in these regions (Figure 1, D and E; Supplemental Figure S2).
Profiles of DNA methylation in the coding genes and transposable elements of orchardgrass
We examined the DNA methylation profiles of coding genes (including gene body and their 2-kb flanking regions) at different stages of vernalization (Figure 2, A and B). We accordingly detected relatively high levels of methylation at CG sites in genic regions, whereas CHH sites were found to have the lowest methylation levels (Figure 2, A and B). With respect to vernalization stage, we observed that mCHH levels were significantly higher at V4 than those at either V0 or V8 (P < 0.05; Figure 2A). In addition, we found that sequences around the transcriptional start (TSS) and termination sites (TTS) of genes showed low levels of methylation at all three assessed mark sites (Figure 2B). Interestingly, however, we detected high levels of methylation at CHG and CHH sites in the upstream and downstream regions of genes (Figure 2, A and B).
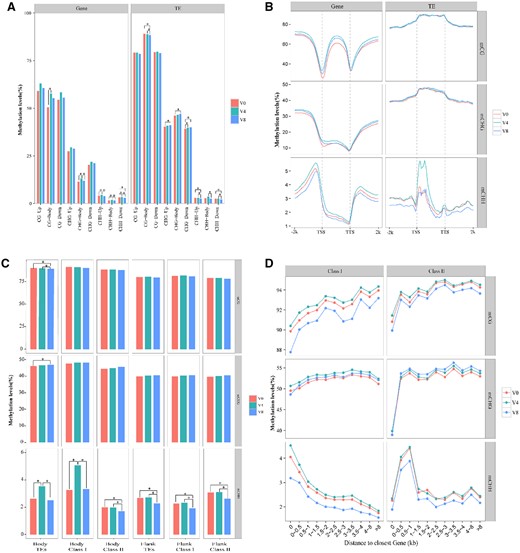
Comparison of DNA methylation levels in the genic and TE regions among V0 (no vernalization), V4 (vernalized for 4 weeks), and V8 (vernalized for 8 weeks). A, Comparison of methylation levels in genic and TE bodies and their 2-kb flanking regions upstream (Up) and downstream (Down; Wilcoxon test, *P<0.05). B, Methylation profiles in genic and TE regions. The mean level for each 100-bp interval is plotted. “TSS” indicates the transcriptional start site, and “TTS” indicates the transcription termination sites. C, Methylation of TE Class I (retrotransposons) and Class II (DNA transposons) in the gene body and flanking 2-kb regions. “Body” indicates the insertion is in the gene body region, and “Flank” indicates the insertion is in the flanking 2-kb region (Wilcoxon test, *P<0.05). D, TE methylation level related to the distance from the closest gene; “0” indicates that the TEs are inserted into the gene bodies.
It has previously been reported that 68.56% of orchardgrass genome sequences are TEs, among which, 63.64% are Class I TEs (retrotransposons) and the remaining 4.92% are Class II TEs (DNA transposons; Huang et al., 2020). We analyzed the methylation patterns of TEs, including the TE body and the upstream (−2 kb) and downstream (2 kb) regions (Figure 2, A and B). Compared with the gene coding sequences, we found that the TE sequences were characterized by higher average levels of methylation (Figure 2, A and B). With respect to the CG and CHG sites, levels of methylation were found to be higher in the TE body regions than in the flanking upstream and downstream regions. In contrast, we found that the levels of methylation at CHH sites in TE body and flanking regions tended to differ depending on sample type (Figure 2, A and B). We further investigated the methylation patterns of the two aforementioned types of TEs. With respect to the CG and CHG sites, we detected no significant changes in the methylation levels of TEs and their flanking regions in any of the examined samples, whereas in the case of CHH sites, methylation levels in the body regions of TEs and Class I TEs body were found to be higher at V4 (Figure 2C). Furthermore, at stage V8, we detected significantly lower levels of methylation at CHH sites in the flanking regions of TEs, Class I TEs, and Class II TEs than at stages V0 and V4 (Figure 2C). Moreover, we determined distances between TEs and the closest genes and assessed trends in methylation level changes. In the case of both mCG and mCHG, we detected increases in methylation levels in both Classes I and II TEs, which commenced in the body sequence and gradually extended to a range of more than 8 kb in the flanking regions (Figure 2D). In contrast, we observed a gradual reduction in mCHH levels in Class I TEs with increasing distances from the genes. Conversely, mCHH levels in Class II TEs were found to increase rapidly with increasing distances from genes, with peak levels being observed within 1 kb of the flanking region sequences (Figure 2D). Notably, for both types of TE, we detected hypomethylation of mCHH in V8 plants, which was found to be particularly prominent in Class II TEs located in gene-flanking regions.
DNA methylation increases in the early stages of vernalization
To characterize the patterns of methylation at different vernalization stages, we compared the DNA methylomes between V0 and V4, and V4 and V8. In total, we identified 20,891 differentially methylated regions (DMRs) during the early stages of vernalization (V0_VS_V4), of which 17,489 were hypermethylated (hyper-DMRs) and 3,402 were hypomethylated (hypo-DMRs), and 33,804 DMRs at the late stage of vernalization (V4_VS_V8), of which 6,297 were hyper-DMRs and 27,807 were hypo-DMRs (Supplemental Figures S3A and S4). The number of the mCHH-DMRs (17,493 and 25,290) in each comparison group (V0_VS_V4 and V4_VS_V8) was much larger than the number of mCG-DMRs (1,354 and 3,951) and mCHG-DMRs (2,044 and 4,563; Supplemental Figures S3A and S4). The V4 plants had more hypermethylated mCHH-DMRs compared with V0 plants, while the V8 plants had more hypomethylated DMRs (Supplemental Figures S3A and S4). These findings indicated that mCHH increases during the early vernalization stage. The methylation levels of hypermethylated and hypomethylated mCHH-DMRs (V0_VS_V4) in each sample supported this finding (Supplemental Figure S3B). Moreover, we detected more overlap of mCHH-DMRs in the V4_VS_V8 comparison than in that between V0 and V4, which differed in the distribution patterns of mCG- and mCHG-DMRs (Supplemental Figure S4). We found that many of the DMRs overlapped with intron, exon, promoter (−2 kb), and intergenic regions, although larger numbers were observed to overlap with TE regions (Supplemental Figure S5A), and were particularly enriched in long TEs (>4 kb; Supplemental Figure S5B).
Having established these DMR patterns, we proceeded to characterize the genes located within these regions (differentially methylated genes; DMGs). In total, we identified 3,295 non-redundant DMGs during the early stages of vernalization, of which 2,292 and 1,088 were hyper- and hypomethylated, respectively, and 85 showed both hyper- and hypomethylation (Supplemental Figure S6). Compared with the early stages of vernalization, we identified a notably larger number of non-redundant DMGs (6,515) during the late phase of vernalization. Of these 6,515 DMGs, 1,446 and 5,268 genes were hyper- and hypomethylated, respectively, and 199 showed hyper- and hypomethylation (Supplemental Figure S6).
To investigate the potential functional roles of DMGs in orchardgrass floral induction and development, we performed Gene Ontology (GO) analysis of the hyper- and hypo-DMGs detected at different stages of vernalization. These DMGs are involved in a diverse range of processes, including response to stimulus (GO:0050896), developmental process (GO:0032502), signaling (GO:0023052), reproductive process (GO:0022414), reproduction (GO:0000003), and growth (GO:0040007; Supplemental Figure S7). Interestingly, we established that during the early stages of vernalization, the number of hyper-DMGs involved in these processes was greater than those of hypo-DMGs, whereas the converse pattern was identified during the late stages of vernalization. Subsequent KEGG analysis revealed that during the early stages of vernalization, a larger number of hypermethylated genes are involved in signal transduction pathways, including the MAPK signaling pathway, plant hormone signal transduction, phosphatidylinositol signaling system, and ABC transporters (Supplemental Figure S8). Conversely, a larger proportion of hypomethylated genes are involved in these pathways during the late stages of vernalization (Supplemental Figure S8).
DNA methyltransferases and demethylases jointly regulate the changes in DNA methylation
To determine the factors mediating dynamic changes in DNA methylation, we analyzed the transcript levels of DNA methyltransferase and demethylase genes at the different stages of orchardgrass vernalization. Initially, we performed a blastp search of the orchardgrass reference genome to identify the DNA methyltransferase and demethylase genes, and accordingly detected eight methyltransferases, namely, DgDRM1a, DgDRM1b, DgDRM2, DgDRM3a, DgDRM3b, DNA METHYLTRANSFERASE 2 (DgDNMT2), DgMET1, and DgCMT2 (Figure 3A). Among these genes, six (DgDRM1a, DgDRM1b, DgDRM3b, DgDNMT2, DgMET1, and DgCMT2) showed relatively low expression levels at V0 compared with the subsequent stages (Figure 3B). Changes in the expression of DgMET1, DgDNMT2, DgCMT2, and DgDRM3b were found to be substantially associated with the observed changes in mCG, mCHG, and mCHH, respectively (Figure 3B). We also analyzed the expression patterns of genes involved in the RdDM pathway and accordingly identified DgPAPS4 as being significantly induced by vernalization (false discovery rate, FDR < 0.05; Supplemental Figure S9), These observations thus indicate that increases in the levels of DNA methylation seen during the early phase of vernalization are associated with changes in the expression of DNA methyltransferases and de novo methylation-related genes.
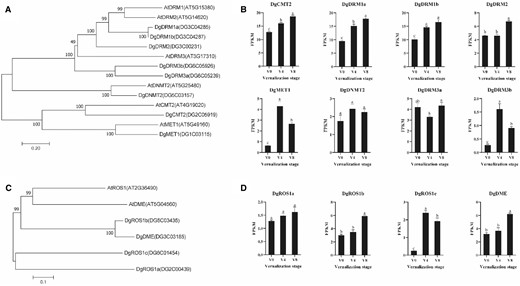
Phylogenetic analysis and expression of DNA methyltransferase genes and DNA demethylase genes in orchardgrass during vernalization. A, Phylogenetic analysis of DNA methyltransferase genes in orchardgrass and Arabidopsis. Bootstrap numbers shown at nodes are the percentage of 1,000 replicates. Scale bar indicates treescale, which represents the number of differences between sequences (0.20 means 20% differences between two sequences). B, Transcript levels of DNA methyltransferase genes at different vernalization stages. V0, no vernalization; V4, vernalized for 4 weeks; V8, vernalized for 8 weeks. C, Phylogenetic analysis of DNA demethylase genes in orchardgrass and Arabidopsis. Bootstrap numbers shown at nodes are the percentage of 1,000 replicates. The scale indicates treescale, which represents the number of differences between sequences (0.1 means 10% differences between two sequences). D, Transcript levels of DNA demethylase genes at different vernalization stages. V0, no vernalization; V4, vernalized for 4 weeks; V8, vernalized for 8 weeks. Significant differences in gene expression (Duncan’s multiple range test, P < 0.05) are denoted by different letters. Error bars indicate the standard error of three biological replicates.
With respect to DNA demethylase genes, we identified four DNA demethylase putative orthologs in the orchardgrass genome, namely, DgROS1a, DgROS1b, DgROS1c, and DgDME (Figure 3C), among which, transcript levels of DgROS1c were found to be significantly higher at V4 than at V0 and V8, whereas we detected non-significant changes in the expression of DgROS1a during the course of vernalization (P < 0.05; Figure 3D). In contrast, however, DgROS1b and DgDME were found to be significantly upregulated at V8 compared with V0 and V4 (Figure 3D). On the basis of these observations, it would thus appear that changes in DNA methylation during the vernalization of orchardgrass are associated with changes in the transcript levels of DNA methyltransferase and DNA demethylase genes
DNA methylation status is associated with gene expression levels
To determine whether the levels of DNA methylation contribute to the regulation of gene transcript levels during vernalization, we performed an association analysis to examine the associations between DNA methylomes and transcriptome profiles at different stages of vernalization. We divided genes into four groups based on their levels of expression in all samples. With respect to those genes that were not expressed, we detected relatively higher methylation at downstream CG and CHG sites, whereas higher levels of methylation were detected at CHG and CHH sites in gene body regions (Figure 4A), and lower levels in upstream regions (Figure 4A). In contrast, in the case of highly expressed genes, we detected relatively higher levels of methylation at CHG and CHH sites in upstream regions and low levels in gene body regions (Figure 4A). For moderately expressed genes, the highest levels of mCG methylation were detected in gene body regions, whereas for those genes characterized by low expression, there was a positive association with the levels of CHG and CHH methylation in upstream regions (Figure 4A). Overall, these findings tend to indicate that the level of gene expression is positively associated with the levels of upstream CHG and CHH methylation.
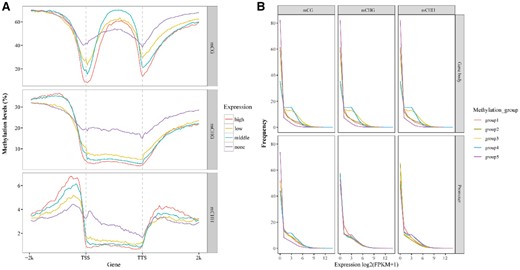
Relationship between DNA methylation and gene expression in orchardgrass during vernalization. A, Distributions of methylation levels within gene bodies by different expression levels: none (FPKM < 1), low (1 < FPKM < lower quartile), medium (lower quartile < FPKM < upper quartile), and high (FPKM > upper quartile). “TSS” indicates the TSS, and “TTS” indicates the transcription termination sites. B, Expression profiles of methylated genes. Methylated genes were divided into five groups based on promoter and gene body region methylation levels: Group 1 (methylation levels < lower quintile), Group 2 (lower quintile < methylation levels < the second quintile), Group 3 (the third quintile < methylation levels < the fourth quintile), Group 4 (the fourth quintile < methylation levels < upper quintile), and Group 5 (methylation levels > upper quintile).
In addition, we further assessed the relationships between gene methylation and expression status, for the purposes of which, we divided genes into five groups based on methylation levels detected in promoter (2 kb upstream) and gene body regions. This analysis revealed that genes characterized by the highest methylation of CG, CHG, and CHH sites in gene body regions showed the lowest levels of expression (Figure 4B). However, we were unable to detect any notable associations with gene transcript levels among the other groups showing different levels of DNA methylation (Figure 4B). With respect to promoter regions, we found that in genes with the highest expression, higher levels of methylation were detected at CHG and CHH sites, with comparatively lower levels at CG sites (Figure 4B).
Changes in DNA methylation levels influence the expression of vernalization pathway-related genes
To examine the potential effects of dynamic changes in DNA methylation on transcriptional changes during vernalization, we performed RNA-seq of samples used for methylome analysis. Among the genes that were differentially expressed between stages V0 and V4, we identified 4,882 and 2,509 that were significantly up- and downregulated, respectively, whereas 1,446 and 3,493 genes were upregulated and downregulated, respectively among those differentially expressed between V4 and V8 (FDR < 0.05; Figure 5, A and B). To assess the relationship between methylation changes and transcriptional alterations, we examined the overlap between the differentially expressed genes (DEGs) and DMGs. For the V0_VS_V4 comparison, we accordingly identified 208 hypermethylated genes with upregulated expression levels and 453 hypomethylated genes that were downregulated, and 115 upregulated and 113 downregulated genes were hypo- and hypermethylated, respectively (Figure 5A). Similarly, for the comparison between V4 and V8, we identified 47 hyper- and 353 hypo-methylated genes showing positive association between gene expression and methylation levels, whereas negative associations were detected for 188 hypo- and 94 hyper-methylated genes (Figure 5B). These findings indicate that in the majority of cases, gene expression might not be associated with differences in methylation level, and thus the changes in gene expression might be either modified by methylation or induced by other gene expression regulatory mechanisms.
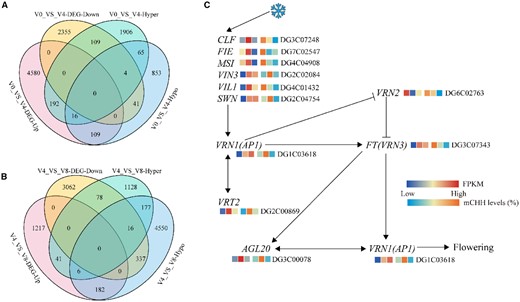
Venn diagrams of DMGs and DEGs. A, Venn diagram of DMGs and DEGs in V0_VS_V4. DEGs were determined using DESeq2 with FDRs < 0.05, estimated by the adjusted P-value. B, Venn diagram of DMGs and DEGs in V4_VS_V8. DEGs were determined using DESeq2 with FDR < 0.05, estimated by the adjusted P-value. C, The heat maps of mCHH levels and expression levels of vernalization pathway genes of orchardgrass during vernalization. The six grids, from left to right, indicate the gene transcript abundance at V0, V4, and V8, the mCHH levels on gene promoter region (2k bp) at V0, V4, and V8. V0, no vernalization; V4, vernalized for 4 weeks; V8, vernalized for 8 weeks.
We further examined the association between the levels of promoter methylation with respect to CHH sites and the expression levels of vernalization pathway-related genes. For each of the assessed genes, we calculated levels of promoter methylation and gene expression levels for the different stages of vernalization. We found that transcript levels of the key vernalization pathway gene VRN1 showed a positive relationship with the levels of promoter methylation from V0 to V4 (Figure 5C). Interestingly, we also detected a strong positive association between promoter methylation and the levels of AGL20 expression at different stages of vernalization (Figure 5C), thereby indicating that AGL20 is an important target for the modification of DNA methylation (Figure 5C).
To further validate the role of DNA methylation in the vernalization process, we examined the effects of spraying “2006-1” line orchardgrass plants with the DNA methylation accelerator methyl trifluoromethanesulfonate (MTFMS) and inhibitor zebularine (Zeb) during vernalization. Following treatment, the plants were transferred to a warm (22°C) long-day (16 h light/8 h dark) environment for subsequent flowering time observations. We accordingly found that plants treated with MTFMS and Zeb showed promoted and delayed flowering time phenotypes, respectively (Figure 6A). RT-qPCR analysis of the post-treatment expression levels of vernalization pathway-related genes tended to indicate that the DNA methylation accelerator had promoted the expression of vernalization pathway genes, such as CURLY LEAF (CLF), FERTILIZATION INDEPENDENT ENDOSPERM (FIE), MULTICOPY SUPPRESSOR OF IRA (MSI), VERNALIZATION INSENSITIVE 3 (VIN3), VIN3 LIKE 1 (VIL1), SWINGER (SWN), VRN1, FT, and AGL20 (Figure 6B). These results thus provide evidence to indicate that DNA hypermethylation contributes to the promotion of orchardgrass floral induction and development during the course of vernalization.
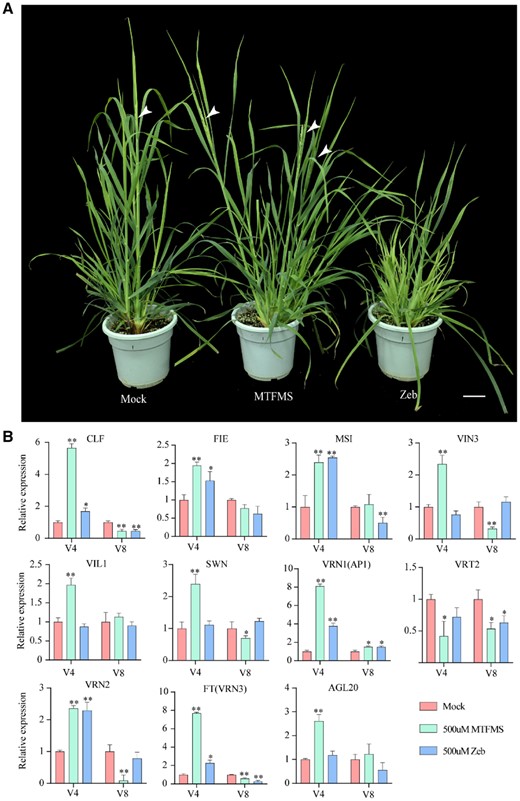
Effects of the DNA methylation accelerator MTFMS and inhibitor zebularine (Zeb) on the flowering time and expression of related genes in orchardgrass. A, Photographs of MTFMS- and Zeb-treated orchardgrass. Orchardgrass treated with ddH2O served as a control (Mock). White arrows point to spikes. Scale bar, 5 cm. B, Expression of vernalization pathway-related genes in Mock (red bar), 500 uM MTFMS- (green bar) and 500 uM Zeb-treated (blue bar) orchardgrass during vernalization. V4, vernalized for 4 weeks; V8, vernalized for 8 weeks. Error bars indicate the standard error of three biological replicates, asterisks indicate the corresponding gene significantly up- or downregulated compared with the mock (Wilcoxon test, *P<0.05; **P<0.01).
Overexpression of DgPAPS4 promotes flowering in Arabidopsis
To examine the role of vernalization-induced hypermethylation in floral induction and development, we selected the RdDM pathway-related gene DgPAPS4 for overexpression analysis in Arabidopsis. A construct containing the CaMV 35S promoter and full length of DgPAPS4 cDNA was generated and used to transform wild-type Arabidopsis (Col-0) plants. Following vernalization, we examined the flowering time of three positive transgenic plants. In all transgenic plants, a cold treatment of 4 weeks was found to accelerate flowering (Figure 7, A and B). RT-qPCR analysis of the expression levels of AtAGL20 in non-vernalization plants and those vernalized for 4 weeks revealed that while there were no significant changes in AtAGL20 expression in either non-vernalized WT or transgenic plants, the expression levels of this gene in overexpressing plants were significantly higher than those in WT plants after vernalization for 4 weeks (Figure 7C). To examine whether DgPAPS4 influences AtAGL20 expression to promote flowering via altering DNA methylation levels in the vernalized transgenic plants, we performed McrBC-qPCR for both WT and transgenic plants. This revealed that the examined genomic regions of transgenic plants were characterized by higher levels of DNA methylation than the same regions in WT plants (Figure 7D), thereby indicating that vernalization induces DNA hypermethylation, which is essential for plant flowering.
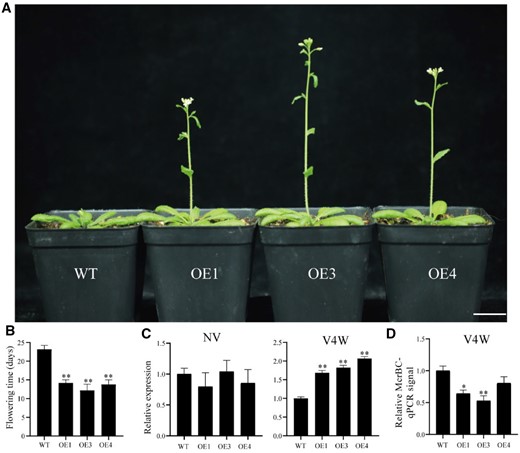
Phenotype of DgPAPS4 transgenic plants, and the expression levels of genes involved in the vernalization pathway. A, Morphological phenotypes of DgPAPS4 transgenic plants and Col-0 wild-type plants after 4 weeks vernalization treatment and then 21 d growth under long-day conditions. “WT” indicates the wild type (Col-0), and “OE” indicates the transgenic line. Scale bar, 2 cm. B, Flowering time of DgPAPS4 transgenic plants and Col-0 wild-type grown under long-day conditions after vernalization (Data are means ± SD, n = 10, Wilcoxon test, **P<0.01). C, Expression of AtAGL20 with different vernalization treatments in transgenic and wild-type plants; NV, non-vernalization; V4W, vernalization treatment for 4 weeks. Error bars indicate the standard error of three biological replicates (Wilcoxon test, **P<0.01). D, DNA methylation levels of promoter regions of AtAGL20. McrBC-qPCR analysis was performed in WT and transgenic plants after vernalization. Methylated DNA can be digested by McrBC, thus higher qPCR signals indicate lower methylation levels. Error bars indicate the standard error of three biological replicates (Wilcoxon test, *P<0.05; **P<0.01).
Discussion
The landscape of global cytosine methylation in orchardgrass
DNA methylation is an essential and common epigenetic modification associated with numerous important biological processes including environmental responses, developmental regulation, genome stability, and inactive transcription (Zhu, 2009; Law and Jacobsen, 2010). Vernalization is an epigenetic-associated mechanism that plants have evolved to ensure appropriate flowering times, which is of particular importance with respect to agricultural crop production (Chouard, 1960; Kim et al., 2009; Finnegan, 2012). However, for temperate grasses, the global dynamic regulation of DNA methylation in response to vernalization has yet to be sufficiently clarified. In this study, we performed WGBS to generate a map of DNA methylation at a single base resolution for orchardgrass subjected to vernalization. Among all the assessed sequences, that of mCG showed the highest density of methylation (∼83.60%), followed by mCHG (∼43.36%) and mCHH (∼2.12%; Figure 1B), which is similar to the patterns previously reported for other species (Xu et al., 2018; Yan et al., 2018; Huang et al., 2019; Zhang et al., 2020; Tang et al., 2021; Zhang et al., 2021). Compared with other species, the levels of mCG and mCHG methylation in orchardgrass are relatively high. For instance, mCG methylation has been found to range from ∼30.5% in Arabidopsis to ∼92.5% in beet (Beta vulgaris), whereas that of mCHG ranges from ∼9.3% in saltwater cress (Eutrema salsugineum) to ∼81.2% in beet (Niederhuth et al., 2016). Contrastingly, however, orchardgrass mCHH methylation (∼2.12%) is relatively low compared with that in other species, which ranges from ∼1.1% in grapevine (Vitis vinifera) to ∼18.8% in beet (Niederhuth et al., 2016). Previous studies have also revealed a positive association between the levels of DNA methylation and genome size (Ausin et al., 2016; Niederhuth et al., 2016; Xu et al., 2018). Consistent with its relatively large genome size (∼1.8 Gb of which 69% comprises TEs), we detected higher levels of methylation in orchardgrass compared with those in other species (Huang et al., 2020). Previously, it has been suggested that hypermethylation occurs in TE-rich centromeres and pericentromeric heterochromatin regions and that levels of methylation are reduced in gene-rich regions (Lister et al., 2008; Zhong et al., 2013; Seymour et al., 2014; Niederhuth et al., 2016; Xu et al., 2018). Consistently, we found that whereas the levels of mCG and mCHH were negatively associated with gene number, they were positively associated with TE density (Figure 1D). Contrastingly, however, the levels of CHH methylation were positively associated with gene number and negatively associated with TE density (Figure 1D). Accordingly, it is believed that the primary functions of TE hypermethylation are the maintenance of chromosome structure and genomic stability (Saze and Kakutani, 2011; Xu et al., 2018).
Comprehensive evaluation of the relationships between the methylome and transcriptome that contribute to orchardgrass vernalization
DNA methylation not only maintains genome stability but also contributes to the regulation gene expression (Chan et al., 2005). In rice (Oryza sativa), for example, it has been established that promoter methylation represses gene expression, whereas gene expression is found to be positively associated with methylation in gene body regions (Li et al., 2012). Similar regulatory patterns have also been observed in apple (Malus × domestica) and cotton (Gossypium hirsutum; Xu et al., 2018; Zhang et al., 2020). In contrast, however, the findings of a study in Arabidopsis have indicated that DNA methylation contributes little to gene expression (Meng et al., 2016). Conversely, in the present study, we found that methylation at promoter region CHH sites appears to be positively associated with gene transcription, where gene body methylation is negatively associated with transcription (Figure 4B). Although genome-scale methylome analyses enabled us to gain insights into DNA methylation-regulated gene expression, we found that most of the DEGs we identified were not directly associated with changes of DNA methylation (Figure 5, A and B). These findings thus tend to indicate that only a fraction of the observed differential gene expression is attributable to methylation-related changes, with the expression of genes in some regions being unaffected by methylation. Thus, a majority of the changes in expression could be a consequence of other methylation-independent regulatory processes (Xu et al., 2018). Nevertheless, it has been demonstrated that DNA methylation can influence the expression of specific genes and epialleles, which is manifested in visible phenotypes and trait heritability, as in the case of genes such as FLOWERING WAGENINGEN (FWA; Soppe et al., 2000), AP1 (Yang et al., 2015), and COLORLESS NONRIPENING (CNR; Manning et al., 2006).
The flowering of plants is a result of plant–environment interactions, and in this regard, it has been established that epigenetic processes are characterized by more variable responses to environmental stimuli than are genetic diversities, and thus show greater adaptability to changing environments (Xu et al., 2018). Moreover, these epigenetic changes can be inherited (Verhoeven et al., 2010; Mirouze and Paszkowski, 2011; Vanyushin and Ashapkin, 2011; Bräutigam et al., 2013; Sahu et al., 2013). In the current study, we found that a number of DMRs were induced by vernalization, some of which were associated with gene expression (Figure 5, A and B). Similarly, widespread dynamic changes in methylation status have been reported for other plant developmental processes, including fruit ripening (Cheng et al., 2018; Huang et al., 2019; Xiao et al., 2020; Zhu et al., 2020), as well as in responses to different biotic and abiotic stresses, such as pathogen infection (Dowen et al., 2012; Geng et al., 2019), heat (Ma et al., 2018; Zhang et al., 2020), cold (Tong et al., 2021) and drought (Xu et al., 2018). Nevertheless, we speculate that changes in the expression of numerous genes could be mediated by regulatory mechanisms other than methylation, including those involving histone modification (Trejo‐Arellano et al., 2017; Takahashi et al., 2018), lncRNAs (Böhmdorfer et al., 2014; Tan et al., 2018), miRNAs (Hu et al., 2021), as well as hormone signaling (Zhang et al., 2016; Xu et al., 2018). Consistent with this supposition, the findings of a more recent study on tomato (Solanum lycopersicum) fruit development have indicated that only a minor fraction of the detected DEGs were associated with changes in DNA methylation, whereas the differential expression of the overwhelming majority of genes appeared to be associated with changes in histone mark distribution (Hu et al., 2021). Additionally, the accumulation of hormones has been observed to influence the transcription of numerous downstream genes, and hormone signaling has been established to mediate the defense response to abiotic stress (Dowen et al., 2012). Indeed, in the present study, we found that hormone signaling pathways were enriched with multiple DMGs, thereby implying a similar mechanism.
Potential epigenetic regulation of orchardgrass floral induction in response to vernalization
It is generally believed that in monocots, the VRN1 gene is the primary target of epigenetic regulation during vernalization (Oliver et al., 2009), as in Brachypodium distachyon, in which VRN1 and VRN3 have been identified as the main targets of histone modification during vernalization (Huan et al., 2018). To gain further insight into the effects of DNA methylation on vernalization pathway genes, we analyzed the levels of promoter methylation and expression of vernalization pathway genes. Compared with the V0 stage of vernalization, we detected the elevated expression of VIN3, SWN, VRN1, VRT2, and AGL20 at V4 and established that the levels of methylation were highest in the promoter regions of these genes (Figure 5C). Moreover, the expression levels of these genes during vernalization-induced floral development were found to be positively associated with the levels of promoter region methylation. Substantially, the expression of AGL20 showed a strong positive association with the level of promoter region methylation (Figure 5C). These findings would thus tend to indicate that hypermethylation of vernalization pathway genes contributes to the promotion of vernalization-induced floral development during the early stages of vernalization. This role of DNA hypermethylation in the orchardgrass vernalization pathway regulation is similarly supported by data obtained for the responses to MTFMS and Zeb treatments and transgene expression (Figure 6–8).
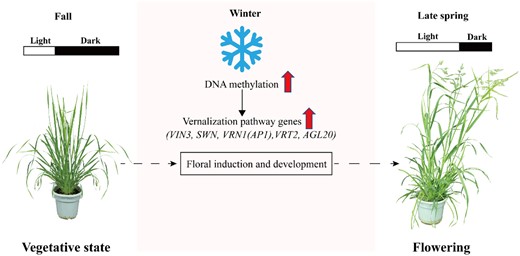
A proposed model of the interactions between DNA methylation and vernalization pathway genes during vernalization-induced floral development. The short days and low temperature of fall and winter induce increased DNA methylation, which upregulates genes involved in the vernalization pathway, including VIN3, SWN, VRN1(AP1), VRT2, and AGL20. This methylation increase also promoted the floral primordium initiation and development in orchardgrass. The longer days and warmer temperatures of spring further promoted the floral development and flowering of orchardgrass. The plant images were digitally extracted from the original images, which were taken with a camera.
In conclusion, we obtained a global view of the changes in DNA methylation during orchardgrass vernalization. We established that the altered expression of vernalization pathway genes is associated with DNA hypermethylation during vernalization. These findings provide an innovative strategy for understanding the complex molecular mechanisms underlying crop vernalization, which warrant further investigation.
Materials and methods
Plant materials and growth conditions
The diploid orchardgrass (D. glomerata) line “2006-1” was propagated by tiller-splitting and planted in growth house at 24/22°C (day/night) under short-day (10 h light/14 h dark) conditions with an illumination intensity of 6,000 lx for 2 years, which was suitable to reset vernalization status. Subsequently, a clonal line of 2006-1 was vegetatively propagated in plastic pots (25 cm in diameter × 40 cm tall) filled with commercial nutrient-rich soil (Pindstrup, Denmark). The plants were grown in a growth chamber at 22°C under short-day (10 h light/14 h dark) conditions with an illumination intensity of 6,000 lx for 30 d, which promoted tiller generation, and were fertilized weekly with 0.5g l−1 of a water-soluble fertilizer (N:P:K, 20:20:20; Peters Professional, ICL Specialty Fertilizers). On the basis of previously reported observations (Gardner and Loomis, 1953) and preliminary of the vernalization response of orchardgrass, we subjected plants to 8 weeks of cold treatment (4°C) under short-day (10 h light/14 h dark) illumination as a vernalization treatment. Having received 8 weeks of cold treatment, plants had reached the stable stage of vernalization, which could not be reversed by exposure to high temperature (Supplemental Figure S10). It has been established that young leaves are among the vernalization loci (Wellensiek, 1961) and that these leaves can produce floral signals (Zeevaart, 2008). To examine in detail the effects of vernalization in orchardgrass, we collected young leaves at 2-week intervals, denoted V0 (non-vernalization), V2, V4, V6, and V8 (orchardgrass plants were grown after exposed to cold treatment for 2, 4, 6, and 8 weeks, respectively). To eliminate the effects of circadian rhythms, the sampling of all tissues was conducted at same time of day. The collected samples were frozen in liquid nitrogen, and stored in freezer at −80°C until used for DNA and RNA extraction.
Global DNA methylation measurement
Genomic DNA was extracted from the V0, V2, V4, V6, and V8 tissue samples, with the concentration and integrity of the extracted DNA being determined using a NanoPhotometer® spectrophotometer (IMPLEN, CA, USA) and agarose gel electrophoresis, respectively. Global DNA methylation levels were measured using a MethylFlashTM Global DNA Methylation (5-methylcytosine, 5-mC) ELISA Easy Kit (Epigentek, Brooklyn, NY, USA) in accordance with the manufacturer’s protocol. We thereby established that global DNA methylation increased from V0 to V4, after which there was a reduction to V8 (Supplemental Figure S11). On the basis of these observations, we used samples collected at V0, V4, and V8 for whole-genome bisulfite sequencing (WGBS) and RNA-seq analyses. For WGBS, we used two biological replicates of six plants/replicate for each of the assessed vernalization stages, whereas in the case of RNA-seq, we used three biological replicates of four plants/replicate for each stage.
Whole-genome bisulfite sequencing
Genomic DNA was extracted from orchardgrass leaves collected at V0, V4, and V8 using the cetyltrimethyl ammonium bromide (CTAB) method. Using the DNA thus obtained, we prepared bisulfite sequencing libraries. Briefly, 1 µg aliquots of genomic DNA were fragmented into 100∼300 bp segments by sonication (Covaris, Massachusetts, USA) and purified using a MiniElute PCR Purification Kit (QIAGEN, MD, USA). The fragmented DNAs were end paired, poly-A tagged, and adapter ligated. The adapter-ligated fragments were modified using an EZ DNA Methylation-Gold Kit (Zymo Research, USA) following the manufacturer’s instructions, and the DNA fragments thus obtained were commercially PCR amplified and sequenced by Gene Denovo Biotechnology Co. (Guangzhou, China) using the Illumina NovaSeq6000 platform.
Whole-genome bisulfite sequencing data analysis
Paired-end sequencing reads of containing adapter, low-quality (q ≤ 20), and poly-N read were removed, and the resulting clean reads of each sample were mapped to the orchardgrass reference genome (Huang et al., 2020) using BSMAP software (v2.90) with default setting (Xi and Li, 2009). Then a custom Perl script was used to call methylated cytosines (mC) and the methylated cytosines were tested with the correction algorithm described in Lister et al. (2009). The methylation levels of each sequence context (CG, CHG, and CHH) were calculated based on the mC percentage in the whole genome and different regions of genome. In addition, the average methylation levels of CG, CHG, and CHH on gene/transposable elements (TEs) sequences and their flanking 2-kb regions were analyzed in 100-bp windows.
To identify differentially methylation regions (DMRs) between two samples, only cytosines with a depth of at least four in all libraries were considered. A sliding window approach with window size 200 bp and step size 50 bp was used to identify DMRs in methylkit tool (v1.10.0; Akalin et al., 2012). Pearson’s chi-square test was performed for mC vs. non-mC within each window. FDRs were estimated using a Benjamini–Hochberg adjusted P-value. Windows with FDR ≤0.05 were selected for further analysis. Final DMRs were filtered with combined criteria: number of differentially methylated cytosines (DMCs) in each window was≥ 5, 5, and 15 for CG, CHG, and CHH, respectively, and absolute methylation level differences of ≥ 0.25, 0.25, and 0.15 for CG, CHG, and CHH, respectively. DMR-associated genes (DMGs) were defined as genes with the closest DMR located within 2 kb upstream of the transcription start sites (TSS) and 2 kb downstream of the TTS.
RNA extraction and RNA-seq analysis
Total RNA was isolated from the leaves of orchardgrass using a Trizol reagent kit (Invitrogen, Carlsbad, CA, USA) following the manufacturer’s protocol. Messenger RNA-seq libraries were constructed and sequenced at Gene Denovo Biotechnology Co. (Guangzhou, China) using an Illumina HiSeq4000 sequencer. To obtain high-quality clean data, we used fastp (v0.18.0; Chen et al., 2018) to remove reads containing adapters, poly-N reads, and low-quality bases (q ≤ 20), and mapped the clean reads to the orchardgrass reference genome using HISAT2 (v2.2.4) with “-rna-strandness RF” and other parameters set as a default (Kim et al., 2015). StringTie (v1.3.4) was used to assemble the mapped reads and to calculate gene expression levels in terms of fragments per kilobase per million (FPKM; Pertea et al., 2015; Pertea et al., 2016). The DEGs between two samples were identified by DESeq2 (Love et al., 2014) using the following criteria: the absolute fold change was ≥ 2 and FDR<0.05.
Validation of methylation
Clonal lines of orchardgrass plants were planted in a growth chamber under short-day photoperiod (10 h/14 h, day/night) at 4°C for vernalization treatment. In this treatment, we assessed the effect of the application of 500 uM MTFMS (TCI, T2029), a methylation accelerator, and the inhibitor zebularine (Zeb; Selleck, S71130), which were solubilized in ddH2O containing 0.05% (v/v) Silwet L-77 (Solarbio, S9430) and sprayed directly onto the leaves of orchardgrass plants. As a control (mock) we sprayed plants with ddH2O. In all treatments, plants were sprayed at 2-d intervals until the completion of vernalization treatment, with at least 10 plants being used in each treatment.
Overexpression of DgPAPS4
The full-length of the DgPAPS4 gene was inserted into a pCambia1300 vector containing the CaMV35S promoter. To generate DgPAPS4-overexpressing transgenic plants, we transformed Arabidopsis (Arabidopsis thaliana) plants using the EHA105 strain of Agrobacterium tumefaciens containing the pCambia1300-35S-DgPAPS4 construct, based on floral dip method (Clough and Bent, 1998). T3 generation homozygous lines were used for further functional verification of the inserted gene. For vernalization treatment of the transformed Arabidopsis, seeds were germinated on half-strength Murashige and Skoog plates and the germinated seedlings were transferred from flats to soil and grown until the first pair of rosette leaves emerged. Subsequently, the plants were pre-grown for 10 d under long-day conditions (16 h light/8 h dark, 22°C), and then transferred to 4°C under short-day conditions (8 h light/16 h dark) for 4 weeks, followed by return to long-day conditions. Flowering time was determined as the number of days to flowering following the cold treatment, from moving plants to 22°C to bolting, excluding the pre-growth phase and the 4 weeks of cold exposure.
Reverse transcription-quantitative PCR (RT-qPCR)
RT-qPCR analyses were performed using the abm® EvaGreen 2X qPCR Master Mix (ABM Inc., Canada) in accordance with the manufacturer’s protocol, with reactions being run using a CXF ConnectTM Real-Time System (Bio-Rad). The GLYCERALDEHYDE 3-PHOSPHATEDEHYDROGENASE (GAPDH) and TUBULIN BETA CHAIN 2 (TUB2) genes were selected as internal reference genes for orchardgrass and Arabidopsis, respectively, and relative expression was calculated using the 2−ΔΔCt method (Schmittgen and Livak, 2008). The primers used for RT-qPCR amplification are listed in Supplemental Tables S4.
McrBC-qPCR analysis
McrBC-qPCR was performed to examine the levels of DNA methylation in the promoter region (the 2-kb sequence upstream of the gene transcription start sites) of the AtAGL20 gene. Genomic DNA (500 ng) was digested for 4 h using an McrBC kit (NEB Beijing, China) in accordance with the manufacturer’s protocol. As a negative control, we performed digestion in the absence of GTP. qPCR was performed using 20 ng DNA as template and the primers listed in Supplemental Table S4. GC content was calculated using the MethPrimer software (Li and Dahiya, 2002).
Identification and phylogenetic analysis of orchardgrass DNA methylation-related genes
Protein sequences of the Arabidopsis DNA methylation-related genes were collected from the TAIR 11 (https://www.arabidopsis.org), and then used as queries to search the orchardgrass genome using BLASTP to identify putative DNA methylation-related genes of orchardgrass. The protein sequences were aligned by ClustalW, and a neighbor-joining phylogenetic tree was constructed using the MEGA7 software with the Poisson model, pairwise gaps deletion, and 1,000 bootstrap replicates.
Statistical analyses
Significant differences between two groups of samples were determined using Wilcoxon test in R software. Significant differences among multiple groups of samples were performed using one-way ANOVA with Duncan’s multiple range test in IBM SPSS 20.0 software.
Accession numbers
Sequence data of orchardgrass from this article can be found in the orchardgrass genome data base (https://orchardgrassgenome.sicau.edu.cn) under accession numbers: CLF (DG3C07248), FIE (DG7C02547), MSI (DG4C04908), VIN3 (DG2C02084), VIL1 (DG4C01432), SWN (DG2C04754), VRN1 (AP1) (DG1C03618), VRT2 (DG2C00869), VRN2 (DG6C02763), FT(VRN3) (DG3C07343), AGL20 (DG3C00078), GAPDH (DG3C01167), DgPAPS4 (DG7C03781). Sequence data of Arabidopsis from this article can be found in the Arabidopsis Information Resource (TAIR, https://www.arabidopsis.org) under accession numbers: AtAGL20 (AT2G45660), TUB2 (AT5G62690).
Data availability
The methylome and transcriptome data have been deposited in the Genome Sequence Archive (GSA, https://ngdc.cncb.ac.cn/gsa) in National Genomics Data Center, China National Center for Bioinformation/Beijing Institute of Genomics, Chinese Academy of Sciences, under accession no. CRA005623 and CRA005615.
Supplemental data
The following materials are available in the online version of this article.
Supplemental Figure S1. Correlation analysis of the replicates of each sample using methylKit software.
Supplemental Figure S2. Circos plots showing the distribution of methylated cytosines (mCs) in the mCG, mCHG, and mCHH contexts on all 7 chromosomes.
Supplemental Figure S3. DNA methylation dynamics during orchardgrass vernalization.
Supplemental Figure S4. The numbers of overlapped mCG-, mCHG-, and mCHH-DMRs in V0_VS_V4 and V4_VS_V8.
Supplemental Figure S5. The genomic distribution of mCG-, mCHG-, and mCHH-DMRs.
Supplemental Figure S6. The numbers of overlapped hyper- and hypo-methylated genes in V0_VS_V4 and V4_VS_V8.
Supplemental Figure S7. Gene Ontology (GO) enrichment analysis of methylated genes.
Supplemental Figure S8. KEGG enrichment analysis of methylated genes.
Supplemental Figure S9. Expression of genes involved in the RdDM pathway during vernalization.
Supplemental Figure S10. The effect of vernalization on the flowering of orchardgrass plants.
Supplemental Figure S11. Effect of vernalization on global DNA methylation in orchardgrass.
Supplemental Table S1. Summary of WGBS data in orchardgrass.
Supplemental Table S2. Summary of RNA-seq data in orchardgrass.
Supplemental Table S3. Identification of methylated cytosines in each of the six samples.
Supplemental Table S4. Primers used in this study.
X.Z., L.H., and Z.Y. conceived the study and designed the experiments; Z.Y., G.N., G.F., X.X., and D.L. performed the experiments; Z.Y., H.Y., and L.H. performed the bioinformatic analysis; Z.Y., H.Y., L.H., and X.Z. analyzed the data; Z.Y., H.Y., J.W., G.N., L.H., and X.Z. wrote and revised the manuscript.
The authors responsible for distribution of materials integral to the findings presented in this article in accordance with the policy described in the Instructions for Authors (https://dbpia.nl.go.kr/plphys/pages/general-instructions) are: Xinquan Zhang ([email protected]) and Linkai Huang ([email protected]).
Acknowledgments
We thank Prof. Long Jin (Sichuan Agricultural University) for valuable discussions and support.
Funding
This work was supported by the National Natural Science Foundation of China (31872997), the National Project on Sci-Tec Foundation Resources Survey (2017FY100602), and the China Agriculture Research System of MOF and MARA.
Conflict of interest statement. The authors declare that they have no conflicts of interest.
References
Author notes
These authors contributed equally (Z.Y. and H.Y.)
Senior author
