


Abstract
Vascular tissues are surrounded by an apoplastic barrier formed by endodermis that is vital for selective absorption of water and nutrients. Lignification and suberization of endodermal cell walls are fundamental processes in establishing the apoplastic barrier. Endodermal suberization in Arabidopsis (Arabidopsis thaliana) roots is presumed to be the integration of developmental regulation and stress responses. In root endodermis, the suberization level is enhanced when the Casparian strip, the lignified structure, is defective. However, it is not entirely clear how lignification and suberization interplay and how they interact with stress signaling. Here, in Arabidopsis, we constructed a hierarchical network mediated by SHORT-ROOT (SHR), a master regulator of endodermal development, and identified 13 key MYB transcription factors (TFs) that form multiple sub-networks. Combined with functional analyses, we further uncovered MYB TFs that mediate feedback or feed-forward loops, thus balancing lignification and suberization in Arabidopsis roots. In addition, sub-networks comprising nine MYB TFs were identified that interact with abscisic acid signaling to integrate stress response and root development. Our data provide insights into the mechanisms that enhance plant adaptation to changing environments.
Introduction
Water and nutrients in soil need to be transported radially from the periphery of the root to the central vascular system, to be delivered to other plant tissues. The endodermis is the cell layer that surrounds the central vascular tissues in plant roots, establishing the apoplastic diffusion barrier between the apoplastic transport in cortical tissues and the vascular tissues (Enstone et al., 2002; Alassimone et al., 2010; Andersen et al., 2015). To achieve the apoplastic barrier, endodermis forms the Casparian strip (CS), the lignin-based hydrophobic band encircling the cell wall (Naseer et al., 2012). It was reported that CS membrane domain proteins (CASPs) serve as the membrane platform to recruit enzymes, including Respiratory Burst Oxidase Homolog F (RBOHF), Peroxidase 64 (PER64), and Enhanced Suberin1 (ESB1), for localized lignin polymerization in endodermis (Hosmani et al., 2013; Lee et al., 2013).
After the CS formation, the endodermal cell wall is further covered by suberin lamellae to form secondary cell wall (Baxter et al., 2009). The biosynthesis of suberin is composed of a series of interacting enzymatic steps, mainly involving the synthesis of fatty alcohols and acids, as well as the phenylpropanoid pathway (Agrawal and Kolattukudy, 1977; Andersen et al., 2015). It was experimentally shown that endodermal suberin lamellae act as the trans-cellular diffusion barrier (Ranathunge et al., 2011; Geldner, 2013; Robbins et al., 2014). Recently, several TFs were identified that positively regulate suberin formation in various tissues and species (Lashbrooke et al., 2016; Legay et al., 2016; Gou et al., 2017; Capote et al., 2018; To et al., 2020). The overexpression of MYB41, MYB53, MYB92, MYB93, and MYB39, the TFs that are expressed in root endodermis, led to ectopic formation of suberin in Arabidopsis (Arabidopsis thaliana; Kosma et al., 2014; Cohen et al., 2020; Wang et al., 2020; Shukla et al., 2021). It was recently reported that the quadruple mutants of four MYB TFs (MYB41, MYB53, MYB92, and MYB93) dramatically abolished stress-induced root suberization in Arabidopsis (Shukla et al., 2021).
Endodermal development is initiated in root meristem, which is regulated by TFs SHORT-ROOT (SHR) and SCARECROW (SCR; Helariutta et al., 2000; Nakajima et al., 2001; Gallagher et al., 2004). After being specified, root endodermis experiences successive differentiation events including CS formation, which is regulated by TF MYB36 (Kamiya et al., 2015; Liberman et al., 2015). Mis-expression of either SHR or MYB36 in nonendodermal cells led to ectopic deposition of lignin and suberin (Drapek et al., 2018; Wang et al., 2020). SHR appears to mediate a hierarchical cascade during CS formation, in which MYB36 activates essential genes including CASPs, PER64, and ESB1 for lignin polymerization (Li et al., 2018). Interestingly, both esb1 and myb36 mutants exhibit enhanced root suberization as the consequence of defective CS barrier, suggesting the existence of complementary mechanism balancing root suberization and lignification (Hosmani et al., 2013; Kamiya et al., 2015).
In addition, root suberization responds to abiotic stresses and interacts with plant stress hormones (Barberon et al., 2016). However, it remains largely unclear how the interactions between stresses and suberization, as well as between lignification and suberization, are coordinated during root development. Here, we constructed an SHR-mediated hierarchical regulatory network in Arabidopsis that coordinates lignification and suberization in root endodermis. We found that 13 downstream MYB TFs form a number of sub-networks with feedback or feed-forward loops. In addition, sub-networks comprising 9 MYB TFs interact with abscisic acid (ABA) signaling to integrate environmental stresses into the developmental regulation of root suberization. Our results provide insights into the mechanisms that coordinate root development and stress adaption.
Results
Suberization and lignification in root endodermis are regulated by MYB TFs
To elucidate the gene co-expression network (GCN) involved in suberization and lignification, we extracted RNA-seq data sets of 6-d-old Arabidopsis roots of wild-type (WT) and selected genotypes with altered root suberization and CS formation (Pfister et al., 2014; Li et al., 2018; Wang et al., 2020). The differentially expressed genes from these datasets were combined to construct the gene expression matrix (GEM). We then constructed 8 separate co-expression sub-networks (I–VIII) by feeding GEM into weighted GCN analysis (WGCNA). TFs account for 10% of the total number of network nodes, which represent the potential regulators of the co-expressed genes in their corresponding networks. Furthermore, eigengenes of the obtained sub-networks (a proxy for the average gene expression profile in each network) were used to identify significant correlations between the traits and sub-networks. Interestingly, the genes that are positively correlated with suberin and CS formation (R ≥ 0.7) are grouped into two sub-networks (II and III) and the correlation between the two networks is >0.6 (Supplemental Figure S1, A and B).
Based on the previously published high-resolution single-cell transcriptome data (Brady et al., 2007; Chen et al., 2021a, 2021b), we identified 104 and 325 genes in two sub-networks, respectively, that are preferentially expressed in the endodermis of root mature zone (Figure 1A;Supplemental Table S1). In sub-network II, ∼80% of genes were induced by pG1090-XVE::SHR (referred to as iSHR) (Supplemental Figure S2), whereas ∼98% of genes were induced by pG1090-XVE::MYB36 (referred to as iMYB36) in sub-network III (Supplemental Figure S3). Further, gene classification analyses highlighted key biological processes including 28 suberin and lignin biosynthesis (fold enrichment = 10.48, expected value = 1.9, P < 0.01) and CS formation genes (fold enrichment = 16.19, expected value = 0.56, P < 0.01), which are interconnected with a range of other biological processes (Figure 1A).
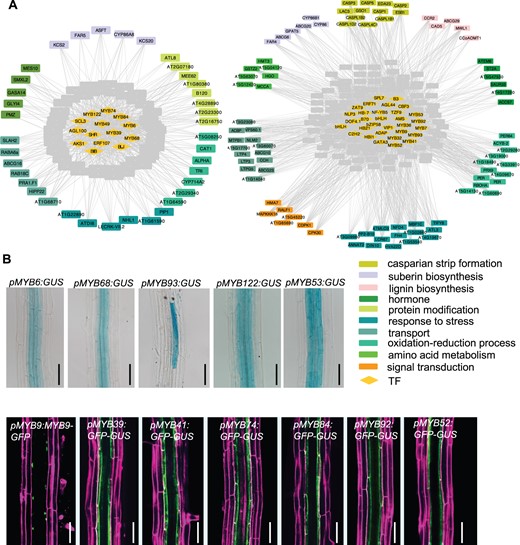
Gene co-expression sub-networks and hub TFs identified via GCN analysis. A, The correlation networks of sub-network II (left) and sub-network III (right) are positively associated with suberization and CS formation. Eight co-expression sub-networks (I–VIII) are identified by WGCNA analysis using filtered expression matrix from seven genotypes with defective suberin lamellae or CS (WT, iSHR, iMYB36, sgn3, myb36-5, shr-2, and scr-4). Among eight networks (in Supplemental Figure S1), two sub-networks (II and III) show the most significant positive correlation with suberization and CS formation (P < 0.01, t test). In the presented plots, two sub-networks are filtered by the single-cell transcriptome, and only the genes preferentially expressed in the endodermis of root mature zone are shown. Note SHR is included in the sub-network II. Diamonds, TFs; rectangles, non-TF genes; genes including suberin and lignin biosynthesis and CS formation are indicated by colored rectangles. A gray line represents a co-expression relationship between a TF and another gene. B, The spatial expression pattern of 12 MYB hub TFs from two co-expression sub-networks in Arabidopsis roots. DIC images of the transcriptional GUS reporter in 6-d-old roots are shown for MYB6, MYB68, MYB93, MYB122, and MYB53. For other MYB TFs, the confocal images of GFP and PI in 6-d-old roots are shown in the second row. Pictures taken in mature parts of the root are shown. Bar = 50 μm.
Co-expression genes are likely regulated by common regulatory factors. In the two sub-networks, we identified 41 hub TFs according to the number of edges and fold changes (FCs) of expression level in iSHR and iMYB36 upon induction (|FC| > 2) (Supplemental Table S2). Among the 41 TFs, 15 are members of R2R3 factor gene family. Interestingly, a set of MYBs have previously been shown to regulate endodermal differentiation in Arabidopsis roots (Kosma et al., 2014; Wang et al., 2020; Shukla et al., 2021). To functionally verify these MYBs, we first examined their spatial expression patterns by constructing promoter reporters with β-glucuronidase (GUS) and green fluorescent protein (GFP). Twelve MYB TFs exhibited preferential expression in root endodermis (Figure 1B).
Functional validation of MYBs in root suberization and lignification
Next, we over-expressed the candidate hub TFs in Arabidopsis using an inducible expression system. After 2 d estradiol induction, we found that the overexpression of many MYB genes including MYB39, MYB68, MYB74, MYB84, MYB92, MYB93, and MYB9 dramatically enhanced root suberization to varied extents and caused expanded suberization to nonendodermis as well as to elongation zone (Figure 2, A and C). In contrast, the over-expression of either MYB6 or MYB122 displayed only a slight delay and reduction of endodermal suberization (Figure 2, A and C).
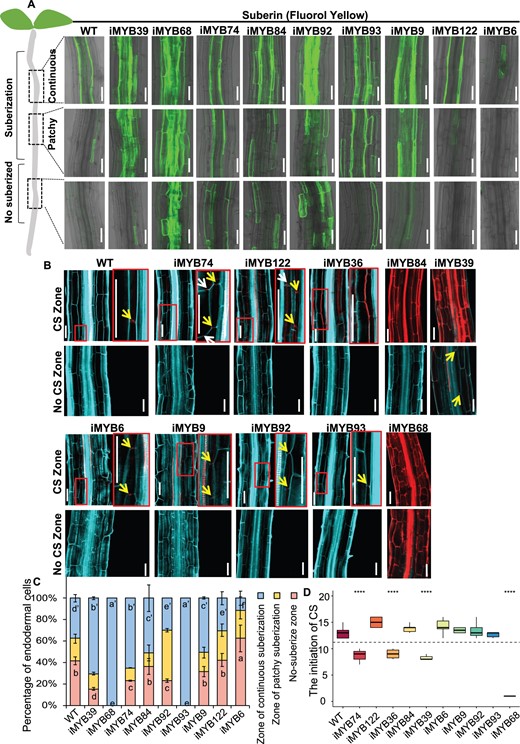
Hub MYBs regulate suberization and lignification in Arabidopsis roots. A, The appearance of suberization in plants roots over-expressing hub MYBs shown by fluorol yellow staining. Suberization in different parts of the root is shown. Green fluorescence represents the location of suberization. Cells can be placed into three different groups based on suberization status: nonsuberized, patchy-suberization and continuous-suberization. Shown here are inducible lines that alter the formation of suberin. For the over-expression roots, seeds were germinated for 4 d on 1/2 MS medium followed by 10 μM estradiol treatment for 2 d, i, inducible. Bar = 50 μm. B, The appearance of lignification in plants roots over-expressing hub MYBs as visualized by Calcofluor White (Turquoise, cell wall) and Basic Fuchsin (Red, lignin) staining after the clearing. The inducible lines of 6 MYBs had induced lignin deposition in multiple cell layers. i, inducible; CS, Caparian strip. The yellow arrows point to position of CS formation in endodermis, and the white arrows point to the position of CS formation in cortex. Note zoomed images of the boxed zones. Bar = 50 μm. C, Suberization is quantified along the root axis in WT and hub MYBs over-expression lines. Suberization is divided into three types: nonsuberized, patchy-suberization and continuous-suberization; n ≥ 8 roots. In each root, the endodermal cells from the onset of rapid elongation are counted. Data are presented as the percentage of endodermal cells. Different letters indicate significant differences between genotypes (P < 0.05 by Tukey’s test). Error bars represent standard error (SD). D, The boxplot of the initiation position of CS along the root axis in WT and hub MYBs over-expression lines. The cortex cells from the onset of rapid elongation are counted in 6-d-old roots. Mutants marked in red color indicate they have significantly altered CS initiation. Statistical significance (n = 8–10) determined using the Student’s t test. On each box plot, the central mark indicates the median, the bottom and top edges of the box indicate the interquartile range (IQR) and the top and bottom of lines represent the maximum and minimum data points. Error bars represent SD; ****P < 0.0001; **P < 0.01.
In addition to suberization, inducible over-expression of MYB68 led to a substantial expansion of lignification to nonendodermal cell layers (Figure 2, B and D). The over-expression of MYB74, MYB36, MYB39, MYB84, and iMYB122 could induce the significant expansion of lignification to cortex or epidermis (Figure 2, B and D). In contrast, MYB6/9/92 had no noticeable effect on lignification, whereas the over-expression of MYB93 slightly inhibited CS formation (Figure 2, B and D). Additionally, some MYBs in this network including MYB41, MYB53, and MYB52 have previously been found to regulate suberization and secondary cell wall in Arabidopsis roots (Taylor-Teeples et al., 2015; Shukla et al., 2021).
Based on the functional analyses, we constructed a transcriptional regulatory network (TRN) comprising a subset of 12 endodermis regulatory TFs and SHR/MYB36. To obtain the in vivo relationship within the TRN, we selected a total of 14 lines with either inducible overexpression of the TFs or loss-of-function mutants and collected their roots for reverse transcription-quantitative PCR (RT-qPCR) or RNA-seq analysis (|FC| > 2, P < 0.01, Supplemental Table S3). With the data, we generated a reduced version of the network to highlight the relationships with putative direct interaction (Figure 3A).
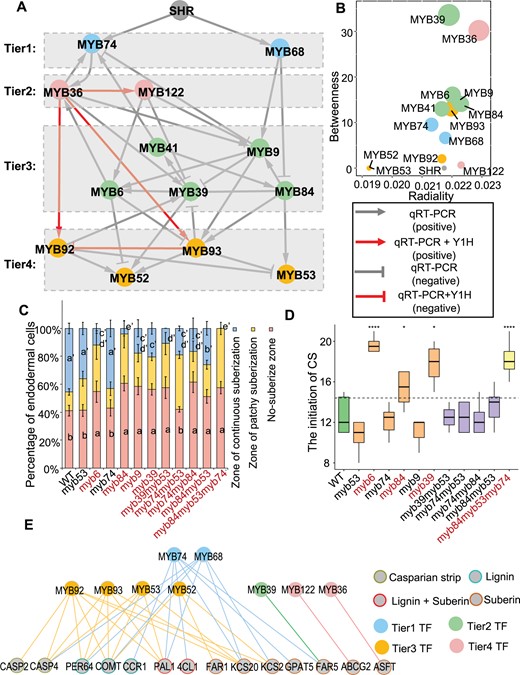
Transcriptional cascade mediated by MYBs. A, The hierarchical regulatory network is constructed based on RT-qPCR and RNA-seq data of the inducible expression lines or mutants of 13 hub MYB TFs and SHR. The gray lines represent the regulatory relationship between two TFs. Positive and negative regulations are shown as arrow-headed lines and bar-headed lines, respectively. The downstream TFs are determined based on the expression change in the inducible lines or mutants (|FC| > 2 and P < 0.01). The gray edges indicate regulated edges; red edges indicate the direct regulation supported by Y1H. B, Scatterplot of radiality versus betweenness of nodes in the network presented in (A). C, Suberization is quantified along the root axis in WT and mutants. Suberization is divided into three types: nonsuberized, patchy-suberization and continuous-suberization; n ≥ 8 roots. In each root, the endodermal cells from the onset of rapid elongation are counted. Data are presented as the percentage of endodermal cells. Different letters indicate significant differences between genotypes (P < 0.05 by Tukey’s test). Error bars represent SD. D, The initiation position of CS along the root axis in WT and mutants. The cortex cells from the onset of rapid elongation are counted in 6-d-old roots. Mutants marked in red color indicate that those with significantly altered CS initiation. Statistical significance (n = 8–10) determined using the Student’s t test. On each box plot, the central mark indicates the median, the bottom and top edges of the box indicate the IQR and the top and bottom of lines represent the maximum and minimum data points. Error bars represent SD; ****P < 0.0001; *P < 0.05. E, MYBs-DNA interactions are validated Y1H. Nodes, TFs or promoters; edges, protein–DNA interactions. The gray nodes represent the promoter of genes involved in suberin and lignin biosynthesis, and CS formation; the other colors represent multi-tiered MYB TFs. The colored line indicates the interaction between the TF and the promoter.
MYBs form multi-hierarchical regulatory network with two key branches
To further characterize the relationships between endodermis-specific MYBs, we divided the network into four main tiers according to hierarchic layout algorithm, in which the nodes are placed in hierarchically arranged tiers (Figure 3A). We found SHR functions upstream of 13 MYBs as the master regulator. MYB74 and MYB68 function in the first tier within SHR mediated network, forming two main branches comprising three downstream tiers (Figure 3A). By calculating the betweenness and radiality of the nodes in this regulatory network, we found that MYB36 in the second tier, and MYB39, MYB9, MYB6, MYB41, and MYB84 in the third tier, maintain a high level of between centrality in the network (Figure 3B), suggesting that these TFs function as the important hubs.
We then performed network perturbation analysis to test whether the network could predict the defects of endodermal differentiation using mutants of MYBs in the TRN. Among the mutants, the appearance of continuous suberization in myb84, myb6, myb9, and myb39 was slightly delayed (Figure 3C;Supplemental Figure S4), and these mutants except for myb9 also showed slightly retarded CS formation (Figure 3D;Supplemental Figure S5). In addition, the loss-of-function of MYB41 had previously shown to have no effect on endodermal suberization (Shukla et al., 2021), and we found no defect in the formation of CS and suberin lamellae in myb53 mutant. We further generated high-order mutations of hub genes. The double mutants had weak phenotype of root suberization, but had no effect on lignification, suggesting that functional redundancy exists among different branches within the network (Figure 3, C and D; Supplemental Figures S4 and S5). However, in the quadruple mutants of myb41/53/92/93, suberin formation was found to be substantially reduced (Shukla et al., 2021), supporting that MYB53, MYB92, and MYB93 locate in the fourth tier of the hierarchical regulatory network. In this study, we observed significantly delayed suberization once we simultaneously mutagenized MYB74 from the first tier, MYB84 from the second tier, and MYB53 from the fourth tier. In the first 100 endodermal cells after the onset of rapid elongation, we saw no continuous suberization, and the CS formation also became considerably delayed (Figure 3, C and D; Supplemental Figure S4), suggesting the interference of hub regulators from multiple tiers impairs root lignification and suberization.
To investigate how TRN is associated with suberin and lignin biosynthesis, we performed a yeast one-hybrid (Y1H) assay, using the promoter of 20 downstream functional genes involved in suberin and lignin biosynthesis and CS formation as the bait (Supplemental Table S4; Supplemental Figures S6–S9). Our results indicated that MYBs from the top tier and lowest tier can bind to more promoters of genes involved in suberization and lignification (Figure 3E). In contrast, these MYBs locating at the key hubs, including MYB84, MYB6, MYB9, and MYB41, exhibited no direct interaction with the promoter of 20 downstream enzymes (Figure 3E), suggesting they presumably function in the network as the hub coordinator. Our results suggest that the top tier regulator MYB74 and MYB68 can not only transduce the regulation derived from SHR, but also directly bind to the promoter of downstream functional genes during the lignification and suberization of endodermis. To further validate this result, we also implemented the Luciferase (Luc) reporter system and verified the activation of five suberin genes by three TFs. Our results showed that MYB36, MYB74, and MYB92 could directly activate the expression of suberin genes, supporting that the direct interactions between TFs and the promoters of downstream genes could be functional (Supplemental Figure S10).
MYB74-MYB36-MYB92-MYB93 form a sub-network balancing suberization and CS formation
Next we examined the relationships between the MYBs in TRN using Y1H assay. Our analyses showed that only four edges within the regulatory network had direct interaction (Supplemental Figure S11, A and B), suggesting most regulatory relationships among MYBs are indirect. Among the relationships, MYB36 could directly bind to the promoter of MYB122, MYB92, and MYB93, and MYB93 was directly associated with MYB92 promoter. In line with this, the expression of MYB92 and MYB93 was markedly enhanced in iMYB36 roots, whereas the expression of MYB92 was significantly inhibited in MYB93 over-expression lines (Supplemental Figure S11C). Together, our results suggest MYB36 forms a feedback regulation with MYB92 and MYB93 from the fourth tier (Figure 3A), and MYB92 and MYB93 can directly bind to the promoters of many suberin and lignin genes (Figure 3E).
MYB36 also showed the highest centrality within the network, forming the indirect mutual regulation with upstream MYB74 (Figures 3A and 4I). To further elucidate the relationship between MYB36 and MYB74, we examined their expression in respective mutants. RT-qPCR showed that MYB74 expression was significantly reduced in myb36-5 mutant, whereas MYB36 expression was also decreased in myb74 mutant (Figure 4A), suggesting there presumably is reciprocal regulation between these two MYBs.
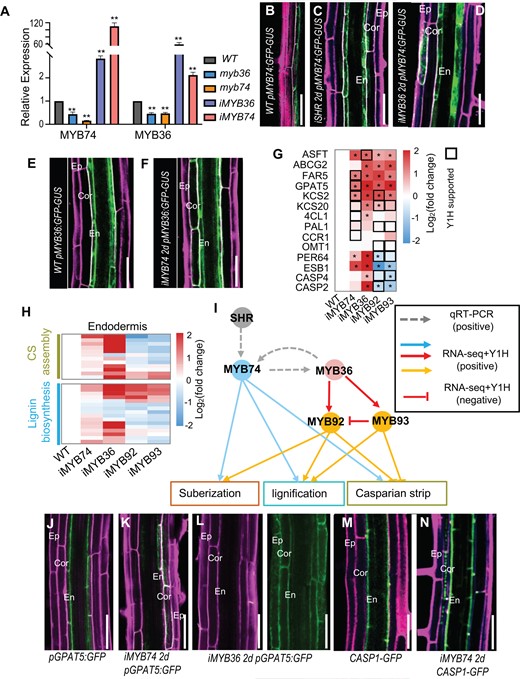
Sub-network comprising MYB74-MYB36-MYB92-MYB93 balances suberization and lignification. A, Relative expression measured by RT-qPCR. Bars show the mean ± SD of three biological replicates. Note that MYB36 and MYB74 show no reciprocal regulation. Asterisks indicate significant differences (**P < 0.01; Student’s t test). B–D, pMYB74:GFP-GUS in WT (A), iSHR (C) and iMYB36 (D) roots. E and F, pMYB36:GFP-GUS in WT (g) and iMYB74 (h) roots. G and H, FCs in the expression of suberin- and lignin-genes measured by RNA-seq. Asterisks indicate significant differences (P < 0.01; Student’s t test). The black box represents the direct interaction supported by Y1H. I, The sub-network centered on MYB36 comprises MYB74-MYB36-MYB92-MYB93. Red edges indicate the direct regulation supported by Y1H. Solid edges, Y1H; dashed edges, RT-qPCR. J–L, pGPAT5:GFP in WT (J), iMYB74 (K) and iMYB36 (L) roots. M and N, CASP1-GFP in WT and iMYB74 roots. En, endodermis; Cor, cortex; Ep, epidermis. Bar = 50 μm.
In iSHR roots, the induction of SHR triggered the ectopic expression of pMYB74:GFP-GUS in the ground tissues (Figure 4, B and C). Similarly, induction of iMYB36 promoted the expression of pMYB74:GFP-GUS in nonendodermal cells (Figure 4D). Interestingly, we found pMYB36:GFP-GUS expression was activated in cortex cells after the estradiol induction of pG1090-XVE::MYB74 (referred to as iMYB74) (Figure 4, E and F), suggesting there is a reciprocal regulation between MYB36 and MYB74. Together, our results support MYB74-MYB36-MY92-MYB93 forms an MYB36-centered sub-network.
To verify this MYB36 mediated sub-network regulates the biosynthesis of lignin and suberin, we performed combined analyses of transcriptome and Y1H. We found MYB74 directly bound to promoters of downstream suberin and lignin genes, whereas MYB36 indirectly activated these genes (Figure 4, G and H). Interestingly, whereas MYB92 and MYB93 positively regulated suberization, they displayed negative regulation of CS formation (Figure 4, G and H;Supplemental Table S5). In addition, this negative regulation seemed to be direct as both MYB92 and MYB93 could bind to the promoters of CS genes in Y1H (Figure 4, G and H). It was previously reported that MYB92 and MYB93 repress lateral root formation, and the endodermis-specific expression of MYB93 is temporally abolished during lateral root formation (Gibbs et al., 2014). This is in line with the observation that the apoplastic barrier in endodermis is disrupted and then re-formed during lateral root initiation (Ursache et al., 2021). Thus, MYB36-MYB92-MYB93 presumably form a feedback mechanism that balances lateral root formation and the establishment of apoplastic barrier in endodermis (Figure 4I).
We selected two representative downstream proteins to evaluate the regulation by MYB36-MYB74 during the suberization and lignification of Arabidopsis roots. We first examined GPAT5, an enzyme with acyl-CoA:glycerol-3-phosphate acyltransferase activity that plays a critical role in suberin biosynthesis in Arabidopsis roots (Beisson et al., 2007). In WT, GPAT5 was only expressed in endodermis. However, in iMYB36 or iMYB74, we observed the expanded expression of GPAT5 in cortical cell layers (Figure 4, J–L). In addition, both Y1H and LUC activation reporter system showed that MYB74 could directly bind to and significantly activate the promoter of GPAT5 (Figure 3E;Supplemental Figure S10).
Next, we examined CASP1, a scaffold protein responsible for localized lignin polymerization in CS (Roppolo et al., 2011). Previously, SHR was reported to promote CASP1 expression via MYB36 (Li et al., 2018). In this study, we found that the induced expression of iMYB74 caused the expansion of CS to cortex and drove the formation of discrete CASP1-GFP puncta in nonendodermal cell layer (Figures 2B and 4, M and N), a phenomenon that was also observed when SHR or MYB36 was induced (Li et al., 2018).
ABA triggers endodermal suberization via a set of MYB TFs
It was previously reported that stress-triggered ABA can induce endodermal suberization in Arabidopsis roots (Barberon et al., 2016; Wang et al., 2020; Salas-González et al., 2021; Shukla et al., 2021). We hypothesized that stress responses can be integrated into the regulatory network that determines endodermal differentiation.
ABA-induced root suberization seemed to be a rapid but transient response (Wang et al., 2020). After ABA treatment, genes involved in suberin biosynthesis were considerably activated (Figure 5B). We first examined which regulators within the MYB network respond to ABA treatment. To that end, we quantified the expression of all factors within the network by RT-qPCR after the ABA treatment for 0, 6, 12, and 24 h (Figure 5A). Our results showed that 9 out of 14 factors within the network were rapidly induced by 6-h ABA treatment. At this time point, branches mediated by MYB74 and MYB68 both responded, and the responding factors mainly locate in the third tier of the network, including MYB9, MYB41, MYB39, MYB6, and MYB84. Except for MYB93 and MYB39, other 7 ABA-responsive MYBs maintained the significant response (FC > 2, false discovery rate (FDR) < 0.01) during the ABA treatment timeframe (from 6 to 24 h).
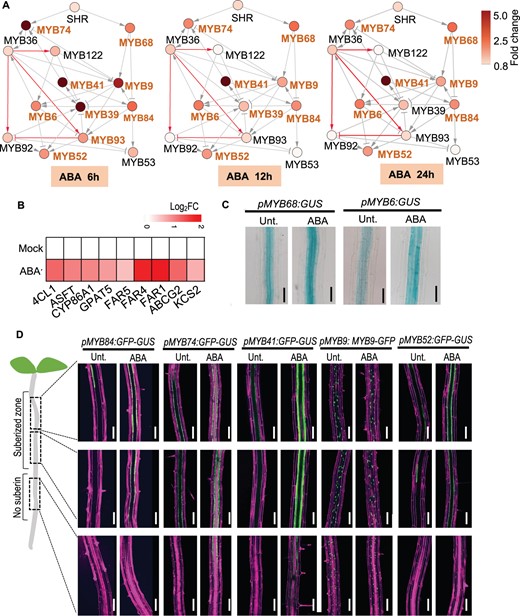
SHR-mediated regulatory network interplays with ABA. A, RT-qPCR showing the changes of MYB sub-networks with ABA treatments. WT seeds are germinated for 4 d on 1/2 MS medium followed by 2 μM ABA treatment for the indicated times before the analyses. Nodes with differential shades of color represent the FC of the expression. Bold orange font of MYBs indicate significant response to ABA treatment (|FC| > 2). The gray edges indicate regulated edges; red edges indicate the direct regulation supported by Y1H. The representation of the regulatory relationship is indicated in Figure 3 legend. B, Heat map showing the expression of suberin genes in WT after 2 μM ABA treatment. Each cell represents the log (FC) relative to the control. C and D, The expression of ABA-responsive MYBs after 12-h ABA treatment. Bar = 100 μm.
Next, we visualized the spatial expression pattern of the seven ABA-responsive MYBs along the primary root after the ABA treatment. Except for MYB9, 12-h ABA treatment was sufficient to induce the expanded or enhanced expression of the examined MYBs (Figure 5, C and D). These results confirm that a set of suberin-regulating MYBs rapidly respond to ABA induction, presumably mediating the interaction between root suberization and stress responses.
Two MYBs serve as checkpoint balancing endodermal differentiation and ABA signaling
It was previously uncovered that ABA and ethylene antagonistically affect endodermal suberization during the root response to abiotic stresses (Barberon et al., 2016). To explore how they interplay with the developmental network, we analyzed the transcriptome data of Arabidopsis roots treated with ABA, ABA inhibitor fluridone (Flu), ethylene precursor 1-aminocyclopropane-1-carboxylic acid (ACC), and ethylene inhibitor aviglycine (AVG). WGCNA analysis was performed to construct GCN using GEM. We obtained seven co-expression sub-networks and found each treatment had a highly and specifically correlated co-expression network (FDR < 0.01, Relevance > 0.7; Supplemental Figure S12). We focused on one candidate sub-network that is positively correlated with ABA treatment (Relevance = 1, FDR < 0.01). This network is composed of 1,339 genes, including MYBs and genes involved in ABA signaling, suberin biosynthesis, and lignin biosynthesis. To further explore the potential interaction between MYBs network and this ABA correlated sub-network, we mapped this network to the previously reported ABA interactome network (Lumba et al., 2014; Altmann et al., 2020). In this yeast two-hybrid (Y2H) based network, 260 direct interactions were identified among 196 proteins (Supplemental Figure S13; Supplemental Table S6).
In the ABA interacting network, we found MYB74 directly interacts with an A-type protein phosphatase 2C (PP2CA) Highly ABA-Induced (HAI1) and sucrose nonfermenting 1-related protein kinases (SnRKs) SnRK3.15. We then examined the potential interaction between ABA pathway and ABA-responsive MYBs by Y2H. Our results showed that only MYB74 could directly interact with SnRK3.15 (Figure 6A). We further verified this interaction by pull-down assays (Figure 6B). Different from the previous ABA interactome, our Y2H failed to detect the interaction between MYB74 and HAI1. We then examined the potential interaction between ABA-responsive MYBs and other key ABA pathway factors from the sub-network, PP2CA and ABA-HYPERSENSITIVE GERMINATION 3 (AHG3). Our results showed that MYB74 and MYB68 could directly bind to AHG3, which was further validated by the pull-down assays (Figure 6, C and D). Together, our results support that MYB74 and MYB68 act as the interplaying hubs between ABA signaling and endodermal suberization.
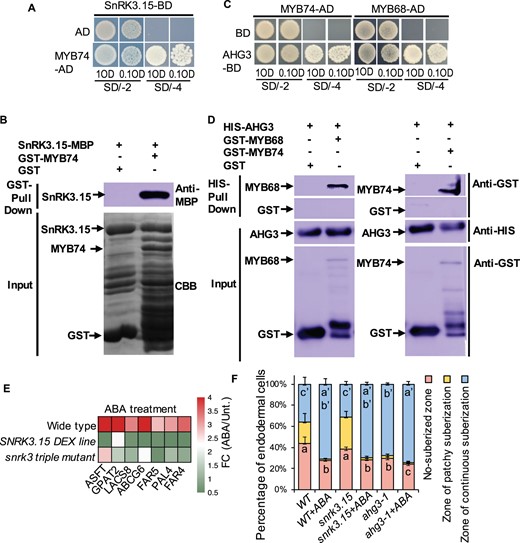
MYBs interact with ABA signaling components. A, MYB74 physically interacts with SnRK3.15 in Y2H. MYB74 in AD vector (MYB74-AD) and SnRK3.15 in BD vector (SnRK3.15-BD). The transformants containing SnRK3.15-BD and empty AD vector are used as the negative control. B, AtSnRK3.15-MBP is pulled down by GST-AtMYB74 (right lane), but not by GST (left lane). The anti-MBP antibody is used for the immunoblotting of AtSnRK3.15-MBP. C, Two MYBs physically interact with AHG3 (PP2C) in Y2H. MYBs in pGADT7 vector (MYBs-AD) and AHG3 in pGBKT7 vector (AHG3-BD). The transformants containing AD-MYBs and empty pGBKT7 (BD) vector are used as the negative control. All transformants are incubated on the SD/-T-L (SD/-2) and SD/-T-L-H-A (SD/-4) medium with 0.1 OD and 1 OD. D, GST-AtMYB68 and GST-AtMYB74 are pulled down by HIS-AHG3 (right lane), but not by HIS (left lane). The anti-GST antibody is used for the immunoblotting of MYB68 and MYB74. E, Heat map showing expression change of suberin genes that are involved in the phenylpropanoid and fatty acid pathways in WT, DEX-inducible SnRK3.15 lines and snrk3 triple mutants after ABA treatment. F, Quantification of suberin deposition. n = 10 roots. In each root, we counted the endodermal cells starting from the onset of elongation. Data are presented as the percentage of endodermal cells. Different letters indicate significant differences between treatments (P < 0.05 by Tukey’s test). Error bars represent SD.
Dexamethasone (DEX)-inducible gain-of-function lines of SnRK3.15 exhibited less sensitivity to ABA treatment, suggesting SnRK3.15 acts as a negative regulator of ABA (Lumba et al., 2014). Interestingly, we found eight suberin genes were dramatically affected by the ABA treatment, and their expression exhibited inverse correlation with SnRK3.15 activity (Figure 6E). In the loss-of-function mutant of SnRK3.15, the initiation of endodermal suberization was not affected (Figure 6F). Similar to WT, snrk3.15 showed expanded continuous root suberization under ABA treatment. These results suggest that SnRK3.15 activity is functionally associated with root suberization, but it presumably functions redundantly in ABA-induced suberization. In ahg3-1 mutant, we also observed the expansion of continuous suberin lamellae and ABA treatment could slightly induce the expanded suberization (Figure 6F), suggesting AHG3 possible acts as the negative regulator of root suberization. Together, we think the interacting hubs between ABA signaling and suberization regulatory network could coordinate the balance between development and stress responses.
Discussion
TRN promoting endodermal differentiation is mediated by SHR
SHR is required for asymmetric cell division and for the formation of endodermal cell layer (Nakajima et al., 2001; Sozzani et al., 2010; Li et al., 2020). Mis-expression of SHR usually results in extra periclinal cell divisions and abnormal cell-fate specification in Arabidopsis roots (Helariutta et al., 2000). Previous studies have shown that SHR participates in the ROS homeostasis in Arabidopsis roots (Ahrazem et al., 2015; Li et al., 2020), and promotes endodermal differentiation through regulating CS formation and root suberization (Drapek et al., 2018; Li et al., 2018; Wang et al., 2020). Here we further uncovered the downstream regulatory network mediated by SHR, in which a complex hierarchical network comprising a group of MYB TFs form multiple sub-networks. In addition, this four-tier regulatory network includes several feedbacks and feed-forward loops, suggesting the high flexibility and plasticity of the suberin regulation.
MYB36 was previously reported as the SHR downstream factor (Li et al., 2018), and we found MYB36 acts as the key hub regulator, locating in the second tier and regulating multiple downstream MYBs within the network. By comparing the transcriptome data, we found more genes changed the expression in iMYB36 than in iSHR, suggesting that SHR is likely located in the top tier of the network. It is possible that various feedback loops exist in the SHR-mediated network, including the inhibitory loops that break the SHR effect to maintain the stable differentiation of endodermis and homeostasis of suberization and lignification.
MYB36-mediated sub-network balances lignification and suberization
The observation of enhanced suberization in the mutants esb1 and myb36 suggests that defective CS could trigger the suberization (Kamiya et al., 2015). It is possible that the plant roots are equipped with a system that can balance lignification and suberization. In our regulatory network, MYB36 is located in the second tier with high centrality. An interesting aspect of MYB36 lies in its double-edged activity on suberin formation. Overexpression of MYB36 can promote root suberization, suggesting the suberin induction ability of MYB36. However, the loss-of-function of MYB36 also led to ectopic production of suberin in root endodermis, presumably being triggered by defective lignified CS. The regulatory network we found in this study reveals that MYB36 acts coordinately with a few other factors, forming multiple feedback loops. Within these feedback loops, MYB122 and MYB6 presumably participate in the balance between lignin and suberin. Root suberization became delayed after the overexpression of MYB6 and MYB122, but the initiation of CS formation of iMYB6 was not noticeably affected. We found MYB122 could repress the downstream key node TFs MYB9 and MYB39, positive regulators of suberization and lignification. In addition, MYB6 appeared to repress MYB52 and MYB93, positive regulators of suberization. With the SHR-mediated network, MYB6 and MYB122 form a feed-forward loop with MYB36. Myb36 mutant disrupts the MYB36-MYB122-MYB6 feed-forward loop, weakening the repressive effect on downstream suberin genes, and therefore resulting in increased endodermal suberization. Defects in CS formation in myb36 mutants presumably are generated by other pathways than MYB6 and MYB122.
In the lateral root initiation, lignin-based CS needs to be broken down while a suberin ring forms to girdle the base of the emerging lateral root (Hosmani et al., 2013; Fernández-Marcos et al., 2017). In the previous study, MYB93 was shown to be expressed in the endodermal cells covering early lateral root primordia, but the expression was transiently abolished during lateral root formation (Gibbs et al., 2014). Interestingly, our network analyses revealed that MYB93 inhibits genes involved in CS formation, whereas it promotes the expression of genes involved in suberization. It is possible that MYB93 participates in this coordinating system, in which MYB93 promotes the removal of CS barrier and the formation of suberin band. Although our results suggest that MYB36 could mediate multiple sub-networks that are involved in balancing lignin and suberin, further studies are needed to ultimately uncover the underlying mechanisms.
In the quadruple mutants of myb41/53/92/93, root suberization was dramatically impaired (Shukla et al., 2021). According to our predicted hierarchical regulatory network, MYB41 locates in the third tier and MYB53, MYB92, and MYB93 all located in the fourth tier. Thus, we think the impaired suberization arises from the interference of multiple tiers. As these hub MYB regulators participate in different developmental processes and stress responses, the elucidation of the entire SHR-mediated regulatory network will provide a complete and comprehensive view of endodermal differentiation.
The interplay between ABA signaling and suberin regulation
Many abiotic stresses including salinity, drought, and a number of nutrient deficiencies can enhance endodermal suberization to increase the adaption of plants to stresses (Baxter et al., 2009; Krishnamurthy et al., 2009, 2011). ABA was reported as the vital hormone signal to mediate suberin regulation in root endodermis during the stress responses (Barberon et al., 2016). In our study, we indeed found most MYBs (9 out of 14) in SHR-mediated network respond to ABA treatment. Among them, MYB68 and MYB74 can directly interact with a key ABA signaling component, AHG3 (a PP2C). In addition, MYB74 directly binds to another ABA signaling component SnRK3.15. In support of this, MYB74 was reported to be regulated through phosphorylation (Lumba et al., 2014). Thus, we speculate that ABA inhibits the activity of both PP2Cs and SnRK3.15, alleviating the phosphorylation of MYBs during root suberization.
ABA and ethylene signaling antagonistically interfere with suberization
Despite previously reported antagonism between ABA and ethylene in the regulation of root suberization (Barberon et al., 2016), the underlying mechanism is not entirely clear. In the regulatory network, we constructed in this study, ethylene could significantly repress the expression of MYBs including MYB74, MYB84, MYB39, MYB41, and MYB53, whereas their expression was considerably enhanced by ABA treatment (Supplemental Figure S14A). This prompts us to hypothesize that these MYBs act as the targets of the antagonism between ethylene and ABA. Although MYB74 can directly interact with ABA signaling components SnRK3.15 and AHG3, further study is required to dissect how MYB74 interacts with ethylene. Notably, these interacting hubs seemed to be functionally redundant as ABA treatment of myb74 mutant still exhibited enhanced root suberization.
In addition, other plant hormones could also be involved. The expression of many members of GDSL-type esterase/lipases (GELP) that participate in endodermal suberization was inhibited by auxin (Ursache et al., 2021). Interestingly, these enzymes, including GPAT5, GELP51, GELP49, and GELP96, were also activated by ABA or iMYB74 induction whereas their expression was repressed by ethylene (Supplemental Figure S14B). It was found that ABA treatment failed to rescue the defective suberization in the high-order mutants of GELP (Ursache et al., 2021), suggesting auxin could also coordinate with ethylene to play antagonistic roles against ABA during root suberization. Among the GDSL-motif-containing enzymes induced by auxin, GELP72 showed the most significant inhibition by ABA (Supplemental Figure S14). Further study is still required to dissect how ethylene is involved in this regulation. Interestingly, CDEF1 (cuticle destructing factor 1), a gene encoding cutinase (Yeats et al., 2014), displayed an induced expression pattern with ethylene treatment, consistent with the potential roles of ethylene that inhibits suberin biosynthesis while promoting the depolymerization (Supplemental Figure S14B).
Materials and methods
Plant materials and cloning
All plants used in this study are in the background of Arabidopsis (A.thaliana) ecotype Columbia-0 (Col-0). For new transgenic plants, Gateway cloning system was used for cloning and generation of expression construct. The 2-kb promoter sequence or coding sequence with stop codes of a candidate gene was amplified from genomic DNA or cDNA from Col-0 roots. For markers, the promoter sequence of candidate gene was amplified and cloned into KpnI and XhoI sites of a pMV2 (modified from pHELLSGATE8) expression vector and recombined with GFP/GUS. All PCR products were purified by the Kit (Sangon Biotechnology Co. Ltd., Shanghai, China). Primer sequences are listed in Supplemental Table S8. For inducible plants, the PCR product was cloned into the estradiol-inducible binary vector pMDC7 (http://www.unizh.ch/botinst/Devo_website/curtisvector/7cassetteB.pdf) via GATEWAY (Invitrogen, Waltham, MA, USA) (see Supplemental Table S8 for primers). The plasmids were transformed into the WT using an Agrobacterium tumefaciens strain GV3101 by the floral dip method.
Plant growth and sampling
All seeds of transgenic lines or mutants were sterilized and germinated on 1/2 Murashige-Skoog (MS) medium containing 1% (wt/vol) sucrose and 1% (wt/vol) at 22°C under 16 h of light/8 h of darkness. For GUS reporter line generation, the corresponding construct was transformed into WT plants and at least two lines with relatively strong signals were analyzed for each construct, the similar GUS staining patterns were shown in 6-d-old seedlings (Figure 1B). To generate inducible OE lines, T1 plants were screened based on the changed expression of the endodermis marker upon ES induction. Subsequently, 6–12 independent T1 seedlings for each inducible line were selected for further investigation. To investigate the vascular phenotypes of each inducible cambial TF, at least two independent T2 or T3 lines with Mendelian segregation were carefully analyzed and the most representative images were selected (Figure 2A).
Construction of the co-expression regulatory network
For RNA-seq experiments, main roots of 6-d-old plants, including WT (Col-0), iSHR and iMYB36 inducible lines, sgn3 (SALK_103965C), myb36-1 (CS69049), shr-2 (Li et al., 2018) and scr-4 (Li et al., 2018) mutant lines, were collected from seedlings depending on the genotype. The inducible lines and mutants showed to have altered the formation of endodermal suberin lamellae or CS (Pfister et al., 2014; Li et al., 2018; Wang et al., 2020). The GEM was constructed by merging differentially expressed genes from each genotype compared to WT (Supplemental Table S7). The GEM was used to construct the co-expression regulatory network with the WGCNA R package using a threshold of P < 0.05, GS for weight >0.6 and MM > 0.6 (Langfelder and Horvath, 2008). We focused on identified subnetworks with significant subnetwork–trait correlations. The subnetwork I/II showed strong correlations with inducible lines and mutants. The two subnetworks were composed of 570 and 239 genes, respectively, which were positively correlated with suberin and CS enhancement, but negatively correlated with the suberin and CS deficiency (Supplemental Figure S1). More than 50% of the selected genes are preferentially expressed in the endodermis based on single-cell transcriptome. These endodermal genes constitute the final co-expression network. The network was visualized by Cytoscape (Shannon et al., 2003). The betweenness and radiality value of TFs were calculated by CentiScaPe2.2 plugin (Scardoni et al., 2009). The same approach was used to construct hormone co-expression regulatory network.
RT-qPCR
Inducible OE lines for 13 TFs and ABA time-series treatment experiments were used for RT-qPCR, except that mutant were used for MYB41. T2 homozygous lines were used for most OE lines. Four-day-old plants were transferred to the plates containing either 10 μM estradiol (Sigma-Aldrich, St. Louis, MO, USA) or control to induce the expression of gene for 48 h. For ABA treatment, the seeds of WT were germinated for 4 d on 1/2 MS medium followed by 2 μM ABA treatment for the time required before analysis. The total root of each treatment including three biological replicates was harvested from estradiol or control plates for RNA purification. Total RNA was isolated with E.Z.N.A. Plant RNA Kit (Omega, Bienne, Switzerland) as instructed by the manufacturer. cDNA was synthesized using TransScript All-in-One First-Strand cDNA Synthesis SuperMix (TRANS) according to the manufacturer’s instructions. RT-qPCR experiments were performed on a BioRad Real-Time System CFX96TM C1000 Thermal Cycler (Singapore) using ChamQ Universal SYBR qPCR Master Mix (Vazyme, Nanjing, China). Detected expression levels were normalized using the Comparative CT Method (ΔΔCT method) using ACTIN7 as reference gene. All primers used for qPCR are listed in Supplemental Table S8.
Chemical treatments
For chemical treatments, 5-d-old seedlings were removed to 1/2 MS medium containing indicated chemicals, such as 10 μM ES, 10 μM Flu, 2 μM ABA, 5 μM ACC, 5 μM AVG. All reagents are Sigma-Aldrich products.
Genotyping for mutants
The T-DNA insertion mutants were obtained from the Arabidopsis Biological Resource Center (ABRC; http://abrc.osu.edu/) and AraShare (http://www.arashare.cn/index/), except that T-DNA line ahg3-1 (SALK_028132) was obtained from Chen et al. (2021a, 2021b). Genomic DNA was purified from Arabidopsis leaves using CTAB method. For T-DNA insertion lines, genotyping PCR using genomic DNA isolated as described above was carried out to amplify either mutant band or WT band using double-primer method. The genotyping primers and left border primer of the T-DNA insertion were designed on SIGnAL platform (http://signal.salk.edu/tdnaprimers.2.html). All related primers and information can be found in Supplemental Table S9.
Staining and microscope image processing
Confocal images were performed on a Zeiss LSM880. Suberin staining was performed by Fluorol Yellow 088 (0.01% w/v) as described previously (Lux et al., 2005; Naseer et al., 2012). Suberin deposition was quantified along the root axis, and we counted all cells within the endodermal cell file until the region was close to the hypocotyl junction. Usually, we quantified 100 cells for each root. Within 100 cells, we classified them into three stages of being nonsuberized, patchy and continuous suberization. The “onset of elongation” was defined as the point at which an endodermal cell in a median optical section was clearly more than twice its width (Alassimone et al., 2010). The stained seedlings were mounted on slides with 50% (v/v) glycerin solution and imaged on a confocal microscope with 488-nm excitation for Fluorol Yellow 088 (The gain value is 646, the percentage of intensity is 75%). Error bars represent the standard deviations calculated from 8 to 10 independent biological replicates.
For lignin staining, Calcofluor White (Sigma-Aldrich) and Basic Fuchsin (Sigma-Aldrich) staining was performed according to the protocol from the Geldner Lab (see http://wp.unil.ch/geldnerlab/resources-and-protocols/protocols/). The stained seedlings were mounted on slides with ClearSee solution and imaged on a confocal microscope with 561-nm excitation and 600- to 650-nm detection for Basic Fuchsin (The gain value is 600, the percentage of intensity is 2.0%), 405-nm excitation and 425- to 475-nm emission for Calcofluor White (The gain value is 491, the percentage of intensity is 14.0%). Error bars represent the standard deviations calculated from 8 to 10 independent biological replicates.
For propidium iodide (PI) staining, the roots were incubated in 10 μM PI solution for 1 min, rinsed and observed using a confocal microscope (Zeiss LSM880) with 561 nm excitation and 566–718 nm detection (The gain value is 550–615, the percentage of intensity is 5.0%–10%).
For GUS staining, 6-d-old seedlings were incubated in the GUS staining solution containing: 100 mM sodium phosphate buffer (pH 7.0), 10 mM EDTA, 1 mM K3[Fe(CN)6], 1 mM K4[Fe(CN)6], 0.1% Triton (v/v) X-100 and 2 mM X-Gluc (Sigma-Aldrich). And then they were placed in an incubator at 37°C until the roots appeared in blue, followed by the clearing in 75% (v/v) ethanol. The stained roots were mounted by HCG for imaging by DIC (Nikon Ni-U).
RNA-seq profiling and data analysis
The high-quality RNA was separately extracted from main root of 6-d-plants, with three biological replicates. Libraries were constructed according to the protocol for the Illumina HiSeq2500 platform. We first filtered the raw RNA sequencing reads to remove low-quality bases, adaptors, duplications, and potential contaminations using fastp software (Chen et al., 2018). The remaining clean reads were then mapped onto the TAIR10 genome using HISAT2 (version 2.1.0) with default settings (Kim et al., 2015). The gene expression level was quantified by TPM, which was calculated using stringtie (version 1.3.3b; Pertea et al., 2016). DESeq2 was used to identify differentially expressed genes (Love et al., 2014). Significance was assessed using a threshold of log2 FC > 1 and FDR < 0.01 corrected for multiple tests of significance.
Y1H assay
The recombinant constructs were co-transformed into yeast strain Y187 and the transformed yeast cells were incubated on SD/-Trp-Len medium for 3 d at 30°C. The transformed yeast cells were then transferred to the SD/-Trp-Len-His + 3-aminotriazole (3AT) medium and incubated for 5 d to test the interaction between the protein and the promoters.
Y2H assay
The recombinant plasmids were co-transformed into Saccharomyces cerevisiae strain Y2H Gold (Clontech, Mountain View, CA, USA). Transformants were grown on synthetic medium lacking Trp and Leu (SD/-2) in an incubator at 30°C for 72 h. And then the yeast transformants were selected on medium lacking Trp, Leu, Asp, and His (SD/-4) and containing 50 mM 3AT to test binding activity.
Luc repoter assays
The sequence of TFs was inserted into the pGreenII62-SK vector containing 35S promoter. The ∼1.5-kb upstream target promoter fragments were PCR amplified and inserted into pGreenII 0800-LUC between XhoI and BamHI sites, except that the promoter of AtKCS2 was truncated into a 1- to 2-kb fragment. The plasmids were extracted using Plasmid Maxiprep kit (TianGen, Beijing, China). The recombinant plasmids were co-transformed into the mesophyll protoplasts from N. benthamiana leaves according to the reported protocol previously (Zhang et al., 2018). The transfected protoplasts were cultured for 6–10 h at room temperature. The Luc signals were analyzed with dual-luciferase reporter assay system (Promega, Shanghai, China) on a luminometer (BioTek Cytation 5).
Pull-down assays
For glutathione S-transferase (GST)-AtMYBs fusions, the full-length coding sequences of AtMYB74 and AtMYB68 were respectively amplified by PCR and cloned into the vector pGEX-4T-1 between BamHI and XhoI sites. For AtSnRK3.15-maltose-binding protein (MBP) fusion, the full-length coding sequence of AtSnRK3.15 was amplified by PCR and ligated into the binary vector pMal_c5x between NdeI and BamHI sites. For HIS-AtAHG3 protein fusion, the full-length coding sequence of AtAHG3 was fused into the vector pET28a between BamHI and XhoI sites. The recombinant proteins were expressed in Escherichia coli strain Transetta (DE3) with 0.25 mM isopropyl-b-D-thiogalactoside. The GST-AtMYBs, AtSnRK3.15-MBP and HIS-AtAHG3 proteins were respectively purified using Glutathione Resin (GenScript, Piscataway, NJ, USA), Amylose Resin (New England BioLabs, Ipswich, MA, USA) and High-Affinity Ni-NTA Resin (GenScript). For the protein interaction assay, the total protein was incubated with resin-bound tagged fusion proteins for 2 h at 4°C with rotation in the binding buffer containing 50 mM Tris–HCl pH 7.5, 0.6% (v/v) Triton and X-100, 100 mM NaCl. The pellets were washed 5 times, eluted in 5 × SDS loading buffer, and boiled at 95°C for 10 min before immunoblotting. The anti-MBP and anti-GST antibody were used for immunoblot analysis.
Accession numbers
Sequence data from this article can be found in the GenBank/EMBL data libraries under accession numbers: SHR, AT4G37650; MYB36, AT5G57620; MYB74, AT4G05100; MYB68, AT5G65790; MYB122, AT1G74080; MYB9, AT5G16770; MYB6, AT4G09460; MYB84, AT3G49690; MYB39, AT4G17785; MYB41, AT4G28110; MYB93, AT1G34670; MYB92, AT5G10280; MYB52, AT1G17950; MYB53, AT5G65230; GPAT5, AT3G11430; CASP1, AT2G36100; KCS2, AT1G04220; ABCG2, AT2G37360; ABCG20, AT3G53510; FAR1, AT5G22500; FAR4, AT3G44540; FAR5, AT3G44550; CYP86A1, AT5G58860; ASFT, AT5G41040; KCS20, AT5G43760; ESB1, AT2G28670; CASP2, AT3G11550; CASP4, AT5G06200; PAL1, AT2G37040; 4CL1, AT1G51680; CCR1, AT1G15950; CAD2, AT2G21730; PER64, AT5G42180; OMT1, AT5G54160. RNA-seq data can be found in NCBI (accession no. PRJNA766184). Authors declare that any other supporting data is available from the corresponding author upon request.
Supplemental data
The following materials are available in the online version of this article.
Supplemental Figure S1. Co-expression subnetworks generated by WGCNA analysis.
Supplemental Figure S2. Transcriptional regulation of co-expression subnetwork II.
Supplemental Figure S3. Transcriptional regulation of co-expression subnetwork III.
Supplemental Figure S4. The suberization patterns in MYB mutant roots.
Supplemental Figure S5. The patterns of lignification in endodermis of MYB mutants roots.
Supplemental Figure S6. Y1H validated direct interaction of genes involved in lignin and suberin biosynthesis by MYBs.
Supplemental Figure S7. Y1H validated direct interaction among the promoter of 20 downstream functional genes MYBs involved MYB6, MYB9, MYB41, MYB122, MYB92, and MYB36.
Supplemental Figure S8. Y1H validated direct interaction among the promoter of 20 downstream functional genes MYBs involved MYB93, MYB68, MYB53, MYB39, and MYB52.
Supplemental Figure S9. Y1H validated direct interaction among the promoter of 20 downstream functional genes MYBs involved MYB74 and MYB84.
Supplemental Figure S10. Transactivation Luc assay showing the MYBs activate the expression of suberin genes.
Supplemental Figure S11. Y1H validated direct regulation among MYBs.
Supplemental Figure S12. The co-expression sub-networks responsive to plant hormones.
Supplemental Figure S13. Protein–protein interactions of 196 ABA-responsive proteins based on Y2H arrays.
Supplemental Figure S14. Antagonistic role of ABA and ethylene in suberization.
Supplemental Table S1. The co-expression relationships in two sub-networks (II and III).
Supplemental Table S2. The detail information of hub TFs in two sub-networks.
Supplemental Table S3. The relationships between TFs in MYBs regulatory network were validated by RT-qPCR.
Supplemental Table S4. The interaction between MYB TFs and genes involved in lignin and suberin biosynthesis pathway and CS formation were supported by Y1H.
Supplemental Table S5. The FCs in genes expression by RNA-seq (iMYB36/iMYB92/iMYB93/iMYB74 versus Col).
Supplemental Table S6. The direction of 260 protein–protein interaction was identified among 196 proteins.
Supplemental Table S7. The gene expression (FPKM) matrix of merged differentially expressed genes from each genotype compared to Col-0.
Supplemental Table S8. Primers used in the study.
Supplemental Table S9. Mutation information, source, and genotyping primers for the mutant alleles that were used in this study.
Shuang W., H.X., C.W., and P.L. designed the experiments. H.X., C.W., P.L., Shasha W., and C.D. performed the experiments and analyzed the data. H.X. analyzed RNA-seq data. B.H., Q.L., W.S., A.T., and M.X. discussed the results and contributed to the interpretation of the results. Shuang W., H.X., CW., and P.L. wrote the article.
The author responsible for distribution of materials integral to the findings presented in this article in accordance with the policy described in the Instructions for Authors (https://dbpia.nl.go.kr/plphys/pages/General-Instructions) is: Shuang Wu ([email protected]).
Acknowledgments
We thank Dr. Siobhan Brady and Dr. Alex Cantó Pastor for critical reading.
Funding
This work is supported by the grant from The National Key Research and Development Program of China (2018YFD1000801-02), National Key Programs for bok choy Breeding of China (11821301354052283-2), and the Scientific Research Foundation of Graduate School of Fujian Agriculture and Forestry University (grant 324-1122yb075).
Conflict ofinterest statement. The authors declare no competing interests.
References
Author notes
These authors contributed equally.
