


Abstract
Plants are able to sense changes in their light environments, such as the onset of day and night, as well as anticipate these changes in order to adapt and survive. Central to this ability is the plant circadian clock, a molecular circuit that precisely orchestrates plant cell processes over the course of a day. REVEILLE (RVE) proteins are recently discovered members of the plant circadian circuitry that activate the evening complex and PSEUDO-RESPONSE REGULATOR genes to maintain regular circadian oscillation. The RVE8 protein and its two homologs, RVE 4 and 6 in Arabidopsis (Arabidopsis thaliana), have been shown to limit the length of the circadian period, with rve 4 6 8 triple-knockout plants possessing an elongated period along with increased leaf surface area, biomass, cell size, and delayed flowering relative to wild-type Col-0 plants. Here, using a multi-omics approach consisting of phenomics, transcriptomics, proteomics, and metabolomics we draw new connections between RVE8-like proteins and a number of core plant cell processes. In particular, we reveal that loss of RVE8-like proteins results in altered carbohydrate, organic acid, and lipid metabolism, including a starch excess phenotype at dawn. We further demonstrate that rve 4 6 8 plants have lower levels of 20S proteasome subunits and possess significantly reduced proteasome activity, potentially explaining the increase in cell-size observed in RVE8-like mutants. Overall, this robust, multi-omic dataset provides substantial insight into the far-reaching impact RVE8-like proteins have on the diel plant cell environment.
Introduction
The circadian clock is a central regulator of plant growth and development that modulates plant responses to both internal and external cues (Greenham and McClung, 2015; Nohales and Kay, 2016; McClung, 2019). It comprises a number of transcription factors that function as a series of interlocking molecular circuits that precisely time the 24-h photoperiod (Creux and Harmer, 2019). Correspondingly, knockout mutants of circadian clock transcription factors have been extensively studied at the phenotypic, genetic, and transcript level in the model plant Arabidopsis (Arabidopsis thaliana; Creux and Harmer, 2019; McClung, 2019; Nakamichi, 2020), with upwards of 30% of genes shown to be under circadian control (Covington et al., 2008). This extensive body of work has revealed a number of roles for the circadian clock in plants, including in the timing of flowering (Shim et al., 2017), disease resistance (Lu et al., 2017), and mitigation of abiotic stress (Simon et al., 2020; Kidokoro et al., 2021) amongst others. However, despite the extensive use of genetic and transcriptomic technologies to understand the molecular impacts of core circadian clock components in Arabidopsis, much less is known about how, and/or if, these transcriptional changes manifest at the protein level (Choudhary et al., 2015, 2016; Uhrig et al., 2019, 2021; Mehta et al., 2021a, 2021b; Krahmer et al., 2022).
Protein abundance and posttranslational protein modification (PTM) changes are critical control mechanisms for biological systems. To date, quantitative proteomic analysis of circadian clock mutants at end-of-day (ED; ZT12) and end-of-night (EN; ZT0) time points (Graf et al., 2017) and time-course experimentation involving CIRCADIAN CLOCK ASSOCIATED 1 overexpression (CCA1ox; Krahmer et al., 2022) and wild-type (WT) Col-0 (Uhrig et al., 2021) plants over free-running and 12:12 light:dark (LD) conditions have provided the first insights into where diel changes in the proteome manifest. Similarly, time-course and ED versus EN analyses of the phosphoproteome from CCA1ox (Krahmer et al., 2022) and WT Col-0 (Uhrig et al., 2019) plants point to a critical, but largely unexplored, role for protein phosphorylation and other PTMs in diel plant cell regulation; particularly at ED and EN. Beyond proteomics, quantitative metabolomic analyses of core circadian clock mutants can also help define the role the circadian clock plays in regulating growth and development through the modulation of primary metabolism (Fukushima et al., 2009; Flis et al., 2019).
REVEILLE (RVE) genes are recently discovered additions to the circadian clock that have been found to function as core circadian clock activators, modulating the regulation of the evening complex (EARLY FLOWERING 3 [ELF3], ELF4, and LUX ARRHYTHMO [LUX]) in addition to TIMING OF CAB EXPRESSION 1 (TOC1) and PSEUDO RESPONSE REGULATOR 5 (PRR5; Farinas and Mas, 2011; Rawat et al., 2011; Hsu et al., 2013; Gray et al., 2017). Findings that rve 8 (Farinas and Mas, 2011; Rawat et al., 2011) and rve 4 6 8 (Gray et al., 2017) plants possess an elongated circadian period demonstrate how RVE proteins are important in maintaining the pace of the circadian clock, while phenotypic characterization of the rve 4 6 8 plants revealed greater plant growth and cell size, coupled with a delay in flowering (Gray et al., 2017).
Despite these findings, how RVE8-like proteins regulate the diel plant cell environment at the protein and metabolic levels remain unresolved. To address this gap in knowledge, we have undertaken a multi-omic analysis of rve 4 6 8 plants relative to WT Col-0 at critical diel/circadian time points: EN/ZT0 and ED/ZT12. Here, we demonstrate that loss of RVE 4, 6, and 8 results in extensive diel proteome, phosphoproteome, and metabolome changes spanning a wide array of critical plant cell processes. In particular, our results suggest that RVE8-like proteins impact critical elements of primary metabolism such as transient diel leaf-starch/carbohydrate levels. Perhaps most intriguingly, we find that rve 4 6 8 plants maintain extensive protein- and PTM-level perturbations in proteasome subunits, coupled with reduced proteasome activity and altered amino acid (AA) levels, which together likely form the basis of the increased growth phenotype of rve 4 6 8. As RVE8-like proteins are associated with multiple agronomically important traits such as biomass and flowering time, elucidating their role in modulating the diel proteome, PTMome and metabolome is critical for their potential implementation in crop improvement strategies.
Results
Examination of rve 4 6 8 mutant phenotypes reveals starch excess at dawn
In order to ensure our molecular analysis would provide robust results, we first phenotypically characterized rve 4 6 8 plants relative to WT Col-0 (Col-0) under our growth conditions (12:12 LD photoperiod facilitated by LED lights). Here, we were able to reproduce multiple growth and development phenotypes previously observed (Gray et al., 2017), indicating that our growth conditions are comparable (Supplemental Figure S1). We monitored plant area and perimeter using real-time imaging over 5 days and found significant differences between rve 4 6 8 and WT Col-0 arise by Day 17 postimbibition, with rve 4 6 8 plants possessing increased leaf area and perimeter (Supplemental Figure S1, A and B). We then performed fresh and dry weight measurements of rve 4 6 8 versus WT Col-0 plants at Day 19 postimbibition revealing that rve 4 6 8 has greater biomass (Supplemental Figure S1, C and D). Lastly, under our 12:12 LD conditions, we found rve 4 6 8 plants have delayed flowering relative to WT Col-0 (Supplemental Figure S1E).
Given these growth phenotypes and the previously observed response of rve 4 6 8 to sucrose (Gray et al., 2017), we next stained rve 4 6 8 and WT Col-0 rosettes for the accumulation of transient leaf starch over a 12:12 LD photoperiod examining ZT0, 6, 12, and 18 time points. This revealed that rve 4 6 8 plants possess a starch excess phenotype at ZT0 (Figure 1A). We then validated this analysis by performing an enzymatic quantitation of starch levels in WT Col-0 and rve 4 6 8 plants (Figure 1B). Samples were collected hourly from ZT21 to ZT3 in order to enzymatically assess if the starch excess observed was due to the long-period phase shift of the rve 4 6 8 mutant clock. Here, our results indicate that the observed starch excess is in fact independent of the lagging phase associated with the long period of the rve 4 6 8 mutant (Figure 1B). We then further examined three key starch metabolism-related enzymes for changes in their gene expression using NanoString RNA quantification: PHOSPHOGLYCERATE MUTASE 1 (PGM1), GRANULE BOUND STARCH SYNTHASE 1 (GBSS1), and STARCH EXCESS 4 (SEX4). GBSS1 and SEX4 transcript levels were significantly lower in rve 4 6 8 compared to WT Col-0 at ZT0 and ZT12, respectively, while no change was observed in PGM expression (Figure 1C). Together with our phenotypic data, these results suggest a potential disconnect between the timing of starch degradation and biosynthesis that results in greater transient starch accumulation at dawn.
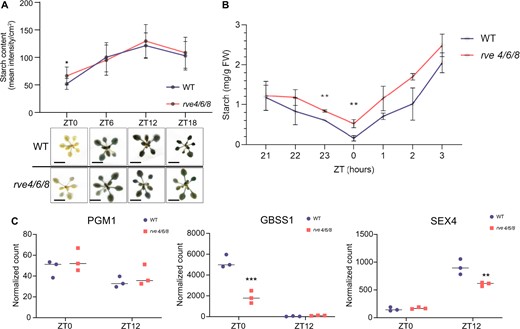
Phenotypic analysis of rve 4 6 8 plant growth and development. A, Iodine starch staining of rosettes at 28-day post-imbibition. Rosettes were photographed at the same time and are part of a single image but were cropped to save space. Scale bars represent 1 cm. Error bars show standard deviation. B, Enzymatic quantification of starch levels in rosettes. All phenotyping was conducted under a 12-h:12-h LD photoperiod using 100 µmol m−2 s−1 light. Asterisks denote Bonferroni adjusted P-value significance: **P ≤ 0.005 and *P ≤ 0.05. Error bars show standard deviation. C, Starch related genes PGM1, GBSS1, and SEX4. All time points and genotypes were analyzed in biological triplicate (n = 3). Asterisks denote Student’s t test P-value significance: ***P ≤ 0.005, **P ≤ 0.01, and *P ≤ 0.05. Horizontal lines show the median. Primer pairs used in the NanoString analysis are described in Supplemental Table S1.
Gene expression analysis provides molecular insights into rve 4 6 8 growth phenotypes
Using NanoString RNA quantification, we next examined the expression of a panel of core circadian clock genes and genes involved in processes impacted by the circadian clock (Figure 2; Supplemental Figure S2; Supplemental Table S1). Studies examining RVE 8-like proteins (RVE 4, 6, and 8) have observed changes in multiple core circadian clock and clock-associated genes (Creux and Harmer, 2019), including PRR5, TOC1, ELF4, PHYTOCHROME-INTERACTING FACTOR 4 (PIF4) and PIF5. We aimed to consolidate this understanding by examining changes in these genes, amongst others, in rve 4 6 8 plants at ZT0 and ZT12 time points under 12:12 LD conditions. Here, we find a decrease in TOC1 and ELF4 transcript levels combined with an increase in PRR5, PIF4, and PIF5 expression in rve 4 6 8 at ZT12 (Figure 2A). We also observed a decrease in CCA1 and LATE ELONGATED HYPOCOTYL (LHY) expression at ZT0 along with increases in PRR7 and GIGANTEA at ZT12 that are also consistent with an elongated period (Hsu et al., 2013; Flis et al., 2016). While our PRR5 result accords with previous findings, our NanoString quantification shows reduced TOC1 transcript levels while previous reverse transcription-quantitative polymerase chain reaction (RT-qPCR) results have shown increased TOC1 levels at ZT12 (Hsu et al, 2013). Similarly, while we observe reduced transcript levels of LHY and CCA1 in the mutant, the previous study did not observe any difference. These differences between the two studies are likely due to the different measurement techniques used (RT-qPCR versus NanoString) and the relatively larger variation in expression recorded in Hsu et al. (2013). Collectively, our results align with previous research examining RVE8-like proteins, although more time points are needed to precisely define the impact of RVE8-like proteins on the phasing and period lengths of core clock transcripts.
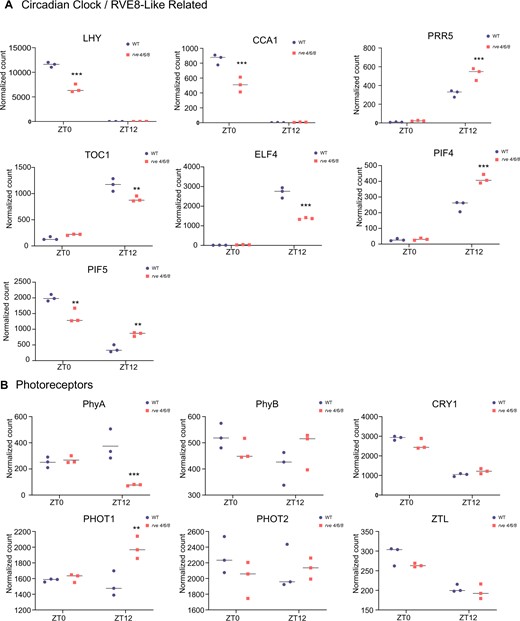
Diel mRNA gene expression analysis of circadian clock and photoreceptor related genes in rve 4 6 8 and Col-0 plants. Select genes from different circadian/diel implicated plant cell processes were examined for their expression level at EN (ZT0) and ED (ZT12) by NanoString expression analysis (see “Materials and methods”). A, Expression of circadian clock/RVE8-like related genes CCA1, LHY, TOC1, PRR5, ELF4, PIF4, and PIF5. B, Expression of photoreceptors PhyA, PhyB, CRY1, PHOT1, PHOT2, and ZTL. All time points and genotypes were analyzed in biological triplicate (n = 3). Asterisks denote Student’s t test P-value significance: ***P ≤ 0.005, **P ≤ 0.01, and *P ≤ 0.05. Primer pairs used in the NanoString analysis are described in Supplemental Table S1.
Photoreceptors are crucial in circadian clock entrainment by light, but are in turn also controlled by the clock (Bognar et al., 1999; Sanchez et al., 2020). Correspondingly, we next examined rve 4 6 8 plants for changes in the expression of key photoreceptor genes, quantifying changes in the expression of PHYA and B, PHOTOTROPIN (PHOT) 1 and 2, CRYPTOCHROME 1 (CRY1) and the circadian clock-associated photoreceptor ZEITLUPE (ZTL) in rve 4 6 8 versus WT Col-0 at ZT0 and ZT12. Here, we found a significant decrease in PHYA and a significant increase in PHOT1 expression in rve 4 6 8 plants at ZT12, with no change in PHYB, PHOT2, CRY1, and ZTL (Figure 2B).
Since rve 4 6 8 plants demonstrate a number of growth phenotypes, we additionally examined the expression of genes upstream of, or involved in, phytohormone-related processes. Here, we find significant changes in GERANYLGERANYL PYROPHOSPHATE SYNTHASE 1 (GGPPS1) at both ZT0 and ZT12 as well ARABIDOPSIS RESPONSE REGULATOR 7 (ARR7) at ZT12 (Supplemental Figure S2). While these genes represent only a sampling of the phytohormone metabolism/signaling landscape, both their enzyme products have a common connection to dimethylallyl pyrophosphate (DMAPP)/isoprenyl pyrophosphate (IPP), a critical metabolic intermediate. GGPPS1 catalyzes the entry point reaction for downstream production of multiple phytohormones, including: abscisic acid, gibberellin, and strigolactone biosynthesis (Ruiz-Sola et al., 2016). Cytokinin is also derived from the DMAPP/IPP metabolic branch point (Astot et al., 2000) and ARR7 represents a cytokinin response factor that is activated in the presence of cytokinins (Huang et al., 2017).
Quantitative proteome and phosphoproteome analyses reveal extensive protein-level impacts of RVE8-like protein loss
Quantifying proteome-level changes in the plant cell environment in response to perturbation (e.g. gene deletion) is a robust means of measuring the impact of a protein on a system. However, the high dynamic range nature of plant tissues has typically hampered our ability to sufficiently sample the dynamically fluctuating proteome, biasing analyses toward high abundant proteins (Mehta et al., 2022, 2021a, 2021b). Given this, we deployed a combination of BoxCarDIA (proteome abundance) and conventional data-dependent acquisition (DDA; phosphoproteomics) mass spectrometry (MS) acquisition methods to perform label-free quantitation of protein abundance and phosphoproteomic changes in rve 4 6 8 plants at ZT0 and ZT12. The ZT0 and ZT12 time points were selected for analysis as they have been shown to exhibit dynamic protein-level changes (e.g. abundance and PTMs) across multiple plant organs, tissues, and growth conditions in a variety of WT and circadian clock mutant plants (Graf et al., 2017; Uhrig et al., 2019, 2021; Krahmer et al., 2022). Through this analysis, we quantified 3,934 proteins and 1,137 phosphoproteins for changes in abundance and phosphorylation status, of which 536 and 346 demonstrated significant fluctuations, respectively (Table 1; Supplemental Tables S2 and S3). Further, we quantified 46% of all proteins exhibiting a significant change in their phosphorylation status at the proteome-level (159/347 phosphoproteins), with 8.6% of phosphoproteins demonstrating a corresponding change in protein abundance (30/347 phosphoproteins).
Quantified and significantly changing proteome and phosphoproteome
| Quantified | Significantly changinga | |||
|---|---|---|---|---|
| Protein groups | Peptides | Protein groups | Peptides | |
| Proteome | 3,934 | 18,887 | 536 | Not applicable (NA) |
| Phosphoproteome | 1,137 | 1,872 | 346 | 425 |
| Quantified | Significantly changinga | |||
|---|---|---|---|---|
| Protein groups | Peptides | Protein groups | Peptides | |
| Proteome | 3,934 | 18,887 | 536 | Not applicable (NA) |
| Phosphoproteome | 1,137 | 1,872 | 346 | 425 |
n = 4; q-value ≤ 0.05; FC ≥ 1.5.
Next, using significantly changing proteins and phosphoproteins, we performed a gene ontology (GO) enrichment analysis for biological processes, subcellular localization, and molecular function to reveal how the loss of RVE8-like proteins impacts the diel plant cell environment at the protein level (Figure 3; Supplemental Table S4). Here, we found changes in “proteolysis” (GO:0006508), which was complemented by the enrichment of “proteasome core complex” (GO:0005839) and “proteasome complex” (GO:0000502) subcellular localizations, in addition to “response to acid chemical” (GO:0001101), which represents a high-level category for phytohormones and “polysaccharide metabolism” (GO:0005976), amongst others (Figure 3A). Similarly, phosphoproteomic data revealed enrichment in “response to acid chemical” (GO:0001101), and “response to abscisic acid” (GO:0009737) in addition to “cell cycle” (GO:0007049), “cell division” (GO:0051301), “macromolecule metabolism” (GO:0043170) and “response to lipids” (GO:0033993), amongst others (Figure 3B). While proteome-level rve 4 6 8-dependent changes included both increases and decreases in protein levels, we found a global increase in protein phosphorylation in the rve 4 6 8 mutant compared to WT Col-0 (Figure 3B).
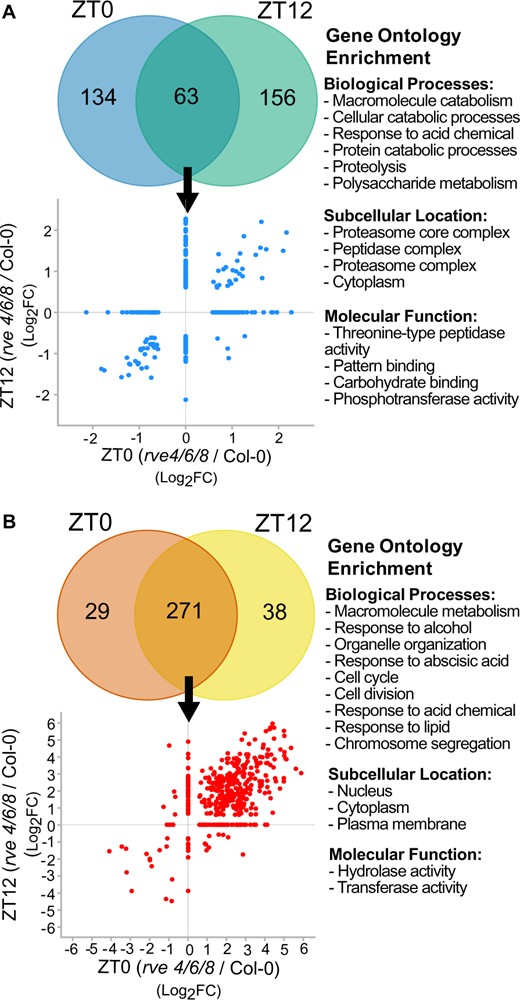
Analysis of the quantified proteome and phosphoproteome changes at ZT0 or ZT12 in rve 4 6 8 versus Col-0. The significantly changing (A) proteome and (B) phosphoproteome (n = 4; FC ≥ 1.5, q-value ≤ 0.05) were plotted by Venn diagrams and scatterplots to visualize the overlap and Log2FC between rve 4 6 8 and WT Col-0 plants at ZT0 and ZT12. GO enrichment of biological processes, subcellular localization and molecular function was then performed to systemically contextualize proteome and phosphoproteme changes (see “Materials and methods”).
Lastly, we compared our significantly changing phosphopeptides at ZT0 and ZT12 with phosphosites previously found to oscillate under free-running conditions in WT Col-0 (Krahmer et al., 2022). Here we found that 77 of our phosphopeptides (q-value ≤ 0.05) significantly changed in rve 4 6 8 compared to WT Col-0 (JTK P ≤ 0.05; Supplemental Table S5). These oscillating phosphopeptides are from diverse, but critically important proteins such as nuclear-localized RETINOBLASTOMA-RELATED 1 (RBR; AT3G12280)—growth and development, cytosolic PHOSPHOENOLPYRUVATE CARBOXYLASE 2 (AT2G42600) and chloroplast-targeted RUBISCO ACTIVASE (AT2G39730)—metabolism and plasma membrane-associated CELLULOSE SYNTHASE-LIKE D3 (AT3G0305—cell wall biosynthesis (Supplemental Table S5). This indicates that RVE8-like proteins influence the timing of diel phosphorylation events on proteins involved in core growth and development processes.
Time-of-day association network analysis finds multiple gene networks affected in rve 4 6 8 at the protein level
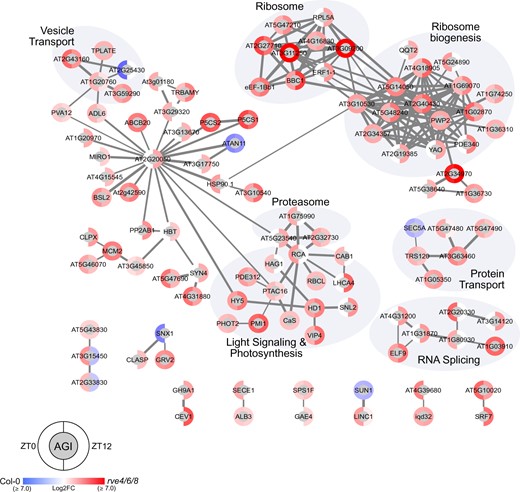
To contextualize the changing proteome and phosphoproteome, we next generated STRING-DB association networks (minimum edge score ≥0.7) for all significantly changing proteins and phosphoproteins in rve 4 6 8 plants at ZT0 and ZT12 relative to WT Col-0 to better understand the protein-level changes that underpin observed rve 4 6 8 phenotypes. Proteome quantification revealed decreases in the abundance of multiple starch degradation enzymes including SEX1 (AT1G10760) and SEX4 as well as cold-stress proteins COLD-REGULATED 15A (COR15A; AT2G42540), COR15B (AT2G42530), and COR6 (AT5G15970). Conversely, we observed increases in primary metabolic and sulfur assimilation enzymes such as PHOSPHOFRUCTOKINASE 5 (AT2G22480), PYRUVATE ORHOPHOSPHATE DIKINASE (AT4G15530) 5'-ADENYLYLPHOSPHOSULFATE REDUCTASE 2 (APR2; AT1G62180), and ADENYLYL-SULFATE KINASE (APK; AT2G14750), along with a multitude of spliceosomal, ribosomal, and ubiquitin ligating proteins. Together, these proteomic data support our observed starch excess phenotype in rve 4 6 8 at ZT0, while suggesting RVE8-like proteins also impact agronomically important processes such as sulfur assimilation and cold stress response (Figure 4). We also observed distinct changes in proteasome complex proteins, whereby four 19S proteasome proteins (AT1G04810, AT1G75990; AT4G19006, AT4G24820) are upregulated and twelve 20S proteasome proteins are downregulated in rve 4 6 8 plants (Figure 4; Supplemental Table S6). Further examination of the transcripts corresponding to the proteasome subunits changing at the protein level using DiurnalDB (http://diurnal.mocklerlab.org/) found that 9 of the 12 20S subunits and 2 of the 4 19S subunits possess daily oscillations in their transcripts (≥0.8 cutoff), with most peaking in abundance at ZT12 (Supplemental Table S6).
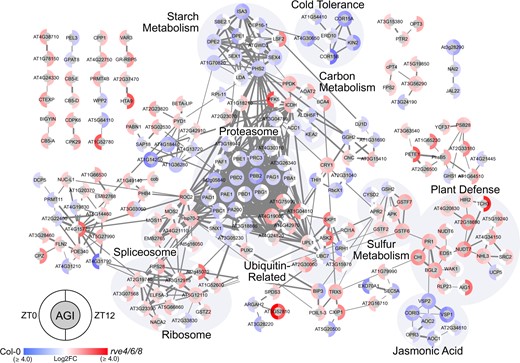
Association network analysis of significant genotypic proteome fluctuations at ZT0 and ZT12. The association network depicts significant Log2FC in protein abundance between rve 4 6 8 and WT Col-0 at ZT0 and ZT12 (q-value ≤ 0.05; Supplemental Table S2). Networks were generated using Cytoscape and a combination of the STRING-DB and enhancedGraphics App (see “Materials and methods”) using all datatypes and an edge score ≥0.7. Nodes with no edges ≥0.7 were removed. Brighter red (rve 4 6 8) or blue (WT Col-0) coloration indicates the relative increase in measured Log2FC protein abundance in that corresponding genotype. Highlighted node clusters were manually annotated using a combination of ThaleMine (https://bar.utoronto.ca/thalemine/begin.do), TAIR (https://www.arabidopsis.org/), and Cytoscape Functional Annotation.
Association network analysis also revealed that the loss of RVE8-like proteins results in major phosphoproteome perturbations, with large increases in the phosphorylation status of a number of proteins at both ZT0 and ZT12 in rve 4 6 8 (Figure 5). Correspondingly, we observed abundance changes in protein kinases (PKs) CALCIUM-DEPENDENT PROTEIN KINASE 3 (CDPK6/CPK3; AT4G23650), CPK29 (AT1G76040), CYTOPLASMIC TRNA EXPORT PROTEIN (AT2G40730), WALL-ASSOCIATED KINASE 1 (WAK1; AT1G21250), amongst others (Figure 4), in addition to phosphorylation changes on 23 PK superfamily proteins including CPK1 (Figure 5). Overall, we observed phosphorylation changes on proteins involved in similar processes and protein complexes as those found in our quantitative proteome data including multiple spliceosomal- and ribosome-complex proteins, ubiquitin-related proteins, and primary metabolic enzymes (Figure 5). Exclusive to our phosphoproteome data, however, are perturbations in the phosphorylation status of a number of nuclear- and secretion-related proteins along with extensive changes in proteins related to light harvesting, photosynthesis, and light signaling, such as CAB1 (AT1G29930), PHOT2 (AT5G58140), and ELONGATED HYPOCOTYL 5 (HY5; AT5G11260).
Association network analysis of significant genotypic phosphoproteome fluctuations at ZT0 and ZT12. The association network depicts significant median Log2FC phosphoproteome changes between rve 4 6 8 and WT Col-0 at ZT0 and ZT12 (q-value ≤ 0.05; Supplemental Table S3). Networks were generated using Cytoscape and a combination of the STRING-DB and enhancedGraphics App (see “Materials and methods”) using all datatypes and an edge score ≥0.7. Nodes with no edges ≥0.7 or only edges ≤0.6 were removed. Brighter red (rve 4 6 8) or blue (WT Col-0) coloration indicates the relative increase in measured Log2FC protein abundance in that corresponding genotype. Highlighted node clusters were manually annotated using a combination of ThaleMine (https://bar.utoronto.ca/thalemine/begin.do), TAIR (https://www.arabidopsis.org/), and Cytoscape Functional Annotation.
Next, we performed a phospho-motif enrichment analysis using our significantly changing phosphopeptides to identify potential PKs regulated by RVE8-like proteins. We found five enriched phosphorylation motifs relating to MITOGEN-ACTIVATED PROTEIN KINASES (MAPKs), CASEIN KINASE II (CKII), and CDPK/CPKs (Supplemental Data Set 1). Using the phosphoproteins containing these motifs, we then created a STRING-DB association network (minimum edge score ≥0.7) depicting the phosphorylated substrates of these PKs found in our study to resolve potential functional relationships as well as intersections between different PKs (Supplemental Figure S3). Again, a stringent minimum edge score was used to resolve robust network connections, however, here, all phosphoproteins recognized as having one of these five motifs is shown. This analysis resolved a number of networks, including: 26S proteasomal complex proteins—MAPK, ribosome—CKII/CDPK/CPK, spliceosome—CDPK/CPK, RNA processing—MAPK, and Golgi–ER secretion—CDPK/CPK relationships (Supplemental Figure S3), collectively highlighting cell signaling—biological process connections for further characterization.
Wide-ranging primary metabolite changes highlight altered metabolism in rve 4 6 8 plants
As multiple proteins involved in metabolism demonstrated changes at the proteome and phosphoproteome level, we next examined diel changes in rve 4 6 8 metabolism compared to WT Col-0 at ZT0, 6, 12, and 18 using gas chromatography–MS (GC–MS; Figure 6; Supplemental Data Set 2). Here, we found dynamic changes (rve 4 6 8 versus WT Col-0) in AAs, organic acids (OAs), fatty acids (FAs), and sugars, amongst others, over the course of the day, with the largest perturbations occurring around ZT0–ZT6. These diel changes are highlighted by large increases in phenylalanine (AA), glutamic acid (AA), shikimic acid (OA), sinapinic acid (OA), α-linolenic acid (FA), sucrose (sugar), myo-inositol (other), 5-oxoproline (other), and phytol (other) at ZT0, along with an increase in mannose (sugar) staring at ZT6. Further, we observed that rve 4 6 8 plants maintain a consistent increase in glyceric acid (OA) and fumaric acid (OA) coupled with a consistent decrease in serine (AA) and threonine (AA) across all four ZT time points harvested.

Relative Log2FC in diel metabolite levels. Rosette tissue (28 days postimbibition) was sampled at ZT0, ZT6, ZT12, and ZT18 as outlined in the “Materials and methods”. Cell values indicate the relative Log2FC (rve 468 vs. WT Col-0) in metabolite abundance.
rve 4 6 8 plants possess constitutively reduced proteasome activity
The enrichment of proteolysis and proteasome-related GO categories in our proteomics dataset, coupled with an extensive cluster of proteasome-related proteins in our STRING-DB association network, prompted us to examine whether the rve 4 6 8 mutant showed differences in proteasome function compared to WT Col-0. We therefore carried out a proteasome activity assay using a 7-Amino-4-methylcoumarin flurophore tagged LLVY peptide substrate (Üstün and Börnke, 2017) and used the well-characterized MG132 proteasome inhibitor as a negative control to validate the assay. Proteasome activity was measured in crude extracts of eight independent WT and rve 4 6 8 rosettes harvested at both ZT23 and ZT11. Our results show a significant reduction in proteasome activity in the rve 4 6 8 mutant compared to WT (adjusted P ≤ 0.05; Bonferroni and Dunn multiple testing correction; Figure 7A). Furthermore, plants with impaired proteasome activity are also found to display a hypersensitivity to chemical proteasome inhibition (Gladman et al., 2016; Han et al., 2019). Correspondingly, when grown on plates containing 50 µM of the MG132 proteasome inhibitor, rve 4 6 8 seedlings possessed impaired growth, similar to that previously observed in mutants of both the core 20S proteasome and the NAC transcription factors that activate the proteasome stress regulon (Figure 7B; Supplemental Figure S4; Gladman et al., 2016; Han et al., 2019).
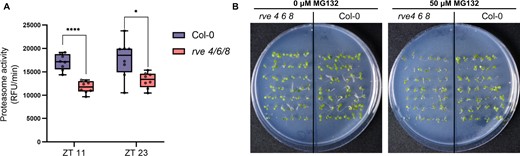
Proteasome function is reduced in rve 4 6 8. A, Proteasome activity in relative fluorescence units per minute (RFU/min) measured in crude extracts of 3-week-old rve 4 6 8 and WT Col-0 plants. ****Bonferroni adjusted P < 0.0001; *Bonferroni adjusted P < 0.05). The center line of the box-plot shows the median, with box limits representing the 75th and 25th percentiles and whiskers plotted following Tukey’s 1.5× interquartile range method. B, Seedling growth experiments with proteasome inhibitor treatment (50 µM MG132). Seedlings were germinated, stratified, and then grown for 6 days under 12:12 LD conditions. A total of six replicate plates per condition were assayed (Additional plates depicted in Supplemental Figure S4).
Discussion
Multi-omics analysis reveals altered carbohydrate metabolism in rve 4 6 8 plants
Through our combined use of phenomics, transcriptomics, proteomics, and metabolomics, we found that rve 4 6 8 plants possess a starch excess phenotype at ZT0 that relates to altered gene expression and protein abundance changes in starch biosynthesis and degradation enzymes. Initial examination of the transcriptional changes of select genes saw significant decreases in GBSS1 at ZT0 and SEX4 at ZT12 in rve 4 6 8 relative to WT Col-0, respectively. Subsequent proteomic analysis then found extensive decreases in nearly all facets of the starch degradation machinery at either ZT0 and/or ZT12 including decreases in the abundance of SEX1 (AT1G10760), SEX4, GWD3 (AT5G26570), ISA3 (AT4G09020), PHS2 (AT3G46970), LDA (AT5G04360), and DPE2 (AT2G40840; Streb and Zeeman, 2012). Correspondingly, our metabolite data demonstrated decreased glucose and sucrose levels at ZT6, ZT12, and ZT18, which is consistent with altered carbon metabolism related to excess starch levels at ZT0. Plants deficient in core clock proteins PRR7 and PRR9 (prr7 prr9), which also maintain a long circadian period, have also been shown to possess a subtle starch excess phenotype (Chew et al., 2022; Flis et al., 2019); however, unlike prr7 prr9 plants, rve 4 6 8 plants seem to asymmetrically possess excess starch at ZT0 only. The mutant of DISPROPORTIONATING ENZYME 1 (DPE1; AT5G64860), a key starch degradation protein, however, possesses a similar phenotype whereby starch levels are in excess at dawn but accumulate closer to WT plants by dusk (Critchley et al, 2001). We also see DPE1 asymmetrically downregulated in protein abundance at ZT0, suggesting a connection to RVE8-like proteins. Hence, future work connecting RVE8-like proteins to DPE1 and other starch degradation enzymes is certainly of interest.
Interestingly, we see very few PTM-level changes occurring on starch-related enzymes in rve 4 6 8 plants despite many of these enzymes being previously found to be phosphorylated (PhosPhat; http://phosphat.uni-hohenheim.de/; Heazlewood et al., 2008). Unlike the extensive protein abundance changes observed, only two starch-related enzymes were found to have a significant change in their phosphorylation status. These were STARCH SYNTHASE 2 (SS2; AT3G01180) and BETA-AMYLASE 1 (BAM1; AT3G23920), of which both exhibited an increase in their phosphorylation status at ZT0 and ZT12 in rve 4 6 8 relative to WT Col-0. The role(s) of protein phosphorylation in regulating starch-related enzyme complexes has been well defined in sink tissues (Tetlow et al., 2004), but remains poorly understood in source tissues (e.g. leaves), where starch is produced and degraded on a daily basis (Smith and Zeeman, 2020). Recent biochemical characterization of SS2 phosphorylation using phospho-ablative SS2 mutants (S63A and S65A) found no enzymatic or protein complex consequences to the loss of SS2 phosphorylation despite being phosphorylated by CKII (Patterson et al., 2018). Our data finds SS2 to be phosphorylated at Ser65; part of a canonical CKII phosphorylation motif (pS[D/E][D/E][D/E]; Purzner et al., 2018), exclusively at ZT0 in the rve 4 6 8 mutant. We also observe BAM1 to be phosphorylated, but at a pSP MAPK-like motif (Purzner et al., 2018). There are no currently defined roles for BAM1 phosphorylation despite its key role in regulating plant growth, promoting stomatal opening, and facilitating starch degradation under osmotic stress in the light (Thalmann et al., 2016).
Of the carbohydrate-related changes we found that in rve 4 6 8, the consistent and substantial increase in mannose, a multifunctional glucose analog, was particularly interesting. Previous investigations of the function of mannose have found that it can: (1) stimulate stomatal closure (Hei et al., 2018); (2) be incorporated into glycolysis through fructose 6-phosphate via hexokinase and phosphomannose isomerase (Sharma et al., 2014); (3) protect against oxidative damage; (4) impact flowering time through ascorbate production (Kotchoni et al., 2009), and (5) contribute to cell wall biosynthesis and protein glycosylation (Qi et al., 2017)—all molecular changes that relate to the phenotypes displayed by rve 4 6 8. Interestingly, mannose has a high affinity for hexokinase (Herold and Lewis, 1977), leading to the induction of glucose-like signaling responses such as stomatal closure (Hei et al., 2018) and bud elongation in Arabidopsis, pea (Pisum sativum L. cv Terese) and rose (Rosa hybrida L. cv Radrazz; Barbier et al., 2021). It is possible that a similar mechanism contributes to the elongated rosette leaf morphology observed in rve 4 6 8, both in this study, and others (Gray et al., 2017).
RVE8-like protein regulation of TOC1 may control the production of fumarate and other OAs
Arabidopsis plants over-expressing RVE8 have previously been shown to stimulate the expression of TOC1 (Hsu et al., 2013) and toc1-2 plants have been found to possess increased levels of fumarate at ZT7 and Z19 (Cervela-Cardona et al., 2021). In this context, our finding that rve 4 6 8 plants possess both reduced TOC1 gene expression at ZT12 and increased fumarate levels throughout the diel cycle, suggests RVE8-like proteins impact fumarate metabolism via TOC1. Further, this finding aligns with our observation that multiple other mitochondrial OAs are, to varying degrees, impacted by RVE8-like proteins, including malate, citrate, and succinate. Change in these OAs align with the previous findings that prr5 prr7 prr9 mutants have increased fumarate, malate, citrate, and succinate stemming from the downregulation of TCA cycle genes (Fukushima et al., 2009). At the protein level, however, we find no significant change in FUMARASE 1 (FUM1; AT2G47510), FUM2 (AT5G50950), MITOCHONDRIAL MALATE DEHYDROGENASE 1 (mMDH1; AT1G53240), mMDH2 (AT3G15020), CITRATE SYNTHASE 2 (CSY2; AT3G58750), CSY3 (AT2G42790), SUCCINATE DEHYDROGENASE 1-1 (SDH1-1; AT5G66760), SDH5 (AT1G47420), and SDH6 (AT1G08480) protein abundance and/or PTM levels in rve 4 6 8 versus WT Col-0 at either ZT0 or ZT12. This indicates that RVE8-like protein control of fumarate production is not direct, but likely through the previously identified TOC1-FUM2 mechanism (Cervela-Cardona et al., 2021). It also suggests that if diel protein-level regulation of mitochondrial TCA enzymes is occurring, it manifests through alternative means, such as a production–degradation mechanism that maintains steady-state levels of TCA enzymes or through PTMs other than phosphorylation. While our current dataset is unable to directly answer these possibilities, previous work examining mitochondrial protein turnover has implicated FILAMENTOUS TEMPERATURE SENSITIVE H (FTSH), LON, and CLPXP proteases (Li et al., 2017; Huang et al., 2020), of which we observe FTSH11 (AT5G53170) and CLPX (AT5G53350), two putatively mitochondrial-targeted proteases, to possess an increase in their phosphorylation status (Heazlewood et al., 2004; Senkler et al., 2017). Ultimately how TCA enzymes are coordinately regulated at the transcript, protein, and/or PTM levels, in addition to possible feed-forward or feed-back regulation by metabolites, requires targeted analyses that are beyond the scope of this study.
RVE8-like proteins are constitutive regulators of the proteasome
Both GO enrichment and STRING-DB association network analysis of differentially expressed proteins in rve 4 6 8 at ZT0 and ZT12 revealed substantial protein-level changes in the abundance of a number of proteasome complex subunits, coupled with a limited corresponding change in phosphorylation status. In plants, connections between the circadian clock and E3 ubiquitin ligases targeting proteins for proteasomal degradation through K63 polyubiquitylation have emerged, indicating that diel protein turnover is a circadian-controlled phenomenon (Feke et al., 2019, 2020; Zhu et al., 2020a). Further, using N15 labeling methods, efforts made to quantify protein turnover rates have demonstrated that diel protein turnover involves a multitude of proteins that are processed at variable rates over a wide-ranging time frame (Li et al., 2017; Huang et al., 2020). To date, however, no connections between the circadian clock and the direct regulation of the proteasome complex have been uncovered.
The mature 26S proteasome is comprised of a 20S core protease (CP) which maintains nonspecific ubiquitin-independent proteolytic activity and 19S regulatory particle (RP) subunits that determine specificity to ubiquitylated proteins (Sadandom et al., 2012). We observe a reduction in 12 out of the 14 CP subunits, including 5 alpha and 7 beta ring subunits, in the rve 4 6 8 mutants. In contrast, we see an increase in the abundance of 4 RP subunits, as well as CSN4, a member of the COP9 signalosome, a conserved regulator of ubiquitin-dependent proteolysis and a key player in photomorphogenesis (Qin et al., 2020). Studies investigating proteasome subunits in Arabidopsis have shown that reduced CP proteolytic function is associated with cell expansion (Kurepa et al., 2009a) and that one member of the 19S RP subunit, RPN12a, is involved in cytokinin-mediated signaling for cell division (Smalle et al., 2002). This aligns with our GO enrichment of cell cycle and cell division biological process amongst proteins exhibiting a significant change in abundance as well as our observed increase in cytokinin response factor ARR7. Further, these findings are consistent with a hypothesis that proper balancing of the 20S and 19S subunits of the proteasome is key for maintaining growth and cell division (Kurepa et al., 2009b), and that alterations in the levels of these subunits in rve 4 6 8, at least partially, explain its growth and large cell size phenotypes.
In mice (Mus musculus), connections between the circadian clock and proteasomal degradation of CRY1 have also been defined, with enhanced CRY1 degradation associated with elevated glucose levels and a loss of core clock regulation (Toledo et al., 2018). In plants, CRY proteins entrain the clock (Devlin and Kay, 2000), with cry1 mutants having longer circadian periods under blue light (Somers et al., 1998). Interestingly, in rve 4 6 8 plants, which similarly possess a long circadian period that increases with blue light fluence (Gray et al., 2017), we observe increased CRY1 protein levels at both ZT0 (Log2FC = 1.05) and ZT12 (Log2FC = 0.81), coupled with a starch excess phenotype and wide-ranging carbohydrate metabolism perturbations, indicating a potentially similar circadian clock intersection between CRY1 and primary carbohydrate metabolism that appears to involve RVE8-like proteins. Additionally, the diel AA perturbations measured in rve 4 6 8 plants may also correspond to RVE8-like proteins impacting the diel plant cell environment through the regulation of proteasome subunits and protein turnover.
Ultimately, a connection between the circadian clock and diel protein turnover is logical given the consistent lack of coordinately fluctuating diel transcripts and proteins in Arabidopsis across multiple experiments (Baerenfaller et al., 2012; Graf et al., 2017; Uhrig et al., 2021; Mehta et al., 2021a, 2021b). Overall, our results implicate RVE8-like proteins as being involved in diel protein turnover, adding important context to the well-known disconnect between circadian transcript and protein abundancies. Future assessment of core circadian clock mutants for changes in protein turnover rates may help resolve the degree to which diel protein turnover contributes to daily protein-level plant cell regulation.
Proteome changes in rve 4 6 8 plants suggest RVE8-like proteins may modulate adaptive plant stress responses
The enrichment of GO categories pertaining to Abscisic acid in the rve 4 6 8 proteome, provides protein-level evidence that RVE8-like proteins may modulate adaptation to drought-like stresses (e.g. osmotic, salinity, and cold). A potential role for RVE8-like proteins in drought-like stress response(s) is supported by the measured increase in mannose levels, which is known to influence stomatal conductance. Further, α-linolenic acid, and its derivatives, are known to increase upon drought and salinity stress to mitigate associated cell membrane issues by remodeling cell membranes to increase their fluidity (Zhang et al., 2005; Upchurch, 2008; Torres-Franklin et al., 2009; He and Ding, 2020). Here, this seems to center on FATTY ACID DESATURASE 7 (AT3G11170), which utilizes linoleic acid to produce α-linolenic acid (Gibson et al., 1994), and is significantly more abundant in rve 4 6 8 plants at ZT0, corresponding to peak levels of α-linolenic acid.
In addition to augmenting membrane fluidity, α-linolenic acid can also fuel the production of jasmonic acid (JA; He and Ding, 2020). Interestingly, we find that critical JA biosynthetic enzymes AOC1, AOC2, and 12-OXOPHYTODIENOATE REDUCTASE 3 (OPR3; AT2G06050) are significantly more abundant in WT Col-0 relative to rve 4 6 8, suggesting that RVE8-like protein-deficient plants may possess susceptibility to certain biotic stresses. A diel connection between RVE8-like proteins and JA biosynthetic enzymes is further supported by the altered diel phosphorylation of the peroxisomal ABC transporter COMATOSE (AT4G39850), which imports JA precursor cis-12-oxophytodienoic acid that is then utilized by OPR3 (Wasternack and Hause, 2019), which peaks in protein abundance at ZT12.
Further support for a role of RVE8-like proteins in drought-like stress response(s) is the increased abundance of key sulfur assimilating enzymes APR2 (AT1G62180) and APK (AT2G14750) in rve 4 6 8 plants. These proteins are critical for the production of ABA and glutathione (GSH), in addition to a number of other critical plant metabolites (Aarabi et al., 2020). Correspondingly, we see an increase in a number of GSH transferases (GSTs); GSTF2, GSTF6 (AT1G02930), and GSTF7 (AT1G02920), which are a subclass of the plant-specific Phi-family of GSTs implicated in mitigating oxidative (GSTF2) and salt (GSTF6/7) stress, respectively (Lee et al., 2014; Seok et al., 2020). In previous proteomic and phosphoproteomic analyses of persistent osmotic and salt-stress, increased abundance of sulfur metabolic enzymes (Rodriguez et al., 2021), indicates a potential connection between sulfur metabolism/assimilation and drought-stress tolerance. In maize (Zea mays), the application of sulfur-supplemented fertilizers to drought-stressed plants was shown to mitigate the effects of drought (Usmani et al., 2020).
RVE8-like proteins were most recently implicated in the direct transcriptional activation of DEHYDRATION RESPONSE ELEMENT B (DREB) expression under cold stress (Kidokoro et al., 2021). DREB transcription factors serve as master controllers of cold-induced gene expression, regulating COLD REGULATED (COR) genes to enhance freezing tolerance (Jaglo-Ottosen et al., 1998). Correspondingly, RVE8-like protein-deficient plants (rve 4 8) possessed diminished cold tolerance (Kidokoro et al., 2021). Interestingly, our proteomics data resolved a cluster of cold-stress-related proteins that are reduced in abundance at ZT12/ED under normal growth temperatures, suggesting that some cold response proteins are diel regulated, likely possessing additional diel roles beyond response to cold stress (Maszkowska et al., 2019; Zhu et al., 2020b). These include: chloroplast-targeted COR15A (AT2G42540) and COR15B (AT2G42530; Artus et al., 1996) as well as cytoplasmic-targeted KIN2/COR6.6 (AT5G15970), ERD10 (AT1G20450), AT1G54410, and AT4G30650. In conjunction with our analyses, these findings directly connect RVE8-like proteins to observable proteome-level changes in genes associated with drought-related stresses.
PKs impacted by RVE8-like proteins
In addition to catalyzing the phosphorylation of target proteins, PKs themselves are often phosphorylated, resulting in changes in their activity, function, or localization, forming a complex signaling web that can have far-reaching ramifications for plant cell function. Our combined quantitative proteomic and phosphoproteomic analysis uncovered a number of PKs that change in either diel abundance or phosphorylation status in response to the loss of RVE8-like proteins. Of particular interest is the increased abundance of CKIIα (AT2G23070), CDPK6/CPK3 (AT4G23650), and WAK1 (AT1G21250) and the phosphorylation of CPK1 (AT5G04870), as these PKs have been implicated in multiple plant cell processes related to rve 4 6 8 phenotypes as well as osmotic- and salt-stress tolerance.
CKII is a well-known clock-associated kinase that directly affects the stability of core clock component CCA1 in Arabidopsis (Sugano et al., 1998; Lu et al., 2011). The role of CKII in modulating the circadian clock is conserved across eukaryotes, with both mammalian (Tamaru et al., 2009) and Drosophila (Akten et al., 2003) circadian clocks being directly impacted by CKII. Most recently, multiple CKI family kinases were discovered to phosphorylate PRR5 and TOC1 leading to their degradation (Uehara et al., 2019). Our finding that CKII levels are elevated in rve 4 6 8 at ZT12 hints at the possibility of RVE8-like proteins similarly directing CKII-mediated phospho-regulation of circadian function. Beyond the clock, CKII has been implicated in phosphorylating numerous light signaling proteins, such as HY5 (Hardtke et al., 2002), which we see here possessing an increase in its phosphorylation status in rve 4 6 8 plants at Ser36 at both ZT0 and ZT12. Recently, HY5 phosphorylation at Ser36 was found to be phosphorylated via involvement of SUPPRESSOR OF PHYTOCHROME A-105 (SPA) kinases (Wang et al., 2021), suggesting that perhaps other CKII-motif-containing proteins resolved here may also represent SPA targets. Lastly, CKII is also characterized as phosphorylating ABA/abiotic stress-induced pathway proteins (Mulekar and Huq, 2014), which aligns with our enrichment of ABA-related GO terms in our phosphoproteomic data.
CDPK6/CPK3 is a positive regulator of ABA-induced regulation of stomatal closure (Mori et al., 2006) and is induced under high salt conditions (Mehlmer et al., 2010), suggesting that its increased abundance in rve 4 6 8 plants may convey signaling events related to osmotic-/salt-stress response. Although CDPK6/CPK3 has not been shown to directly impact the circadian clock, its connection to stomatal regulation, coupled with known diel fluctuations in calcium levels (Marti Ruiz et al., 2020), suggests a connection to the regulation of diel plant cell processes. Similar to CDPK6/CPK3 salt-stress induction, over-expression of native CPK1 resulted in increased salinity tolerance in cell culture (Veremeichik et al., 2021), reinforcing a potential link between diel CPK-mediated phosphorylation events and the ability to mitigate abiotic stress. Alternatively, WAK1 has been implicated in maintaining cell wall integrity (Leschevin et al., 2021), which has diel plant cell growth implications that may contribute to the large mesophyll cell phenotype of rve 4 6 8 plants (Gray et al., 2017).
These results, when combined with our phospho-motif analysis that shows an enrichment in CKII and CDPK/CPK target motifs, suggest that CKIIα and CDPK6/CPK3 may be connected to a substantial portion of the observed RVE8-like dependent phosphoproteome. STRING-DB association network analysis of proteins with these enriched phospho-motifs demonstrates connections to multiple nuclear protein networks including one involving RBR (AT3G12280), a critical growth and development protein, in addition to protein translation and secretion. Collectively, these data provide insight into RVE8-like protein-dependent phospho-networks and the corresponding kinases that may be involved.
Conclusion
Our robust, multi-omic analysis of rve 4 6 8 plants further establishes RVE8-like proteins as targets of agronomic interest by defining the proteomic and metabolic underpinnings of their observable phenotypes. Through these analyses, we found a number of connections to clock-related cell processes that refine our understanding of rve 4 6 8 growth phenotypes. This includes altered metabolism that either directly (e.g. carbohydrates and OAs) or indirectly (e.g. precursors for growth phytohormones) drives growth outcomes. In particular, we found a significant decrease in multiple starch degradation enzymes leading to starch excess at dawn in plants lacking RVE8-like proteins. As well, our findings reveal that RVE8-like proteins control the 26S proteasome through altered 20S and 19S subunit abundance and phosphorylation status, which our metabolite data suggests may be tied to changes in resource pools important for growth and development (e.g. AAs). This connection between the proteasome and the circadian clock through RVE8-like proteins was further supported by a reduction of proteasome activity in rve 4 6 8 plants, a phenomenon that, in proteasome mutants, leads to an enlarged cell size phenotype similar to that observed in rve 4 6 8 plants. This suggests that RVE8-like proteins regulate the proteasome as a means of controlling cell division and growth. Lastly, our multi-omic analyses hint at potential connections between RVE8-like proteins and abiotic stress response (e.g. osmotic, salt, and/or cold—already established), which we see manifesting throughout our proteome, phosphoproteome, and metabolome data. Overall, our combined use of quantitative transcriptomics, proteomics, PTMomics, and metabolomics have elucidated a number of new connections between RVE8-like proteins and critical plant cell processes, laying a substantial foundation from which to build a comprehensive understanding of the roles RVE8-like proteins play in directing diel plant cell regulation.
Materials and methods
Plant growth and phenotyping
Plant growth
WT Arabidopsis (A.thaliana) Col-0 and rve 4 6 8 seeds were obtained from Dr. Stacy Harmer (University of California, Davis). Seeds were sterilized in 70% (v/v) ethanol for 2 min followed by a 30% (v/v) bleach (Chlorox 7.5%) treatment for 7 min and three washes with distilled water. The seeds were then grown on 0.5× MS media and 7 g L−1 of agar at pH 5.8 (with KOH). All seeds were cold treated for 3 days at 4°C in the dark and exposed to light for a week before being transferred to soil (Sungro, Sunshine Mix #1). After 21 days of light exposure, entire plants were collected for analysis. Growth chambers were equipped with a programmable Perihelion LED fixture (G2V Optics Inc. Edmonton, Canada) and lined with Reflectix to ensure a good light diffusion. Plants were grown under a 12:12 LD photoperiod with a temperature of 21°C during the day and 19°C at night. Six LED types (Cree LED XPE, XPE2 XPG families) were used in the fixtures, with characteristic wavelengths of 444 nm, 630 nm, 663 nm, 737 nm, 3,000 K white, and 6500 K white.
Phenomics measurements
Each chamber was equipped with a Raspberry Pi 3 B+ and an ArduCam Noir Camera (OV5647 1080p) with a motorized IR-CUT filter and two infrared LEDs. Pictures were taken every 15 min over 7 days (between 14-day and 21-day post seed imbibition) and were used to extract plant area and perimeter measurement using PlantCV as previously described (Gehan et al., 2017).
Proteasome inhibitor sensitivity seedling growth experiment
Col-0 and rve 4 6 8 seedlings were germinated on 0.5× MS control plates and 0.5× MS plates supplemented with 50 µM MG132 (Millipore Sigma, Burlington, MA, USA; 474787) and grown under 12:12 photoperiod conditions as described above for 6 days prior to imaging.
Starch iodine staining and enzymatic assay
Starch iodine staining and quantification
Starch was stained and visualized in Arabidopsis rosettes by Lugol’s iodine stain. Entire rosettes were decolorized by incubation in 80% ethanol at 80°C for 30 min. Rosettes were rinsed 3 times in distilled water and stained 20 min in a 5% (v/v) Lugol’s iodine solution (Thermo Fisher Scientific, Waltham, MA, USA). After three rinses in distilled water, rosettes were washed for 1 h in distilled water to remove the excess iodine. Rosette leaves were flattened between plastic sheet and excess water was removed. Each rosette was analyzed with ImageJ (Abramoff et al 2004; https://imagej.nih.gov/ij/index.html) to record mean values in starch staining pixel intensity as described by Betti et al. (2016).
Starch extraction and quantification
Starch was extracted and assayed as previously described (Smith and Zeeman, 2006). Frozen rosette leaves were ground to a fine powder and homogenized in 8% (v/v) perchloric acid (Ricca Chemical, Arlington, TX, USA). The insoluble fraction was pelleted and washed 3 times in 80% (v/v) ethanol and resuspended in water. Prior to quantification, the samples were boiled 15 min at 95°C to gelatinize the starch and hydrolyzed with α-amylase and amyloglucosidase (Roche, Basel, Switzerland) to release the glucose blocks. Glucose content was then measured by spectrophotometry after a two enzymes reaction with hexokinase and glucose-6-phosphate dehydrogenase (Roche).
RNA isolation and NanoString
Total RNA was isolated and purified using a modified single step TRIzol protocol (Chomczynski and Sacchi, 1987). Plants were flash frozen and homogenized with two glass beads using a Geno/Grinder for 30 s at 1500g. Immediately after, 1 mL of TRIzol was added to the sample, and the whole was vortexed and incubated for 10 min at room temperature. The samples were then centrifuged at 13,000g for 10 min to remove extracellular material and glass beads. The supernatant was transferred to a new tube. Subsequently, 200 µL of chloroform was added to the mixture and shaken vigorously by hand for 15 s and the samples were kept for 3 min at room temperature. The samples were centrifuged at 13,000g for 15 min at 4°C and the supernatant obtained was transferred to a new tube by gentle pipetting, avoiding the interphase slurry. RNA was precipitated by adding 500 µL of 100% isopropanol and the tubes were incubated for 10 min at RT and centrifuged at 13000g for 10 min at 4°C. After decanting isopropanol, the pellet was washed with 1 mL of 75% (v/v) ethanol in nuclease-free water (IDT) and briefly centrifuged at 7,500g for 5 min at 4°C. Total RNA was suspended in nuclease-free water and stored at 80°C for further use. RNA quantification was performed using a NanoDrop ND 1000 spectrophotometer. The RNA was treated with DNase I, Amp grade (Invitrogen, Waltham, MA, USA) following the instructions provided by the manufacturer. The purified RNA was reverse transcribed to cDNA using the RevertAid RT Kit (Thermo Scientific), according to the manufacturer’s instructions. A minimum of 150 ng of purified RNA in 7.5 μL was sent to NanoString (NanoString Technologies, Seattle, USA, https://www.nanostring.com) for analysis. The NanoString probes were designed and synthesized by NanoString (Supplementary Data Set 1). UBC21 (AT5G25760) was used as a reference gene.
Liquid chromatography–mass spectrometry
Protein extraction
Quick-frozen rosette tissue was ground to a fine powder under liquid N2 using a mortar and pestle. Ground samples were aliquoted into 400 mg fractions. Aliquoted samples were then extracted at a 1:2 (w/v) ratio with a solution of 50-mM HEPES-KOH pH 8.0, 50-mM NaCl, and 4% (w/v) sodium dodecyl sulphate (SDS). Samples were then vortexed and placed in a 95°C table-top shaking incubator (Eppendorf) at 1,100 rpm for 15 min, followed by an additional 15 min shaking at room temperature. All samples were then spun at 20,000g for 5 min to clarify extractions, with the supernatant retained in fresh 1.5-mL Eppendorf tubes. Sample protein concentrations were measured by bicinchoninic acid assay (23225; Thermo Scientific). Samples were then reduced with 10-mM dithiothreitol (DTT) at 95°C for 5 min, cooled, then alkylated with 30-mM iodoacetamide for 30 min in the dark without shaking at room temperature. Subsequently, 10-mM DTT was added to each sample, followed by a quick vortex, and incubation for 10 min at room temperature without shaking. Total proteome peptide pools were then generated using a KingFisher Duo (Thermo Scientific) automated sample preparation device as outlined by Leutert et al. (2019) without deviation. Sample digestion was performed using sequencing grade trypsin (V5113; Promega, Madison, WI, USA), with generated peptide pools quantified by Nanodrop, normalized to 400 µg for phosphopeptide enrichment and acidified with formic acid to a final concentration of 5% (v/v) prior to being desalted using 1cc tC18 Sep Pak cartridges (WAT036820; Waters, Milford, MA, USA) as previously described (Uhrig et al., 2019).
Phosphopeptide enrichment
SepPak eluted peptides were topped up to 65% (v/v) acetonitrile (ACN) and 5% (v/v) trifluoroacetic acid (TFA) prior to enrichment using a KingFisher Duo (Thermo Scientific) automated sample preparation device as outlined by Leutert et al. (2019). We used 500 µg of MagReSyn Ti-IMAC HP matrix (Resyn BioSciences, Gauteng, South Africa) to enrich phosphorylated peptides. Unbound peptides (total proteome) and phosphopeptides were dried then dissolved in 3% (v/v) ACN/0.1% (v/v) TFA, desalted using ZipTip C18 pipette tips (ZTC18S960; Millipore) as previously described (Uhrig et al., 2019). All peptides were then dried and re-suspended in 3% (v/v) ACN/0.1% (v/v) FA immediately prior to MS analysis.
BoxCarDIA MS
Changes in the protein abundancies was assessed using trypsin digested samples analyzed using a Fusion Lumos Tribrid Orbitrap mass spectrometer (Thermo Scientific) in a data-independent acquisition (DIA) mode using the BoxCarDIA method (Mehta et al., 2022). Dissolved peptides (1 µg) were injected using an Easy-nLC 1200 system (LC140; Thermo Scientific) and separated on a 50-cm Easy-Spray PepMap C18 Column (ES803A; Thermo Scientific). A spray voltage of 2.2 kV, funnel RF level of 40 and heated capillary at 300°C was deployed, with all data acquired in profile mode using positive polarity, with peptide match turned off and isotope exclusion selected. All gradients were run at 300 nL min−1 with analytical column temperature set to 50°C. Peptides were eluted using a segmented solvent B gradient of 0.1% (v/v) FA in 80% (v/v) ACN from 4% to 41% B (0–107 min). BoxCarDIA acquisition was performed as previously described (Mehta et al., 2022). MS1 analysis was performed by using two multiplexed targeted SIM scans of 10 BoxCar windows each, with detection performed at a resolution of 120,000 at 200 m/z and normalized AGC targets of 100% per BoxCar isolation window. Windows were custom designed as previously described (Mehta et al., 2022). An AGC target value for MS2 fragment spectra was set to 2,000%. Twenty-eight 38.5 m/z windows were used with an overlap of 1 m/z. Resolution was set to 30,000 using a dynamic maximum injection time and a minimum number of desired points across each peak set to 6.
BoxCarDIA data analysis
All acquired BoxCarDIA data was analyzed in a library-free DIA approach using Spectronaut version 14 (Biognosys AG) using default settings. Key search parameters employed include: a protein, peptide, and PSM FDR of 1%, trypsin digestion with 1 missed cleavage, fixed modification including carbamidomethylation of cysteine residues and variable modifications including methionine oxidation. Data was Log2 transformed, globally normalized by median subtraction with significantly changing differentially abundant proteins determined and corrected for multiple comparisons (Bonferroni-corrected P ≤ 0.05; q-value ≤ 0.05).
DDA MS
Changes in the protein phosphorylation status was assessed using trypsin digested samples analyzed using a Fusion Lumos Tribrid Orbitrap mass spectrometer in a DDA mode using the Universal method (Thermo Scientific). Dissolved phosphopeptides were analyzed as described above, using a linear gradient of solvent B (0.1% (v/v) FA in 80% (v/v) ACN): 5%–22% B, 0–110 min; 22%–35% B, 110–120 min; 35%–95% B, 120–125 min at a flow rate of 0.3 µL min−1 at 50°C. Full scan MS1 spectra (350–2,000 m/z) were acquired with a resolution of 120,000 at 200 m/z with a normalized AGC Target of 125% and a maximum injection time of 50 ms. DDA MS2 were acquired in the linear ion trap using quadrupole isolation in a window of 2.5 m/z. Selected ions were HCD fragmented with 35% fragmentation energy, with the ion trap run in rapid scan mode with an AGC target of 200% and a maximum injection time of 100 ms. Precursor ions with a charge state of +2 to +7 and a signal intensity of at least 5.0e3 were selected for fragmentation. All precursor signals selected for MS/MS were dynamically excluded for 30 s.
DDA data analysis
All acquired DDA phosphoproteomic data was analyzed using MaxQuant version 1.6.14.0 (http://www.maxquant.org/; Cox and Mann, 2008) with the following parameters. A protein, peptide and PSM FDR of 1%, trypsin digestion with 1 missed cleavage, fixed modification including carbamidomethylation of cysteine residues and variable modifications including methionine oxidation and phosphorylated serine, threonine and tyrosine. Data were then imported into Perseus version 1.6.14.0 (Tyanova et al., 2016) for further analysis. This involved the removal of reverse hits and contaminants, log2-transformation, assembly into treatment groups and filtering based on the presence of measured data in at least 2/3 replicates of at least one group. Data were then median normalized, followed by imputation of missing values based on the normal distribution function set to default parameters. All PTM analyses utilized a PTM site localization score threshold ≥0.75. Significantly changing differentially abundant phosphopeptides were determined by ANOVA and corrected for multiple comparisons (Benjamini–Hochberg corrected P ≤ 0.05; q-value).
All proteomic and phosphoproteomic raw data and search parameters have been uploaded to ProteomeXchange (http://www.proteomexchange.org/) via the Proteomics IDEntification Database (PRIDE; https://www.ebi.ac.uk/pride/). Project Accession: PXD029234. Raw search results from MaxQuant and Spectronaut are also available at https://doi.org/10.5281/zenodo.6534174.
GC–MS
Metabolite extraction and preparation
Metabolite extraction and preparation was performed with modifications as previously described (Hill and Roessner, 2013; Liu et al., 2016). Tissue was harvested and directly flash frozen in liquid nitrogen. Samples of 100 mg (±1 mg) of pulverized tissue were prepared and homogenized in 700 µL of ice-cold methanol (80% v/v). Internal standard 25-µL ribitol at 0.4 mg.mL−1 in water. Samples were incubated 2 h at 4°C with shaking and then 15 min at 70°C at 850 rpm in a Thermomixer. Tubes were centrifuged 30 min at 12,000 rpm and the supernatants were transferred to new tubes. Polar and nonpolar phases were separated by the addition of 700 µL of water and 350 µL of chloroform, then vortexed thoroughly and centrifuged for 15 min at 5,000 rpm. The upper methanol/water phase (150 µL) was transferred to a new tube and dried in a vacuum centrifuge at RT. Samples were derivatized with 100 μL of methoxylamine hydrochloride (20 mg.mL−1 in pyridine) for 90 min at 30°C at 850 rpm in thermomixer and followed by incubation with 100 µL of N,O-bis(trimethylsilyl)trifluoroacetamide at 80°C during 30 min with shaking at 850 rpm in a thermomixer.
GC–MS analysis
Finally, samples were injected in splitless mode and analyzed using a 7890A gas chromatograph coupled to a 5975C quadrupole mass detector (Agilent Technologies, Palo Alto, CA, USA). In the same manner, 1 µL of retention time standard mixture Supelco C7–C40 saturated alkanes standard (1,000 µg.mL−1 of each component in hexane) diluted 100-fold (10 µg.mL−1 final concentration) was injected and analyzed. Alkanes were dissolved in pyridine at a 0.22 mg.mL−1 final concentration. Chromatic separation was done with a DB-5MS capillary column (30 m × 0.25 mm × 0.25 µm; Agilent J&W Scientific, Folsom, CA, USA). Inlet temperature was set at 280°C. Initial GC Oven temperature was set to 80°C and held for 2 min after injection then GC oven temperature was raised to 300°C at 7°C min−1, and finally held at 300°C for 10 min. Injection and ion source temperatures were adjusted to 300°C and 200°C, respectively, with a solvent delay of 5 min. The carrier gas (Helium) flow rate was set to 1 mL.min−1. The detector was operated in EI mode at 70 eV and in full scan mode (m/z 33–600).
Metabolite identification and quantification
Compounds were identified by mass spectral and retention time index matching to the mass spectra of the National Institute of Standards and Technology library (NIST20, https://www.nist.gov/) and the Golm Metabolome Database (http://gmd.mpimp-golm.mpg.de/). Metabolite quantification was performed using MassHunter Software from Agilent. Peaks were integrated and after blank subtraction were normalized by dividing them by the peak area of the internal standard ribitol and by the sample weight.
Bioinformatics analysis and data visualization
Visualizations were made using R version 3.6.1 and R package ggplots in combination with Affinity Designer (https://affinity.serif.com/en-us/designer/; version. 1.9.1.179). All data were plotted using GraphPad Prism (version 8; https://www.graphpad.com/scientific-software/prism/). Networks were created in Cytoscape (version 3.7.1; https://cytoscape.org/), using the STRING-DB (https://string-db.org/) and enhancedGrahphics (version 1.5.4; https://apps.cytoscape.org/apps/ enhancedgraphics) cytoscape-apps. All association networks were built without data sub-selection and using an edge threshold ≥0.7). GO Enrichments were performed using TheOntologizer (http://ontologizer.de/) using all identified proteins as the background for enrichment analyses (q-value ≤ 0.05), while phosphorylation motif enrichment analysis was performed using Motif-X (Chou and Schwartz, 2011) on the MoMo MEME suite (https://meme-suite.org/meme/) as previously described (Mehta et al., 2021a, 2021b). Subcellular localization information for proteins was obtained from SUBA4 (https://suba.live/).
Proteasome activity assay
Proteasome activity was measured using the fluorogenic substrate N-Succinyl-Leu-Leu-Val-Tyr-7-Amido-4-Methylcoumarin (Millipore Sigma; S6510) as described Üstün and Börnke (2017). Briefly, 100 µg of rosette tissue of 3-week-old plants was extracted with 250 µL of extraction buffer (2-mM ATP, 50-mM HEPES-KOH (adjusted to pH 7.2 with 1-N KOH); 2-mM DTT; 0.25-M sucrose). After clarifying by centrifugation at 18,000 g for 15 min, total protein content in the extracts was quantified with a Bradford assay (Bio-Rad; Hercules, CA, USA; 5000006). The assay was performed using 50 µg of total protein extract and 300 µM of substrate in assay buffer (100-mM HEPES-KOH pH 7.8, 5-mM MgCl2, 10-mM KCl, and 2-mM ATP) at 30°C. Fluorescence was measured at 1.5-min intervals with an excitation at 360 nm and emission wavelength at 460 nm for a period of 2 h after an initial 2 h incubation. Activity was reported as Relative Fluorescence Units/min based on the slope of the linear portion of the emission curve (MeanV in the Gen5 software).
Statistical analyses
Significantly changing proteins and metabolites were identified using a one-way analysis of variance (ANOVA) followed by a post-hoc t test corrected for multiple comparisons using the Bonferroni and Benjamini–Hochberg methods. Statistical analysis was also performed for individual biological experiments as described in the relevant figure captions.
Accession numbers
All proteomic and phosphoproteomic raw data and search parameters have been uploaded to ProteomeXchange (http://www.proteomexchange.org/) via the Proteomics IDEntification Database (PRIDE; https://www.ebi.ac.uk/pride/). Project Accession: PXD029234. Raw search results from MaxQuant and Spectronaut are also available at https://doi.org/10.5281/zenodo.6534174.
Supplemental data
The following materials are available in the online version of this article.
Supplemental Figure S1. Confirmation of known rve4/6/8 phenotypes.
Supplemental Figure S2. Diel mRNA gene expression analysis of circadian clock and phytohormone related genes in rve 4 6 8 and Col-0 plants.
Supplemental Figure S3. Association network analysis of significantly changing phosphoproteins maintaining enriched PK motifs.
Supplemental Figure S4. Additional replicates for the proteasome inhibitor sensitivity growth assay described in Figure 7B.
Supplemental Table S1. Primer sets used in NanoString analysis.
Supplemental Table S2. All quantified and significantly changing proteome data.
Supplemental Table S3. All quantified and significantly changing phosphoproteome data.
Supplemental Table S4. GO enrichment analysis.
Supplemental Table S5. Comparative analysis of significantly changing phosphorylation sites to significantly cycling phosphorylation sites (JTK-cycle P ≤ 0.05).
Supplemental Table S6. Diel changes in proteasome.
Supplemental Data Set 1. MotifX phospho-motif enrichment analysis using MoMo MEME suite.
Supplemental Data Set 2. GC–MS data.
R.G.U., S.S., and D.M. conceptualized the study. S.S., D.M., Q.L., M.C.R.G., and B.C. performed the research. R.G.U., S.S., and D.M. analyzed the data and wrote the paper with input from all authors.
The author responsible for distribution of materials integral to the findings presented in this article in accordance with the policy described in the Instructions for Authors (https://dbpia.nl.go.kr/plphys/pages/general-instructions) is Richard Glen Uhrig ([email protected]).
Acknowledgments
The authors would like to thank Dr. Stacey Harmer for providing rve 4 6 8 and corresponding WT Col-0 seeds as well as Dr. Pascal Schläpfer for assistance with the MoMo MEME suite. We would also like to thank G2V Optics Inc. for providing their LED lighting system. As well, we would like to thank Jack Moore of the Alberta Mass Spectrometry and Proteomics Facility as well as Broderick Wood, Jacob Blazusiak and Mohamad Jamaleddine of the University of Alberta Faculty of Science Research IT team for their technical assistance.
Funding
This work was funded by the National Science and Engineering Research Council of Canada (NSERC), Mitacs, Alberta Innovates Campus Alberta Small Business Engagement (AI-CASBE), and the Canadian Foundation for Innovation (CFI).
Conflict of interest statement. None declared.
References
Author notes
These authors contributed equally (S.S. and D.M.)
Senior author
