


Abstract
Angiosperm genome evolution was marked by many clade-specific whole-genome duplication events. The Microlepidieae is one of the monophyletic clades in the mustard family (Brassicaceae) formed after an ancient allotetraploidization. Postpolyploid cladogenesis has resulted in the extant c. 17 genera and 60 species endemic to Australia and New Zealand (10 species). As postpolyploid genome diploidization is a trial-and-error process under natural selection, it may proceed with different intensity and be associated with speciation events. In Microlepidieae, different extents of homoeologous recombination between the two parental subgenomes generated clades marked by slow (“cold”) versus fast (“hot”) genome diploidization. To gain a deeper understanding of postpolyploid genome evolution in Microlepidieae, we analyzed phylogenetic relationships in this tribe using complete chloroplast sequences, entire 35S rDNA units, and abundant repetitive sequences. The four recovered intra-tribal clades mirror the varied diploidization of Microlepidieae genomes, suggesting that the intrinsic genomic features underlying the extent of diploidization are shared among genera and species within one clade. Nevertheless, even congeneric species may exert considerable morphological disparity (e.g. in fruit shape), whereas some species within different clades experience extensive morphological convergence despite the different pace of their genome diploidization. We showed that faster genome diploidization is positively associated with mean morphological disparity and evolution of chloroplast genes (plastid–nuclear genome coevolution). Higher speciation rates in perennials than in annual species were observed. Altogether, our results confirm the potential of Microlepidieae as a promising subject for the analysis of postpolyploid genome diploidization in Brassicaceae.
Introduction
Brassicaceae (crucifers) is a cosmpolitan plant family occurring on all continents, except for Antarctica. Hybridization and polyploidization (or whole-genome duplication [WGD]) frequently accompanied the diversification of the Brassicaceae (Kagale et al., 2014; Hohmann et al., 2015; Mandáková et al., 2017a; Walden et al., 2020). The resulting polyploid genomes have not remained static, but returned to pseudo-diploid genomes through the process collectively named diploidization (Thomas et al., 2006), gradually erasing and concealing the signatures of ancient WGD events. In Brassicaceae, more than a dozen of genus- and clade-specific mesopolyploid WGDs, postdating the family-specific paleotetraploid (At-α) WGD (Bowers et al., 2003), were identified (Mandáková et al., 2017a); and even more genome duplications remain to be uncovered (e.g. Guo et al., 2021). While both the mesopolyploidization events and subsequent diploidizations have the potential to increase phenotypic diversity, it was suggested that no key morphological characters or innovations evolved after clade-specific WGDs in Brassicaceae (Walden et al., 2020). Still, fruits, trichomes, leaves, and embryos might be quite diverse even among closely related species, and thus, these characters have been used extensively for the past two centuries in the generic delimitations and tribal classifications in Brassicaceae. Tremendous diversity in fruit morphology, which is the most utilized organ in the classification of Brassicaceae, can be found even in small genera such as Tropidocarpum Hook (4 species; Al-Shehbaz, 2003), or a unigeneric tribe like the Eutremeae (44 spp.), harboring species with the shortest (2 mm) and longest (35 cm) fruits in the family. Indeed, two very different fruit shapes, such as a heart-shaped silicle (Capsella Medik.) and a cylindrical siliqua [Arabidopsis (DC.) Heynh.], may originate through different patterns of anisotropic growth, despite both closely related genera possess a cylindrically shaped gynoecium in the early phase of fruit development (Eldridge et al., 2016). On the other hand, cruciferous taxa are known for virtually every conceivable feature being subject to considerable convergence and reversals (Al-Shehbaz, 2012; Huang et al., 2016; Dong and Ostergaard, 2019; Nikolov et al., 2019). For instance, flat-shaped fruits evolved independently several times in Brassicaceae (Dong and Ostergaard, 2019), floral convergence between distantly related crucifer species may allow for exploitation of the same pollinators (Gómez et al., 2021) and two independently emerged Capsella species (C. orientalis Klokov and C. rubella Reut.) have undergone the convergent reduction of flower size (selfing syndrome) due to similar modulation of gene expression (Wozniak et al., 2020). Due to extensive family-wide morphological parallelism, lacking or incongruent molecular phylogenies, inferring phylogenetic relationships, especially at the tribal level, continue to be problematic.
Australia and New Zealand are home to many endemic crucifer species which, however, belong mostly to only four phylogenetic groups, namely Barbarea W.T.Aiton, Cardamine L., Lepidium L., and the tribe Microlepidieae (Mummenhoff et al., 2001; Heenan, 2017). Tribe Microlepidieae was expanded based on phylogenetic analyses to contain 16 genera and 56 species (Heenan et al., 2012). Only Pachycladon Hook.f. (11 species) is predominantly endemic to New Zealand (one species in Tasmania), whereas the other genera are indigenous to the Australian mainland and adjacent islands (e.g. Kangaroo Island, Tasmania). Among the 15 genera on the Australian mainland, 11 are mono- or oligospecific (i.e. with two or three species), whereas Arabidella (F.Muell.) O.E.Schulz (7 spp.), Menkea Lehm. (6 spp.), Phlegmatospermum O.E.Schulz (4 spp.), and Stenopetalum R.Br. ex DC. (10 spp.) harbor most species (Hewson, 1982; Heenan et al., 2012).
Attracted by chromosome numbers lower than in Arabidopsis [Arabidopsis thaliana (L.) Heynh., 2n = 10], Mandáková et al. (2010a) analyzed chromosome complements of three Microlepidieae species by comparative chromosome painting (CCP) to find out that the bona fide diploid genomes (2n = 8, 10, and 12) originated through an unexpected WGD followed by genome-wide diploidization including descending dysploidy (DD), that is, reduction of chromosome number. A follow-up, more comprehensive phylogenomic study (Mandáková et al., 2017b) showed that the entire monophyletic tribe has descended from a common allotetraploid genome (n = 15) formed by an inter-tribal cross between parental species closely related to the extant tribes Crucihimalayeae (♀, n = 8) and Smelowskieae (♂, n = 7) during the Late Miocene. Following a long-distance dispersal from northeastern Asia or western North America, the mesotetraploid genome diversified into several clades on the Australian mainland (Mandáková et al., 2017b).
The postpolyploid diversification and diploidization in the Microlepidieae did not proceed with equal intensity throughout the tribe—three major clades distinguished by the level of diploidization were detected (Mandáková et al., 2017b). Whereas several genera possess highly reshuffled genomes and low chromosome numbers (n = 4–7; 2.1- to 3.75-fold DD from n = 15), Pachycladon experienced slower diploidization (n = 10; 1.5-fold DD) and some Arabidella species have the least diploidized genomes (n = 12; 1.25-fold DD). Remarkably, a two-fold difference in the level of diploidization was revealed among Arabidella species (Mandáková et al., 2017b). Whereas Arabidellaeremigena (F.Muell.) E.A.Shaw has undergone major (“hot”) diploidization (n = 15 → n = 6), Arabidellatrisecta (F.Muell.) O.E.Schulz showed the slowest (“cold”) postpolyploid diploidization (n = 15 → n = 12).
The available phylogenetic studies in Microlepidieae (Heenan et al., 2012; Mandáková et al., 2017b) clearly demonstrated the widespread convergent evolution of morphological characters used for the delimitation of genera and species in the tribe. A case in point, branched trichomes evolved independently at least 5 times, in Harmsiodoxa O.E.Schulz (3 spp.), Microlepidium F.Muell. (2 spp.), Pachycladon, Pachymitus O.E.Schulz (1 sp.), and Stenopetalum. Other features widely used taxonomically, particularly fruit shape, also exhibit tremendous convergence across the tribe. For instance, A. eremigena and A. trisecta share similar cylindrically shaped fruits, despite the fact that they differ markedly by their genome structure and phylogenetic position (Mandáková et al., 2017b).
Among the 13+ Brassicaceae clades of mesopolyploid origin (Mandáková et al., 2017a), Microlepidieae has become the tribe with the highest number of comparative genomic maps, and for which most extensive knowledge of postpolyploid genome evolution was acquired (Mandáková et al., 2010a, 2010b, 2017b), surpassing even the well-researched tribe Brassiceae (i.e. Brassica crops and their closest relatives). Therefore, the tribe has potential to be the subject for analysis of the course and impacts of postpolyploid genome diploidization including evolution of morphological traits across the diverse geography and climates of Australia and New Zealand.
The aim of this study is to further knowledge on the reticulate phylogenomic patterns and differently phased genome diploidization within Microlepidieae through robust phylogenetic hypotheses. We conducted low-coverage whole-genome sequencing in 39 Microlepidieae genomes, with a focus on Arabidella species differing by the extent of their genome diploidization (Mandáková et al., 2017b). In the absence of a robust nuclear genome phylogeny, phylogenetic relationships within Microlepidieae were resolved using complete chloroplast (cp) sequences, entire 35S ribosomal DNA (rDNA) units and nuclear DNA repeats. These phylogenetic frameworks were used to evaluate the extent of morphological convergence and disparity, and plastid–nuclear coevolution during postpolyploid genome diploidization and cladogenesis. Also, 5S rDNA sequence reads were analyzed to detect potential hybridization events.
Results
Characterizing the plastomes, nuclear rDNAs, and repeatomes
Using the low-coverage whole-genome sequencing data, we assembled the cp genomes, retrieved the sequences of the 35S rDNA, and characterized repeatomes of 39 Microlepidieae genomes (for accession data, see Supplemental Table S1). The length of the plastome sequences ranged from 153,821 bp in Stenopetalum nutans F.Muell. to 155,476 bp in Arabidella chrysodema Lepschi & Wege (Supplemental Table S2). We annotated a total of 132 genes (113 unique genes), including 87 protein coding, 37 tRNA, and 8 rRNA genes. The assembled length of nuclear 35S rDNA sequences varied from 5,939 bp in S. decipiens E.A.Shaw to 8,236 bp in A. filifolia (F.Muell.) E.A.Shaw (Supplemental Table S1). Due to incomplete assemblies of the highly variable intergenic spacer (IGS) region, we only utilized the conservative 18S-ITS1-5.8S-ITS2-26S region in downstream analyses.
By performing de novo repeatome identification using RepeatExplorer2 (Novak et al., 2013, 2020), the major repeat content in 39 Microlepidieae genomes was estimated to range from ∼23% to 63% (Supplemental Table S3), taking into account the limitations of RepeatExplorer applied to low-coverage sequence data, for example, that less abundant repeats may be missed (Novak et al., 2020). In all Microlepidieae genomes, the predominant repeat type was the long terminal repeat (LTR) retrotransposons. The abundance of satellite repeats was highly variable, with the most remarkable expansion of the 174-bp BaSAT1 satellite repeat (Finke et al., 2019) accounting for >10% of the Ballantinia antipoda (F.Muell.) E.A.Shaw genome. BaSAT1-like satellite sequences (c. 70% sequence similarity) were also identified in Blennodia pterosperma R.Br., Menkea villosula (F.Muell. & Tate) J.M.Black and Phlegmatospermum richardsii (F.Muell.) E.A.Shaw.
Phylogenomic analyses retrieved four intra-tribal clades in Microlepidieae
Based on 76 PCGs in 60 plastomes of Microlepidieae and outgroup species, we compiled a gap-free alignment matrix with 60,987 columns, of which 3,911 were parsimony informative. The same topology was inferred through maximum likelihood (ML) and Bayesian inference (BI) approaches, retrieving the Microlepidieae as a monophyletic group sister to the tribe Crucihimalayeae and resolving four strongly supported intra-tribal clades (bootstrap support [BS] > 90 and posterior probability = 1; Figure 1; Supplemental Figure S1). Clade A represents the previously defined crown-group genera (Mandáková et al., 2017b) including two Arabidella species (A. eremigena, Arabidellaprocumbens [Tate] E.A.Shaw) and Menkea crassa E.A.Shaw. Clade B, consisting of four Arabidella species (A. filifolia, Arabidellaglaucescens E.A.Shaw, Arabidellanasturtium [F.Muell.] E.A.Shaw, and A. trisecta), and Irenepharsus magicus Hewson are sisters to the crown-group clade. Clades C and D appear as successive sisters to clades A + B, whereby clade C harbors only Pachycladon species, and clade D includes A. chrysodema and two Menkea species (M. sphaerocarpa F.Mull. and M. villosula). Of the six genera represented by at least two species, three genera (Blennodia, Pachycladon, and Stenopetalum) were retrieved as being monophyletic, Arabidella and Menkea as polyphyletic, and both Cuphonotus O.E.Schulz species clustered with the crown-group Arabidella species. Hence, seven Arabidella species were placed in clades A, B, and D, whereas three Menkea species were split between clades A and D.
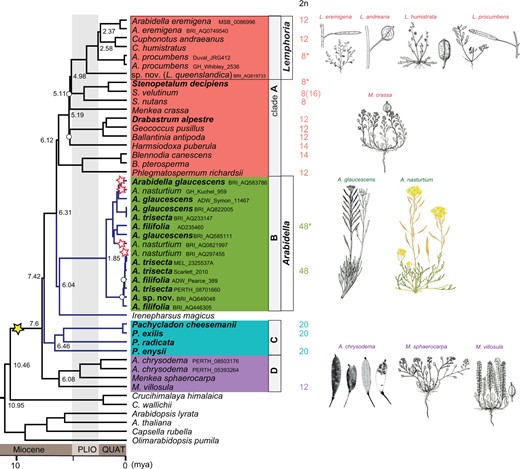
Plastome phylogeny of Microlepidieae. A simplified ML phylogeny based on concatenated 76 plastid PCGs (see Supplemental Figure S8 for a full version of the tree). Four intra-tribal clades were retrieved as clade A (the crown group), B (Arabidella), C (Pachycladon), and D (A. chrysodema and two Menkea spp.); blue-colored branches highlight slowly diploidizing clades and perennial species are in bold. Chromosome counts (2n) for the analyzed accessions are given, asterisked chromosome counts were established in this study. The yellow star indicates the tribe-specific allotetetraploidization, while red stars represent the minimal number of neo-mesotetraploid WGDs in Arabidella based on chromosome counting and cytogenomic analyses (Figure 2). Numbers within the tree represent divergence-time estimates based on MCMC tree analysis (Supplemental Figure S8). White circles at tree nodes represent bootstraps <90. PLIO: Pliocene, QUAT: Quaternary.
The 5,875-bp alignment matrix of nuclear 35S rDNA sequences was based on 45 accessions analyzed (Supplemental Table S1). Whereas our ML and BI analyses (Supplemental Figures S2 and S3) corroborated the four intra-tribal clades within the plastome-based tree, the relationships between the clades differed. The rDNA-based phylogeny strongly supported (BS = 100) a sister relationship between the crown group (clade A) and I.magicus, and moderately supported (BS = 89) grouping of this clade and Pachycladon. Clade B (4 Arabidella spp.) was weakly supported (BS = 67) as sister to clade D. Congruently with the plastome trees, the rDNA phylogenies corroborated Arabidella and Menkea being polyphyletic, and Cuphonotus clustered with crown-group Arabidella species.
To support the above inferred phylogenetic hypotheses, we analyzed relationships among Microlepidieae taxa based on similarities between shared repeat clusters. First, we have comparatively analyzed abundances of major repeat types in the 19 Microlepidieae genomes representing four intra-tribal clades using the RepeatExplorer2 platform. We identified 260 clusters of repetitive sequences that showed moderate to high abundances representing 18 repeat classes (Supplemental Figure S4). Topologies of the repeatome-based tree (Supplemental Figure S5) overall resembled the rDNA-based reconstruction. A consensus network (Supplemental Figure S5A), summarized from neighbor-joining (NJ) trees based on 33 out of the top 100 repeat clusters, corroborated the grouping of 12 Microlepidieae genomes into the four intra-tribal clades and retrieved a fifth clade formed by I.magicus. When Pachycladon (clade C) was omitted, I. magicus clustered with the crown group (Supplemental Figure S5B). Subsequently, we tested the performance of the repeatome-based phylogenies with respect to the diversity of identified repeated sequences (Supplemental Figure S6). Ty3/Gypsy retrotransposons, the most abundant repeat type in Microlepidieae genomes, produced phylogeny most congruent with the network based on all repeats. Consensus networks based on less abundant repeat types (e.g. Ty1/copia, DNA transposons) provided less resolved relationships.
A repeat-based phylogenetic analysis of all sequenced Arabidella accessions retrieved three phylogenetic clusters (Supplemental Figure S5C), corresponding to clades A, B, and D in the plastome and rDNA phylogenies. Comparison of repeat graphs revealed three distinct repeatome profiles of the Arabidella acccessions (Supplemental Figure S7).
Taxonomic considerations
The largely congruent phylogenetic analyses of the well-sampled Microlepidieae clearly support their division into four intra-tribal clades (Figure 1). Four Arabidella species including the generic type (A. trisecta) always formed a monophyletic clade, whereas A. eremigena, A. procumbens, a recently recognized species and two Cuphonotus species clustered together as a sub-clade within the crown group. The latter five species ought to be recognized as members of the genus Lemphoria O.E.Schulz (Lysak et al., 2022) and are referred to as Lemphoria species from here on (L. andraeana, L. eremigena, L. humistrata, L. procumbens (Tate) O.E.Schulz and L. queenslandica Edginton, Al-Shehbaz & Lysak). As recently circumscribed (Lysak et al., 2022), the genus Arabidella harbors four species (Arabidellafilifolia, A. glaucescens, A. nasturtium, and A. trisecta). The corresponding formal nomenclatoric treatments of Arabidella and Lemphoria will be published separately. To settle taxonomic assignment of taxa in Clade D (A. chrysodema and two Menkea species), further phylogenetic analysis including all Menkea species is required.
Dated plastome phylogeny revealed the late divergence of Arabidella
Based on the plastome phylogeny and two secondary calibration points (see “Materials and methods”), the split between Microlepidieae and its closest tribe, Crucihimalayeae, was dated to 10.46 million years ago (Mya; highest posterior density [HPD] interval = 7.78–13.29; Supplemental Figure S8) during the Late Miocene (Tortonian). The Microlepidieae tribe underwent episodes of rapid diversification between 6 and 8 Mya (Messinian), leading to the successive divergence of the four intra-tribal clades. Consequently, the cladogenesis within three of these clades occurred almost simultaneously: the crown-group clade at 6.12 Mya (95% HPD: 4.62–7.82), Pachycladon at 6.46 Mya (95% HPD: 4.68–8.44) and Clade D at 6.08 Mya (95% HPD: 4.38–7.81). The divergence of Arabidella species has occurred much later, at around 1.85 Mya (95% HPD: 1.16–2.59), in Pleistocene.
Mesotetraploid and neo-mesotetraploid Arabidella genomes
The 24 chromosome pairs in A. trisecta (2n = 48) were previously shown to result from a younger, most likely autopolyploid WGD postdating the tribe-specific mesotetraploid event (Mandáková et al., 2017b). Here, we aimed to further elucidate genome evolution in Arabidella through comparative cytogenomic analysis of more populations. Fluorescently labeled chromosome-specific BAC contigs of A.thaliana were used to paint chromosomes of Arabidella and Lemphoria species, and the genomically unknown I.magicus. As these painting probes identify unique chromosomal regions in the diploid Arabidopsis genome, two genomic copies are indicative of the tribe-specific WGD, whereas four copies reflect the tribal WGD plus an additional, more recent, genome duplication (Mandáková et al., 2017a, 2017b). Three painting probes labeling two homoeologous regions within the haploid genome of L. eremigena (2n = 12), L. procumbens (2n = 8), and I. magicus (2n = 20; Supplemental Figure S9) corroborated their mesotetraploid origin (Figure 2). In A. trisecta, two genomic copies were identified in the mesotetraploid (2n = 24) population, whereas four copies in the neo-mesotetraploid population (2n = 48). A younger WGD was also detected in the analyzed 2n = 48 populations of A. filifolia and A. nasturtium (Figure 2). The neo-mesotetraploid (2n = 48) populations of A. trisecta originated from the 24-chromosome cytotype via autopolyploidy as evidenced by (1) morphological similarity of both cytotypes, (2) perfect collinearity of four chromosome sets in the neo-mesotetraploid cytotype (Mandáková et al., 2017b), and (3) duplicated number of 5S and 35S rDNA loci in the neo-mesotetraploid cytotype (Figure 2).
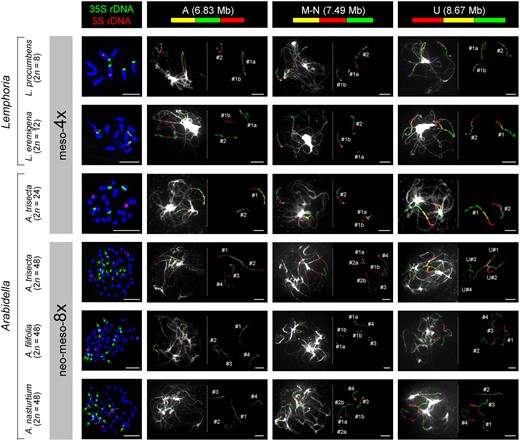
Cytogenetic analysis of Arabidella and Lemphoria genomes. The left side panel shows mitotic chromosome counts and FISH localization of 5S and 35S rDNA probes. The remaining panels display identification of three ancestral genomic blocks (GBs) by CCP on pachytene chromosomes of Arabidella/Lemphoria species. Two genomic copies of GBs (#1, #2) in Lemphoria spp. and the diploid cytotype of A. trisecta (2n = 24) reflect the tribe-specific mesotetraploid WGD. The four genomic copies (#1–#4) in the tetraploid cytotype of A. trisecta and two other Arabidella spp. (all 2n = 48) correspond to the mesotetraploid WGD plus an additional genome duplication(s). DNA probes were detected as fluorescence of Cy3 (yellow), Alexa 488 (green) and Texas Red. Chromosomes at mitosis and pachytene were counterstained with DAPI. Scale bars, 10 µm.
Evidence of frequent hybridization and introgression in Arabidella
Graph clustering of Illumina reads corresponding to the repetitive 5S rDNA could produce a simple circle in diploid species and more complex structures in allopolyploid/hybrid genomes (Garcia et al., 2020). Using this approach, we observed simple circular structures in most Microlepidieae species (Supplemental Figure S10). Complex structures, composed of two or more loops interconnected by a junction region, were only identified in three accessions of A. nasturtium (BRI_AQ0821997, BRI AQ297455, GH_Kuchel_959), one population of A. glaucescens (BRI_AQ583786) and Harmsiodoxa puberula E.A.Shaw. We next asked whether footprints of hybridization could be detected among assembled plastome and 35S rDNA sequences, as the phylogenies based on the two datasets show partly conflicting topologies, including the relationships among Arabidella species (Figure 1; Supplemental Figure S2). As expected, our HyDe analyses showed that Arabidella accessions, especially the above-mentioned ones, were frequently detected as potential hybrids before correction for multiple testing (Supplemental Table S4).
By testing for putative hybridizing triplets using comparative three-genomic analysis of both 5S and 35S rDNA sequences with RepeatExplorer, we further corroborated the hybridization events and identified putative progenitor genomes. For 5S rDNA, the accessions BRI_AQ822005 (A. glaucescens) and MEL_2325537A (A. trisecta) were identified as putative parental genomes of A. nasturtium (BRI AQ297455; Figure 3A). Similarly, the sequence of MEL_2325537A (A. trisecta) and ADW_Pearce_389 (A. filifolia) showed the highest affinity to A. glaucescens (BRI AQ583786; Figure 3B). The putative hybrid origin of the BRI AQ583786 accession was also confirmed by a three-genome comparison of the 18S-IGS region of 35S rDNA (Supplemental Figure S11). We failed to identify putative parental genomes contributing to the complex 5S rDNA structure in H. puberula (Supplemental Figure S12).
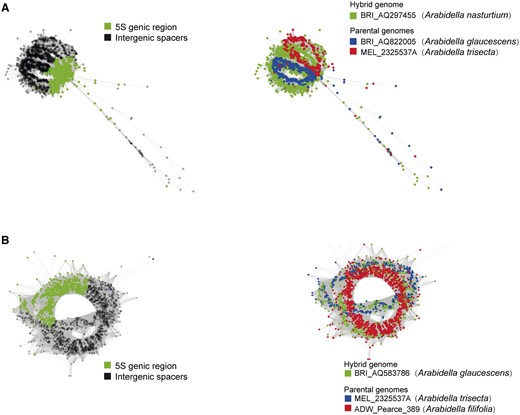
Graphical output of the three-genomic comparative 5S rDNA analyses including presumable hybrid and parental genomes. The results were visualized in two ways to show the clustering patterns of 5S genic region versus IGS domains, as well as the source of the input reads. A, Comparison between the hybrid accession BRI_AQ297455 (Arabidella nasturtium) and its putative parental accessions BRI_AQ822005 (A. glaucescens) and MEL_2325537A (A. trisecta). B, Comparison between the assumed hybrid accession BRI_AQ583786 (A. glaucescens) and its putative parental accessions MEL_2325537A (A. trisecta) and ADW_Pearce_389 (A. filifolia).
The evolution of chloroplast genomes associates with intra-tribal cladogenesis
To compare the evolutionary rates of the chloroplast genome among Microlepidieae clades, we estimated the substitution rates in PCGs in each species using Crucihimalaya himalaica (Edgew.) Al-Shehbaz et al. as a reference. The average rate across Microlepidieae species was 9.36 × 10⁻¹⁰ substitutions per site per year, with higher rates in the crown group (9.93 × 10⁻¹⁰) and Clade D (1.02 × 10⁻⁹), and lower rates in Arabidella (8.95 × 10⁻¹⁰), Pachycladon (7.87 × 10⁻¹⁰), and I.magicus (7.79 × 10⁻¹⁰) (Figure 4A; Supplemental Table S5). We observed that plastome genes in the crown-group clade and Clade D species evolved significantly faster than those in Arabidella and Pachycladon (P < 0.01, two-tailed t test). In addition, genes in Pachycladon species evolved slower than those in Arabidella (P < 0.01, two-tailed t test).
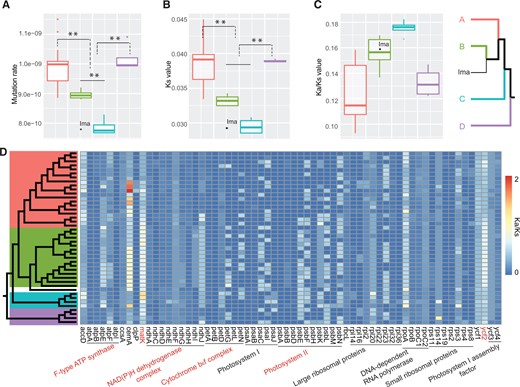
Mutation rate variation and selective pressure among the four intra-tribal Microlepidieae clades. A–C, Boxplots showing the difference in substitution rates (A), Ks (B), and Ka/Ks (C) of plastome genes between Microlepidieae species with fast (the crown group and Clade D, n = 18, 4) and slow diploidization rates (Arabidella, Irenepharsus, and Pachycladon, n = 15, 1, and 4, respectively). The plastid genes of C. himalaica were used as the reference. Boxes indicate the first and third quartiles, and horizontal bars represent the median values for each clade. Color coding in (A)–(C) corresponds to intra-tribal clades in simplified plastome phylogeny at the far right (clade A: the crown group, clade B: Arabidella; clade C: Pachycladon; clade D: Arabidella chrysodema/Menkea spp., Ima: I. magicus). D, The heatmap of Ka/Ks values sorted according to gene functions (x-axis) and the plastome phylogeny (y-axis). Red lettering indicates significant differences between fast and slowly diploidizing clades (P < 0.01; two-tails t test).
To investigate the variation in selective pressure of chloroplast genes, we estimated the ratios of nonsynonymous (Ka) and synonymous (Ks) substitution rates between the sequences of 64 PCGs of Microlepidieae species and C. himalaica; the remaining 12 genes were excluded because of their extremely low variation (Ks = 0 in at least one species). The mean Ks values varied between 0.0285 and 0.0449, with significantly higher values in the crown-group clade and Clade D than in Arabidella, Irenepharsus Hewson, and Pachycladon (P < 0.01, two-tailed t test; Figure 4B; Supplemental Table S6). All PCGs of Microlepidieae plastomes showed signatures of purifying selection, that is, Ka/Ks values between 0 and 1, except for matK (maturase K) and cemA (chloroplast envelope membrane protein) in multiple species (Supplemental Table S7). However, the clades with slow-evolving plastid genes (i.e. Arabidella, Irenepharsus, and Pachycladon) showed higher Ka/Ks values than those with fast-evolving genes (crown-group and D clades; Figure 4C). Interestingly, except for matK and ycf2, genes accounting for the difference between fast and slowly evolving clades encode subunits of four protein complexes including F-type ATP synthase, NADH dehydrogenase complex, cytochrome b6f complex, and Photosystem II (Figure 4D), which are all involved in light-dependent reactions of photosynthesis (Wicke et al., 2011).
Species diversification and life-form transition
As a possible link between species diversification and life forms (annuality versus perenniality) was proposed in our earlier study (Mandáková et al., 2017b), we re-investigated this relationship based on the expanded phylogeny and taxon sampling. Our Bayesian Analysis of Macroevolutionary Mixtures (BAMM) analyses failed to detect any rate shifts during the diversification of Microlepidieae (Supplemental Figure S13A). The global speciation rate (λ), extinction rate (μ), and net diversification rate (γ) in Microlepidieae were estimated as 0.355 (95% quartile = 0.247–0.508), 0.112 (95% quartile = 0.007–0.327) and 0.244 (95% quartile = 0.140–0.340) species per million years (myr), respectively. Following the initial divergence of the tribe during late Miocene, the speciation rates showed a steady decline, while the extinction rates remained nearly constant (Supplemental Figure S13, B–D).
Ancestral state reconstruction inferred annuality, with a likelihood of 78.4%, to be the most likely ancestral life form in Microlepidieae (Supplemental Figure S14). The best-fitting model in BiSSE analyses suggested different speciation and transition rates but equal extinction rates between life forms (Supplemental Table S8). The model estimated a higher speciation rate in perennials than in annuals (0.468 versus 0.107 species/myr) with extremely low extinction rates (<10−8) for both life forms. We observed multiple independent transitions from annuality to perenniality along the phylogeny, with Drabastrum alpestre (F.Muell.) O.E.Schulz, some Stenopetalum, all Pachycladon, and three Arabidella species being perennials. Although A. nasturtium is usually recorded as having an annual life cycle, the species can be a short-living perennial in some circumstances (our observation). The perennial-to-annual transition rate was over 3 times higher than that of annual-to-perennial (0.474 versus 0.137 events/lineage/myr). In addition, our HiSSE analyses failed to detect the impact of any hidden effect on species diversification with life form transitions (Supplemental Table S9). Notably, our analyses were unlikely biased due to the oversampling of Arabidella accessions, as we recovered the difference between annuals and perennials using a pruned phylogeny with 36 (instead of 43) tips representing accessions/species sufficiently divergent from each other (see “Materials and methods”).
Morphological trait evolution
To investigate the morphological evolution among Microlepidieae genera, we compiled a matrix for the presence/absence variation (PAV) in 27 states of eight phenotypic characters (coded as A–H; Figure 5A). The overall patterns of PAV among the selected traits showed high levels of homoplasy: 24 (out of 27) character states were present in more than 2 genera, and 21 character states were present in more than 2 clades (Figure 5A; Supplemental Figure S15). Whereas none of the characters had clade-specific PAV, 3 character states displayed genus-specific presence, including the fusiform fruit shape in Scambopus O.E.Schulz, the obcordate fruit shape in Microlepidium, and the aseriate seed arrangement in Ballantinia (Figure 5A; Supplemental Table S10).

Morphological trait evolution across Microlepidieae. A, The simplified plastome phylogeny with heatmaps showing the PAV of 27 character states of 8 traits and the disparity for each trait realized at the genus level (see Supplemental Tables S10–S11). The circles (a and b) in the phylogeny indicate weakly supported nodes shown in Figure 1. The color scale bar indicates the range of disparity. The columns of disparity are sorted by the mean values for all genera, with the highest value on the left. The eight traits (A–H) and their states are listed in the rightmost box; states of trait E are detailed in Supplemental Figure S16. B, The relationship between mean disparity for all traits and species number across genera (see Supplemental Table S11 for more details). Colors correspond to four clades in (A) or otherwise indicate genera either not assigned to a clade or not included in the phylogeny in (A). C, Morphological evolutionary rate (i.e. the number of character changes myr) across Microlepidieae. Each circle represents an internal node in the phylogeny in (A); circles a and b represent outlier nodes with rapid morphological changes.
The estimated means of morphological disparity (i.e. the proportion of states per morphological character within or among species) showed a slight but significant positive correlation with the number of species (Pearson correlation: n = 17, r = 0.753, P < 0.001; Supplemental Table S11). We detected higher disparity in the crown-group genera, especially in Lemphoria and Stenopetalum (Figure 5, A and B; Supplemental Table S11). In contrast, Arabidella and Pachycladon displayed lower mean disparity than genera with the same or even smaller number of species (Figure 5B).
The inferred rates of character changes were generally low except for two early-diverging sub-clades of the crown-group clade (Figure 5C). Interestingly, these two nodes had the lowest BS in the plastome ML tree and displayed major conflicts between the plastome and rDNA phylogenies (Figure 1; Supplemental Figures S1–S3). Furthermore, δ-statistic analysis suggested that the presence or absence of character states was randomly distributed across the plastome phylogeny (Supplemental Table S12). Altogether, our analysis suggests that changes of most morphological traits occurred at a low rate and independently in each genus during the evolution of Microlepidieae.
Discussion
Four intra-tribal clades in Microlepidieae
With expanded taxon sampling and cp genome sequences, we have obtained a robust maternal phylogeny of the tribe Microlepidieae. The plastome-based phylogeny, largely congruent with phylogenetic analyses based on the nuclear 35S rDNA and repeatome sequences, (1) corroborated the repeatedly retrieved monophyly of the tribe (Warwick et al., 2010; Heenan et al., 2012; Mandáková et al., 2017b; Walden et al., 2020) resulting from an ancestral mesoallotetraploid event (Mandáková et al., 2017b) and (2) identified four highly supported intra-tribal clades (Figure 1). The four clades are formed by (A) the largest “crown group” of eight genera (c. 26 species), (B) genus Arabidella (4 spp.), (C) genus Pachycladon (11 spp.), and (D) clade comprising A. chrysodema and two Menkea spp. The position of Irenepharsus (3 spp.) remains unresolved due to the cytonuclear discordance placing the genus either as sister to Arabidella (Figure 1) or as an early branch within the crown-group clade (Supplemental Figure S2). Both phylogenies differ by the position of Pachycladon, which is sister to the crown group plus Arabidella in the plastome tree (Figure 1), but sister to the crown group and Irenepharus in the rDNA phylogeny (Supplemental Figure S2). Regardless the cytonuclear discordance, the four intra-tribal clades congruently recovered in all phylogenetic analyses, allow for phylogenetically informed analysis of postpolyploid genome diploidization and cladogenesis in Microlepidieae.
Intra-tribal cladogenesis mirrors different speed of postpolyploid diploidization
Whereas mesotetraploid genomes of the early branching A. chrysodema/Menkea clade and the crown group have been extensively diploidized, Arabidella and Pachycladon genomes are slowly diploidizing (Figure 1). Chromosome number of 2n = 20 shared by I.magicus and Pachycladon species and the absence of an additional WGD, place Irenepharsus with the slowly diploidizing Microlepidieae genomes (Figure 1). The slowest diploidization occurred in Arabidella via the formation of four fusion chromosomes reducing the ancestral chromosome number from n = 15 to n = 12 (Mandáková et al., 2017b). Compared to Arabidella, the crown-group species experienced up to a three times more extensive chromosomal diploidization (n = 15 → n = 4; Mandáková et al., 2010a, 2017b). The four recovered intra-tribal clades mirror the varied diploidization of Microlepidieae genomes, suggesting that the intrinsic genomic features underlying the extent of diploidization are shared among genera and species within one clade.
Plastome variation reveals cytonuclear interactions during postpolyploid diploidization
Establishing interactions between nuclear and plastome genomes is essential to the evolutionary success of hybrid lineages (Burton et al., 2013). In plant allopolyploids, challenges within the hybrid genomes might occur immediately or after several generations (Sehrish et al., 2015; Gyorfy et al., 2021) and can cause expression changes, homogenization, or loss of nucleus-encoded plastid-targeted genes (Gong et al., 2012, 2014; Sharbrough et al., 2021). In addition, accelerated chloroplast genome evolution could have resulted from exogenous selection (Muir et al., 2015). We observed significantly higher synonymous substitution rates in plastomes of the fast-diploidizing Microlepidieae clades than in less diploidized genomes of Arabidella, Irenepharsus, and Pachycladon (Figure 4). Interestingly, higher synonymous substitution rates were detected for duplicated nuclear genes in S.nutans (the crown-group, 2n = 8) than those in Pachycladon exilis (Heenan) Heenan & A.D.Mitch. (2n = 20; Mandáková et al., 2017a). Moreover, we found that plastid genes participating in light-dependent reactions of photosynthesis showed different signatures of selection pressure between clades with fast versus slow genome diploidization. Thus, enzyme complexes comprising both nucleus- and plastid-encoded subunits might have different responses to a genome merger after hybridization. In diploidizing polyploids, cytonuclear interactions might be associated with the extent and tempo of diploidization of the nuclear genome (Sharbrough et al., 2017). While an increase in substitution rates of nuclear genes in diploidizing polyploids has occurred in multiple lineages (Kagale et al., 2014; Mandáková et al., 2017a; Guo et al., 2021), the evolutionary responses of plastomes were rarely addressed (Ferreira de Carvalho et al., 2019). Our results demonstrate, for a mesopolyploid Brassicaceae clade, that plastid genes may co-evolve with the nuclear genomes undergoing slower or faster postpolyploid diploidization (PPD). However, it remains unclear whether the cytonuclear interaction could be a direct (intrinsic) consequence of PPD or whether it can be linked to extrinsic factors such as climate or environmental changes (Muir et al., 2015; Hu et al. 2015). Similar studies in other mesopolyploid versus nonmesopolyploid Brassicaceae tribes should shed more light on the frequency and underlying factors of co-evolution of nuclear and plastid genes during diploidization.
Postpolyploid diploidization and evolution of morphological traits
After a WGD, polyploid genomes undergo diploidization potentially resulting in a continuum of more or less reproductively isolated populations, and eventually species and clades. Genome multiplication (autopolyploidy) or genome merger (allopolyploidy) may trigger diverse diploidization trajectories largely based on different fates of gene duplicates. The variation in morphological characters among the diploidizing genomes and species is to a large extent controlled by gene expression changes resulting from, for example, gene neofunctionalization, gene fractionation/loss, or biased gene expression (Zhu et al., 2017; Stitzer and Ross-Ibarra, 2018; Wu et al., 2018; Arya et al., 2021). These processes may have several possible outcomes, such as morphological disparity despite the shared ancestry, or morphological convergence despite independent diploidization of polyploid genomes (Tate and Simpson, 2003). In two Brassica L. species, B. oleracea L. and B. rapa L., similar morphotypes (e.g. cabbage versus Chinese cabbage) have evolved in parallel during independent diploidization associated with domestication of the mesohexaploid ancestral genome. In contrast, both Brassica species exhibit considerable intra-specific morphological variation, such as leaf heading cabbages and tuber-forming morphotypes (Cheng et al., 2016). Another mesohexaploid species, Moricandia arvensis (L.) DC., exhibits even within-individual seasonal disparity of floral characters (Gómez et al., 2020), whereby the seasonal plasticity may allow for exploitation of the same pollination niches due to phenotypic convergence between only distantly related crucifer species (Gómez et al., 2021). Some allopolyploid plant species may morphologically resemble more one of the two parental species due to biased gene expression after the genome merger (Alexander-Webber et al., 2016). Collectively, morphological convergence or disparity may hamper retrieving true phylogenetic relationship among species of diploidizing polyploid lineages.
Morphological convergence was frequently observed across Brassicaceae tribes (Hall et al., 2011; Huang et al., 2016; Hao et al., 2017; Walden et al., 2020). In Microlepidieae, highly supported phylogenetic analyses uncovered several instances of convergent evolution of some morphological characters and, conversely, considerable intra-tribal phenotypic disparity. For instance, Arabidella and Lemphoria show convergent fruit morphology which was interpreted by Shaw (1965) as a shared character justifying the merger of both genera. Superficially similar leaves of L. procumbens and A. chrysodema led to the inclusion of the latter species in Arabidella (Wege and Lepschi, 2007). On the contrary, two Cuphonotus species were recognized as a genus on its own and believed to be closely related to Phlegmatospermum based on fruit morphology (Shaw, 1974). However, both Cuphonotus species form a monophyletic clade with Lemphoria species, and thus, both orbicular silicles (L. andraeana, L. humistrata) and cylindrical siliques (remaining three Lemphoria species) are found within a single genus. Comparable fruit-type disparity is encountered in a yet taxonomically unsettled clade harboring A. chrysodema (elliptic latiseptate siliques) and two Menkea species (obovoid silicles with a reduced or absent septum).
Our results indicate that morphological disparity does not necessarily correspond with species richness of Microlepidieae genera. The decoupling of morphological disparity and species diversity is quite common and could highlight the importance of other intrinsic or extrinsic factors that drive the morphological diversity (Oyston et al., 2016), for example, geographical distribution (Chartier et al., 2017, 2021) and additional WGDs (Walden et al., 2020). We noticed that clades/genera with higher mean disparity have experienced faster genome diploidization (Figure 5B). However, our analysis of morphological rate, congruently with recent studies in different organisms (Parins-Fukuchi et al., 2021; Stull et al., 2021), suggested overall low speed of character evolution with episodes of rapid changes that coincided with strong phylogenetic conflicts (Figure 5C). Therefore, the considerable morphological convergence across Microlepidieae could be best explained by gene-level diploidization that proceeded in parallel despite different pace of their genome-level (structural) diploidization. Although WGDs of different ages per se (without apparent diploidization) could alter phenotypic traits in polyploids (McCarthy et al., 2016), our study provides empirical evidence of the impact of PPD on morphological disparity in a mesopolyploie plant clade. As WGD-diploidization cycles occurred frequently during the angiosperm evolution, we propose that more polyploid models and rigorous tests (Clark and Donoghue, 2018) should be developed to investigate the impact of these genomic processes on evolution of morphological traits.
Although we have not examined the evolutionary trajectory of morphological evolution in Microlepidieae in the context of a robust nuclear phylogeny, our conclusions were based on evolutionary patterns at the level of major clades, whose monophyly has been consistently supported by multiple sources of evidence (plastome, rDNA, genomic repeats, and extent of chromosomal diploidization). In addition, the analysis of character PAV and disparity does not rely on statistical tests based on a fully resolved species-level phylogeny. Despite the apparent conflict with the plastome tree, we detected congruent patterns based on rDNA phylogeny, that is, low rates of morphological changes in general, a lack of phylogenetic signal in characters, and different diversification rates between annuals and perennials. Future studies combining comparative genomic and functional analyses should be able to identify the genetic basis underlying phenotypic changes during diploidization.
Life-form transitions during postpolyploid diversification
Our BAMM analyses revealed a continuous decrease in diversification rates after the initial divergence of Microlepidieae c. 10 Mya (Supplemental Figure S13A). The estimated mean values of both speciation (0.36 species/myr) and extintion rate (0.11 species/myr) were slightly higher than the recent estimates of 0.31 and 0.08 species/myr, respectively (Huang et al., 2020). The lack of shifts in speciation rate across the Microlepidieae phylogeny supports the notion that diversification was largely decoupled from WGDs and/or diploidization (Tank et al., 2015; Smith et al., 2018; Huang et al., 2020; Walden et al., 2020; but see Landis et al., 2018). In addition, our BiSSE analyses pinpointed higher speciation rates in perennials (0.468 species/myr) than annuals (0.107 species/myr), with a stronger tendency of transition from perenniality to annuality than in the opposite direction (Supplemental Table S8). Contrary to the expectation that rates of molecular evolution are higher in annuals (reviewed by Friedman, 2020), higher speciation rates in perennials were observed in several studies (e.g. Drummond et al., 2012; Azani et al., 2019) but the causes behind these observation remain unclear. In Microlepidieae, higher speciation rate in Arabidella and Pachycladon could be tentatively linked to their stable genome structures (Mandáková et al., 2010b; Mandáková et al., 2017b), which may allow for frequent homoploid hybridization (Becker et al., 2013; Joly et al., 2014). The directional bias in life-form transition appeared to be general in diverse herbaceous plant lineages (Bena et al., 1998; Andreasen and Baldwin, 2001; Datson et al., 2008; Lundgren and Marais, 2020), including Brassicaceae (Heidel et al., 2016). Regardless of its lower chance of formation, the perennial life style may have played an important role in adaptation to arid (e.g. Arabidella) and montane (e.g. Pachycladon, Drabastrum alpestre) habitats, as shown for Arabideae (Karl and Koch, 2013) and other plant lineages (Drummond et al., 2012; Jabbour and Renner, 2012; Ogburn and Edwards, 2015).
Hybridization and autopolyploidy drive genome evolution in Arabidella
The only known, but overlooked, chromosome number record for any Arabidella species was 2n = 24 reported for A. trisecta from far northeastern South Australia (Rollins and Rüdenberg, 1971). Herein, 2n = 24 was identified in A. trisecta from northeastern South Australia (AD223503) and chromosome painting analysis has confirmed the mesotetraploid status of this plant (Figure 2). Other accessions of A. trisecta, A. filifolia, and A. nasturtium had 2n = 48 resulting from an additional WGD(s) (Figure 2; Mandáková et al., 2017b). Altogether, these findings support the view that the genus Arabidella is a polyploid complex of closely related mesotetraploid (2n = 24) and neo-mesotetraploid (2n = 48) genomes. Frequently reported intermediate morphotypes and difficult species assignment (e.g. Shaw, 1965; M. Edginton, unpublished observations) are reflecting most likely recurrent autopolyploidization and hybridization in Arabidella. Our analysis of homoeologous nuclear 5S rDNA sequences showed that all three populations of A. nasturtium represented presumably homoploid inter-species hybrids and suggest that the entire species could have a hybridogenous origin. Further population-level investigation is needed to assess the frequency of mesotetraploid and neopolyploid populations, as well as the level of inter-population gene flow between populations of the four sympatric Arabidella species.
Here, a tribe-wide analysis of 5S rDNA cluster graphs detecting probable hybridization events was applied to a Brassicaceae tribe. As hybridization in Brassicaceae is pervasive and genome-skimming data are accumulating, analysis of homologous 5S rDNA sequences in a wider spectrum of species may provide deeper insights into their origins and incongruent phylogenetic reconstructions.
Conclusions
Despite the prominence of genome duplication-diploidization cycles in evolution of angiosperm lineages, the role of postpolyploid diploidization in species divergence, including the phenotypic convergence and disparity, remains largely unknown. We addressed this question in the crucifer tribe Microlepidieae exhibiting differently paced genome diploidization and extensive morphological convergence. We provide clear phylogenomic evidence that differently paced postpolyploid diploidization was associated with (1) intra-tribal cladogenesis, (2) morphological disparity, (3) selection pressure on genes involved in cytonuclear interaction, and (4) life-form transitions. Our results along with the close phylogenetic relatedness to A. thaliana make Microlepidieae an excellent model system to investigate the evolutionary consequences of postpolyploid genome evolution.
Materials and methods
Taxon sampling
The list of the analyzed accessions and outgroup species, as well as the GenBank accessions of plastome and 35S rDNA sequences, are provided in Supplemental Table S1.
Low-coverage whole-genome sequencing
NucleoSpin Plant II kit (Macherey-Nagel, Düren, Germany) was used to extract genomic DNA from fresh or silica-dried leaves. DNA sequencing libraries were sequenced at the Core Facility Genomics, CEITEC, Masaryk University. The Illumina Miseq platform, generating 150-bp paired-end reads, was used for sequencing.
Sequence assembly and annotation
The raw reads were filtered using the fastp-version 0.20.1 software (Chen et al., 2018) with the following parameters: -z 4 -q 20 -u 30 -n 0 -f 5 -t 5. After quality control, cp genome assemblies were generated using NOVOPlasty (Dierckxsens et al., 2017) or GetOrganelle (Jin et al., 2020). When NOVOPlasty/GetOrganelle failed to return a complete assembly, plastid sequences were selected from contigs assembled with Velvet version 1.2.10 (Zerbino and Birney, 2008) through comparison with the Arabidopsis (A.thaliana) chloroplast genome (GenBank accession: NC_000932) and subsequently merged into a consensus linear sequence using Geneious software (Kearse et al., 2012). To demonstrate the accuracy of the assembled plastomes, we compared our assemblies with publicly available sequences in GenBank (Supplemental Table S13). Using publicly available cp genomes of Brassicaceae as the reference, the assembled plastomes were annotated using Plann software (Huang and Cronk, 2015) and manually curated with Sequin software. To search for 35S rDNA sequences, the reads were assembled by the Megahit software (Li et al., 2015) with the following parameters: -m 80,000,000,000 -t 12. The resulting contigs were mapped by the BWA software (Li and Durbin, 2009) to the A. thaliana 35S rDNA sequences (GenBank accession: X52322) and fully assembled 35S rDNA units (18S-ITS1-5.8S-ITS2-26S) were selected for downstream analyses.
Sequence alignment and phylogenetic analysis
For the cp data, we combined published cp genomes of 17 Brassicaceae species (Supplemental Table S1) with the generated sequences to build an alignment matrix of 76 protein-coding genes (PCGs) following (Guo et al., 2017). Each PCG was aligned by PRANK (Loytynoja and Goldman, 2008) and subjected to Gblock (Castresana, 2000) to trim ambiguously aligned regions. Then, the individual alignments were concatenated. For 35S rDNA data, due to the variation within the IGS sequences, only the unique 35S rDNA transcription units (18S-ITS1-5.8S-ITS2-26S) were used for the sequence alignment using the Mafft software (Katoh and Standley, 2013), and two ambiguous terminal regions were removed based on the A. thaliana 35S rDNA sequences. For both datasets, ML analyses were undertaken using IQ-tree program (Nguyen et al., 2015) by searching for the best substitution models for each of the partitions. Node supports were assessed with 1,000 rapid bootstrapping replicates. BI trees and divergence times were coestimated using BEAST version 2.5 (Bouckaert et al., 2019). The resulting trees were visualized and edited in FigTree version 1.4.1 (http://tree.bio.ed.ac.uk/software/figtree/). Tarenaya hassleriana (Chodat) Iltis (Cleomaceae) was used to root the phylogenetic trees.
Molecular dating based on plastome data
We used MCMCTree software implemented in the PAML4.9e package (Yang, 2007) to estimate divergent times with a codon-partitioned dataset from the concatenated 76 PCGs (Supplemental Figure S8). The independent rates clock model (Rannala and Yang, 2007) was applied with the gamma-Dirichlet prior (Dos Reis et al., 2014) for the overall substitution rate (rgene gamma) setting at G (4, 90, 1). The three parameters (birth rate λ, death rate μ, and sampling fraction ρ) for the birth–death process were specified as λ = μ = 1 and ρ = 0. Due to the lack of reliable fossil calibration points in Brassicaceae (Franzke et al., 2016), we applied two secondary calibration points from (Walden et al., 2020): the crown age of Brassicaceae was set to 24.31–35.71 Mya, and the crown age of Camelineae was set to 5.56–9.78 Mya. The analyses were run for 5 million generations sampled every 500 generations after a burn in of 500,000 iterations. Two separate MCMC runs were compared for convergence with two different random seeds and similar results were observed.
Repeatome identification and phylogenetic analysis
The unassembled reads obtained from low-coverage genome sequencing were used for repetitive elements identification by applying the RepeatExplorer 2 (RE2) pipeline based on the graph-based clustering method (Novak et al., 2013, 2020). Reads were filtered as above described and then were sampled as input for the RE2 pipeline. Because genome size information was not available for most Microlepidieae species, an average of 200,000 reads per genome were sampled and analyzed using RE2 regardless of genome size. To verify that this sample size was sufficient to analyze the repeatomes of Microlepidieae species, we repeated our analysis with 400,000 reads per genome for selected species with different chromosome numbers and from different intra-tribal clades and found that these results were comparable to the 200,000 read samples. The most abundant repeat clusters (genome proportion >0.01% of the total input reads) were annotated and only the most abundant repeat types were summarized (Supplemental Table S3). Comparative clustering analyses were performed for Microlepidieae species by RE2 with default parameters. The repeat-sequence similarity matrices obtained from the comparative clustering analyses were employed to infer phylogenetic relationships using the most abundant clusters (Vitales et al., 2020). Briefly, the more similar repeats of two species have the higher number of edges between the reads of those species. These similarity matrices were transformed into distance matrices. Then, the pairwise genetic distance matrices were used to construct an NJ tree by using the NJ function in ape package for each abundant cluster (genome proportion >0.01%). Finally, a consensus network was constructed by using SplitsTree5 (Bagci et al., 2021) in Newick format from all NJ trees (Supplemental Figure S5). Custom R scripts were used to process RE2 output data and phylogenetic analyses.
Chromosome preparation and cytogenetic analysis
For chromosome preparations, inflorescences with young flower buds were collected in fixative (3:1 ratio of ethanol 96% and glacial acetic acid, v/v) and kept cold until analysis. Mitotic and meiotic (pachytene) chromosome preparations were prepared from the fixed young flower buds containing immature anthers as described by Lysak and Mandáková (2013) and Mandáková and Lysak (2016). Chromosome preparations were treated with 100 μg mL−1 RNase in 2× sodium saline citrate (SSC; 20× SSC: 3-M sodium chloride, 300-mM trisodium citrate, pH 7.0) for 60 min and with 0.1 mg ml−1 pepsin in 0.01 M HCl at 37°C for 5 min; then postfixed in 4% formaldehyde in 2× SSC (v/v) for 10 min, washed in 2× SSC twice for 5 min, and dehydrated in an ethanol series (70%, 90%, and 100%, v/v, 2 min each). The BAC clone T15P10 (AF167571) of Arabidopsis bearing 35S rRNA gene repeats was used for in situ localization of nucleolar organizer regions (NORs), and the Arabidopsis clone pCT4.2 (M65137), corresponding to a 500-bp 5S rDNA repeat, was used for localization of 5S rDNA loci. Fluorescently labeled chromosome-specific Arabidopsis BAC contigs, representing three ancestral crucifer genomic blocks (Lysak et al., 2016), were used to paint pachytene chromosomes (block A: 32 BACs covering 6.85 Mb of the Arabidopsis chromosome At1; M-N: 45 BACs of Arabidopsis chromosome At3, 7.49 Mb; U: 48 BACs of At4, 8.67 Mb). All DNA probes were labeled with biotin-dUTP, digoxigenin-dUTP, or Cy3-dUTP by nick translation as described. Selected labeled DNA probes were pooled together, ethanol precipitated, dissolved in a 20 µL mixture containing 50% formamide (v/v), 10% dextran sulfate (w/v) and 2× SSC, and pipetted onto each of the microscopic slides. The slides were heated at 80°C for 2 min and incubated at 37°C overnight. Hybridized probes were visualized either as the direct fluorescence of Cy3-dUTP (yellow) or through fluorescently labeled antibodies against biotin-dUTP (red) and digoxigenin-dUTP (green). Biotin-dUTP was detected by Avidin Texas Red and amplified by goat anti-avidin biotin and Avidin Texas Red; digoxigenin-dUTP was detected by mouse anti-digoxigenin and goat anti-Alexa Fluor 488. Chromosomes were counterstained with 4′,6-diamidino-2-phenylindole (DAPI; 2 µg mL−1) in Vectashield antifade. Fluorescence signals were analyzed and photographed using a Zeiss Axioimager epifluorescence microscope and a CoolCube camera (MetaSystems, Heidelberg, Germany). Individual images were merged and processed using the Photoshop CS software (Adobe Systems, San Jose, CA, USA).
Hybridization events detection
The plant 5S rDNA includes c. 120-bp conserved coding region and variable IGSs. In graphic clustering analysis of 5S rDNA, the regular circular structures were observed in most diploid-like species, while the complex structures indicate potential hybrids (Garcia et al., 2020). We used graph clustering method implemented in the RepeatExplorer2 to analyze homoeologous 5S rDNA arrays at the genomic level searching for hybridogenic origin of the Microlepidieae species. Typically, 200,000 of pair-end reads were used as input for clustering. Then, in order to estimate the possible combination across our dataset, we used the HyDe program (Blischak et al., 2018) to predict the potential hybrids and parental species. By using 35S rDNA and plastome sequence matrixes, HyDe program outputs the possible combinations (Supplemental Table S4). We then summarized the HyDe results by recoding potential triplet combination to further test the intra- or inter-generic hybridization events. Finally, we carried out a comparative three-genomic analysis implemented in RepeatExplorer platform to test whether hybridization happened and to track the putative progenitor species.
Mutation rate and selection pressure analysis
Individual species-specific mutation rates from cp genome were calculated using the equation R = m/(nT), where R is the rate of mutation per site per year, m is the number of observed mutation sites, n is the number of total nucleotide sites, and T is the divergence time of a node, as described by (Dong et al., 2020; Supplemental Table S5). We did not consider the multiple times of mutation on the same mutated site and nonobserved site. Codeml in the PAML package (Yang, 2007) was used to calculate the rates of nonsynonymous substitutions (Ka), synonymous substitutions (Ks), and their ratio (Ka/Ks) for Microlepidieae plastome PCGs (Supplemental Tables S6 and S7). The Crucihimalayeae species C.himalaica was used as a reference. As the accurate detection of genomic variations requires high read coverage (Sims et al., 2014), we calculated the sequencing depth for all plastome assemblies (Supplemental Table S2) following Negm et al. (2021).
Morphological trait matrix and analyses
We compiled a phenotypic dataset for Microlepidieae genera based on our proposed taxonomic treatment (Lysak et al., 2022). The matrix scored the absence (0) and presence (1) for 27 character states in eight discrete characters, including two general traits (life history and hairs/trichomes) and six reproductive ones in fruit and seed morphologies. To assess the PAV of these characters across genera, we calculated the morphological disparity (Walden et al., 2020), which indicated the fraction of character-state presence for each genus. Using the method developed by Parins-Fukuchi et al. (2021; https://figshare.com/articles/dtaset/pf_stull_smith_tgz/13190816/2, last accessed in July 20th, 2021), we estimated the number of character transitions along each branch using parsimony and further calculated the morphological evolutionary rates using the time estimates obtained from molecular dating analyses. To determine whether the presence/absence of character states occurred in more closely related taxa, that is, showed phylogenetic signal, we tested their correlation with plastome phylogeny using a recently developed approach that was specifically designed for categorical traits (Borges et al., 2019). For both analyses, we presented results based on a simplified version of the dated plastome phylogeny. Because the true species relationships remain unclear, we repeated the analyses using a simplified version of the dated ML tree of rDNA as the input phylogeny.
State-independent diversification analyses
First, we inferred the ancestral state of life form trait and the overall pattern of macroevolutionary rates in Microlepideae species. Based on the time-calibrated BEAST phylogeny inferred with the plastome data, we employed BAMM version 2.5.0 (Rabosky et al., 2014, 2017) to estimate rates of speciation (λ), extinction (μ), and net diversification (γ) for the Microlepidieae tribe at the genus level. After pruning outgroups, a total of 42 Microlepidieae accessions were used for BAMM analyses. According to a list of currently known Microlepidieae species, we accounted for nonrandom and incomplete taxon sampling by giving a percentage to each of the sampled and monophyletic genus; the overall sampling fraction was set to 0.88 assuming that the eight missing taxa were separate lineages across the phylogeny. The BAMM priors were generated with the function setBAMMpriors implemented in the R package BAMMtools (Rabosky et al., 2014) assuming one rate shift. We ran MCMC chains for 1 million generations with default settings, discarding the first 10% of samples as burn in. We checked the convergence of MCMC runs by plotting the trace of the log-likelihood as well as determining their effective sample sizes (>200) using the coda package in R (Plummer et al., 2006).
Ancestral state reconstruction for life forms and state-dependent diversification
We reconstructed the ancestral state of life forms for Microlepidieae species on the BEAST phylogeny of plastomes using the “ace” function in the ape R package. Trait data were taken from Mandáková et al. (2017b) and coded as 0 for annuals and 1 for perennials. Using the diversitree R package, we fitted two BiSSE models with unconstrained and constrained speciation rate (λ) to test whether the rate in perennials (λ1) was significantly increased compared with that in annuals (λ0). As described above for the state-independent analyses, we assumed a gross sampling fraction of 0.88 to account for incomplete sampling. As we included multiple accessions for Arabidella species, we further mitigated potential sampling bias by removing 7 tips from the dated plastome phylogeny to make pairwise species divergence time to be no less than 0.36 Mya, that is, the least divergence time between known species (P. cheesemanii and P. exilis). The best-fit model was selected based on the Akaike information criterion. Because we were estimating six parameters for a small tree with only 43 tips, we ran the MCMC analysis for 10,000 steps using an exponential prior with a rate of 1/(2r), where r is the diversification rate of the character. In addition, we employed the HiSSE framework implemented in the R package HiSSE version 1.9.19 (Beaulieu and O’Meara, 2016) to test the impact of any unmeasured factors (i.e. hidden states) on diversification rates in species with different life forms. We tested five models including: (1) the BiSSE model without any hidden effect; (2) three HiSSE models with two hidden states (A and B) vary independently (HiSSE) or constrained with one of the life form states (HiSSE.0 and HiSSE.1); and (3) a null model with character-independent diversification (CID-2).
Accession numbers
All raw reads generated in this study are available from the NCBI database under the BioProject PRJNA752007. The assembled chloroplast genomes and 35S rDNA sequences are available from the GenBank under accession numbers OL364706–OL364744 and OL339480–OL339518, respectively.
Supplemental data
The following materials are available in the online version of this article.
Supplemental Figure S1. Plastome-based phylogeny of Microlepidieae based on Bayesian analysis of 76 PCGs.
Supplemental Figure S2. ML phylogenetic tree based on analysis of 35S rDNA sequences.
Supplemental Figure S3. Bayesian phylogenetic tree of Microlepidieae based on analysis of 35S rDNA sequences.
Supplemental Figure S4. A comparative repeat graph of Microlepidieae accessions.
Supplemental Figure S5. Phylogenetic relationships in Microlepidieae based on nuclear repeat sequence similarities.
Supplemental Figure S6. Performance of different repeat types employed to infer the phylogenetic relationships in Microlepidieae.
Supplemental Figure S7. A comparative repeat graph of the analyzed Arabidella genomes.
Supplemental Figure S8. Time-calibrated plastome phylogeny of Microlepidieae.
Supplemental Figure S9. Cytogenetic analysis of I. magicus.
Supplemental Figure S10. Graphic clustering analysis of 5S rDNA in Microlepidieae accessions.
Supplemental Figure S11. Graphical output of the three-genomic comparative analysis of 18S-IGS rDNA.
Supplemental Figure S12. Graphical output of the three-genomic comparative 5S rDNA analysis in Harmsiodoxa puberula.
Supplemental Figure S13. Macroevolutionary patterns of species diversification in Microlepidieae.
Supplemental Figure S14. Ancestral state reconstruction of life form trait in Microlepidieae.
Supplemental Figure S15. A histogram-based summary of character state presence across Microlepidieae genera and clades.
Supplemental Figure S16. Fruit types in cross section.
Supplemental Table S1. Origin and GenBank accession numbers of the analyzed Microlepidieae accessions.
Supplemental Table S2. Plastome read coverage in the analyzed Microlepidieae accessions.
Supplemental Table S3. Repeatome composition in 39 Microlepidieae accessions.
Supplemental Table S4. Detection of potential hybridization events and putative parental species in Arabidella using HyDe.
Supplemental Table S5. Plastome mutation rates of the analyzed Microlepidieae accessions.
Supplemental Table S6. Ks values of the analyzed Microlepidieae accessions.
Supplemental Table S7. Ka/Ks values of 64 plastome genes in the analyzed Microlepidieae accessions.
Supplemental Table S8. BiSSE analyses of species diversification in annuals and perennials.
Supplemental Table S9. HiSSE analyses of species diversification in annuals and perennials.
Supplemental Table S10. Matrix of morphological trait states in Microlepidieae genera.
Supplemental Table S11. Morphological disparity in selected characters within Microlepidieae genera.
Supplemental Table S12. Summary of δ-statistics test of phylogenetic signal in character states.
Supplemental Table S13. Comparison of de novo assembled and published plastome sequences for Microlepidieae taxa.
M.A.L. conceived the project. S.Z. and X.G. performed the analyses based on DNA sequence and morphological data. T.M. performed the cytogenomic experiments. M.E. and I.A.A. performed taxonomic revision of the taxa analyzed and contributed to the analyses of morphological disparity. M.A.L., S.Z., and X.G. wrote the article with contributions from the other authors.
The author responsible for distribution of materials integral to the findings presented in this article in accordance with the policy described in the Instructions for Authors (https://dbpia.nl.go.kr/plphys/pages/general-instructions) is Martin A. Lysak ([email protected]).
Acknowledgments
We thank Neville Walsh (Royal Botanic Gardens Victoria), Anthony Brach (Harvard University Herbaria), Gillian Brown (Queensland Herbarium), Daniel Duval (Botanic Gardens of South Australia), Neville Scarlett, Janet Terry (Millenium Seed Bank, Royal Botanic Gardens, Kew) and Kasper Hendriks (Naturalis Biodiversity Centre) for providing materials or sequence data. We thank Daniel Vitales for his suggestion on repeatome phylogeny and Roi Rodríguez González for sharing the R script. Computational resources were supplied by the project “e-Infrastruktura CZ” (e-INFRA CZ LM2018140) supported by the Ministry of Education, Youth and Sports of the Czech Republic. Computational resources were also provided by the ELIXIR-CZ project (LM2018131), part of the international ELIXIR infrastructure.
Funding
This work was financially supported by a research grant from the Czech Science Foundation (20-03419Y).
Conflict of interest statement. None declared.
References
Plummer M, Best N, Cowles K, Vines K (2006) CODA: convergence diagnosis and output analysis for MCMC. R News 6: 7–11
Author notes
These authors contributed equally (S.Z. and X.G.).
