


Abstract
Despite the known critical regulatory functions of microRNAs, histone modifications, and DNA methylation in reprograming plant epigenomes in response to pathogen infection, the molecular mechanisms underlying the tight coordination of these components remain poorly understood. Here, we show how Arabidopsis (Arabidopsis thaliana) miR778 coordinately modulates the root transcriptome, histone methylation, and DNA methylation via post-transcriptional regulation of the H3K9 methyltransferases SU(var)3-9 homolog 5 (SUVH5) and SUVH6 upon infection by the beet cyst nematode Heterodera schachtii. miR778 post-transcriptionally silences SUVH5 and SUVH6 upon nematode infection. Manipulation of the expression of miR778 and its two target genes significantly altered plant susceptibility to H. schachtii. RNA-seq analysis revealed a key role of SUVH5 and SUVH6 in reprograming the transcriptome of Arabidopsis roots upon H. schachtii infection. In addition, chromatin immunoprecipitation (ChIP)-seq analysis established SUVH5 and SUVH6 as the main enzymes mediating H3K9me2 deposition in Arabidopsis roots in response to nematode infection. ChIP-seq analysis also showed that these methyltransferases possess distinct DNA binding preferences in that they are targeting transposable elements under noninfected conditions and protein-coding genes in infected plants. Further analyses indicated that H3K9me2 deposition directed by SUVH5 and SUVH6 contributes to gene expression changes both in roots and in nematode feeding sites and preferentially associates with CG DNA methylation. Together, our results uncovered multi-layered epigenetic regulatory mechanisms coordinated by miR778 during Arabidopsis–H. schachtii interactions.
Introduction
Cyst nematodes (Heterodera spp.) are among the most agronomically and economically devastating plant pests, accounting for over a billion dollars in annual yield losses (Bernard et al., 2017). The difficulty in controlling cyst nematodes lies in their unique and complex interaction with host plants. Second-stage juveniles (J2) penetrate host roots and migrate intracellularly to establish their permanent feeding sites, called syncytia (Sobczak and Golinowski, 2009). Syncytium formation and development involve a complex array of highly integrated cellular processes and signaling pathways mediated through transcriptional, post-transcriptional, and post-translational modifications in the host (Hewezi, 2015, 2020).
DNA methylation in particular has been linked to transcriptome reprogramming induced by cyst nematodes (Rambani et al., 2015; Hewezi et al., 2017; Piya et al., 2017; Rambani et al., 2020a, 2020b). Plant DNA methylation occurs in the CG, CHG, and CHH sequence contexts (H is any nucleotide except G) and mediated by sequence context-specific methyltransferases (Law and Jacobsen, 2010). Several pieces of experimental evidence indicate that DNA methylation closely associates with other epigenetic mechanisms, such as histone modifications and microRNA (miRNA)-mediated post-transcriptional gene silencing (PTGS) to induce genome-wide changes in gene expression (Vaillant and Paszkowski, 2007; He et al., 2011; Jia et al., 2011; Stroud et al., 2014; Du et al., 2015; Teotia et al., 2017; Rambani et al., 2020a). PTGS during plant–nematode interactions seems to occur in large part through the action of miRNAs. This is supported by the findings that a substantial number of miRNAs have been identified as transcriptionally responsive to nematode infection (Hewezi et al., 2008; Li et al., 2012; Xu et al., 2014; Cabrera et al., 2016; Kaur et al., 2017; Medina et al., 2017; Tian et al., 2017a). The functional characterization of a limited number of miRNA genes revealed their involvement in various cellular processes and molecular functions fundamental for cyst nematode infection. This includes syncytium formation-to-maintenance phase transition (miR396), transcriptional reprograming (miR858), suppression of defense signaling (miR827) (Hewezi et al., 2012, 2016; Hewezi and Baum, 2012; Piya et al., 2017). Similarly, miRNAs have been shown to play key roles in the formation and development of the giant-cells, the feeding site induced by root-knot nematodes, via regulation of cell-fate differentiation (miR172) and modulation of hormone signaling (miR390 and miR319) (Zhao et al., 2015; Cabrera et al., 2016; Diaz-Manzano et al., 2018).
Histone methylation is another important epigenetic mark that controls gene expression and various biological processes (Berr et al., 2011; Yuan et al., 2013; Zhao et al., 2019; Ueda and Seki, 2020). Histone tail modifications directly alter nucleosome structure and trigger downstream transcriptional changes leading to gene activation or gene silencing. Broadly, euchromatic regions of the genome are highly enriched in acetylated histones (Berger, 2007; Shahbazian and Grunstein, 2007), whereas DNA and histone methylation, particularly histone 3 lysine 9 methylation (H3K9me), are both highly enriched in heterochromatic regions, where they tend to function as repressive epigenetic marks (Tariq and Paszkowski, 2004; Xiao et al., 2016). However, stress stimuli can redirect histone deacetylases and methyltransferases for local chromatic and transcriptomic changes, thereby inducing stress-specific responses (Pfluger and Wagner, 2007). Several histone deacetylases have been shown to act as positive or negative regulators of defense signaling against various plant pathogens (Zhou et al., 2005; Kim et al., 2008; Wu et al., 2008; Zhou et al., 2010; Choi et al., 2012; Latrasse et al., 2017; Ramirez-Prado et al., 2018). Repressive histone marks have also been shown to regulate plant–pathogen interactions. For example, H3K27me3, which is primarily targeted to protein-coding genes, has been linked to the regulation of defense responses when challenged by Pseudomonas syringae pv. tomato (Pst) strain DC3000 or the fungus Sclerotinia sclerotiorum (Le Roux et al., 2014). Demethylation of the H3K9 mark has recently been demonstrated to positively regulate plant defense upon infection by Pst DC3000 (Dutta et al., 2017).
Similar to other plant pathogens, cyst and root-knot nematodes parasitism of host plants involves changes in histone configuration. The cyst nematode effector 32E03 recently has been shown to interact with Arabidopsis histone deacetylase 1, leading to an increased level of histone H3 acetylation at the rDNA chromatin regions and subsequent changes in transcriptional activity of rRNA genes in the syncytium (Vijayapalani et al., 2018). Profiling various histone-modifying marks in young galls induced by the root-knot nematode Meloidogyne graminicola in rice (Oryza sativa) revealed enrichment of H3K9ac and H3K27me3 marks and depletion of H3K9me2 (Atighi et al., 2021). Despite the absence of genome-wide association between histone modifications and differentially expressed genes (DEGs), an association between the modified histone marks and a set of defense-related genes was confirmed (Atighi et al., 2021).
Despite the known roles of miRNAs, histone modifications, and DNA methylation in establishing plant–pathogen interactions, the molecular mechanisms controlling the coordination of these components remain to be further elucidated. In this context, miR778 provides an excellent target to study such mechanism of coordination. miR778 targets SU(var)3-9 homolog5 (SUVH5) and SUVH6 for posttranscriptional silencing (Lu et al., 2006; Fahlgren et al., 2007). SUVH5 and SUVH6 catalyze the dimethylation of H3K9 (H3K9me2) mark, which plays a key role in maintenance of non-CG DNA methylation (Stroud et al., 2013; Du et al., 2015). Methylated H3K9 is recognized by CHROMOMETHYLASE 2 (CMT2) and CMT3, which methylate DNA in non-CG context. Methylated DNA sites further create binding sites for SUVH5 and SUVH6 and their homolog SUVH4. This self-enforcing feedback loop links DNA methylation with H3K9 dimethylation to maintain the silencing status. Despite initial findings that associate H3K9me2 with non-CG methylation, recent data indicated that SUVH5 recruitment exhibits strong preference for methylated CG sites, whereas SUVH6 can similarly bind to both CG and non-CG methylated sites (Li et al., 2018).
In this study, we show that Arabidopsis (Arabidopsis thaliana) SUVH5 and SUVH6 are subjected to PTGS by miR778, which is upregulated following infection by the beet cyst nematode Heterodera schachtii. Expression changes of miR778 and its two target genes through overexpression, target mimicry, and T-DNA insertional mutation significantly altered plant susceptibility to H. schachtii. RNA-seq analysis of suvh5 and suvh6 single mutants and wild-type plants under both infected and noninfected conditions revealed a key role of SUVH5 and SUVH6 in establishing the transcriptome of Arabidopsis roots upon H. schachtii infection through redundant expression regulation of thousands of genes involved in a wide range of biological processes and molecular functions. In addition, chromatin immunoprecipitation (ChIP)-seq analysis revealed that under noninfected conditions, SUVH5 and SUVH6 establish H3K9me2 deposition mainly at transposable elements (TEs). However, under H. schachtii-infected conditions, SUVH6 and to a much lesser extent SUVH5 mediate H3K9me2 deposition mainly at protein-coding genes both in promoter and transcribed regions. Further analysis revealed that SUVH5 and SUVH6 are the major enzymes mediating H3K9me2 deposition in response to H. schachtii infection, contribute to gene expression changes in nematode feeding sites, and associate with CG methylation. Together, our data provide insight into the mechanisms through which miR778-mediated downregulation of SUVH5 and SUVH6 modulate plant susceptibility, root transcriptome, histone methylation, and possibly DNA methylation, and point to a regulatory mechanism of multi-epigenetic modifications coordinated by miR778 during H. schachtii parasitism of Arabidopsis.
Results
miR778 regulates SUVH5 and 6 during syncytium development
Arabidopsis miR778 (AT2G41616) is encoded by one gene on chromosome 2 and posttranscriptionally silences the expression of the H3K9 methyltransferases SUVH5 and 6, which contain near-perfect complementary binding site for mature miR778 (Lu et al., 2006; Fahlgren et al., 2007; Figure 1A). To examine the potential implication of miR778 and its target genes in plant–nematode interaction, we generated transgenic lines expressing the β-glucuronidase (GUS) reporter gene under the control of either the miR778, SUVH5, or SUVH6 promoters. We determined promoter activities of at least three transgenic lines (T2 generation) for each construct under noninfected conditions and in syncytia induced by the beet cyst nematode H.schachtii. GUS activity in root tissues under noninfected conditions is provided in Supplemental Figure S1. Under H. schachtii-infected conditions, histochemical GUS assays of the miR778 promoter revealed high expression in the developing syncytium formed by the second-stage juveniles (J2) at 3 days post infection (dpi) as well as in the fully developed syncytia of third-stage juveniles (J3) at 7 and 10 dpi (Figure 1B). GUS activity of the miR778 promoter was also detected in the syncytia of J4 nematodes at 14 dpi (Figure 1B). GUS activity directed by the SUVH5 promoter also was observed in the developing syncytia formed by J2 H. schachtii at 3, 7, and 10 dpi (Figure 1C), and GUS activity directed by the SUVH6 promoter was induced in the developing syncytia of early J3 H. schachtii specifically at 7 dpi (Figure 1D). SUVH5 and SUVH6 were also reported as differentially expressed in the syncytial cells induced by H. schachtii in Arabidopsis (Szakasits et al., 2009). The promoter activities of miR778 and its SUVH5 and SUVH6 targets in the syncytium imply a posttranscriptional regulation of SUVH5 and SUVH6 by miR778 upon nematode infection.
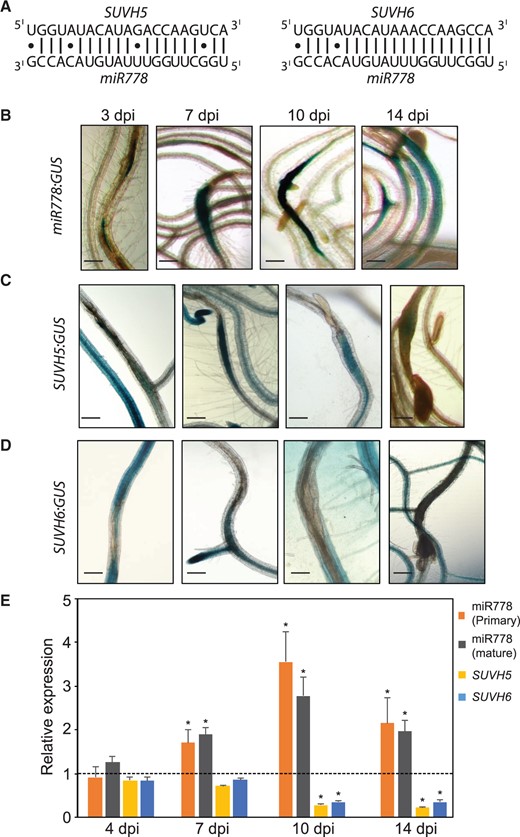
miR778 and its target genes SUVH5 and SUVH6 are expressed in H. schachtii-induced syncytium. A, Mature sequence of miR778 and its base pairing with its target genes. B–D, Histochemical localization of GUS activity directed by promoters of miR778 (B) and its targets SUVH5 (C) and SUVH6 (D) at 3, 7, 10, and 14 dpi. Scale bar = 200 µm. E, miR778 posttranscriptionally regulates SUVH5 and SUVH6 in the H. schachtii-infected roots. The expression levels of primary miR778, mature miR778, SUVH5, and SUVH6 were determined using RT-qPCR in wild-type Col-0 roots infected with H. schachtii at 4, 7, 10, and 14 dpi relative to the noninfected control roots, which were set to 1. Data are averages of three biologically independent root samples ± se. Asterisks indicate statistically significant differences in the expression levels between infected and noninfected roots determined by ANOVA (P < 0.05).
To test this possibility, we quantified the expression levels of primary and mature miR778 transcripts as well as uncleaved transcript levels of SUVH5 and SUVH6 in root tissues collected from H. schachtii-infected and noninfected Col-0 plans at 4, 7, 10, and 14 dpi. Uncleaved transcript levels of SUVH5 and SUVH6 were measured using two primer pairs flanking the miR778 binding site. Reverse transcription-quantitative PCR (RT-qPCR) data of three biological samples revealed significant (P < 0.05) upregulation of primary and mature miR778 transcripts in the infected roots at 7, 10, and 14 dpi as compared with noninfected control roots (Figure 1E). Concurrently, the levels of uncleaved SUVH5 and SUVH6 transcripts were significantly downregulated in the infected roots compared with noninfected roots at the 10- and 14-day time points (Figure 1E). Together, these data indicate that SUVH5 and SUVH6 are subjected to posttranscriptional silencing by miR778 following nematode infection.
Altered expression of miR778 impacts plant susceptibility to H. schachtii
We examined the role of miR778 in modulating plant responses to nematode infection by generating transgenic Arabidopsis lines with increased or reduced miR778 expression using overexpression and target mimicry approaches, respectively. The overexpression lines were generated by overexpressing the primary miR778 sequence using the 35S promoter (35S:miR778). Several transgenic T3 lines were phenotypically characterized. miR778 overexpression impacted leaf morphology (Figure 2A) but no noticeable effects on root morphology and length were detected (Supplemental Figure S2, A and B). Consistent with PTGS of SUVH5 and SUVH6 by miR778, the increased expression of miR778 in overexpression lines was associated with significant reduction of SUVH5 and SUVH6 transcript levels (Figure 2B). The miR778 overexpression lines along with wild-type Col-0 plants were then assayed for H. schachtii susceptibility. The numbers of J4 female nematodes per root system were counted and used to determine plant susceptibility relative to wild-type Col-0 plants. Interestingly, the overexpression lines showed statistically significant increases in susceptibility levels as compared with Col-0 plants (Figure 2C).
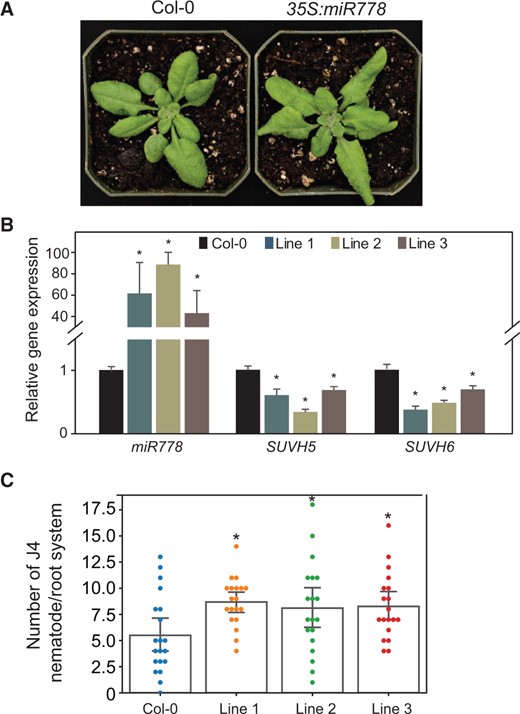
Constitutive overexpression of miR778 in Arabidopsis increased plant susceptibility to H. schachtii. A, Phenotype of miR778 overexpression lines compared to Col-0. B, Overexpression of miR778 in three independent transgenic Arabidopsis lines significantly reduced the expression levels of SUVH5 and SUVH6. Expression levels of miR778, SUVH5, and SUVH6 were measured by RT-qPCR using three biological samples collected from 2-week-old plants. Relative fold change values represent expression levels in miR778 overexpression samples relative to the wild-type control samples, which were set to 1. The U6 small nuclear RNA and 60S ribosomal genes were used as reference genes to normalize miR778 gene expression, whereas Actin8 and PP2AA3 were used as reference genes to normalize SUVH5 and SUVH6 expression. Data are averages of the three biological root samples ± se. Statistically significant differences between overexpression and control samples determined by ANOVA (*P < 0.05). C, Overexpression of miR778 increased plant susceptibility to H. schachtii. The numbers of J4 female nematode per plant root were determined 3 weeks after inoculation and used to determine susceptibility levels. Each dot represents one replicated plant, and bars represent averages ± se. Statistically significant differences between miR778 overexpression lines and wild-type Col-0 plants were determined using ANOVA (*P < 0.05).
The transgenic lines overexpressing an artificial mimic sequence for mature miR778 (MIM778) were similarly analyzed (Figure 3). The artificial mimic sequence was generated by overexpressing a modified version of the nonprotein coding gene INDUCED BY PHOSPHATE STARVATION1 (IPS1) in which the native miR399 binding site was replaced by a mimic sequence for miR778. The mimic sequence (MIM778) included a three-nucleotide (nt) bulge (TTC) in the miRNA binding site that would impede transcript degradation without affecting miR778 binding ability (Figure 3A). Transgenic T3 plants overexpressing MIM778 under the 35S promoter (35S:MIM778) showed no morphological irregularity in roots (Supplemental Figure S2, C and D). However, these lines showed altered leaf morphology similar to that of miR778 overexpression (Figure 3B), suggesting that change in the expression of miR778 impacts leaf development. The steady-state abundance levels of miR778 in three MIM778 lines were significantly downregulated (Figure 3C), confirming the efficiency of the artificial noncleavable binding sequence in inhibiting the silencing function of miR778. miR778 downregulation in the MIM778 lines was also associated with significant increases in mRNA abundance of its SUVH5 and SUVH6 target genes (Figure 3C). Importantly, when the MIM778 lines were assayed for nematode susceptibility, these lines showed the opposite effect of miR778 overexpression, with significant decrease in plant susceptibility in comparison with Col-0 plants (Figure 3D). Together, these data indicate that H. schachtii-induced upregulation of miR778 in the feeding cells promotes nematode parasitism of Arabidopsis plants.
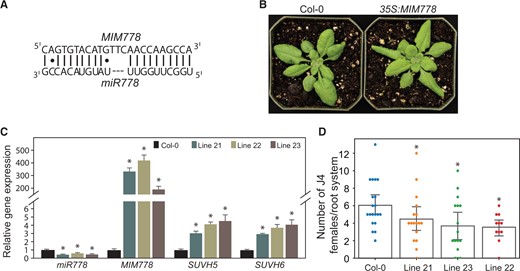
Suppression of miR778 expression via target mimicry reduced plant susceptibility to H. schachtii. A, Nucleotide sequences of the artificial nondegradable binding site generated for mature miR778. The mimic sequence for miR399 in the IPS1 gene was replaced by a mimic sequence for miR778 (MIM778), which included a three-nucleotide bulge (TTC). B, Phenotype of MIM778 overexpression lines compared with Col-0. The Col-0 image is the same as that shown in Figure 2A. C, Inactivation of miR778 expression in three independent transgenic Arabidopsis lines significantly enhanced the expression levels of SUVH5 and SUVH6. Expression levels of miR778, SUVH5, and SUVH6 were measured by RT-qPCR using three biological samples collected from 2-week-old plants. Relative fold change values represent expression levels in MIM778 overexpression samples relative to the wild-type control samples, which were set to 1. The U6 small nuclear RNA and 60S ribosomal genes were used as reference genes to normalize miR778 gene expression, whereas Actin8 and PP2AA3 were used as reference genes to normalize SUVH5 and SUVH6 expression. Shown are averages of the three biological samples ± se. Statistically significant differences between overexpression and control samples determined by ANOVA (*P < 0.05). D, Overexpression of MIMR778 reduced plant susceptibility to H. schachtii. The numbers of J4 female nematodes per plant root were determined 3 weeks after inoculating 10-days-old plants and used to determine susceptibility levels. Each dot represents one replicated plant, and bars represent averages ± se. Statistically significant differences between MIM778 overexpression lines and wild-type Col-0 plants were determined using ANOVA (*P < 0.05).
Mutations of SUVH5 and SUVH6 alter plant susceptibility to H. schachtii
To directly reveal the functional role of SUVH5 and SUVH6 in plant–nematode interactions, we first evaluated two mutant lines each for SUVH5 (GK-263C05, Zheng et al. [2012] and FLAG_280C12) and SUVH6 (SAIL_1244_F04, Wang et al. [2015], and SALK_071138C) for H. schachtii susceptibility. For the two mutants not previously characterized (FLAG_280C12 and SALK_071138C) (Supplemental Figure S3A), the expression of SUVH5 and SUVH6 was determined to be significantly downregulated, respectively, as compared to the corresponding wild-type plants (Supplemental Figure S3B). No change in leaf morphology was detected in these mutants as previously reported (Zheng et al., 2012; Wang et al., 2015). Additionally, no changes in root length or morphology were detected when the mutant lines were compared with the corresponding wild-type plants under our growth conditions (Supplemental Figure S3C). While we expected that the mutant lines will phenocopy miR778 overexpression of increased susceptibility, unexpectedly these mutants exhibited statistically significant decreases in susceptibility to H. schachtii as compared with the corresponding Col-0 or Wassilewskija (WS) wild-type plants (Figure 4, A–D). We further assayed the suvh5/6 double mutant (Ebbs and Bender, 2006) to nematode susceptibility. The mutant plants showed remarkable reduction in nematode susceptibility as compared with wild-type Col-0 (Figure 4E) or the suvh5 and suvh6 single mutants, indicating that SUVH5 and SUVH6 function in additive manner to regulate Arabidopsis susceptibility to H. schachtii.
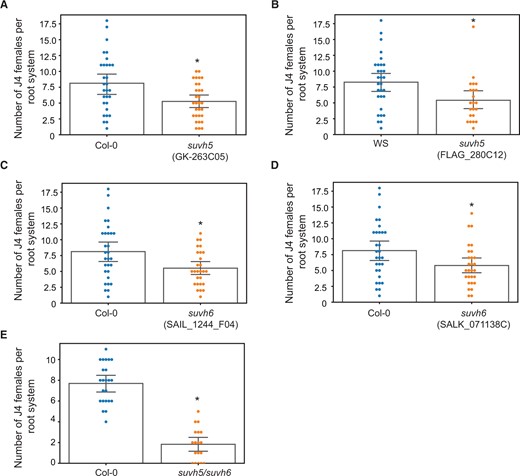
Mutations of SUVH5 and SUVH6 decrease plant susceptibility to H. schachtii. A–E, Nematode infection assays of mutant lines of suvh5 (GK-263C05 and FLAG_280C12) (A and B), suvh6 (SAIL_1244_F04 and SALK_071138C) (C and D), and suvh5/suvh6 double mutant (E), and the corresponding wild-type Col-0 or WS plants. The numbers of J4 female nematodes per plant root were determined 3 weeks after inoculating 10-day-old plants and used to determine susceptibility levels. Each dot represents one replicated plant and bars represent averages ± se. Statistically significant differences between mutant lines and the corresponding wild-type Col-0 or WS plants were determined using ANOVA (*P < 0.05).
SUVH5 and SUVH6 play key roles in shaping the transcriptome of Arabidopsis roots upon H. schachtii infection
We next performed RNA-seq analysis of suvh5 (GK-263C05) and suvh6 (SAIL_1244_F04) mutants and Col-0 plants under both noninfected and H. schachtii-infected conditions to better understand how SUVH5 and SUVH6 altered plant susceptibility. A total of 18 biological samples were collected from whole root tissues of infected and the corresponding noninfected control plants at 5 dpi. Under noninfected conditions, we identified 1,057 and 3,390 DEGs, respectively, in the suvh5 and suvh6 mutants compared with Col-0 plants using an adjusted P-value cutoff of 0.05 (Supplemental Data Sets S1 and S2). Of those DEGs, a similar number were upregulated and downregulated (Supplemental Figure S4A). Notably, 491 (46.5%) of the DEGs identified in suvh5 were also differentially expressed in suvh6 (Supplemental Figure S4B), 487 (99%) of which were differentially expressed in the same direction in suvh5 and suvh6, supporting previous reports of their redundant function (Ebbs and Bender, 2006; Johnson et al., 2007; Li et al., 2018). Gene ontology (GO) term analysis of upregulated and downregulated genes in suvh5 and suvh6 roots revealed common and differential enrichment of terms involved in a wide range of biological processes including those involved in primary and secondary metabolism, regulation of gene expression, defense responses, response to biotic stresses, and cell wall biogenesis (Supplemental Figure S4C).
We next compared root transcriptomes of suvh5 and suvh6 single mutants with that of Col-0 in response to H. schachtii infection at 5 dpi. We identified 2,487 and 846 DEGs, respectively, in infected suvh5 and suvh6 when compared with infected Col-0 (adjusted P < 0.05) (Figure 5A and Supplemental Data Sets S3 and S4). We also identified 4,566 DEGs in H. schachtii-infected Col-0 roots when compared with noninfected roots (Figure 5A and Supplemental Data Set S5). The proportion of genes that were upregulated and downregulated was similar for infected Col-0, suvh5, and suvh6 (Figure 5A). Furthermore, about half of the DEGs identified in suvh6 were also differentially expressed in suvh5 (Figure 5B), consistent with the redundant function of SUVH5 and SUVH6 observed under noninfected conditions. Notably, we found that 51% (1,277 genes) and 70% (592 genes) of the DEGs identified, respectively, in the infected suvh5 and suvh6 single mutants overlap with DEGs identified in infected Col-0 plants (Figure 5B). These data suggest that SUVH5 and SUVH6 play key roles in shaping the transcriptome of Arabidopsis roots upon H. schachtii infection. GO term analysis revealed enrichment of terms common to suvh5 and suvh6 among the upregulated and downregulated genes (Figure 5C). These terms are related to secondary metabolism, response to toxic substances, and cell communication, signaling, cell cycling, cell division, and cytokinesis. The enrichment of these terms uniquely among the DEGs identified in the mutant lines is consistent with the redundant function of SUVH5 and SUVH6 and points to their involvement in regulating key biological processes required for nematode parasitism. The analysis also revealed that several GO terms enriched among the upregulated or downregulated genes identified in the infected Col-0 plants were also enriched among the upregulated or downregulated genes identified in the infected suvh5 or suvh6 mutants. This includes terms related to various metabolic processes, response to stimulus, cell communication and signaling, innate immune response, cell wall organization or biogenesis, and response to oxidative stress (Figure 5C). Interestingly, we found that terms related to plant response to stimulus and peptidyl-serine phosphorylation were enriched among both upregulated and downregulated genes identified in Col-0 and mutant lines (Figure 5C), suggesting a role of SUVH5 and SUVH6 in differential regulation of stress response and protein phosphorylation during nematode infection.

SUVH5 and SUVH6 regulate the expression of a substantial number of genes in H. schachtii-infected root tissues. A and B, Number of DEGs identified in H. schachtii-infected wild-type Col-0, suvh5 (GK-263C05), and suvh6 (SAIL_1244_F04) roots and their overlaps (B). C, GO term classification and enrichment analysis of upregulated and downregulated DEGs identified in H. schachtii-infected wild-type Col-0, suvh5 (GK-263C05), and suvh6 (SAIL_1244_F04) roots. Enrichment analyses of upregulated and downregulated genes were performed separately using Fisher’s exact test and Bonferroni multi-test correction with a significance cutoff P < 0.05. Redundant GO terms were summarized using REViGO with semantic similarity measure SimRel = 0.5.
Kyoto Encyclopedia of Genes and Genomes (KEGG) pathway analysis revealed that genes involved in glutathione metabolism and phenylpropanoid biosynthesis were significantly enriched (FDR < 0.001) among the DEGs identified in infected roots of suvh5 and suvh6, respectively. This analysis further supports a role of SUVH5 and SUVH6 in regulating antioxidant defense and generating secondary metabolites, respectively, during nematode infection of Arabidopsis.
SUVH5 and SUVH6 expression is controlled through a feedback mechanism
Careful examination of the RNA-seq data revealed a remarkable upregulation (4.3-fold) of SUVH6 in the suvh5 mutant (Supplemental Data Set S1). Similarly, SUVH5 was significantly upregulated (5.1-fold) in the suvh6 mutant (Supplemental Data Set S2). We next quantified the expression of SUVH5 and SUVH6 in the other mutant allele of suvh6 (SAlK_071138C) and suvh5 (FLAG_280C12), respectively, using RT-qPCR. SUVH6 showed 1.22-fold upregulation in the suvh5 mutant FLAG_280C12 relative to wild-type C24, whereas SUVH5 showed 1.85-fold upregulation in the suvh6 mutant SAlK_071138C relative to wild-type Col-0 (Supplemental Figure S5A). Furthermore, we quantified the expression of SUVH1, 2, 3, and 4 in the suvh5/6 double mutant and the corresponding wild-type Col-0 plants using RT-qPCR. All four genes exhibited increased transcript abundance in the suvh5/6 double mutant to various degrees as compared with Col-0. SUVH1 and 3 showed, respectively, 1.54- and 1.84-fold upregulation in the suvh5/6 double mutant as compared with Col-0 plants (Supplemental Figure S5B). SUVH2 and 4 showed ∼1.2-fold upregulation in the double mutant relative to Col-0 plants (Supplemental Figure S5B). While these gene expression data imply that a feedback regulatory mechanism connecting the expression of SUVH5, SUVH6, and other SUVH gene family members may exist, they also explain the unexpected decreases in nematode susceptibility observed in suvh5 and suvh6 single and double mutants (Figure 4, A–D).
SUVH5 and SUVH6 establish H3K9me2 deposition mainly in TEs under noninfected conditions
We performed ChIP-seq in order to investigate H3K9me2 deposition by SUVH5 and SUVH6 under both noninfected and H. schachtii-infected conditions. To this end, 10-day-old Col-0 and the single knockout mutants suvh5 (GK-263C05; Zheng et al., 2012) and suvh6 (SALK_1244_F04; Wang et al., 2015) were inoculated. At 5 dpi, root tissues were collected from both infected and noninfected plants in triplicate and used for library preparation and sequencing. Peak-calling analysis identified 511 and 143 peaks that were depleted in noninfected suvh5 and suvh6, respectively, when compared with noninfected Col-0 plants (Supplemental Data Sets S6 and S7). Annotation of the 511 peak regions depleted in suvh5 was associated with 106 protein-coding genes, 6 miRNAs, and 727 TEs (Figure 6A). Similarly, the 143 peak regions depleted in suvh6 were associated with 35 protein-coding genes, 2 miRNAs, and 197 TEs (Figure 6B). The peak regions depleted in the mutant compared with wild-type Col-0 plants were found in the promoter and gene body of protein-coding genes particularly next to the transcriptional start site (TSS) (Figure 6, C and D). Representative examples of H3K9me2 peaks overlapping with protein-coding genes in Col-0 compared with suvh5 or suvh6 are shown in shown in Figure 6, E and F, respectively. Investigation of the commonly depleted peaks in suvh5 and suvh6 revealed that 94% of TE-associated peaks that were absent in suvh5 compared to Col-0 were also depleted in suvh6 (Supplemental Data Sets S8 and S9).
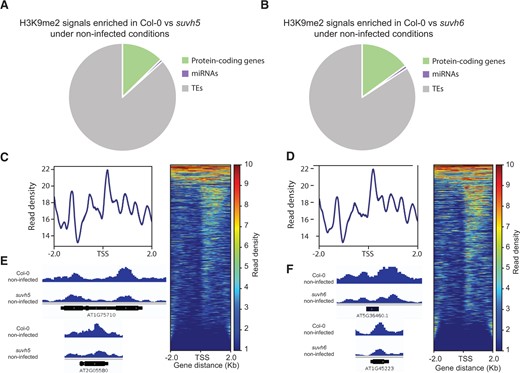
Differential accumulation of H3K9me2 signal between wild-type Col-0 plants and both suvh5 and suvh6 mutants under noninfected conditions. A and B, Distribution of H3K9me2 peaks overlapping with protein-coding genes, miRNAs, and TEs, and enriched in Col-0 when compared with suvh5 (A) or suvh6 (B) under noninfected conditions. C and D, Heatmaps of ChIP-seq signals enriched in protein-coding genes in Col-0 when compared with suvh5 (C) or suvh6 (D) under noninfected conditions. Genes were scaled to the same size with TSS flanked by 2-kb regions. Only significant (P-value < 0.05, log2FC > 1) H3K9me2 peaks were included in the analysis. Color scales on the right indicate H3K9me2 signal intensity, which reflects normalized sequence reads. E and F, Representative examples of H3K9me2 peaks overlapping with protein-coding genes in Col-0 as compared with suvh5 (E) or suvh6 (F) under noninfected conditions.
SUVH5 and SUVH6 establish H3K9me2 deposition mainly in protein-coding genes under H. schachtii-infected conditions
We identified 353 and 3,106 peaks that were depleted in H. schachtii-infected suvh5 and suvh6, respectively, when compared with infected Col-0 plants (Supplemental Data Sets S8 and S9). The 353 peak regions that were enriched in infected Col-0 compared to infected suvh5 were associated with 352 protein-coding genes, one miRNA, and 247 TEs (Figure 7A). The 3,106 peak regions that were enriched in infected Col-0 compared to infected suvh6 were associated with 4,594 protein-coding genes, 11 miRNA, and 279 TEs (Figure 7B). The H3K9me2 deposition associated with protein-coding genes depleted in suvh5 was detected in the promoter (102) and gene body (250), particularly near the TSS (Supplemental Data Set S8 and Figure 7C). The H3K9me2 deposition associated with protein-coding genes depleted in suvh6 was also found in the promoter (1,816), gene body (3,366), or in both promoter and gene body (558), and were largely located near the TSS (Supplemental Data Set S9 and Figure 7D). Representative examples of H3K9me2 peaks overlapping with protein-coding genes in infected Col-0 versus infected suvh5 or suvh6 are shown in Figure 7, E and F, respectively. These results indicate that, under infected conditions, SUVH6 and to a much lesser extent SUVH5 mediate H3K9me2 deposition mainly in protein-coding genes both in promoter and transcribed regions. The ChIP-seq signals of AT1G69040, AT4G37370 (enriched in infected Col-0 versus infected suvh5), AT1G22710, AT3G57520 (enriched in infected Col-0 versus infected suvh6), and AT4G22010 (enriched in infected Col-0 versus infected suvh5 and suvh6) were quantified using ChIP-qPCR (Supplemental Figure S6). Fold enrichment values of the five genes support the ChIP-seq results, confirming the quality of ChIP-seq datasets.

Differential accumulation of H3K9me2 signal between wild-type Col-0 plants and both suvh5 and suvh6 mutants under H. schachtii-infected conditions. A and B, Distribution of H3K9me2 peaks overlapping with protein-coding genes, miRNAs, and TEs, and enriched in H. schachtii-infected Col-0 when compared with infected suvh5 (A) or suvh6 (B). C and D, Heatmaps of ChIP-seq signals enriched in protein-coding genes in H. schachtii-infected Col-0 when compared with infected suvh5 (C) or suvh6 (D). Genes were scaled to the same size with TSS flanked by 2-kb regions. Only significant (P-value < 0.05, log2FC > 1) H3K9me2 peaks were included in the analysis. Color scales on the right indicate H3K9me2 signal intensity, which reflects normalized sequence reads. E and F, Representative examples of H3K9me2 peaks overlapping with protein-coding genes in H. schachtii-infected Col-0 when compared with infected suvh5 (E) or suvh6 (F).
H3K9me2 deposition in the roots of wild-type Col-0 plants in response to nematode infection was also investigated. We identified 791 peak regions enriched and 306 peaks depleted in infected Col-0 roots in comparison with noninfected roots (Supplemental Data Sets S10 and S11). The 791 peak regions mapped to 1,180 protein-coding genes, 3 miRNAs, and 159 TEs (Figure 8A). Interestingly, the large majority of the peaks depleted in infected Col-0 overlapped with TEs and to a much lesser extent with protein-coding genes. Specifically, these 306 peaks overlapped with 37 protein-coding genes, 7 miRNAs, and 503 TEs (Figure 8B). The H3K9me2 marks enriched in infected Col-0 roots that were located in protein-coding genes were detected in the promoter (468), gene body (858), or in both the promoter and gene body (146), primarily close to the TSS (Supplemental Data Set S10 and Figure 8C). Similarly, the few H3K9me2 marks depleted in infected Col-0 roots that were located in protein-coding genes were identified in the promoter (26), gene body (22), or in both the promoter and gene body (11), particularly close to the TSS (Supplemental Data Set S11 and Figure 8D). Examples of H3K9me2 peaks over protein-coding genes that are enriched or depleted in H. schachtii-infected Col-0 versus noninfected plants are shown in Figure 8, E and F, respectively.
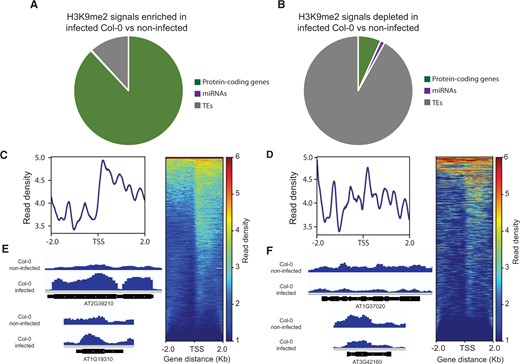
Differential accumulation of H3K9me2 signal between H. schachtii-infected and noninfected Col-0 plants. A and B, Distribution of H3K9me2 peaks overlapping with protein-coding genes, miRNAs, and TEs, and enriched (A) or depleted (B) in H. schachtii-infected Col-0 as compared with noninfected control plants. C and D, Heatmaps of ChIP-seq signals enriched (C) or depleted (D) in protein-coding genes in H. schachtii-infected Col-0 versus noninfected plants. Genes were scaled to the same size with TSS flanked by 2-kb regions. Only significant (P-value < 0.05, log2FC > 1) H3K9me2 peaks were included in the analysis. Color scales on the right indicate H3K9me2 signal intensity, which reflects normalized sequence reads. E and F, Representative examples of H3K9me2 peaks overlapping with protein-coding genes that are enriched (E) or depleted (F) in H. schachtii-infected Col-0 versus noninfected plants.
SUVH5 and SUVH6 are the major enzymes mediating H3K9me2 deposition in response to H. schachtii infection
Furthermore, we investigated the extent to which SUVH5 and 6 contribute to the deposition of H3K9me2 following H. schachtii infection. For this, the list of protein-coding genes enriched in H3K9me2 in infected Col-0 was compared with those showing H3K9me2 depletion in the mutants under infected conditions. Notably, of the 1,180 genes exhibiting H3K9me2 deposition in Col-0, 1,129 genes (95.7%) were exhibiting H3K9me2 depletion uniquely in suvh5 (5 genes), or in suvh6 (892 genes), or in both mutants (232 genes) (Figure 9A). These intriguing data indicate that SUVH5 and SUVH6 are the key enzymes mediating H3K9me2 deposition in wild-type plants upon nematode infection. We also noted that 94% (330/352) of the genes showing H3K9me2 depletion in suvh5 mutant were also depleted in suvh6 (Figure 9A), a finding that further confirms the redundant function of SUVH5 and SUVH6.
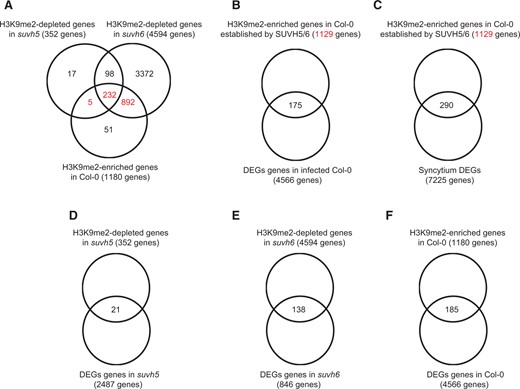
H3K9me2 signal deposition induced by H. schachtii in wild-type plants is primarily mediated by SUVH5 and SUVH6, and contributes to gene expression changes. A, Overlaps between H3K9me2-depleted genes in suvh5 or suvh6 and H3K9me2-enriched genes in Col-0 plants. Note that of the 1,180 genes exhibiting H3K9me2 deposition in Col-0, 1,129 genes exhibited H3K9me2 depletion uniquely in suvh5 (5 genes), or in suvh6 (892 genes), or in both mutants (232 genes). B, Overlap between DEGs identified in infected wild-type Col-0 plants and the 1,129 genes showing H3K9me2 deposition in infected wild-type plants and established by SUVH5 or SUVH6. The 175 overlapping genes are listed in Supplemental Data Set S12. C, Overlap between syncytium DEGs (Szakasits et al., 2009) and the 1,129 genes showing H3K9me2 deposition in infected wild-type plants and established by SUVH5 or SUVH6. The 290 overlapping genes are listed in Supplemental Data Set S13. D–F, Overlaps between DEGs and genes showing differential H3K9me2 deposition in suvh5 (D), suvh6 (E), and Col-0 (F).
H3K9me2 deposition mediated by SUVH5 and SUVH6 contributes to gene expression changes in nematode feeding sites
We examined the potential association between H3K9me2 signal and gene expression changes in Col-0 and mutant lines under H. schachtii-infected conditions. First, the expression levels of the 1,129 genes showing H3K9me2 deposition in infected Col-0 plants and established by SUVH5 or SUVH6 were examined in Col-0 plants. Of these 1,129 genes, 175 were differentially expressed in the wild-type (Figure 9B and Supplemental Data Set S12). However, this overlap was not statistically significant (χ2 = 6.744, P = 0.081). GO term analysis indicated that genes related to lipid metabolic process, catalytic activity, lyase activity, and lipase activity were overrepresented among the 175 genes.
The 1,129 genes were also examined for possible overlaps with previously reported syncytium DEGs (Szakasits et al., 2009). Interestingly, 290 of the syncytium-specific DEGs were common to the 1,129 gene list, indicating that there was a statistically significant enrichment of the syncytium DEGs among the 1,129 genes showing H3K9me2 deposition (25.69%, χ2 = 22.503, P = 5.118E−05) (Figure 9C and Supplemental Data Set S13). Genes involved in cellular nitrogen compound metabolic process, postembryonic development, transmembrane transporter activity, and catalytic activity were overrepresented among the 290 overlapping genes.
We next compared the DEGs identified in Col-0 and mutant lines with genes showing differential H3K9me2 deposition. The comparison revealed that 21, 138, and 185 genes overlapped between these two gene lists in suvh5, suvh6, and Col-0, respectively (Figure 9, D–F). While the overlaps between the two gene lists were not statistically significant according to χ2 test of independence (P-value cut off of 0.05), the 138 and 185 overlapping genes were enriched in specific GO terms. The suvh6 138 DEGs depleted in H3K9me2 mark were enriched in GO terms associated with protein amino acid phosphorylation, nucleoside binding, and catalytic activity. Similarly, the Col-0 185 DEGs enriched in H3K9me2 mark were enriched in GO terms associated with catalytic and carboxylesterase activity. Together, these results indicate that changes in H3K9me2 deposition mediated by SUVH5 and SUVH6 after nematode infection contribute to expression changes of genes involved in particular molecular functions and biological processes both in roots and nematode feeding sites.
SUVH5- and SUVH6-mediated H3K9me2 deposition associate with CG DNA methylation in H. schachtii-infected roots
Because H3K9me2 and DNA methylation can operate in a positive feedback loop (Rajakumara et al, 2011; Stroud et al, 2014; Du et al, 2015; Li et al, 2018), the association between H3K9me2 and DNA methylation was investigated using our list of differentially methylated genes (DMGs) identified in H. schachtii-infected Col-0 roots (Hewezi et al., 2017). Of the 1,180 protein-coding genes enriched in H3K9me2 in infected wild-type Col-0, 257 genes were also found to be differentially methylated (Figure 10A and Supplemental Data Set S14), indicating a statistically significant enrichment of the DMGs among the 1,180 protein-coding genes enriched in H3K9me2 signal (χ2 = 29.873, P = 1.468E-06). Similarly, we compared the 352 and 4,594 protein-coding genes showing enrichment in H3K9me2 mark in infected Col-0 plants versus infected suvh5 or suvh6, respectively, with our list of DMGs. We found that 89 (χ2 = 2.167, P = 0.539) and 1,137 (χ2 = 45.374, P = 7.712E-10) genes were both enriched in H3K9me2 signal and differentially methylated (Figure 10, B and C and Supplemental Data Sets S15 and S16). Further analysis revealed that the large majority of the genes enriched in H3K9me2 and differentially methylated were hypomethylated mainly in the CG sequence context (Figure 10, D–F). More specifically, 211 of the 257 DMGs enriched in H3K9me2 in Col-0 were hypomethylated in the CG context (Figure 10D and Supplemental Data Set S14). Similarly, 78 and 970 of the DMGs enriched in H3K9me2 in suvh5 and suvh6, respectively, were hypomethylated in the CG context (Figure 10, E and F and Supplemental Data Sets S15 and S16).
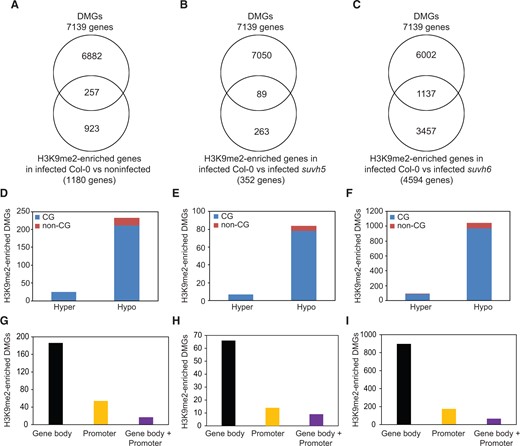
SUVH5- and SUVH6-mediated H3K9me2 deposition is associated with CG DNA methylation in H. schachtii-infected roots. A–C, Overlaps between DMGs identified in infected wild-type Col-0 plants and H3K9me2-enriched genes identified in infected Col-0 when compared with noninfected Col-0 (A), infected suvh5 (B) or infected suvh6 plants (C). The overlapping genes indicated in (A–C) are listed in Supplemental Data Sets S14–S16, respectively. DMGs were identified in the roots of H. schachtii infected wild-type Col-0 plants under similar conditions (Hewezi et al., 2017). D–F, Methylation directions and sequence contexts of the 257 (D), 89 (E), and 1,137 (F) DMGs enriched in H3K9me2 and shown in (A), (B), and (C), respectively. G–I, Numbers of genes showing differential DNA methylation in gene body, promoter, or in both gene body and promoter regions for the 257 (G), 89 (H), and 1,137 (I) DMGs enriched in H3K9me2 and shown in (A), (B), and (C), respectively.
Differential DNA methylation of the 257 DMGs enriched in H3K9me2 in Col-0 we found in gene body (186), promoter (54), and both in gene body and promoter regions (17) (Figure 10G and Supplemental Data Set S14). Differential DNA methylation of the 89 DMGs enriched in H3K9me2 in suvh5 we detected in gene body (66), promoter (14), and both in gene body and promoter regions (9) (Figure 10H and Supplemental Data Set S15). Similarly, DNA methylation changes of the 1,137 DMGs enriched in H3K9me2 in suvh6 were detected in gene body (897), promoter (174), and both in gene body and promoter regions (66) (Figure 10I and Supplemental Data Set S16). Together, these data point to an association between gene body CG hypomethylation and SUVH5- and SUVH6-mediated H3K9me2 in H. schachtii-infected roots.
Discussion
Recent studies have documented various molecular mechanisms through which plant miRNAs downregulate their target genes and modulate–plant interactions with parasitic cyst and root-knot nematodes (reviewed in Hewezi, 2020). In this study, we show how miR778 modulates the root transcriptome, histone methylation, and DNA methylation via posttranscriptional regulation of the H3K9 methyltransferases SUVH5 and SUVH6. Promoter activity and gene expression analyses indicated that nematode-inducted upregulation of miR778 in the syncytium mediates posttranscriptional silencing of SUVH5 and SUVH6 to facilitate nematode parasitism. The function of miR778 as a positive regulator of plant susceptibility to H. schachtii was established by our data showing that overexpression of miR778 significantly increased plant susceptibility, whereas its inactivation using a target mimicry approach decreased plant susceptibility. Surprisingly, mutants of SUVH5 and SUVH6 displayed a phenotype similar to MIM778 overexpression lines of reduced plant susceptibility. This decrease in plant susceptibility is evidently due to the induction of SUVH5 in the suvh6 mutants and similarly SUVH6 in the suvh5 mutants. Increased transcript abundance of SUVH1, 2, 3, and 4 in the suvh5/6 double mutant is equally contributed to the decreased susceptibility phenotype observed in this double mutant. These results point to a feedback regulatory mechanism controlling the expression of SUVH5 and SUVH6 in addition to other family members. While various H3K9 methyltransferases are known to function redundantly (Ebbs et al., 2005; Ebbs and Bender, 2006; Li et al., 2018), a feedback regulatory loop connecting the expression of SUVH5 and SUVH6 has not been described previously. This feedback mechanism seems to be required to sustain primarily the activity of SUVH5/6 as well as other SUVH family members in the suvh5 and suvh6 single and double mutants under noninfected conditions (Supplemental Figure S5 and Supplemental Data Sets S1 and S2).
Our analysis of H3K9me2 deposition in wild-type, suvh5, and suvh6 under both infected and noninfected conditions revealed infection-specific functions. Under noninfected conditions, SUVH5 and SUVH6 establish H3K9me2 deposition mainly in TEs, a finding which is in agreement with previous reports (Ebbs et al., 2005; Ebbs and Bender, 2006; Li et al., 2018). However, under H. schachtii infected conditions, the majority of H3K9me2 peaks identified in wild-type or mutant plants were associated with protein-coding genes. While H3K9me2 marks can be detected in euchromatic regions to some extent (Zheng et al., 2012), no SUVH family member has been shown to primarily target euchromatic regions. This finding suggests that other cellular factors may instruct the targeting specificity of SUVH5 and SUVH6 under nematode-infected conditions, and possibly in response to other biotic and abiotic stresses.
Deposition of the H3K9me2 mark is tightly associated with non-CG DNA methylation (Malagnac et al., 2002; Bernatavichute et al., 2008; Stroud et al., 2013, 2014; Du et al., 2015). This tight association is mediated via self-enforcing loops involving the SUVH family members SUVH4, SUVH5, and SUVH6 as well as the DNA methyltransferases CMT2 and CMT3 (Rajakumara et al., 2011; Stroud et al., 2014; Du et al., 2015; Li et al., 2018). In this feedback mechanism, SUVH4/5/6 methylate H3K9 to produce binding sites for CMT3 and CMT2, which methylate DNA, respectively, in the CHG and CHH contexts. Methylated CHG and CHH sites generate further binding sites for SUVH4/5/6 to maintain the silent status. Our data suggest that miR778-mediated downregulation of SUVH5 and SUVH6 upon nematode infection reduces their activity and hence the deposition of H3K9me2 marks, causing a reduction of DNA methylation levels in the targeted loci. This suggestion is in alignment with the widespread DNA hypomethylation patterns observed in H. schachtii-infected Arabidopsis roots under similar conditions (Hewezi et al., 2017). Interestingly, one-fourth of the protein-coding genes showing enrichment or depletion in H3K9me2 marks in infected wild-type, suvh5, or suvh6 were among the DMGs previously identified in H. schachtii-infected Col-0 roots (Hewezi et al., 2017), the large majority of which were hypomethylated mainly in the CG context (Figure 10). This finding relates with our data showing substantial overlaps of H3K9me2 peaks with protein-coding genes in which DNA methylation occurs mainly in the CG context (Takuno and Gaut, 2013; Bewick and Schmitz, 2017; Zilberman, 2017). The association between H3K9me2 deposition and CG methylation is surprising considering the finding that SUVH4/5/6 regulate non-CG methylation genome-wide (Stroud et al., 2013, 2014). However, several lines of evidence indicate that H3K9me2 and CG DNA methylation are also coordinated. For example, it has been shown that CG methylation and H3K9me2 were directly connected in their synergistic role of heterochromatin assembly (Soppe et al., 2002). Additionally, loss of CG methylation in mutant plants defective in METHYLTRANSFERASE1 (MET1), the key enzyme responsible for CG methylation, was associated with a substantial reduction in H3K9me2 signal (Tariq et al., 2003; Kim et al., 2014; Stroud et al., 2014). Furthermore, large scale epigenome analysis suggested that SUVH5 and SUVH6 may be required to guide MET1-mediated CG methylation to CG sites (Zhang et al., 2018). This suggestion was recently confirmed by Li et al. (2018) showing that SUVH5 recruitment exhibits strong preference for methylated CG context, whereas SUVH6 can equally bind to both CG and non-CG methylated sites. Taken together, our results suggest that under H. schachtii-infected conditions, SUVH5 and SUVH6 are the main enzymes mediating H3K9me2 deposition in protein-coding genes, which are also associated with CG methylation. This is in contrast to normal developmental conditions where H3K9me2 deposition in wild-type plants is mainly driven by SUVH4 and regulates non-CG methylation (Stroud et al., 2013).
Our analysis provided intriguing insights into the mechanism through which SUVH5 and SUVH6 regulate plant response to H. schachtii infection. miR778 induced downregulation of SUVH5 and SUVH6 in the nematode feeding sites reduces H3K9me2 deposition and subsequently DNA methylation in protein-coding and miRNA genes, leading to gene expression changes and transcriptome reprogramming of syncytial cells. Despite the overlaps between genes showing significant changes in expression upon nematode infection and those showing differential H3K9me2 deposition in Col-0 or mutant lines were not statistically significant, the overlapping genes were enriched in specific biological processes and molecular function, including kinase activity, catalytic activity, carboxylesterase activity, and binding activity, for example.
Our results revealed that SUVH5 and SUVH6 are the key enzymes responsible for >95% of H3K9me2 deposition in protein-coding genes in wild-type roots after H. schachtii infection. More specifically, out of the 1,180 genes exhibiting H3K9me2 deposition in Col-0, 1,129 genes showed H3K9me2 depletion in suvh5 and/or suvh6 mutants. Our analysis relating H3K9me2 deposition to gene transcriptional activity suggests that changes in H3K9me2 deposition mediated by SUVH5 and SUVH6 after nematode infection contribute to substantial changes in the expression of 175 genes in the roots of wild-type plants (Figure 9B). Absence of significant effects on the expression of the remaining 954 can be explained by the possibility that changes in H3K9me2 deposition of these genes induce only slight nonsignificant changes in expression, and that additional epigenetic marks are needed to induce significant changes. Another possibility is that changes in H3K9me2 deposition occur mainly in the syncytium, leading to syncytium-specific gene expression changes, which cannot be detected by analyzing whole root transcriptome performed in this study. In line with this possibility, 290 of the 1,129 genes showing H3K9me2 deposition in wild-type roots upon H. schachtii infection and mediated by SUVH5/6 are among the previously reported syncytium DEGs (Szakasits et al., 2009). It may be important to mention that using whole root tissues for the analysis of gene expression and H3K9me2 deposition probably prevented us from revealing the precise association between H3K9me2 mark and gene expression that occurs in the syncytium. Therefore, the importance of H3K9me2-induced gene expression changes in the syncytium is unlikely to be completely understood until the development of syncytial single-cell transcriptome and epigenome profiling.
In the next section, we will focus our discussion on the 175 DEGs showing H3K9me2 deposition in wild-type roots upon H. schachtii infection and mediated by SUVH5/6. Consistent with the silencing function of H3K9me2 mark (Vaillant and Paszkowski, 2007), 104 of these 175 were downregulated in infected wild-types roots as compared with noninfected control roots. The remaining 71 genes were upregulated, implying that H3K9me2 marks are not strictly associated with transcriptional suppression. H3K9 methylation inhibits binding of RNA polymerase II and its associated regulatory factors to gene promoter, leading to gene silencing. H3K9me2 marks may also facilitate recruiting downstream silencing effectors to further inhibit gene transcription (Xu and Jiang, 2020). Additionally, H3K9me2 marks in gene body regions may alter the kinetic and elongation rate of RNA polymerase II, thereby impacting gene expression levels (Maor et al., 2015). Other studies also reported the association between H3K9me2 mark and gene activation (Jiang et al., 2017). One possible explanation is that DNA methylation associated with the deposition of H3K9me2 mark in the gene body region may lead to gene activation. DNA methylation in gene body has been shown to enhance gene transcription in response to cyst nematode infection (Rambani et al., 2015; Hewezi et al., 2017; Rambani et al., 2020b). Another explanation is that deposition of H3K9me2 marks in promoter and other regulatory regions my mask the binding sites of transcriptional repressors, causing transcriptional activation.
The 175 genes included several encoded functions related to plant–nematode interactions, including defense response (Goverse and Smant, 2014; Holbein et al., 2016), phytohormone signaling (Gheysen and Mitchum, 2019), cell wall modifications (Bohlmann and Sobczak, 2014), intracellular protein trafficking (Bayless et al., 2016, 2018), oxidation reduction (Siddique et al., 2014), and cytoskeleton organization (de Almeida Engler and Favery, 2011). Genes involved in defense response and immunity included, for example, three pathogenesis-related thaumatin superfamily proteins and a defensin-like family protein. We also found a type I metacaspase and a short-chain dehydrogenase/reductase 3, which have been shown to play important roles in programmed cell death and defense response, respectively (Coll et al., 2010; Hwang et al., 2012). Genes involved in phytohormone response, transport or signaling included ABA INSENSITIVE 3, which is involved in the abscisic acid (ABA) response (Giraudat et al., 1992), and ABA-INDUCED TRANSCRIPTION REPRESSOR 6, which is involved in ABA signaling (Tian et al., 2017b), ETHYLENE RESPONSE FACTOR 74, BRASSINOSTEROID INACTIVATOR2, which functions in brassinosteroid homeostasis (Zhang and Xu, 2018), indole-3-acetic acid inducible 32, which is involved in auxin response (Hagen and Guilfoyle, 2002), the IAA-amido synthase GH3.3, which is involved in auxin homeostasis (Gutierrez et al., 2012), and an auxin efflux transmembrane transporter. Genes encoding functions associated with cell-wall modifications included BETA-XYLOSIDASE 1, which is involved in secondary wall thickening (Wei et al., 2015), IRREGULAR XYLEM 14, which is involved in secondary cell wall synthesis (Taylor-Teeples et al., 2014; Mortimer et al., 2015), and the ABCG2 and ABCG16 half-transporters required for biosynthesis of suberin barrier in roots (Yadav et al., 2014). Structural analysis of cell walls of nematode feeding sites formed by H. schachtii in Arabidopsis roots indicated a role of suberin in syncytium formation (Bohlmann and Sobczak, 2014). Among this gene list, we identified BEX5/RabA1b, transparent testa 9, and vacuolar protein sorting 41, which are involved in intracellular protein trafficking (Seals et al., 2000; Feraru et al., 2012; Ichino et al., 2014; Takemoto et al., 2018). Genes involved in protein soring and intracellular protein trafficking have been shown to impact plant interactions with various pathogens including cyst nematode (Bayless et al., 2016; Gu et al., 2017; Bayless et al., 2018; Petre et al., 2021).
Also, of relevance to plant–nematode interactions is that changes in H3K9me2 marks were linked to altered expression of genes encoding microtubule-associated proteins including basic proline-rich protein3 (Wong et al., 2019) and GROWING PLUS-END TRACKING PROTEIN 2 (Wong and Hashimoto, 2017). Notably, seven genes encoding lipases were identified, including GDSL-motif lipase 5, which has been shown to be involved in defense response (Oh et al., 2005). Among this gene list we also identified genes with possible roles in changing the chemical properties of proteins, including the AT-hook motif nuclear localized protein 21 and the chromatin remodeling factors ULTRAPETALA2, which function in tissue differentiation (Ng and Yu, 2009; Monfared et al., 2013) as well as the methionine adenosyltransferase 3, which contributes to DNA methylation in various sequence contexts both in genes and TEs (Meng et al., 2018). These findings demonstrate that altering the chemical properties of chromatin remodeling factors as well as other transcriptional regulators can be far more complex and amplifying the effects of SUVH5 and SUVH6, leading to transcriptional changes of host genome upon nematode infection.
Taken together, our results provide intriguing evidence about the regulatory functions of miR778 and its SUVH5 and SUVH6 targets in establishing plant responses to nematode infection through reprogramming root transcriptome, histone methylation, and possibly DNA methylation. This reprogramming seems to impact directly and indirectly the expression of a substantial number of genes encoding functions related to plant–nematode interactions. Also, our results revealed a key role of miR778 in coordinating the establishment of various epigenetic modifications during H. schachtii parasitism of Arabidopsis.
Materials and methods
Plant materials and growth conditions
All transgenic Arabidopsis (A.thaliana) lines were generated in the Col-0 ecotype background. T-DNA insertional mutants for suvh5 (GK-263C05 and FLAG_280C12), suvh6 (SAIL_1244_F04 and SALK_071138C) were obtained from Arabidopsis Biological Resource Center (Supplemental Figure S2A). Seeds of suvh5/suvh6 double mutant (Ebbs and Bender, 2006) were provided by Dr. Judith Bender (Brown University). The suvh5/suvh6 double mutant was constructed using suvh5-2 (SALK_074957) and suvh6-1 (SAIL_864_E08) (Ebbs and Bender, 2006). All mutant lines were in the Col-0 background, except FLAG_280C12, which is in the WS background. The mutant lines GK-263C05 (Zheng et al., 2012) and SAIL_1244_F04 (Wang et al., 2015) have been previously characterized as knockout mutants. SUVH5 and SUVH6 expression levels of these genes were quantified in FLAG_280C12 and SALK_071138C lines and wild-type plants using RT-qPCR. Length of the main root of at least 15 2-week-old plants per line was measured and statistically significant differences from wild-type plants were calculated using analysis of variance (ANOVA) (P < 0.05). Plants were gown in controlled growth chambers at 22°C under long-day photocycles, 16 h of light and 8 h of dark.
Generation of transgenic lines
The promoter:GUS construct for miR778 was generated by amplifying a 844-bp genomic region upstream of the precursor sequence of miR778 from Col-0 genomic DNA. The promoter:GUS constructs for SUVH5 and SUVH6 were generated by amplifying, respectively, 1,579- and 2,148-bp genomic region upstream of the translation start codon (ATG). Primers containing restriction enzyme sites used for PCR amplification are provided in Supplemental Table S1. The amplified PCR fragments were digested, purified, and cloned upstream of the GUS gene in the binary vector pBI101. The binary vector of miR778 overexpression was constructed by amplifying the miR778 precursor (200 bp) from Col-0 genomic DNA using primers containing BamHI and SacI restriction enzyme sites in the forward and reverse primers, respectively. The amplified PCR product was digested, purified, and cloned into the pBI121 vector downstream of the 35S promoter. For the MIM778 overexpression, the 22-nucleotide region of the noncoding Arabidopsis IPS1 gene that is complementary to miR339 was replaced by a mimic sequence for the mature miR778 as previously described by Hewezi et al. (2016). The mimic sequence (MIM778) contains a three-nucleotide bulge (TTC) at nucleotide number 12 through 14 as well as two additional mismatches at nucleotide numbers 2 and 11. The MIM778-containing IPS1 gene was then cloned into the pBI121 vector under the control of the 35S promoter using BamHI and SacI restriction enzyme sites in the forward and reverse primers, respectively. The primers used for cloning are listed in Supplemental Table S1. All constructs were confirmed by sequencing before transferring into Agrobacterium tumefaciens (strain C58). Agrobacteria containing the binary vectors were then used to transform Arabidopsis (Col-0) using the floral dip method (Clough and Bent, 1998). Transgenic T1 plants were screened on MS medium containing 50 mg/L kanamycin and 100 mg/L cefotaxime. Transgenic T1 lines were self-fertilized to generate T2 lines. T2 and subsequent generations were used for GUS assays.
Histochemical analysis of GUS activity
The transgenic GUS:reporter lines were assayed for GUS activity at several time points after H.schachtii infection. Seeds were surface sterilized using a 2.8% (v/v) bleach solution for 5 min followed by several washes with sterilized distilled water. Sterilized seeds were germinated on modified Knops’s medium solidified with 0.8% (w/v) Daishin agar. Ten-day-old plants were inoculated with ∼100 surface-sterilized second-stage juveniles (J2) of H. schachtii. GUS staining was performed according to Jefferson et al. (1987). Briefly, samples were incubated with the X-Gluc substrate (5-bromo-4-chloro-3-indolyl-beta-d-glucuronic acid, cyclohexylammonium salt) at 37°C and checked every 30 min for colorimetric changes. Once staining was evident, the GUS solution was removed, and the samples were stored in 70% (v/v) ethanol at room temperature to terminate the GUS reaction. Three independent reporter lines were assayed, each with at least 24 replicated plants per line. Immediately following staining, H. schachtii-induced syncytia were imaged using the EVOS M7000 microscope.
RT-qPCR analysis
For quantifying the expression levels of primary and mature miR778, total RNA was extracted using Trizol (Invitrogen, Waltham, MA, USA) following the manufacturer’s protocol. Total RNA was then polyadenylated and reverse transcribed using the Mir-X miRNA First-Strand Synthesis Kit (Clonetech, Mountain View, CA, USA). Approximately 50 ng of the synthesized cDNA was used as a template in the RT-qPCR reaction containing TB green Advantage qPCR mix (Takara, Shiga, Japan) according to the manufacturer’s instructions. The mature miR778 sequence with two adenines on the 3′ end was used as forward primer to quantify the expression levels of mature miR778. Similarly, a 21 nt-specific precursor sequences were used as forward primer to quantify the expression levels of primary miR778. For both primary and mature miR778 quantification, the universal mRQ 3′ primer was used as the reverse primer. Both the U6 small nuclear RNA included in the Mir-X miRNA First-Strand Synthesis Kit (Clonetech) as well as the 60S ribosomal (AT2G44860) genes were used as reference genes to normalize miR778 gene expression. The PCR reactions were performed using the following program: 95°C for 3 min followed by 40 cycles of 95°C for 30 s and 60°C for 30 s in QuantStudio 6 Flex Real-Time PCR System (Applied Biosystems, Waltham, MA, USA). The PCR products were then exposed to a temperature ramp to generate the dissociation curves and determine amplification specificity. The dissociation program was 95°C for 15 s and 50°C for 15 s, followed by a slow gradient from 50°C to 95°C.
To quantify the expression of MIM778, SUVH5, and SUVH6 in various overexpression and mutant lines, total RNA used was extracted according to Verwoerd et al. (1989). Total RNA was then treated with DNase I (Invitrogen), and ∼50 ng of DNase-treated RNA were used as a template for RT-qPCR with Verso SYBR green One-Step RT-qPCR mix (Thermo Scientific, Waltham, MA, USA) according to the manufacturer’s instructions. The MIM778 transcript level was quantified using MIM778 sequences as forward primer and downstream IPS1-specific sequence as a reverse primer. RT-qPCR reactions were performed in the QuantStudio 6 Flex Real-Time PCR System (Applied Biosystems, USA) and the RT-qPCR program was 50°C for 15 min, 95°C for 15 min followed by 40 cycles of 95°C for 15 s, 60°C for 90 s and 72°C for 30 s. Gene expression levels were normalized using Actin8 (AT1G49240) and PROTEIN PHOSPHATASE 2A SUBUNIT A3 (PP2AA3, AT1G13320) as reference genes. Primers used in this study are listed in Supplemental Table S1.
Nematode infection assay
Sterilized seeds of wild-type and various overexpression and mutant lines were germinated in a randomized block design in 12-well plates as previously stated. Ten-day-old seedlings were then inoculated with ∼200 surface-sterilized J2 H. schachtii. Plates were incubated in the dark at 24°C for 3 days directly following inoculation to facilitate nematode infection. The plates were then placed in a growth chamber at 24°C under long-day photocycles, 16 h of light and 8 h of dark. The number of J4 female nematodes per root system was determined 3 weeks after infection. Two independent experiments were conducted, each with 20 replicated plants per genotype. Statistically significant differences between the mutant or overexpression lines and the corresponding wild-type controls were calculated using ANOVA in the statistical software package SAS, where P-values ˂ 5% were considered statistically significant.
RNA-seq analysis
Seeds of suvh5 (GK-263C05) and suvh6 (SALK_1244_F04) and wild-type Col-0 were germinated in petri plates containing modified Knop’s medium. Ten days postgermination, the plants were inoculated with ∼100 J2 H. schachtii per plant. Inoculated plants were incubated in the dark at 24°C for 24 h to facilitate nematode infection. Following incubation, inoculated plants were placed in a growth chamber at 24°C under long-day photocycles, 16 h of light and 8 h of dark. Five dpi, whole root tissues were collected from H. schachtii-infected and noninfected control plants in three biological samples. Total RNA was extracted using Trizol reagent (Invitrogen) using the Zymo Direct-zol RNA Miniprep Plus kit (R2071). RNA quality was assessed using an RNA nano bioanalyzer chip (Agilent 2100). mRNAs were isolated using olido(dT) beads following the addition of a 3′ poly(A) tail for the construction of a nonstranded, nondirectional mRNA library. The 18 RNA-seq libraries were then multiplexed and sequenced using the NovaSeq 6000 (Illumina, San Diego, CA, USA), outputting 150-bp paired-end reads. Quality assessment was performed on fastq raw data files using FastQC (http://www.bioinformatics.babraham.ac.uk/projects/fastqc/). High quality paired-end RNA-seq reads were mapped to the A.thaliana reference genome (TAIR10.28) with STAR (version 2.5) (Dobin et al., 2013) using default settings. Uniquely mapped paired-end reads were counted using Htseq (version 0.10.0) (Anders et al., 2015). Then, read counts of uniquely mapped reads were used to identify DEGs using DESeq2 package in R (Love et al., 2014) with an adjusted P-value cutoff of 0.05. GO terms enrichment analysis of the DEGs was performed using agriGO database (Du et al., 2010) with Fisher’s exact test and Bonferroni multi-test adjustment with a significance cutoff P-value of 0.05. The Web server REVIGO was used to summarize the list of GO terms (Supek et al., 2011). KEGG pathway analysis was conducted using KOBAS version 2.0 (Xie et al., 2011) with adjusted P-values ˂ 0.05 were considered as statistically significant.
ChIP-seq analysis
Seeds of suvh5 (GK-263C05) and suvh6 (SALK_1244_F04) and wild-type Col-0 plants were inoculated, and root tissues were collected from infected and noninfected control plants at 5 dpi as described above. ChIP-DNA was extracted from three biological samples, collected from several plants, for each genotype per condition using the Anti-Histone H3 (di methyl K9) ChIP Grade antibody (ab1220) following the manufacturer’s protocol (Abcam, Cambridge, UK). Libraries were prepared according to the manufacturer’s instructions using the NEBNext Ultra II DNA Library Prep Kit (NEB E7645). The 18 ChIP-seq libraries (3 genotypes × 2 conditions × 3 biological samples) were multiplexed and sequenced using the NovaSeq 6000 (Illumina) to produce 150-bp paired-end reads. Quality assessment was performed on fastq raw data files using FastQC (http://www.bioinformatics.babraham.ac.uk/projects/fastqc/). Trimmomatic (version 0.39) (Bolger et al., 2014) was used to trim adapter sequences, poor quality reads, and overrepresented sequences from raw data followed by additional quality assessments for trimmed data using FastQC. Paired-end ChIP-seq reads were mapped to the A.thaliana reference genome (TAIR10.28) with Bowtie2 (version 2.2.9) (Langmead and Salzberg, 2012) using the very sensitive mapping parameter. Mapping depth and coverage were determined using Samtools (version 1.3.1) (Li et al., 2009) and IGV (version 2.7.2) (Robinson et al., 2017), respectively. The mapping output files of the three replicates for each genotype per condition were merged to call H3K9me2 peaks using the broad peak function of MACS2 (version 2.1.1.2) (Zhang et al., 2008) for paired-end reads. Peaks were then annotated using the closest function of Bedtools2 (version 2.29.2) (Quinlan and Hall, 2010). For noninfected samples, peaks were identified to be depleted in suvh5 and suvh6 by comparing Col-0 to each mutant. Peaks enriched in H. schachtii-infected Col-0 were called by comparing infected Col-0 to noninfected Col-0. Peaks depleted in H. schachtii-infected suvh5 and suvh6 were called by comparing to infected Col-0. The H3K9me2 peak signal levels were quantified using the log2 reads per kilobase per million mapped reads using deepTools2 (version 3.5.0) (Ramírez et al., 2016), and used to generate heatmaps.
ChIP-qPCR
ChIP-qPCR assays were performed using 1:10 dilutions of the ChIP-seq libraries of noninfected Col-0, suvh5, and suvh6 plants. PCR conditions and enrichment analysis were performed as previously described by Piya et al. (2020). PP2AA3 was used as an internal control. Primer sequences used for ChIP-qPCR quantification are included in Supplemental Table S1.
Determining statistical significance of overlap between various gene lists
Statistical significance of overlap between various gene lists was determined using chi-square tests of independence as previously described by Hewezi et al. (2012), given that 24,778 genes were considered as expressed showing at least one read in one RNA-seq sample.
Accession numbers
RNA-seq and ChIP-seq data reported in this manuscript are available at the NCBI GEO database under the accession numbers GSE173818 and GSE173812, respectively. Sequence data from this article can be found in the GenBank/EMBL data libraries under accession numbers miR778 (AT2G41616), SUVH1 (AT5G04940), SUVH2 (AT2G33290), SUVH3 (AT1G73100), SUVH4 (AT5G13960), SUVH5 (AT2G35160), SUVH6 (AT2G22740), IPS1 (AT3G09922), ACT-domain containing protein (AT1G69040), CYTOCHROME P450 (AT4G37370), SUCROSE TRANSPORTER 1 (AT1G22710), RAFFINOSE SYNTHASE 2 (AT3G57520), SKU5 SIMILAR 4 (AT4G22010), 60S (AT2G44860), Actin8 (AT1G49240), and PP2AA3 (AT1G13220).
Supplemental data
The following materials are available in the online version of this article.
Supplemental Figure S1. Promoter activity of miR778 and its target genes SUVH5 and SUVH6 in 2-week-old noninfected roots.
Supplemental Figure S2. Root phenotypes of transgenic Arabidopsis plants overexpressing miR778 or MIM778.
Supplemental Figure S3. Characterization of SUVH5 and SUVH6 mutants.
Supplemental Figure S4. Transcriptome analysis of suvh5 and suvh6 mutants under noninfected conditions.
Supplemental Figure S5. SUVH5 and SUVH6 expression is controlled through a feedback mechanism.
Supplemental Figure S6. ChIP-qPCR quantification of H3K9me3 signals in Col-0 relative to suvh5 or suvh6 under noninfected conditions.
Supplemental Data Set S1. List of DEGs identified in the root tissues of suvh5 under noninfected conditions.
Supplemental Data Set S2. List of DEGs identified in the root tissues of suvh6 under noninfected conditions.
Supplemental Data Set S3. List of DEGs identified in H. schachtii-infected root tissues of suvh5 compared to infected wild-type Col-0.
Supplemental Data Set S4. List of DEGs identified in H. schachtii-infected root tissues of suvh6 compared to infected wild-type Col-0.
Supplemental Data Set S5. List of DEGs identified in H. schachtii-infected root tissues of wild-type Col-0.
Supplemental Data Set S6. List of H3K9me2 peaks depleted in suvh5 under noninfected conditions.
Supplemental Data Set S7. List of H3K9me2 peaks depleted in suvh6 under noninfected conditions.
Supplemental Data Set S8. List of H3K9me2 peaks depleted in H. schachtii-infected suvh5 compared to infected Col-0.
Supplemental Data Set S9. List H3K9me2 peaks depleted in H. schachtii-infected suvh6 compared to infected Col-0.
Supplemental Data Set S10. List of H3K9me2 peaks enriched in H. schachtii-infected Col-0 compared to noninfected Col-0.
Supplemental Data Set S11. List of H3K9me2 peaks depleted in H. schachtii-infected Col-0 compared to noninfected Col-0.
Supplemental Data Set S12. List of 175 genes showing overlap between DEGs identified in infected wild-type Col-0 plants and the 1,129 genes showing H3K9me2 deposition in infected wild-type plants and established by SUVH5 or SUVH6.
Supplemental Data Set S13. List of 290 genes showing overlap between syncytium DEGs and the 1,129 genes showing H3K9me2 deposition in infected wild-type plants and established by SUVH5 or SUVH6.
Supplemental Data Set S14. List of 257 genes showing overlap between DMGs and H3K9me2-enriched genes identified in infected Col-0 when compared with noninfected Col-0.
Supplemental Data Set S15. List of 89 genes showing overlap between DMGs and H3K9me2-enriched genes identified in infected Col-0 when compared with infected suvh5.
Supplemental Data Set S16. List of 1,137 genes showing overlap between DMGs and H3K9me2-enriched genes identified in infected Col-0 when compared with infected suvh6.
Supplemental Table S1. Gene identification numbers and primers used in this study.
Acknowledgments
We thank Hollis J. Rice for help with nematode infection assays, Tracy Hawk, Sobhan Bahrami, and several undergraduate students in the Hewezi laboratory for technical assistance. Also, we would like to thank Dr. Judith Bender for suvh5/suvh6 seeds.
Funding
This work was supported by funding from the University of Tennessee, Institute of Agriculture to the Hewezi Laboratory as well as by funding from the National Science Foundation (award no. IOS-1145053 to T.H. and T.J.B.). This work also was supported by the State of Iowa and Hatch funds.
Conflict of interest statement. The authors have no conflicts of interest to report.
T.H. and T.J.B. conceived and designed the original research plans. M.B. performed the experiments, analyzed the data, and wrote the first draft. S.P. provided assistance to M.B. in data analysis. T.H. supervised the experimental work, analyzed the data, and wrote the final version.
The author responsible for distribution of materials integral to the findings presented in this article in accordance with the policy described in the Instructions for Authors (https://dbpia.nl.go.kr/plphys/pages/general-instructions) is: Tarek Hewezi ([email protected]).
References
Author notes
Senior author
