


Abstract
Inorganic phosphate (Pi) is the predominant form of phosphorus (P) readily accessible to plants, and Pi Transporter 1 (PHT1) genes are the major contributors to root Pi uptake. However, the mechanisms underlying the transport and recycling of Pi within plants, which are vital for optimizing P use efficiency, remain elusive. Here, we characterized a functionally unknown rice (Oryza sativa) PHT1 member barely expressed in roots, OsPHT1;7. Yeast complementation and Xenopus laevis oocyte assay demonstrated that OsPHT1;7 could mediate Pi transport. Reverse-transcription quantitative polymerase chain reaction and histochemical analyses showed that OsPHT1;7 was preferentially expressed in source leaves and nodes. A further fine-localization analysis by immunostaining showed that OsPHT1;7 expression was restricted in the vascular bundle (VB) sheath and phloem of source leaves as well as in the phloem of regular/diffuse- and enlarged-VBs of nodes. In accordance with this expression pattern, mutation of OsPHT1;7 led to increased and decreased P distribution in source (old leaves) and sink organs (new leaves/panicles), respectively, indicating that OsPHT1;7 is involved in P redistribution. Furthermore, OsPHT1;7 showed an overwhelmingly higher transcript abundance in anthers than other PHT1 members, and ospht1;7 mutants were impaired in P accumulation in anthers but not in pistils or husks. Moreover, the germination of pollen grains was significantly inhibited upon OsPHT1;7 mutation, leading to a >80% decrease in seed-setting rate and grain yield. Taken together, our results provide evidence that OsPHT1;7 is a crucial Pi transporter for Pi transport and recycling within rice plants, stimulating both vegetative and reproductive growth.
Introduction
Phosphorus (P) is an essential macronutrient indispensable for plant growth and development, serving as a constituent of many biologically important molecules such as phospholipids, nucleic acids, and P-containing proteins and carbohydrates (Raghothama, 1999; Wang et al., 2021a). Mined rock phosphate (Pi) is the predominant source for P fertilizers. Unlike nitrogen, however, rock Pi is a nonrenewable resource and has been estimated to be exhausted within several decades to four hundred years (Oelkers and Valsami-Jones, 2008; Van Kauwenbergh, 2010). To cope with the lack and/or fluctuation of this nutrient, plants have evolved an array of adaptive strategies involving diverse metabolic and morphological changes (Lambers and Plaxton, 2015; Gu et al., 2021; Liu, 2021; Wang et al., 2021b). On the other hand, the excessive use of P fertilizers in agricultural production results in severe environmental pollutions. Thus, there is an urgent need to reduce the dependence on P fertilizers, a major solution to which is to improve crop P efficiency.
Crop P efficiency is classified into two categories, namely P acquisition efficiency (PAE) and P use efficiency (PUE), both of which can be measured by a suite of different parameters (Hammond et al., 2009; Chen and Liao, 2017). PAE reflects the plant capacity to take up Pi from soil, while PUE encompasses a wide range of physiological, structural, and developmental traits, all of which lay an effect on the distribution/redistribution of P among different organs/tissues (Veneklaas et al., 2012; Wang et al., 2019). To date, uneven attention has been paid to PAE over PUE, with much work focused on the mechanisms of root Pi uptake, which is closely related to PAE and heavily relies on the Pi Transporter 1 (PHT1) members (Ayadi et al., 2015); however, the mechanisms underlying the transport and recycling of P within plants, which is vital for improving crop PUE, remain poorly understood. Plant internal P recycling (P redistribution) is comprised of several steps, namely, breakdown or replacement of organic P, export of vacuolar P into cytoplasm, and transport of P from old organs to young and/or actively growing parts (Xu et al., 2019; Cong et al., 2020; Wang et al., 2020). The latter two steps require the coordination of Pi transporters (PTs) from different families.
Membrane transporters have been recognized as key factors for potentially improving crops and increasing sustainable food production (Schroeder et al., 2013; Gu et al., 2016). In angiosperms, most of the reported PHT1 genes are expressed in roots (Shin et al., 2004; Ai et al., 2009; Jia et al., 2011; Remy et al., 2012; Wang et al., 2014; Ye et al., 2015; Zhang et al., 2015, 2021; Chang et al., 2019), and it has been established that PHT1 proteins are probably the only influx transporter for Pi uptake (Ayadi et al., 2015). In addition, PTs belonging to the SYG1/PHO81/XPR1-Major Facilitator Superfamily (also known as the Vacuolar Pi Transporter or PHT5) family and the Glycerol-3- Pi Transporter family are responsible for the Pi transport into and out of vacuole across the tonoplast (vacuolar membrane) in response to sufficient Pi and deficient Pi, respectively (Wang et al., 2012, 2015, 2021c; Liu et al., 2015, 2016; Xu et al., 2019). As compared with the documented findings regarding the transporters for Pi uptake and subcellular Pi transport across tonoplast, the knowledge on the intercellular Pi transport during P redistribution is still limited, especially that at the cellular resolution. In Arabidopsis (Arabidopsis thaliana), AtPHT1;5 is expressed in the phloem of vascular bundles (VBs) of senescing leaves, and mediates P redistribution from source leaves to sink organs (Mudge et al., 2002; Nagarajan et al., 2011). In barley (Hordeum vulgare), HvPHT1;6 expression is mainly restricted to the phloem of VBs of old leaves, and has been suggested to play a role in P redistribution (Rae et al., 2003; Preuss et al., 2010). Recently, we functionally characterized a PHT1 member in rice (Oryza sativa), OsPHT1;3. OsPHT1;3 is specifically expressed in the phloem of both regular VB (RVB; PR) and enlarged VB (EVB; PE) of basal nodes, and it is responsible for P redistribution from old to young leaves (Chang et al., 2019). Despite this progress, several open questions remain regarding the mechanisms underlying P redistribution at the physiological and molecular levels: (1) Does the translocation of Pi from mesophyll cells (MCs; the major P storage cells in monocots) to bundle sheath (BS; a cell layer surrounding the VB serving as an apoplastic barrier) and then to the phloem parenchyma cells (PPCs)/companion cells (CCs) in source leaves (short-distance transport) undergo symplastic pathway or apoplastic pathway or both? (2) If symplastic pathway is involved, what is the driving force for the afore-mentioned short-distance transport? (3) To what extent does the “pressure-flow hypothesis” for sugar movement in phloem fit to P redistribution; (4) If apoplastic pathway is required, which transporters are responsible for Pi export from MCs and Pi influx into BS cells and PPCs/CCs?
The anther is a plant reproductive organ producing the male gamete, pollen, thus its development is an important determinant for crop yield maintenance. In rice, within ten days prior to flowering, a >10-fold increase in anther Pi content has been reported (Yamada, 1972). However, the biological role of this Pi accumulation in anther and the PTs mediating Pi influx into anther are still unclear. AtPHT1;6 is mainly transcribed in anthers and mature pollen grains; strong expression of AtPHT1;7 is also observed in mature pollen grains (Mudge et al., 2002). However, their roles in anther P accumulation and the potential physiological impact on reproductive growth are unknown.
Many PHT1 genes are broadly expressed throughout plants in addition to roots, making a specific role in a certain biological process unlikely (Wang et al., 2016). Indeed, several lines of evidence show that some PHT1 members participate in at least two biological processes involving intercellular Pi transport (Ai et al., 2009; Chang et al., 2019). In addition, several constraints in previous studies signify the necessity for further investigations: (1) the lack of fine-localization analysis of PTs at the cellular resolution and insufficient anatomic analysis might compromise the understanding of the Pi transport processes and (2) the information regarding the physiological roles of PTs at reproductive stage is lacking. In the present work, we functionally characterized a rice PHT1 gene, OsPHT1;7 (PHT1;7 hereafter), preferentially expressed in shoot organs. Our results demonstrate that the apoplastic pathway is required for P redistribution during which PHT1;7 exerts its function in the BS and PPCs/CCs of source leaves and in nodes, and that PHT1;7-mediated anther P accumulation is vital for yield maintenance.
Results
PHT1;7 responds to Pi starvation in the shoot basal region and old leaf and shows the highest expression level in anthers
At the very beginning of this work, we failed to detect any expression of PHT1;7 in the roots and the young leaves of rice seedlings subjected to either high P or low P treatments. This prompted us to speculate that: (1) PHT1;7 is a pseudogene or (2) it is expressed in certain cell types and/or is induced by (an) unknown stimulus/stimuli. To test these speculations, we split the shoot into individual leaves and shoot basal region (SBR; composed of basal node and the basal part of leaf sheaths [LSs]). Reverse transcription-quantitative polymerase chain reaction (RT-qPCR) analysis showed that PHT1;7 was barely expressed in root and the two new leaves (leaves 6 and 7), whereas strong expression was detected in SBR and old leaves (leaves 3–5). PHT1;7 was transcriptionally induced by low P stress in all the tissues where it was expressed except in leaf 5 (Figure 1A).
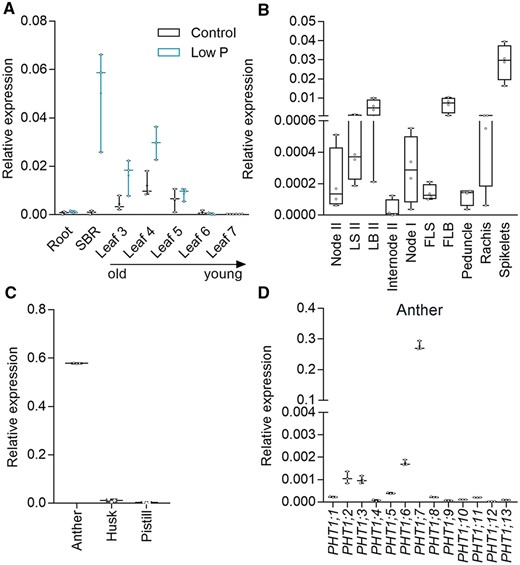
Temporal and spatial expression of PHT1;7 and expression of PHT1 family genes in rice anthers. A, Relative expression of PHT1;7 in root, SBR and leaves (leaves 3–7) of seven-leaf-old seedlings treated with control (90 μM Pi) or low P (1 μM Pi) nutrient solution for 14 d since the fourth leaf appeared. B, Relative expression of PHT1;7 in different tissues, including the node II, LS II, LB II, internode II, node I, flag LS, FLB, peduncle, rachis, and spikelet, that were sampled from rice cultivated in a paddy field 1 d before anthesis. C, Relative expression of PHT1;7 in floral organs, including the anther, husk, and pistil, collected from spikelets 1 d before anthesis. D, Relative expression of rice PHT1 family genes (13 members) in rice anthers. Gene expression level was determined by RT-qPCR. OsActin1 (LOC_Os03g50885) was used as an internal control. All data are plotted with box and whiskers plots: whiskers plot represents minimum and maximum values, and box plot represents second quartile, median and third quartile.
At the reproductive stage, PHT1;7 showed a moderate expression level in leaf blade II (LBII) and flag LB (FLB), and a much higher abundance in spikelet (Figure 1B). To further investigate the expression pattern of PHT1;7 in spikelet, we dissected the spikelet into husk, anther, and pistil, and found that PHT1;7 was mainly transcribed in anther (Figure 1C), consistent with the microarray data obtained from the RiceXPro database (Supplemental Figure S1; http://ricexpro.dna.affrc.go.jp/; Sato et al., 2013). In addition, PHT1;7 showed the highest transcript abundance in anther among the PHT1 family members (Figure 1D), suggesting its crucial role in this organ. We also examined the expression of PHT1;7 at different seed developmental stages (just before anthesis [0 days], 3, 7, 14, 21, 28, 35, and 42 d after anthesis), and found that it was highly expressed at Day 0, whereas its expression became almost undetectable from 3 d after anthesis onwards (Supplemental Figure S2). Given that anthers undergo dehiscence to release pollens, leading to anther structure collapse, the results further demonstrated that PHT1;7 is mainly expressed in anthers.
PHT1;7 localizes in the plasma membrane and mediates Pi transport in yeast and Xenopus oocytes
To investigate the subcellular localization of PHT1;7, its full-length open reading frame was fused with the enhanced GFP (eGFP) reporter. Three constructs, Pro35S:PHT1;7-eGFP, Pro35S:eGFP and Pro35S:OsRac1-mCherry, were transfected into rice protoplasts alone or in pairs. The results showed that the eGFP alone was universally distributed inside the cell except for the vacuole, whereas the green fluorescence signal derived from the PHT1;7–eGFP fusion overlapped with the red fluorescence transmitted by the OsRac1–mCherry fusion, which serves as a marker for plasma membrane (Figure 2A; Ono et al., 2001). This indicates that PHT1;7 is a plasma membrane-localized protein. Given that reported PHT1 proteins and other transporters often show localization to intracellular compartments (e.g. cytoplasm, nucleus, endoplasmic reticulum, or vesicles) in addition to plasma membrane (Bayle et al., 2011; Ueno et al., 2015), we further investigate the subcellular localization of PHT1;7 by monitoring different planes of a cell via z-stack scanning. Similar to the reported findings, the fluorescent signals emitted by PHT1;7-eGFP and OsRac1-mCherry were both detected in plasma membrane and intracellular compartments. The eGFP signal co-localized with the mCherry signal in plasma membrane, and the two fluorescent signals largely overlapped in the intracellular compartment(s) as well, although in some planes the intracellular signal was only evident for eGFP but not mCherry (Supplemental Figure S3). Nevertheless, all these results suggest that PHT1;7 localizes to plasma membrane.
Two heterologous systems were utilized to examine the potential transport activity of PHT1;7 for Pi. A yeast mutant defective in five PTs (PHO84, PHO89, PHO87, PHO90, and PHO91), EY917 (Wykoff and O’Shea, 2001; Wang et al., 2015), was transformed with PHT1;7 under the control of a constitutive promoter (ProGPD; glycerol-3-phosphate dehydrogenase). In addition, another rice PHT1 member, OsPHT1;8, was used as a positive control, since it has been demonstrated to mediate Pi uptake in yeast under a wide range of external Pi levels (Chang et al., 2019). When galactose was supplied as the carbon source, the yeast PT gene PHO84 which is driven by a galactose-inducible promoter was expressed, thus the yeast mutants transformed with the empty vector (EV), ProGPD:OsPHT1;8, or ProGPD:PHT1;7 all grew normally (Figure 2B). When glucose was used as the carbon source, the yeast mutant transformed with EV did not show any growth under all Pi regimes, whereas those transformed with ProGPD:OsPHT1;8 showed normal growth. The growth of the yeast mutant complemented with PHT1;7 was restored irrespective of the external Pi levels, although the growth rate was slightly slower than that complemented with OsPHT1;8 (Figure 2B). The transport activity of PHT1;7 for Pi was assessed also in Xenopus laevis oocytes with radioactive 32P. The oocytes injected with PHT1;7 cRNA showed significantly higher accumulation of 32P compared with that injected with water at pH 5.5; however, at pH 7.4, no obvious transport activity was observed (Figure 2C). These results indicate that PHT1;7 is a Pi/H+ symporter.
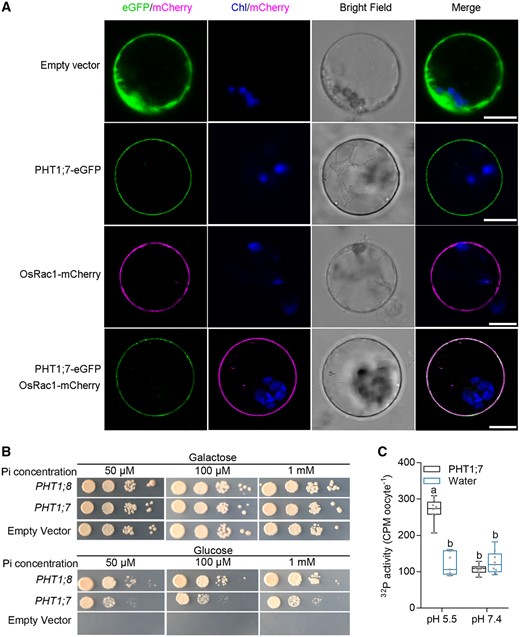
Subcellular localization of PHT1;7 and evaluation of the Pi transport activity of PHT1;7 in yeast and oocytes. A, Plasma membrane localization of PHT1;7 in the rice protoplast. PHT1;7 was colocalized with the plasma membrane-localized GTPase OsRac1. Scale bars = 10 μm. B, Complementation of a yeast mutant EY917 (Δpho84Δpho87Δpho89Δpho90Δpho91) defective in Pi uptake by PHT1;7. Yeast cells harboring either PHT1;8 construct (positive control) or PHT1;7 construct and an EV (negative control) were grown in synthetic dropout (-Trp/-Ura) liquid medium containing 2% (w/v) galactose to an optical density at the wavelength of 600 nm (OD600) of 1. Then 5-μL aliquots of 10-fold serial gradient dilutions were spotted on agar plates with galactose or glucose as carbon source containing different Pi concentration, respectively. Plates were incubated at 28°C for 4 d. C, Transport activity of Pi in X. laevis oocytes. Oocytes expressing PHT1;7 or water-injected negative control were exposed to culture solution containing 0.5 mM Pi labeled with 32P for 3 h at pH 5.5 or 7.4. Data in C are plotted with box and whiskers plots: whiskers plot represents minimum and maximum values, and box plot represents second quartile, median, and third. Different letters indicate significant differences (P < 0.05, one-way analysis of variance, Duncan’s test).
Tissue localization analysis of PHT1;7
To further analyze the expression pattern of PHT1;7, a genomic sequence upstream of its translation start site with a length of 2,315 bp was fused to the GUS reporter, generating the ProPHT1;7:GUS transgenic rice plants. We first investigated PHT1;7 expression pattern at seedling stage. The same as that found in the RT-qPCR analysis, GUS activity was observed in leaf and basal node but not in root (Supplemental Figure S4; Figure 1A). To investigate the fine cellular localization of PHT1;7, an immunostaining analysis was performed. In LB, GUS activity was not detected in epidermal cells (including bulliform cells and stomatal cells), MCs or the sclerenchyma cells (SCs) neighboring the VBs (Figure 3A); in contrast, strong PHT1;7 expression was observed in the vascular BS cells as well as in the PPCs and CCs (Figure 3, A and B). In basal node, PHT1;7 expression was restricted in the PR and PE (Figure 3, C and D). Notably, the Pi availability does not change the spatial expression pattern of PHT1;7, except that its transcription was weaker under Pi-sufficient condition, consistent with the RT-qPCR results (Supplemental Figure S4; Figures 1 and 3). Subsequently, PHT1;7 expression pattern was examined at reproductive stage as well. In node I, PHT1;7 was expressed in the PE and diffuse VB (DVB [PD]; Figure 3, E–G). In addition, strong GUS activity was also detectable in anther and pollen grain (Figure 3, H and I).
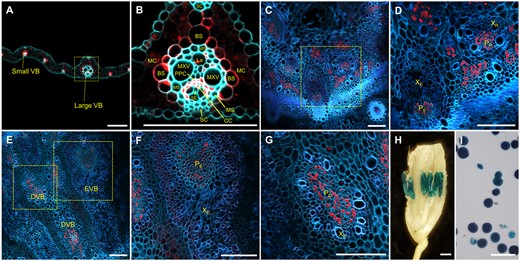
Tissue-specific localization of PHT1;7 as indicated by the GUS reporter gene of transgenic rice plants harboring ProPHT1;7:GUS fusion construct. A–G, Immunostaining of the cross sections of old leaf blade (A and B), basal nodes (C and D), and node I (E–G) using an anti-GUS antibody, respectively. The cyan or blue color in (A–G) represents autofluorescence of cell walls, the red color in (A–G) represents location of ProPHT1;7:GUS. H and I, Histochemical staining for GUS activity in anthers and pollen grains of transgenic plants, respectively. Samples in (A–D) were collected from plants grown in nutrient solution containing 1-μM Pi for 14 d since the fourth leaf appeared, and samples in (E–I) were collected from plants grown in the paddy field. MXV, metaxylem vessel; La, protoxylem lacuna; XR, xylem of RVB; XD, xylem of DVB. Scale bars = 100 μm in (A)–(G), (I) and 1 mm in (H).
PHT1;7 is involved in P redistribution from source to sink tissues
To investigate the physiological roles of PHT1;7, we first generated pht1;7 mutant lines by the clustered regularly interspaced short palindromic repeats/CRISPR-associated 9 (CRISPR-Cas9) system by using three independent spacers (Supplemental Table S1; Supplemental Figure S5) and subjected the mutants and wild-type (WT) plants to high Pi (HP: 90 µM Pi) and low Pi (LP: 1 µM Pi) treatments. We then determined the Pi concentration in root, SBR, and each individual leaf. Higher Pi concentration was observed in the old leaves but not young leaves of pht1;7 mutants under both HP (leaf 4/5) and LP (leaf 3/4) conditions compared with that of the WT plants (Figure 4). This result suggests that, upon PHT1;7 mutation, more Pi was distributed to older leaves, and/or less Pi was redistributed from older leaves to sink tissues. Given the phloem localization of PHT1;7 in the VBs of leaf and basal node (Figure 3), we favored the latter assumption and reasoned that PHT1;7 is involved in P redistribution. A similar phenomenon has been reported also in an Arabidopsis mutant defective in nitrate remobilization, nrt1.7, which accumulates more nitrate in old leaves but an equal level of nitrate in young leaves (Fan et al., 2009). Collectively, we speculated that, the impaired nutrient (i.e. Pi or nitrate) remobilization in old leaves and/or the enhanced nutrient demand in young leaves may trigger a downward systemic signal, leading to elevated nutrient uptake. To test this speculation, we examined the expression of other PHT1 genes in pht1;7 mutants. Unexpectedly, no consistent alteration in the expression of these PHT1 genes was found in pht1;7 mutants (Supplemental Figure S6). Thus, this enhancement in P accumulation might be achieved through a yet to be identified mechanism but not the transcriptional upregulation of PHT1 genes.
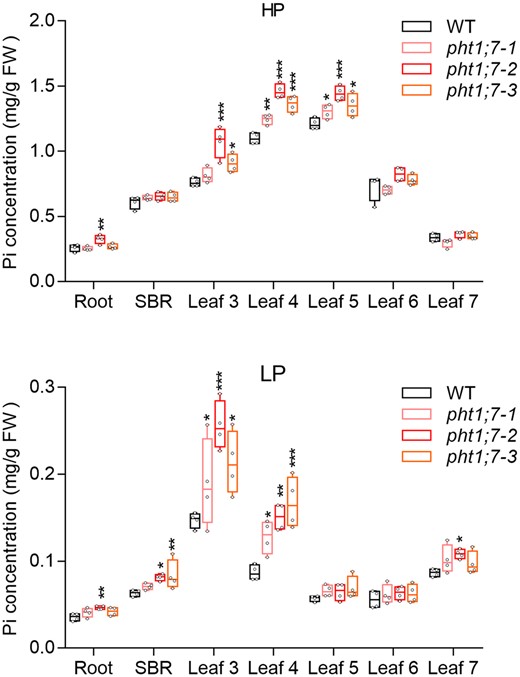
Pi concentrations of tissues of WT and pht1;7 mutants in seedling stage after HP (90 µM Pi) or LP (1 µM Pi) treatments. Four-leaf-old seedlings were grown in 1/2 Kimura nutrient solution supplied with HP or LP until the seventh leaf appeared. Each treatment contains four biological replicates and each replicate contains tissues of two seedlings. All data are plotted with box and whiskers plots: whiskers plot represents minimum and maximum values, and box plot represents second quartile, median, and third quartile. Asterisks indicate significant differences (*P < 0.05; **P ˂ 0.01; ***P < 0.001) compared with the WT, one-way analysis of variance, Duncan’s test.
To validate the potential role of PHT1;7 in P redistribution, pht1;7 and WT seedlings were first grown in Pi-sufficient solution until the emergence of the sixth leaf from the LSs of older leaves, and then subjected to nutrient solution lacking Pi. The roots, SBRs, and individual leaves of each genotype were collected prior to the Pi-starvation treatment and at the developmental stages when the seventh and eighth leaves emerge. Upon the Pi starvation treatment, more P was distributed to the SBR and old leaves (leaves 4 and 5) of pht1;7 mutant lines compared with that in WT plants at both time points (Figure 5). In addition, a 1-week treatment led to a marginal decrease in P distribution to the youngest leaves (leaf 7) of pht1;7 mutants, whereas after another 1-week treatment, a significant decrease in P distribution to the youngest leaves (leaf 8) of pht1;7 was detected (Figure 5). Altogether, these results demonstrate that PHT1;7 is involved in P redistribution from source (old leaf) to sink (the youngest leaf) tissues at seedling stage in response to Pi starvation stress.
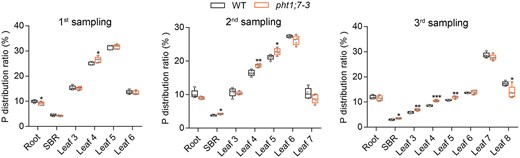
PHT1;7 is involved in P redistribution from source to sink tissues in seedling stage. The WT and the pht1;7 mutant plants were treated with nutrient solution of 90-μM Pi till leaf 6 appeared, and tissues were collected for the first time (first sampling). Whereafter, the WT and the pht1;7 mutant plants with uniform growth condition were transferred to nutrient solution of no Pi. Tissues of the WT and the pht1;7 mutant plants were collected for the second time (second sampling) when the leaf 7 of the WT appeared. After continuing for several days of no Pi treatment, tissues of the WT and the pht1;7 mutant plants were collected for the third time (third sampling) when the leaf 8 of the WT appeared. Leaf 3 indicates the oldest leaf, and leaf 8 indicates the youngest leaf. P distribution ratio in different tissues of the WT and pht1;7-3 mutant was calculated by P content in each tissue divided by P content in the whole plant. Each treatment contains five biological replicates and each replicate contains tissues of two seedlings. All data are plotted with box and whiskers plots: whiskers plot represents minimum and maximum values, and box plot represents second quartile, median and third quartile. Asterisks indicate significant differences (*P ˂ 0.05; **P ˂ 0.01; ***P < 0.001) compared with the WT, one-way analysis of variance, Duncan’s test.
PHT1;7 is involved in P redistribution from vegetative organs to reproductive organs
At the ripening stage, the plant height and panicle length of pht1;7 mutants were reduced to ∼82.9% and ∼83.2% of that of WT plants, respectively (Figure 6, A–D). Since PHT1;7 is expressed in the PD and PE of node I (Figure 3, E–G), the stunted growth may result from impaired P redistribution. To test this hypothesis, we determined the P concentration in different organs of pht1;7 mutants and WT plants at mature-grain stage. A higher P concentration was observed in almost all the organs (including brown rice, the sink) of pht1;7 mutants compared with that of WT plants (Supplemental Figure S7A). This is probably attributed to the dramatic decrease (>80%) in seed-setting rate and grain yield (Figure 6, E and F), which attenuated the sink strength and led to enhanced distribution of P taken up to vegetative organs (i.e. an indirect effect of less P flow to grains). Nevertheless, the P distribution to panicles was significantly decreased in pht1;7 mutants (Supplemental Figure S7B). To avoid the large differences in sink strength between pht1;7 mutant lines and WT plants, we analyzed the P accumulation in different organs at the onset of flowering stage. The P concentration in the leaf II and flag leaf of pht1;7 mutants was significantly higher than that of WT plants (Supplemental Figure S8A). In addition, upon PHT1;7 mutation, the P distribution was increased and decreased, respectively, in leaf II and panicle (Supplemental Figure S8B). These results together with the phloem localization of PHT1;7 in nodes (Figure 3, E–G) suggest that PHT1;7 is involved in P redistribution from source (leaf) to sink organs (panicle) at reproductive stage as well.
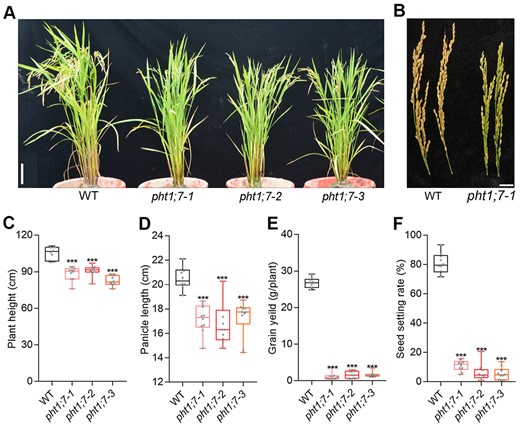
Plant performance and agronomy index of WT and pht1;7 mutants at ripening stage. A and B, Phenotypes of whole plants and panicles. Scale bars = 10 cm in (A) and 2 cm in (B). C–F, Plant height, panicle length, seed setting rates, and grain yield per plant of WT and pht1;7 mutants, n = 10. All data in (C–F) are plotted with box and whiskers plots: whiskers plot represents minimum and maximum values, and box plot represents second quartile, median and third quartile. Asterisks indicate significant differences (***P < 0.001) compared with the WT, one-way analysis of variance, Duncan’s test.
Mutation of PHT1;7 leads to an impairment in anther P accumulation, pollen grain germination, and fertility
Given that PHT1;7 was highly expressed in anther (Figure 1, C and D) and that pht1;7 was impaired in fertility (Figure 6E), we speculated that PHT1;7 might maintain the fertility through regulating the P accumulation and development of anther. The results showed that the length and P concentration of anther were both significantly decreased due to PHT1;7 mutation (Figure 7). In addition, the pollen viability of pht1;7 mutants was disturbed, as evidenced by a sharp decrease in starch granules (SGs) in pollen grains (Figure 8A). Consistently, the proportion of fully stained pollen grains by KI–I2 was markedly reduced in the pht1;7 mutant lines as compared with that in WT plants (Figure 8, B and C). As a consequence, the in vitro and in vivo germination of pollen grains were all impaired in pht1;7 mutants (Figure 9).
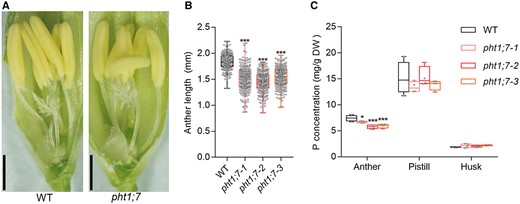
PHT1;7 affects length and P concentration of anthers. A, Anther phenotypes of WT and a typical pht1;7 mutant. Scale bars = 1 cm. B, Anther length of WT and pht1;7 mutants, n = 200. C, Total P concentrations of anthers, pistil, and husk of WT and pht1;7 mutants. Each tissue in (C) contains four replicates, and each replicate contains organs from ∼40 spikelets from tillers of five individual plants. Spikelet or anther samples in (A–C) were collected 1 d before anthesis from plants grown in a paddy field. All data in (B) and (C) are plotted with box and whiskers plots: whiskers plot represents minimum and maximum values, and box plot represents second quartile, median and third quartile. Asterisks indicate significant differences (*P < 0.05; ***P < 0.001) compared with the WT in each group, one-way analysis of variance, Duncan’s test.
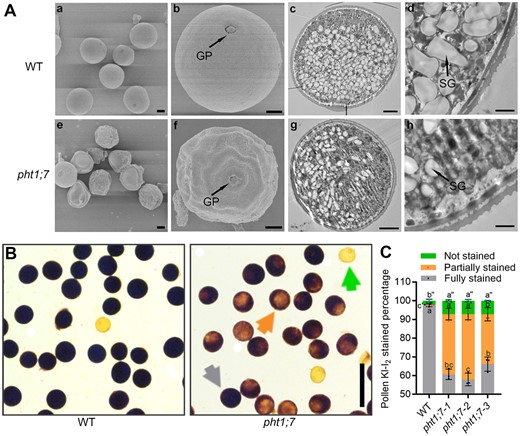
Morphological characteristics and viability assay of pollen grains in the WT and pht1;7 mutants. A, Scanning and transmission electron micrographs of mature pollen grains from WT and pht1;7 mutants. A(a)–(d) Micrographs of the WT pollen grains. A(e)–(h) Micrographs of pht1;7 mutant pollen grains. Most of the pollen grains shown in (e) have an abnormal structure while pollen grains shown in A(a) have a rounded structure. Arrows in A(b) and A(f) point at germination pores of pollen grains. The WT pollen grains in A(c) and A(d) contain more SGs than the pht1;7 pollen grain in A(g) and A(h). Scale bars = 10 μm in A(a) and A(e); 5 μm in A(b), A(c), A(f), and A(g); and 1 μm in A(d) and A(h). B and C, Pollen viability and percentage of each pollen category stained by KI–I2 solution in WT and pht1;7 mutant lines. Pollen grains were collected from flowering rice. The green, orange, and gray arrows point at not stained, partially stained, and fully stained pollen grains, respectively. Scale bars = 100 μm in (B). Data in (C) are means ± sd of three biological replicates. Different letters indicate significant differences (P < 0.05, one-way analysis of variance, Duncan’s test).
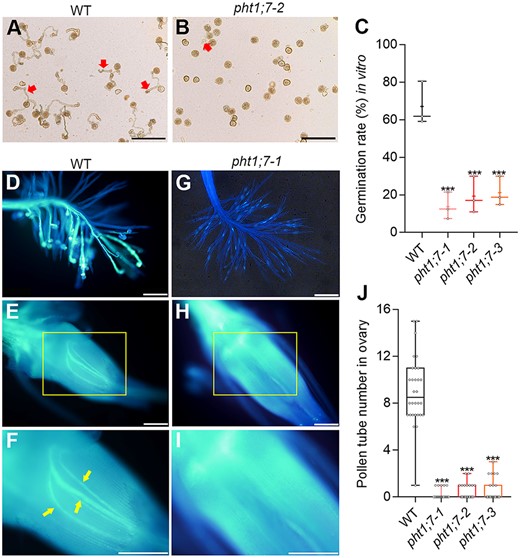
Pollen germination in vitro and in vivo. A–C, Pollen germination of WT and pht1;7 mutants and germination rate in vitro. Mature pollen grains were collected at the onset of flowering and observed by a microscope after germinated 2 h in the pollen germination medium, n = 3. Each independent plant was used as one biological replicate, and pollen grains from more than five spikelets of each independent plant were checked. D–I, Pollen germination of WT and a typical pht1;7 mutant line in vivo. (D) and (G) are stigmas of WT and the pht1;7 mutant, respectively; (E) and (H) are ovaries of WT and pht1;7 mutant, respectively; (F) and (I) are the enlarged exhibition of the area in yellow rectangles of (E) and (H), respectively. Yellow arrows in (F) point at pollen tubes in ovary. J, Pollen tube number in ovaries of WT and pht1;7 mutants, n = 30. Spikelets for in vivo analysis were collected and mixed from five independent plant 2 h after flowering and then stained with aniline blue. All data in (C) and (J) are plotted with box and whiskers plots: whiskers plot represents minimum and maximum values, and box plot represents second quartile, median and third quartile. Asterisks indicate significant differences (***P < 0.001) compared with the WT, one-way analysis of variance, Duncan’s test. Scale bars = 200 μm.
Discussion
OsPHT1;7 is a major PT responsible for Pi transport into anther and pollen viability maintenance
The germination of pollen grains involves drastic cell proliferation/expansion and thus consumes plenty of energy and nutrients including Pi. In rice, Pi concentration in anthers undergoes a 10-fold increase within 10 d prior to flowering (Yamada, 1972), during which PHT1;7 transcript level is concurrently elevated in anther (Lin et al., 2017). Given that PHT1;7 is a plasma membrane-localized PT (Figure 2), it is very likely that PHT1;7 is involved in the storage of Pi in anthers/pollens. In support of this presumption, mutation of PHT1;7 led to a significant decrease in anther P accumulation (Figure 7C). Interestingly, PHT1;7 showed an overwhelmingly higher transcript level than other PHT1 counterparts (Figure 1D), yet the decrease in anther P accumulation in pht1;7 mutants was not that severe as expected (∼20%; Figure 7C). This indicates a gene functional redundancy and/or potential genetic complementation of PHT1;7 by other PT genes. Indeed, several PHT1 genes showed relatively low but non-negligible expression in anthers (Figure 1D). In addition, two PHT1 members, namely OsPHT1;1 and OsPHT1;6, were upregulated in the anthers of pht1;7 mutants compared with that of the WT plants (Supplemental Figure S9). Notably, the expression level of OsPHT1;1 in pht1;7 anthers was two to 3 times as high as that in WT anthers; in contrast, the transcript abundance of OsPHT1;6 in anthers was increased >30-folds upon PHT1;7 mutation (Supplemental Figure S9). This suggests a more important complementary role of OsPHT1;6 in mediating Pi influx into anthers than OsPHT1;1 when PHT1;7 function is lost. In future work, the potential role of OsPHT1;6 in anther P accumulation and anther development needs to be investigated.
The decrease in the anther P accumulation in pht1;7 mutants was accompanied by a dramatic impairment in pollen grain viability (Figures 7–9). A conventional parameter reflecting pollen viability is the content of starch, the biosynthesis of which is catalyzed by several enzymes, including plastidic phosphoglucomutase (pPGM; transform glucose-6-Pi into glucose-1-Pi) and ADP-glucose pyrophosphorylase (AGP; transforming glucose-1-Pi into ADP-glucose, the precursor of starch). OspPGM and OsAGPL4 encode the major pPGM and AGP, respectively, functioning in rice pollens (Supplemental Figure S10A; Lee et al., 2016; Meng et al., 2020). In the anthers of pht1;7 mutants, OsAGPL4 expression was unaltered, whereas OspPGM was significantly upregulated compared with that of the WT plants (Supplemental Figure S10B). Given that the starch content was reduced in pht1;7 anthers, this increase in OspPGM expression upon PHT1;7 mutation is probably an indirect effect. It would be of interest to know whether Pi serves as a signaling molecule or a nutritional basis or both to sustain the development of anthers/pollens.
Recently, it has been shown that a 40%–50% increase in anther Pi level in osnla1 (Nitrogen Limitation Adaptation 1) mutants also resulted in lowered pollen viability (Yang et al. 2020). OsNLA1 encodes a ubiquitin E3 ligase which maintains rice P homeostasis via negative regulation of the abundance of PHT1 proteins (Yue et al., 2017; Yang et al., 2020). Interestingly, OsNLA1 is highly expressed in anthers as well, and PHT1;7 has been demonstrated to be a direct target of OsNLA1 (Yang et al. 2020), suggesting that the increased Pi level in the anthers of osnla1 is largely, if not entirely, contributed by PHT1;7. Our results and the reported findings indicate that anther P level needs to be maintained in a narrow range to ensure normal development and functioning of anthers/pollens, and that PHT1;7 is indispensable for maintaining the P homeostasis in anther and the fertility of rice plants. Nevertheless, the possibility that PHT1;7 facilitates the transport of other unknown substrate(s) essential for pollen grain viability and anther development cannot be excluded.
P redistribution in source leaves involves the apoplastic pathway and requires the activity of PHT1;7 at two steps
The redistribution of P from source (e.g. mature leaf) to sink (e.g. young leaf) organs involves several sequential steps regarding intercellular Pi transport, namely (1) short-distance transport of Pi from outer cell layers (i.e. MCs) to BS cells; (2) loading of Pi into the sieve element (SE)–CC complex; (3) downward long-distance transport of Pi from mature leaves to basal nodes through sieve tubes; and (4) upward distribution of Pi to sink leaves. PHT1;7 is involved in P remobilization in response to Pi starvation stress (Figure 5), and it is specifically expressed in the BS cell layer and the PPC/CC of leaf VBs as well as in the PR and PE of basal nodes (Figure 3, A–D), indicating that PHT1;7 promotes P remobilization at multiple steps. BS is a ring of parenchymatous cells enclosing the VB, and is thus the interface between MCs and vasculature. It has been recognized as a “flux-regulating” tissue for retrieving, storing, and redirecting solutes via preventing apoplastic water/solute flow (Shatil-Cohen and Moshelion, 2012; Wigoda et al., 2014). Water and minerals from the transpiration stream need to cross BS to reach the MCs; likewise, water, ions, and other solutes (e.g. assimilates) flow through BS before phloem loading in source leaves and after phloem unloading in sink organs. In the leaves of monocots, P is preferentially allocated to photosynthetic cells (i.e. MCs; Conn and Gilliham, 2010), indicating that MCs are an important P source for P redistribution and the P in MCs needs to be exported. The presence of plasmodesmata between the MCs and BS cells indicates that the symplastic pathway is implicated in the transport between these two cell types (Sage and Sage, 2009). However, the localization of PHT1;7 in the BS cell layer (Figure 3B) demonstrates that the apoplastic pathway is also required for the initial step of P remobilization (Step 1 as discussed above). Thus, the transporter responsible for Pi efflux from MCs into apoplast needs to be identified. Additionally, the potential contribution of the symplastic pathway (mediated by plasmodesmata between MCs and BS cells) to P remobilization at this step awaits to be investigated. In rice, mestome sheath (MS) is another single cell layer with thickened cell wall which is adjacent to the interior side of BS (Figure 3B), and there is no airspace at the BS–MS cell interface, and a symplastic transport at this interface has been inferred (Chonan et al., 1981; Leegood, 2008). PHT1;7 was not expressed in MS cells (Figure 3B). Thus, it is likely that the remobilized Pi undergoes symplastic pathway when flowing across the BS–MS interface. Furthermore, in many plants (e.g. Arabidopsis and herbaceous plants like rice), the phloem loading of sugar and amino acids into the SE–CC complex depend strongly on the apoplastic pathway (Regmi et al., 2016; Zhang and Turgeon, 2018; Wang et al., 2021d). This scenario is supported by the presence of H+-pyrophosphatase, sucrose synthase, influx (AtSUC2) and efflux (AtSWEET11/12) sugar transporters, and amino acid transporter (AtAAP8) in the SE–CC complex (Stadler and Sauer, 1996; Chen et al., 2012; Regmi et al., 2016; Santiago and Tegeder, 2016). PHT1;7 expression was detected in the PPCs and CCs of the leaf vasculature as well (Figure 3B), indicating that another apoplastic transport event occurs at this step. Taken together, our results provide evidence that the apoplastic pathway is required for the phloem loading of Pi into SE, and that PHT1;7 functions at two steps in source leaves (BS and PPC/CC) for P remobilization. It remains to be established that whether the apoplastic Pi loading into the PPCs/CCs (and then into the SE) originates from the MCs or the cells within the vasculature or both.
PHT1;7 is not the only checkpoint for P redistribution in the phloem of the vascular bundles of nodes
The node is a highly specialized structure of graminaceous plants, functioning as a hub for the distribution of nutrients (Yamaji and Ma, 2014, 2017). At seedling stage, the internodes of rice plants are not elongated and all the nodes are compacted in the basal region of shoot, designated as basal nodes. In our previous work, we reported that a paralog of PHT1;7, OsPHT1;3, is specifically expressed in the PD and PR in response to Pi starvation. This expression pattern of OsPHT1;3 in basal nodes is almost the same as that of PHT1;7 (Figure 3, C and D) with the exception that OsPHT1;3 expression in the PE is much weaker (Chang et al., 2019). Nevertheless, OsPHT1;3 and PHT1;7 are both involved in P redistribution from source to sink leaves in Pi-starved rice seedlings. OsPHT1;3 and OsPHT1;7 exert a similar role in P redistribution but not in anther development (Figures 4 and 5; Chang et al., 2019). This supports one of our previous presumptions that the physiological roles of transporters are largely determined by their spatio-temporal expression patterns rather than merely the similarities in their sequences and biochemical activities (Gu et al., 2016; further discussed in the section under the last subtitle), although the possibility that PHT1;7 is regulated by a distinct mechanism at posttranscriptional and/or posttranslational levels cannot be excluded.
At the reproductive stage of cereal plants, 60%–85% total plant P is finally allocated to the grains. In rice, the P in grains is derived from two pathways, namely the P newly taken up from soil after flowering stage and remobilization of P from old leaves. Yamaji et al. (2017) provide the first evidence that a rice plasma membrane PT, SULTR-like phosphorus distribution transporter (SPDT), which localizes to the xylem of and the parenchyma cell bridge between the DVB and EVB of node I, mediates the transient incorporation of Pi from xylem to the nodal tissues and promotes the xylem-to-phloem transfer of Pi in nodes. In addition, OsPHO1;2 is mainly expressed in the xylem of EVB (XE) of node I, and mutation of this gene greatly inhibits the P accumulation/distribution and starch biosynthesis in rice grains (Che et al., 2020; Ma et al., 2021). Despite these striking findings, the PT(s) responsible for the phloem loading in nodes is/are widely unknown. A homolog of OsPHO1;2 sharing an amino acid sequence identity of 38.43%, OsPHO1;1, is mainly expressed in the PD; however, its contribution to P accumulation in grains is limited, although the P distribution to grains is reduced upon its mutation (Che et al., 2020). This suggests that other phloem-localized PTs are involved in the P redistribution in nodes. OsPHT1;3 (Supplemental Figure S11, A–C) and PHT1;7 (Figure 3, E–G) are both expressed in the PD and PE of node I, indicating that they might serve as such PTs for phloem loading and mediate the remobilization of P to grains, functioning coordinately with SPDT and PHO1s in P accumulation in rice grains. However, mutation of OsPHT1;3 does not affect the P accumulation in brown rice (Supplemental Figure S11D), indicating a functional redundancy between OsPHT1;3 and other PT(s); the evaluation of PHT1;7 contribution to P accumulation in brown rice is impeded due to the greatly reduced seed-setting rate of pht1;7 mutants (Figure 6, B and F; Supplemental Figure S7). To fully dissect the rice grain P accumulation pathway in future work, it would be important to identify and functionally characterize the PT(s) playing a redundant role with OsPHT1;3 and PHT1;7 in the remobilization of P to grains. Particularly, given that the expression of OsPHT1;3 (Supplemental Figure S11, A–C) and PHT1;7 (Figure 3, E–G) in the PE is weaker than that in the PD of node I, the potential PT(s) showing a stronger expression in the PE of node I could be an interesting target.
The functional conservation of PHT1 genes is largely determined by their spatio-temporal expression patterns rather than amino acid sequence identities
The amino acid sequence identity between different members of a given protein-coding gene family within and among plant species is a major consideration when inferring their functional similarities. A high amino acid sequence identity between two homologs may indicate similar structure and biochemical activity. However, in many cases, it poorly reflects the conservation of physiological roles in plants, one major cause of which is the diverged spatio-temporal expression patterns of different homologs (Gu et al., 2016). OsPHT1;1 is most closely related to OsPHT1;2 and OsPHT1;3 as shown by a phylogenetic analysis based on their amino acid sequences (Supplemental Figure S12). However, OsPHT1;1 is constitutively expressed (not responsive to Pi starvation) and mainly involved in Pi uptake under Pi-replete conditions (Sun et al., 2012; Zhang et al., 2021), whereas OsPHT1;2 and OsPHT1;3 are both strongly induced by Pi starvation and responsible for Pi accumulation when Pi is lacking (Ai et al., 2009; Chang et al., 2019; Zhang et al., 2021). In addition, OsPHT1;1 is not so phylogenetically related to PHT1;7 (Supplemental Figure S12), yet OsPHT1;1 showed a complementary upregulation in both node I and anther of pht1;7 mutants (Supplemental Figures S9 and S13). Moreover, PHT1;7 shares the highest sequence identity with OsPHT1;6 (75.79%), and OsPHT1;6 might play a complementary role to PHT1;7 in Pi influx into anther (Supplemental Figure S9). Nonetheless, at vegetative stage, OsPHT1;6 is expressed throughout rice plants and plays a broad role in Pi uptake and in planta transport (Ai et al., 2009); in contrast, PHT1;7 showed preferential expression in the vascular tissues of leaves and basal nodes. Furthermore, the amino acid sequence identity between PHT1;7 and OsPHT1;3 is relatively low (70.57%), yet OsPHT1;3 shows a highly similar expression pattern with PHT1;7 in nodes, and these two genes both mediate P redistribution from source leaves to young leaves. Nevertheless, OsPHT1;3 shows the highest expression level in roots and contributes to Pi uptake as well, whereas PHT1;7 was barely expressed in roots (Figure 1A; Supplemental Figure S4, D and H; Chang et al., 2019). All these findings suggest that the spatio-temporal expression pattern of PHT1s is a major determinant of their physiological roles and functional redundancies. Given the importance of PTs for molecular breeding of crops with high P efficiency (Gu et al., 2016), in future work, the fine localization of PTs at the cellular resolution and at different developmental stages is of the utmost importance for the full understanding of their physiological roles, the prerequisite of practical application.
Conclusion
Our results show that PHT1;7 acts as a three-stage valve for P redistribution in (1) the BS and (2) PPC/CC of source leaves and in (3) the phloem of VBs of nodes (Figure 10), in response to Pi starvation stress, indicating that apoplastic transport is involved in P redistribution. Furthermore, we also demonstrate that PHT1;7 is required for anther development, pollen germination and yield formation.
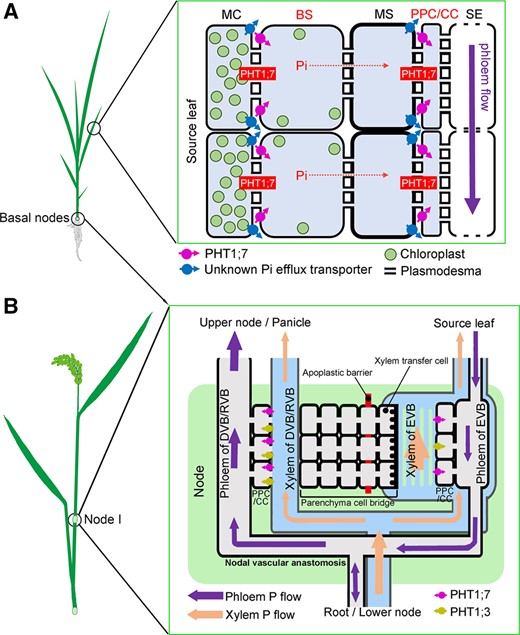
A working model for the roles of PHT1;7 in P redistribution in rice (O. sativa). A, Role of PHT1;7 in the short distance transfer of P in source leaf. P from mesophyll cells or MS cells is exported into apoplastic space by (an) unknown Pi efflux transporter(s). PHT1;7 located in VB sheath cells and CCs imports P from apoplast. P in CCs is further transferred to SEs through plasmodesmata. B, Role of PHT1;7 in nodes. P is loaded into the phloem in both EVBs and DVB/RVB by PHT1;7 and OsPHT1;3.
Materials and methods
Plant materials and growth conditions
The rice (O. sativa) cultivar Nipponbare was used for experimental analysis and transgenic modification. For hydroponic experiments, seedlings were grown in a phytotron with a day/night photoperiod of 14/10 h and a day/night temperature of 30°C/24°C, and the relative humidity was controlled at 60%. Rice seeds were disinfected with 30% sodium hypochlorite (v/v, relative to the original solution) for 30 min, washed several times, and then incubated in sterile water in a 30°C dark environment to promote germination. After 48 h, seeds were placed on a nylon net floated on 0.5-mM CaCl2 solution. When the first leaf was fully expanded, seedlings were supplied with normal 1/2 Kimura B nutrient solution (Yamaji et al., 2013) till the fourth leaf appeared, and then treated with 1/2 Kimura nutrient solution of different Pi concentrations. For field experiments, all plants were grown in paddy fields with regular fertilization (400 kg urea, 35-kg P2O5, 130-kg K2O/hectare) during the normal growing seasons in Nanjing, China.
RNA extraction, cDNA synthesis, and RT-qPCR
Samples were collected from plants in hydroponic condition or paddy fields, quick-frozen by liquid nitrogen and stored in a −80°C refrigerator till RNA extraction. Total RNA of plant samples except seeds was extracted using TRIzol reagent (Invitrogen, Thermo Fisher Scientific, Waltham, MA, USA) according to the manufacturer’s instructions. Total RNA of seeds was extracted using RNAprep Pure Plant Plus Kit (Polysaccharides & Polyphenolics-rich, TIANGEN, Beijing, China) according to the manufacturer’s instructions. First-strand cDNAs were synthesized from total RNA using the ReverTra Ace qPCR-RT Master Mix with gDNA Remover (TOYOBO, Osaka, Japan) according to the manufacturer’s instructions. RT-qPCR was performed using the AceQ qPCR SYBR Green Master Mix (Vazyme, Nanjing, China) on the Quant Studio 6 Flex Real-Time PCR System (Applied Biosystems, Waltham, MA, USA) according to the manufacturer’s instructions. Relative expression level of each sample was determined by normalizing it to the amount of OsActin1 (LOC_Os03g50885) detected in the same sample and presented as 2−ΔCT. All primers used for RT-qPCR are listed in Supplemental Table S2.
Vector construction for mutation or tissue localization of PHT1;7 in plants and generation of transgenic plants
For gene mutation via the CRISPR–Cas9 system, three different gene-specific spacers (Supplemental Table S1) residing in the open reading frame (ORF) of PHT1;7 were selected from the rice gene-specific spacers library provided by Miao et al. (2013). These spacers were subcloned into the final expression vector pH-Ubi-cas9-7 as described in Chang et al. (2019). For tissue localization analysis, the expression cassette of PHT1;7pro::GUSPlus::NOS terminator was subcloned into the vector pCAMBIA1300. A 2,313-bp DNA fragment upstream of the translation start codon of PHT1;7 was amplified (primers listed in Supplemental Table S3) from the rice Nipponbare genomic DNA and fused upstream of the GUSPlus reporter gene via Sal I/Hind III. The above constructs were transformed into Agrobacterium strains EHA105 by electroporation and then transformed into callus derived from mature embryo of Nipponbare developed from the seeds of WT rice plants (cultivar Nipponbare) via Agrobacterium tumefaciens-mediated transformation as described in Jia et al. (2011).
GUS staining and immunostaining analysis
The PHT1;7pro:GUS transgenic lines were used for histochemical analysis. The GUS staining analysis was performed as described in Ai et al. (2009). Immunostaining analysis with an antibody against GUS was performed as described in Yamaji and Ma (2007), and sections were observed and photographed by a confocal laser scanning microscope (Leica, Wetzlar, Germany; TCS SP8X). The cell wall autofluorescence was excited by ultraviolet light with an intensity of 0.7%–3%; the collection bandwidth and gain value were 410–470 nm and 30%–60%, respectively. The collection bandwidth for Alexa Fluor 555 (the secondary antibody) was 560–580 nm, and the gain value was 50%–60%.
Subcellular localization analysis
For the constructs of subcellular localization, the CDS of PHT1;7 was subcloned into the pSAT6A-EGFP-N1 vector to generate PHT1;7-GFP. The PHT1;7-GFP as well as alone GFP constructs were transformed into the rice protoplasts by the polyethylene-glycol-mediated method. The isolation and transformation of rice protoplast was performed as described in Jia et al. (2011). OsRac1-mCherry was used as a plasma membrane control. After incubation at 28°C dark for 12–15 h, fluorescence signals in rice protoplasts were observed and photographed by a confocal laser scanning microscope (Leica; TCS SP8X). Excitation/emission wavelengths were 488 nm/498–540 nm for eGFP, 552 nm/600–640 nm for mCherry, and 488 nm/710–760 nm for chloroplast (Chl).
Functional complementation assay of PHT1;7 in yeast or X. laevis oocytes
Full-length CDSs of PHT1;7 and PHT1;8 were subcloned into the yeast expression vector pAG426GPD-ccdB, and then PHT1;7, PHT1;8 constructs as well as EV were transformed into the yeast mutant strain EY917 defective in Pi uptake (Wykoff and O’Shea, 2001) to check Pi transport activity as described in Chang et al. (2019).
The full-length CDS of PHT1;7 was subcloned into oocyte expression vector pT7Ts via Bgl II/Spe I. The capped RNA of PHT1;7 was in vitro transcriptionally synthesized and then injected into oocytes isolated from X. laevis as described in Chang et al. (2019). The injected oocytes were incubated at 18°C in Modified Barth's Saline (MBS) solution without NaH2PO4 for 48 h before Pi transport assay. The MBS solution contained 88-mM NaCl, 1-mM KCl, 2.4-mM NaHCO3, 0.3-mM Ca (NO3)2, 0.41-mM CaCl2,0.82-mM MgSO4, 15-mM HEPES, and 10-µg/mL sodium penicillin and streptomycin sulfate, adjusted to pH 7.4 using 1-M NaOH. For Pi transport assay, the incubated oocytes were transferred into MBS solution (pH 5.5 or 7.4) supplied with 0.5 mM Pi labeled with 32P orthophosphate (0.5 μCi/μM Pi) for 3 h. After then, the oocytes were washed by cold MBS solution 5 times and every three oocytes were collected in a 5-mL centrifuge tube as one replicate. Oocytes in tubes were digested by a 200 µL mixture (72% HClO4: 30% H2O2 = 5:2, by volume) in a 65°C oven for 3 h. Whereafter, 3 mL scintillation cocktail (ULTIMA GOLD LLT; PerkinElmer, Waltham, MA, USA) was added to each tube. 32P radioactivity of each replicate was determined using the liquid scintillation counter (Beckman Coulter, Brea, CA, USA; LS6500).
Measurement of inorganic Pi and total P concentration in plants
For the measurement of inorganic Pi concentration in the plants, fresh samples were weighted and frozen with liquid nitrogen. Frozen samples were handled with the method described by Chang et al. (2019) and finally the absorbance was measured at 820-nm wavelength using a microplate reader (PE, Ensight). Pi concentration of samples was calculated according to measured absorbance and fresh weight.
For the measurement of total P concentration in the plants, samples were dried at 80°C for 3 d to determine the dry weight (DW). For each sample, about 0.05 g dry ground powder was weighted and digested with 3-mL HNO3 at 180°C. Digested liquid was diluted with ddH2O, filtered with filter membranes, and measured using an ICP-MS machine (Thermo Fisher Scientific, Waltham, MA, USA; iCAP Q). Total P concentration of samples was calculated according to measured data and DW.
Pollen viability assay
Anthers were collected from five spikelets per tiller one day before anthesis and stained in 2% (w/v) I2–KI solution. Five tillers at anthesis stage of individual plants of pht1;7 mutants and the WT were examined. Pollen grains were placed on a glass slide by using forceps to broken anthers. Stained pollen grains were observed and counted by a microscope under bright field. Pollen viability was categorized into three groups: fertile with fully stained (black), partially stained (brown), and not stained (transparent). Three glass slides of each line and five fields of view of each glass slide were observed. In each field of view, no less than 100 pollen grains should be existed.
In vitro and in vivo pollen germination assay
Plant materials were grown in a paddy field. For the in vitro pollen germination assay, mature pollen grains collected from pht1;7 mutants and the WT were germinated in a pollen germination medium, which contained 1-mM CaCl2, 1-mM KCl, 0.8-mM MgSO4, 1.6-mM H3BO3, 30-mM CaSO4, 0.03% casein, 0.3% MES, 10% sucrose, and 12.5% polyethylene glycol, on glass slides. The glass slides were incubated at 30°C with >90% relative humidity in a dark box for 2 h, observed and photographed by a microscope under bright field. Three biological replicates were analyzed. Each independent plant was used as one biological replicate, and 5–10 spikelets from each plant were examined. For the in vivo pollen germination assay, the spikelets of pht1;7 mutants and the WT were collected 2 h after anthesis and fixed in FAA solution (70% ethanol: formalin: acetic acid = 18:1:1, by volume) for 24 h. The samples were washed with an ethanol series (70%, 50%, and 30%) and distilled water, and then incubated in 10 M NaOH for 5–8 min at 56°C. After washing with distilled water 3 times, the spikelets were stained with 0.1% (w/v) aniline blue overnight. Finally, the samples were observed using a fluorescence microscope.
Phylogenetic analysis
The unrooted phylogenetic tree of the rice and Arabidopsis PHT1 homologs was constructed using their amino acid sequences by the Neighbor-Joining algorithm within the MEGA X software. The reference numbers of the protein sequences used for constructing the tree are the following: OsPHT1;1, XP_015631295.1; OsPHT1;2, XP_015630484.1; OsPHT1;3, XP_015614123.1; OsPHT1;4, XP_015636813.1; OsPHT1;5, XP_015635984.1; OsPHT1;6, XP_015649112.1; OsPHT1;7, XP_015630742.1; OsPHT1;8, XP_015614122.1; OsPHT1;9, XP_015642649.1; OsPHT1;10, XP_015642566.1; OsPHT1;11, XP_015633355.1; OsPHT1;12, XP_015631296.1; OsPHT1;13, XP_015634468.1; AtPHT1;1, NP_199149.1; AtPHT1;2, NP_001190462.1; AtPHT1;3, NP_199150.1; AtPHT1;4, NP_181428.1; AtPHT1;5, NP_180842.1; AtPHT1;6, NP_199148.1; AtPHT1;7, NP_001319749.1; AtPHT1;8, NP_173510.1 and AtPHT1;9, NP_177769.1.
Statistical analysis
All the data collected were analyzed for significant differences using the IBM SPSS Statistics version 23 software. Statistical analyses were performed by Duncan’s test of one-way analysis of variance. Significance of differences was defined as asterisks (*P < 0.05; **P ˂ 0.01; ***P < 0.001) or by different letters (P < 0.05).
Accession numbers
Sequence data from this article can be found in the Rice Genome Initiative under the accession numbers in Supplemental Table S2.
Supplemental data
The following materials are available in the online version of this article.
Supplemental Figure S1. Spatio-temporal expression pattern of PHT1;7 from the RiceXPro database.
Supplemental Figure S2. Expression pattern of PHT1;7 in spikelets or seeds at different developmental stages from anthesis onward.
Supplemental Figure S3. Subcellular localization of PHT1;7 in rice protoplast.
Supplemental Figure S4. Histochemical staining for GUS activity in transgenic rice plants harboring ProPHT1;7:GUS fusion construct.
Supplemental Figure S5. Identification of ospht1;7 mutant lines.
Supplemental Figure S6. Expression pattern of rice PHT1 genes in the root of the WT and pht1;7 mutants at the seedling stage.
Supplemental Figure S7. P concentration (A) and P distribution ratio (B) of different tissues of WT and pht1;7 mutants at the mature-grain stage.
Supplemental Figure S8. P concentration (A) and P distribution ratio (B) of different tissues of WT and pht1;7 mutants at anthesis stage.
Supplemental Figure S9. Expression pattern of OsPHT1;1 and OsPHT1;6 in anthers of the WT and pht1;7 mutants.
Supplemental Figure S10. Expression pattern of starch biosynthesis-related genes in the anthers of the WT and pht1;7 mutants.
Supplemental Figure S11. Cellular localization of OsPHT1;3 and its effect on P accumulation in rice grains.
Supplemental Figure S12. Phylogenetic analysis of rice and Arabidopsis PHT1 family genes.
Supplemental Figure S13. Expression pattern of OsPHT1;1 in node I of the WT and pht1;7 mutants.
Supplemental Table S1. Specific spacers of PHT1;7.
Supplemental Table S2. Gene ID and primer sequences of genes for RT-qPCR.
Supplemental Table S3. Primers used for constructs.
M.G. conceived and designed the experiments. C.R.D. performed most of the experiments, and M.G. conducted the immunostaining and anatomic analysis. X.L.D. and H.Y.Q. performed hydroponic culture and rice transformation. Q.M. and J.Y.L. were responsible for the field management and assisted in the physiological analysis. C.R.D. and M.G. analyzed the data, and wrote the article. L.Y. and G.H.X. gave critical comments and revisions to the manuscript.
The author responsible for distribution of materials integral to the findings presented in this article in accordance with the policy described in the Instructions for Authors (https://dbpia.nl.go.kr/plphys/pages/general-instructions) is Mian Gu ([email protected]).
Acknowledgments
We thank Prof. Jian Feng Ma (Okayama University), Prof. Weiming Shi (Institute of Soil Science, Chinese Academy of Sciences), Prof. Chuanzao Mao (Zhejiang University), and Prof. Keke Yi (Institute of Agricultural Resources and Regional Planning, Chinese Academy of Agricultural Sciences) for their critical comments and suggestions to this work. We are grateful to Prof. Huixia Shou (Zhejiang University) and Prof. Keke Yi for providing the yeast mutant line and expression vector. We also thank Prof. Lijia Qu (Peking University) and Dr. Tzvi Tzfra (University of Michigan) for providing us with the vectors for the CRISPR–Cas9 system and subcellular localization analysis.
Funding
This work was supported by National Key Research and Development Program of China (2021YFF1000400 and 2017YFD0200200), Natural Science Foundation of China (31972489, 31930101, and 31872165), and Innovative Research Team Development Plan of the Ministry of Education of China (IRT_17R56; KYT201802).
Conflict of interest statement. All authors state no conflict of interest concerning this paper.
References
Author notes
Senior author
