


Abstract
As a universal second messenger, calcium (Ca2+) transmits specific cellular signals via a spatiotemporal signature generated from its extracellular source and internal stores. Our knowledge of the mechanisms underlying the generation of a Ca2+ signature is hampered by limited tools for simultaneously monitoring dynamic Ca2+ levels in multiple subcellular compartments. To overcome the limitation and to further improve spatiotemporal resolutions, we have assembled a molecular toolset (CamelliA lines) in Arabidopsis (Arabidopsis thaliana) that enables simultaneous and high-resolution monitoring of Ca2+ dynamics in multiple subcellular compartments through imaging different single-colored genetically encoded calcium indicators. We uncovered several Ca2+ signatures in three types of Arabidopsis cells in response to internal and external cues, including rapid oscillations of cytosolic Ca2+ and apical plasma membrane Ca2+ influx in fast-growing Arabidopsis pollen tubes, the spatiotemporal relationship of Ca2+ dynamics in four subcellular compartments of root epidermal cells challenged with salt, and a shockwave-like Ca2+ wave propagating in laser-wounded leaf epidermis. These observations serve as a testimony to the wide applicability of the CamelliA lines for elucidating the subcellular sources contributing to the Ca2+ signatures in plants.
Introduction
As a second messenger, Ca2+ plays a pivotal role in regulating plant adaptive responses to developmental and environmental signals by forming specific Ca2+ signatures that occur in spikes, waves, and oscillations with a defined duration, amplitude, frequency, and/or subcellular location (Dodd et al., 2010; Kudla et al., 2018; Vigani and Costa, 2019; Lamers et al., 2020). Ca2+ signatures are generated by Ca2+ channels, Ca2+ pumps, and/or Ca2+ transporters localized in the plasma membrane (PM) or organellar membranes (Stael et al., 2012; Costa et al., 2018; Kudla et al., 2018; Pan et al., 2019; Hilleary et al., 2020; He et al., 2021), and are presumably decoded by Ca2+ sensing proteins, for example calmodulin (CaM), CaM-like proteins, calcium-dependent protein kinases, and calcineurin B-like proteins (Harmon et al., 2000; Cheng et al., 2002; Luan et al., 2002; Harper et al., 2004; McCormack et al., 2005; DeFalco et al., 2009; Weinl and Kudla, 2009; Kudla et al., 2018; Tang et al., 2020). The mechanisms for encoding Ca2+ signatures are poorly characterized, largely due to the spatiotemporal complexity of Ca2+ signaling, which often involves a large number of Ca2+ signature encoders and decoders distributed widely in multiple subcellular compartments (Stael et al., 2012; Costa et al., 2018; Kudla et al., 2018; Wudick et al., 2018). Untangling the complexity requires tools for simultaneous visualization of Ca2+ dynamics in multiple subcellular compartments with high spatiotemporal resolution.
Many Ca2+ probes have been developed, including Ca2+ selective vibrating probes (Kuhtreiber and Jaffe, 1990; Pierson et al., 1994; Shipley and Feijó, 1999), Ca2+-sensitive fluorescent dyes (Grynkiewicz et al., 1985; Minta et al., 1989), and genetically encoded calcium indicators (GECIs) (Shimomura et al., 1962; Miyawaki et al., 1999; Nakai et al., 2001; Zhao et al., 2011). The vibrating probe has a relatively poor spatial resolution, while the fluorescent dyes require extra loading steps (Takahashi et al., 1999; Bothwell et al., 2006). The GECIs provide consistent and convenient means to monitor in vivo Ca2+ levels with excellent spatiotemporal resolutions, albeit with slower kinetics, and lower detection efficiency compared with fluorescent dyes (Hendel et al., 2008; Lock et al., 2015). Recent efforts have greatly improved kinetics and sensitivities of GECI-based Ca2+ sensors. There are four types of GECIs (Mank and Griesbeck, 2008; Perez Koldenkova and Nagai, 2013; Supplemental Table S1). The aequorin bioluminescent Ca2+ sensors (Johnson et al., 1995; Sedbrook et al., 1996; Logan and Knight, 2003; Mehlmer et al., 2012; Zhu et al., 2013; Sello et al., 2018) are excellent for accurate quantification of Ca2+ level at the tissue level, but inadequate for high spatial resolution imaging at subcellular levels (Zhu et al., 2013; Xiong et al., 2014; Sello et al., 2018). The fluorescence resonance energy transfer (FRET)-based ratiometric Ca2+ sensors, such as Yellow Cameleon 3.6 (YC3.6) (Krebs et al., 2012; Loro et al., 2012), YC4.6 (Loro et al., 2016), D3cpv (Loro et al., 2013), D4ER (Bonza et al., 2013), etc., offer good spatial resolution at subcellular levels, absolute quantification of Ca2+ levels, and tolerance to pH fluctuations, but have a poor dynamic range and require two channels for imaging, limiting their applications in simultaneous imaging in multiple subcellular compartments. The non-FRET-based ratiometric Ca2+ sensors, such as GCaMP-R (Cho et al., 2017), MatryoshCaMP6s (Ast et al., 2017) family Ca2+ sensors, and R-GECO1-mTurquoise sensor (Waadt et al., 2017), retain the advantages of the FRET-based Ca2+ sensors, and have dramatically increased dynamic ranges, but are still limited in multiple channel imaging. The single-colored GECIs, such as R-GECO1 (red fluorescent genetically-encoded Ca2+ indicator for optical imaging), consist of a CaM domain, a CaM-binding domain from myosin light chain kinase (M13), and a circularly permuted fluorescent protein (cpFP) (Zhao et al., 2011). Upon Ca2+ binding, CaM interacts with CaM binding domain, resulting in a conformational change in cpFP and increased fluorescence (Mank and Griesbeck, 2008). The GECIs offer a higher dynamic range and kinetic superiority to the ratiometric GECIs. Importantly, the diverse spectral properties render them ideal for imaging Ca2+ dynamics in multiple subcellular compartments (Whitaker, 2010; Keinath et al., 2015). Single-colored GECIs have been successfully applied to imaging Ca2+ dynamics in plant cells (Costa and Kudla, 2015; Keinath et al., 2015; Waadt et al., 2017; Walia et al., 2018; De Vriese et al., 2019; Marhavy et al., 2019), but have only been used for simultaneous Ca2+ imaging in two subcellular compartments (Kelner et al., 2018; Luo et al., 2020; Resentini et al., 2021).
Here, we assembled a toolset, coined as CamelliA for simultaneous Ca2+ imaging across multiple subcellular compartments in Arabidopsis, for simultaneous imaging of Ca2+ dynamics in multiple subcellular compartments with high spatiotemporal resolution. Consequently, we discovered unprecedented rapid cytosolic Ca2+ oscillations in pollen tubes and an unrecognized propagating blast of subcellular Ca2+ waves in leaf epidermal cells. Hence by enabling simultaneous Ca2+ imaging in multiple compartments, CamelliA will uncover new Ca2+ signatures and allow dissecting the underlying mechanisms of Ca2+-mediated signal integration in plant cells.
Results
Design and generation of a multi-compartmental Ca2+ imaging toolset
The design of multi-compartmental Ca2+ imaging is based on the expression of targeted GECIs with distinct emissions in various subcellular compartments, including the cytosol, the nucleus, the sub-PM region (inner surface of the PM), the endoplasmic reticulum (ER) lumen, and the chloroplast stroma. Different subcellular compartments display distinct levels of free Ca2+ ion (Suzuki et al., 2016; Costa et al., 2018). As such, effective monitoring of the changes in Ca2+ levels requires the selection of GECIs with appropriate binding affinity to Ca2+ (Kd). Thus, we employed three single-colored GECIs: B-GECO1 (Zhao et al., 2011), GCaMP6f (Chen et al., 2013; Li et al., 2019), and jRGECO1a (Dana et al., 2016), for imaging the cytosolic and the nuclear Ca2+ levels, because their Kd is within the range of the cytosolic and nuclear Ca2+ concentrations (van Der Luit et al., 1999; Mithofer and Mazars, 2002; Stael et al., 2012; Sello et al., 2016; Costa et al., 2018; Jiang et al., 2019). They were each tagged with an N-terminal nuclear export signal peptide from PKIα (Wen et al., 1995) or C-terminal three tandem repeats of the nuclear localization signal from the SV40 large T antigen (Kalderon et al., 1984) for cytosolic and nuclear targeting, respectively. To monitor extracellular Ca2+ influx through the PM, we used a similar approach as previously described (Krebs et al., 2012; Iwano et al., 2015) by anchoring GCaMP6f and jRGECO1a to the cytosolic side of the PM through C-terminal fusion with Arabidopsis (Arabidopsis thaliana) LOW TEMPERATURE-INDUCED PROTEIN 6B (AtLTI6b) (Cutler et al., 2000). For visualizing Ca2+ dynamics in the ER lumen, we selected two low-affinity single-colored GECIs, G-CEPIA1er and R-CEPIA1er (Suzuki et al., 2014) with optimal Kd for analyzing Ca2+ levels in the ER lumen (Iwano et al., 2009; Stael et al., 2012; Bonza et al., 2013; Costa et al., 2018). ER targeting signal peptide from Arabidopsis CALRETICULIN 1A (AtCRT1A) (Bonza et al., 2013) and a KDEL ER-retention signal peptide (Denecke et al., 1992) were fused to N- and C-termini of the GECIs, respectively, to target them to ER lumen. Lastly, we chose GCaMP6f for monitoring Ca2+ levels in the chloroplast stroma because YC3.6, a Ca2+ sensor with similar Kd, has been successfully applied to assessing Ca2+ dynamics in the stroma (Loro et al., 2016). Thus, the N-terminus of GCaMP6f was fused with tandem repeats of a chloroplast stroma targeting peptide from Arabidopsis β-amylase 4 (Fulton et al., 2008; Loro et al., 2016) for targeting to the chloroplast stroma. The Kd of the chosen GECIs and the Ca2+ levels in the above compartments were summarized in Supplemental Table S2.
To allow Ca2+ imaging in various tissues and cell types, all of the above GECIs were driven by the Arabidopsis UBQ10 promoter, a ubiquitous promoter active in various cell types and tissues including pollen tubes, hypocotyls, roots, cotyledons, and true leaves (Geldner et al., 2009; Grefen et al., 2010; Krebs et al., 2012). The expression of all GECIs is terminated by the NOS terminator. The nomenclatures and the respective detailed construct designs are summarized in Figure 1 and Supplemental Table S3.

Schematics of various subcellular compartment-specific CamelliA Ca2+ sensor constructs. Arabidopsis transgenic lines expressing organelle-specific CamelliA calcium sensor constructs under the control of UBIQUITIN 10 (UBQ10) promoter were generated. NES, nuclear export signal; NLS, nuclear localization signal; LTI6b, Arabidopsis LOW TEMPERATURE INDUCED PROTEIN 6B; SPCRT1A, the signal peptide of Arabidopsis CALRETICULIN1A; 2×BAM4, two tandem repeats of the signal peptide of Arabidopsis BETA-AMYLASE 4 (BAM4); TNOS, NOS terminator.
To acquire transgenic plants without abnormal growth phenotypes that may result from the expression of single-colored GECIs to a high level (Waadt et al., 2017), we subjected the transgenic lines to several rounds of stringent selections by analyzing their genetic and physiological performances (Supplemental Figure S1). All final chosen transgenic lines must have a single T-DNA insertion, low or moderate expression levels of the GECIs, and similar growth phenotypes as those of wild-type plants. Details of the analyses are described in Supplemental Method S1 (see also Supplemental Figures S2–S7 in Supplemental Method S1).
Confocal imaging confirmed the correct subcellular localization of all GECIs in the CamelliA lines. The cytosolic GECIs were excluded from the nucleus (Figure 2, A–D and Supplemental Figure S8, A–F), while the nuclear GECIs were exclusively localized within the nucleus (Figure 2, E–H and Supplemental Figure S8, G–L). The PM-anchored Ca2+ sensors (CamelliA_PmG/R) exhibited colocalization with the FM4-64-stained PM (Figure 2, I–L and Supplemental Figure S8, M–O). The two ER-targeted GECIs (CamelliA_ErG/R) were colocalized with the ER marker AtWAK2-CFP-HDEL (ER-ck) (Nelson et al., 2007; Figure 2, M–P and Supplemental Figure S8, P–Q). The colocalization of the GECI with autofluorescent chlorophylls in the CamelliA_ChlG line confirms the correct targeting to chloroplast stroma (Figure 2, Q–T).
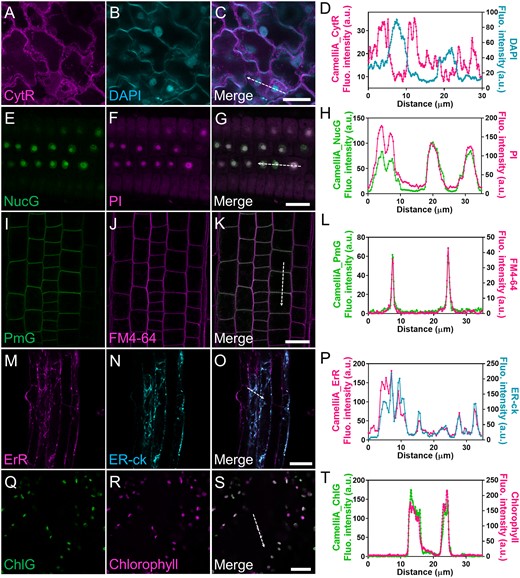
Colocalization of the GECIs and the corresponding subcellular compartments markers in the CamelliA lines. A–D, Representative confocal images of CamelliA_CytR (A), DAPI (4′,6-diamidino-2-phenylindole)-stained nuclei (B), and merged image (C). Fluorescence intensity along the direction of the dotted white arrow in the merged image C is plotted in D. E–H, Representative confocal images of CamelliA_NucG (E), PI-stained nuclei (F), and merged image (G). Fluorescence intensity along the direction of the dotted white arrow in the merged image (G) is plotted in H. I–L, Representative confocal images of CamelliA_PmG (I), FM4–64-stained PM (J), and merged image (K). Fluorescence intensity along the direction of the dotted white arrow in the merged image (K) is plotted in L. M–P, Representative confocal images of CamelliA_ErR (M), ER-ck labeled ER (N), and merged image (O). Fluorescence intensity along the direction of the dotted white arrow in the merged image (o) is plotted in P. Q–T, Representative confocal images of CamelliA_ChlG (Q), autofluorescence of the chlorophyll (R), and merged image (S). Fluorescence intensity along the direction of the dotted white arrow in the merged image (S) is plotted in T. Images in A–C and Q–S were acquired from leaf epidermal cells; Images in E–G, I–K, and M–O were acquired from root cells. ER, endoplasmic reticulum; Fluo., fluorescence; a.u., arbitrary unit. Scale bars are 20 µm in C, G, K, S, and 40 µm in O.
The CamelliA lines robustly report Ca2+ signatures in response to extracellular stimuli
To test the performance of the CamelliA lines, we analyzed the spatiotemporal changes in the fluorescence intensity of the GECIs in response to established extracellular stimuli. Extracellular ATP elevates Ca2+ levels in many subcellular compartments, including the cytosol (Jeter et al., 2004; Tanaka et al., 2010; Loro et al., 2012), nucleus (Loro et al., 2012; Costa et al., 2013), sub-PM region (Krebs et al., 2012), ER (Bonza et al., 2013), and non-green plastids (Loro et al., 2016) in Arabidopsis.
All three cytosolic Ca2+ sensors (CamelliA_CytB/G/R) showed a rapid increase in cytosolic signals with several consecutive peaks after 100 µM ATP application (Figure 3, A and B and Supplemental Figure S9, A and C), similar to those previously reported using the YC3.6 sensor (Tanaka et al., 2010; Loro et al., 2012). The fluorescence intensity of all three cytosolic GECIs did not increase after the mock treatment (Figure 3C and Supplemental Figure S9, B and D). The three cytosolic sensors displayed similar peaks of cytosolic Ca2+, albeit with some minor differences in their shapes (Figure 3A and Supplemental Figure S9, A and C). The differences likely resulted from the different biophysical properties, such as affinities for Ca2+ binding (Kd), response kinetics, and dynamic ranges (Supplemental Table S1). B-GECO1 in the CamelliA_CytB line has a low photostability evidenced by severe photobleaching during the imaging (Supplemental Figure S9B). Fluorescence of the CamelliA_CytG/R lines showed no decrease during the whole period of the mock treatment demonstrating excellent photostability (Figure 3C and Supplemental Figure S9D), and as such these two lines are most suitable for long-term imaging of cytosolic Ca2+.
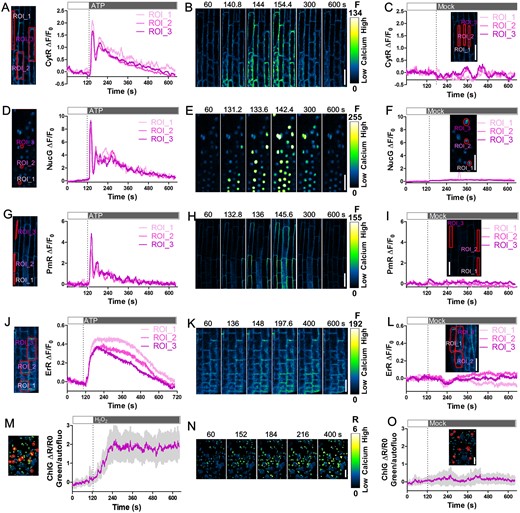
Ca2+ signatures at a high spatiotemporal resolution post ATP or H2O2 treatment of CamelliA lines. A, D, G, and J, Time course of fluorescence intensity changes ΔF/F0 (right) of the GECIs targeted to four subcellular compartments in the root epidermis of CamelliA_CytR, CamelliA_NucG, CamelliA_PmR, and CamelliA_ErR seedlings before and after extracellular ATP treatment (250 µM ATP for ER-localized GECIs and 100 µM ATP for cytosolic, sub-PM, and nucleus localized GECIs). The labeled ROIs (left) were used for measurement of the GECI intensity in the cytosol (A), the nuclei (D), the sub-PM domain (G), and the ER lumen (J). B, E, H, and K, Images of the ATP-treated roots expressing cytosol- (B), nucleus- (E), sub-PM domain- (H), and ER- (K) targeted GECIs at selected time points. C, F, I, and L, Time course of fluorescence intensity changes of the GECIs targeted to four subcellular compartments in the root epidermis of CamelliA_CytR, CamelliA_NucG, CamelliA_PmR, and CamelliA_ErR seedlings before and after mock treatment. Inserted images show the ROIs used for measurement of the GECI intensity. M and O, Time course of the change of the ratio ΔR/R0 (right) between the stroma-targeted CamelliA_ChlG and the autofluorescence of chlorophyll in cotyledon before and after 10 mM H2O2 (M) or mock (O) treatment. Mean value (purple line) and 95% confidence intervals (gray shading) were plotted using the data from 11 chloroplasts (left, labeled by red circles). N, Images of the H2O2-treated cotyledon epidermis at selected time points. Positive fluorescence intensity changes (ΔF/F0) and fluorescence intensity ratio changes (ΔR/R0) indicate increases in Ca2+ concentration in the corresponding subcellular compartment. Representative data from at least three independent biological repeats were shown. Scale bars are 40 µm.
With identical imaging settings, extracellular ATP-induced Ca2+ dynamics in the nucleus, the sub-PM region, and the ER were imaged using the CamelliA_NucB/G/R, CamelliA_PmG/R lines, and CamelliA_ErG/R lines, respectively. All nucleus-targeted and PM-anchored GECIs reported several consecutive inductions of Ca2+ levels in the nucleus and the sub-PM region (Figure 3, D and G and Supplemental Figure S9, E, G, and I). No substantial changes in the fluorescence intensity were observed in mock treatments (Figure 3, F and I and Supplemental Figure S9, F, H, and J).
Fluorescence of the two ER-targeted GECIs displayed different patterns of changes post ATP treatment (Figures 3J and 4, D and E). CamelliA_ErR showed a single transient peak returning to the basal level at the end of the imaging (Figures 3J and 4E), similar to that reported previously using CRT-D4ER sensor (Bonza et al., 2013). In contrast, ErG exhibited multiple peaks (Figure 4D). Moreover, mock treatment triggered a peak in the CamelliA_ErG line, but not in the CamelliA_ErR line (Figures 3L and 4, G and H). Furthermore, G-CEPIA1er used in the ErG line is highly sensitive to pH fluctuations (see details below). These results suggest that CamelliA_ErR serves as an ER Ca2+ sensor, whereas the ErG line may not be useful for reporting ER Ca2+ signatures.
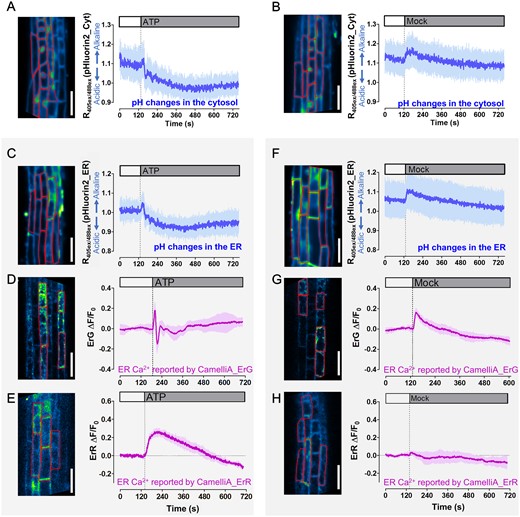
Cytosolic and ER pH fluctuations post extracellular ATP or mock treatment and impact on the ER-targeted GECIs. A–C, F, Monitoring of the pH fluctuations in the cytosol (A, B) and the ER (C, F) of the root epidermis cells treated with 250 µM ATP (A, C) and mock (B, F). ROIs for analyzing fluorescence ratio of pHluorin2 are labeled in the inserted images (left), and time course (right) of fluorescence ratio changes in these ROIs shows the mean fluorescence ratio (blue line) and SD (blue shading) that calculated from eight cells from the root epidermis. D and E, G and H, Time course (right) of fluorescence intensity changes (ΔF/F0) of the two ER-targeted GECIs, CamelliA_ErG (D, G) and CamelliA_ErR (E, H), in root epidermis with 250 µM ATP treatment (D, E) or mock treatment (G, H). ROIs for analyzing fluorescence CamelliA_ErG and CamelliA_ErR are labeled in the inserted images (left), and time course (right) of fluorescence intensity changes in these ROIs shows the mean fluorescence intensity (purple line) and sd (purple shading) that calculated from five cells from the root epidermis. Representative data from at least three independent biological repeats were shown. Scale bars are 50 µm.
We imaged chloroplast stroma GECI in CamelliA_ChlG cotyledons challenged with H2O2 known to elevate Ca2+ in the stroma of chloroplast in leaf cells (Sello et al., 2018). To compensate for the chloroplast movement away from the focal plane resulting in decreased fluorescence, we performed ratio imaging between the fluorescence of the GECI and the autofluorescence of the chlorophyll. Consistent with the previous report (Sello et al., 2018), treatment with 10 mM H2O2, but not mock treatment, triggered Ca2+ elevation in chloroplasts stroma, reaching a plateau in ∼120 s post treatment (Figure 3, M–O).
In summary, all the CamelliA lines, except CamelliA_ErG, reliably displayed the compartmental specific Ca2+ signatures post-treatment with the well-studied extracellular stimuli.
Most single-colored GECIs in CamelliA lines are insensitive to physiological pH fluctuations under the conditions tested
The concerns that single-colored GECIs are sensitive to pH fluctuations (Keinath et al., 2015) together with the parallel changes in pH and Ca2+ levels (Behera et al., 2018; Waadt et al., 2020; Li et al., 2021), prompted us to examine the influence of pH fluctuations on the GECIs performance in the CamelliA lines. We monitored cellular pH fluctuations using the ratiometric pH sensor, pHluorin2 (Michard et al., 2008; Mahon, 2011). The ratio between the emissions of pHluorin2 excited by 405 and 488 nm (R405ex/488ex) is proportional to pH values (Mahon, 2011). Free pHluorin2 was used to monitor the pH in both the cytosol and the nucleus, and pHluorin2 fused with AtCRT1a signal peptide and KDEL were used to monitor ER pH. Both constructs are under the Arabidopsis UBQ10 promoter control. Mock treatment with the imaging buffer triggered a transient cytosolic and ER pH elevation (alkalinization) in root epidermal cells (<10% increase in R405ex/488ex) (Figure 4, B and F). This pH change differs from that reported previously, likely due to different methods used to mount and treat the seedlings (Behera et al., 2018; Kesten et al., 2019). We speculate that our mock treatment might have triggered mechanosensitive channels to induce ion fluxes through certain membranes and subsequent pH changes (Haswell et al., 2008; Wilson et al., 2013; Peyronnet et al., 2014). However, all the Ca2+ sensors, except CamelliA_ErG, showed no changes in fluorescence intensity after mock treatment (Figure 3 and Supplemental Figure S9). The CamelliA_ErG line exhibited elevated fluorescence intensity after mock treatment (Figure 4G), similar to the pH elevation (Figure 4F). Thus, G-CEPIA1er in CamelliA_ErG line is sensitive to pH fluctuations, consistent with the G-CEPIA1er’s highest pKa (8.0) at the Ca2+ saturated state compared with all the other GECIs (Supplemental Table S1).
Extracellular ATP triggered similar pH fluctuations both in the cytosol and the ER. Following an initial transient alkalinization resulting from responses to mock treatment, the pH rapidly acidified and then gradually returned to the resting level (Figure 4, A and C). However, the pH fluctuations did not skew the reported Ca2+ signatures in any tested lines, except the CamelliA_ErG line, because they all reported Ca2+ signatures consistent with those reported by the less pH-sensitive ratiometric Ca2+ sensors. However, G-CEPIA1er again was very sensitive to ATP-induced pH fluctuations (Figure 4D); therefore, it is not suitable for reporting Ca2+ dynamics in ER.
CamelliA lines reveal rapid Ca2+ oscillations in pollen tubes
Ca2+ gradients and oscillations have been extensively characterized in pollen tubes (Pierson et al., 1996; Holdaway-Clarke et al., 1997; Messerli and Robinson, 1997; Michard et al., 2008; Damineli et al., 2017; Barberini et al., 2018). Using ratiometric GECIs such as YC3.6, regular Ca2+ oscillations were exclusively observed in non- or slow-growing Arabidopsis pollen tubes, but never in fast-growing tubes (Iwano et al., 2009; Damineli et al., 2017; Diao et al., 2018). The failure to observe Ca2+ oscillations in rapidly growing tubes might have resulted from limited temporal resolutions (2–5 s) in imaging. Indeed, imaging of CamelliA_CytR pollen tubes at 385 ms per frame revealed Ca2+ oscillations at the tip of fast-growing tubes (Figure 5, A–C and Supplemental Movie S1). Spectral analyses of the Ca2+ oscillations using the intensity versus time showed a major peak at 228.3 mHz, an indication of Ca2+ oscillation with a period of 4.38 s (Figure 5D). Statistical analyses of the cytosolic Ca2+ oscillations in eight pollen tubes established a mean oscillations period of 5.10 s (Figure 5E). Similar results were also obtained from analyzing the other two cytosolic GECIs in the CamelliA_CytB/G lines (Supplemental Figure S10, A–H). Similar cytosolic Ca2+ oscillations were also observed in pollen tubes expressing YC3.6 imaged at 294 ms per frame, albeit with a smaller amplitude and reduced ratio of the FRET channel to CFP channel over time, caused by the photobleaching of YFP (Supplemental Figure S11). These data demonstrated the superiority of the GECIs in the CamelliA lines compared with the ratiometric Ca2+ sensor YC3.6.
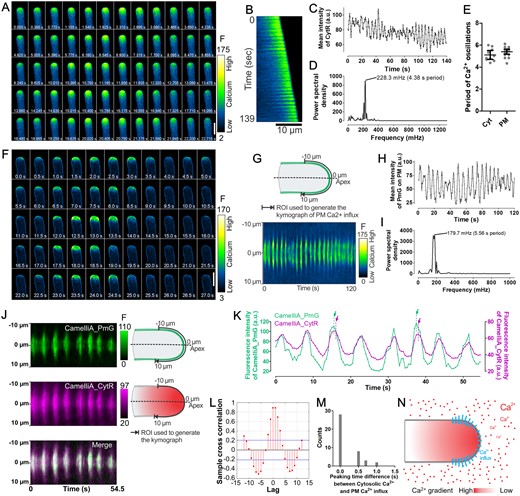
Ca2+ imaging at a high spatiotemporal resolution in fast-growing Arabidopsis pollen tubes reveals fast and regular cytosolic Ca2+ oscillations and a unique pattern of Ca2+ influx on the apical PM. A and B, Time-lapse images (A) and kymograph along the central axis (B) of a fast-growing pollen tube expressing the cytosolic Ca2+ sensor CamelliA_CytR. C and D, Time course of the fluorescence intensity of the CamelliA_CytR in the tip region (6 µm from apex to the shank) of the pollen tube (C) and spectral analysis of the Ca2+ oscillations (D). E, Oscillation periods of the cytosolic Ca2+ (Cyt) and PM Ca2+ influx (PM) are plotted in the scatter plot. The mean ± 95% confidence interval is also shown. F, Time-lapse images of a fast-growing pollen tube expressing the PM-anchored Ca2+ sensor CamelliA_PmG. G, Kymograph of the CamelliA_PmG fluorescence along the growing PM region of 10 µm on each side of the apex (illustrated in the upper panel) by constantly tracking and analyzing the growing tip using the TipQAD algorithm. H and I, Time course of the fluorescence intensity of the CamelliA_PmG in the apical PM region (10 µm on each side of the apex) of the pollen tube (H) and spectral analysis of the Ca2+ oscillations (I). J, Kymographs of CamelliA_PmG (upper left), CamelliA_CytR (middle left), and the merged kymograph (lower left) were acquired from a simultaneous observation of both Ca2+ sensors in the same pollen tube. ROIs for generating the kymographs are indicated on the right side of each kymograph. K and L, Time course of the fluorescence intensity (K) and cross-correlation analyses (L) of the CamelliA_CytR and CamelliA_PmG observed simultaneously in the same pollen tube. The green and purple dotted lines and arrows highlight two events of sub-PM Ca2+ reaching the peak ahead of the cytosolic Ca2+. M, Distribution of the time delay between cytosolic and sub-PM Ca2+ reaching the peak within each oscillation cycle (data from five independent pollen tubes). N, Model of the Ca2+ influx across the apical PM, where the Ca2+ influx was initiated at the apex then expanded exclusively to the whole apical PM with stronger activity in the region surrounding the apex. Increases in fluorescence intensity indicate increases in Ca2+ concentration. Representative data from at least eight independent biological repeats were shown. a.u., arbitrary unit. Scale bars are 10 µm in A, F.
Proton gradients play an essential role in pollen tube growth (Chen et al., 2020; Hoffmann et al., 2020), and are shown to oscillate (Messerli et al., 1999; Lovy-Wheeler et al., 2006; Damineli et al., 2017; Hoffmann et al., 2020). We assessed whether pH oscillations could contribute to the oscillations of GECI signals in the CamelliA lines using the same pollen tubes co-expressing both CamelliA_CytR and free pHluorin2. The cytosolic pH fluctuated with a small amplitude and showed neither an overlapping pattern nor a similar oscillation period with the Ca2+ oscillations (Supplemental Figure S12). Furthermore, we imaged Ca2+ dynamics in pollen tubes co-expressing the cytosolic jRGECO1a and the less pH-sensitive YC3.6. Both sensors displayed a similar pattern of Ca2+ oscillations in fast-growing pollen tubes (Supplemental Figure S13) and slow-growing pollen tubes (Supplemental Figure S14). These data uncovered a rapid oscillation of cytosolic Ca2+ with a mean period of 5.10 s in the tip of fast-growing Arabidopsis pollen tubes.
The influx of extracellular Ca2+ contributes to the cytosolic Ca2+ changes in pollen tubes (Messerli et al., 1999; Hepler et al., 2012; Pan et al., 2019). Ca2+ selective vibrating probes detected Ca2+ influx across the PM at the extreme apex of lily and poppy pollen tubes (Pierson et al., 1996; Franklin-Tong et al., 2002). However, these probes failed to pinpoint the spatial distribution of the Ca2+ influx sites on the PM of pollen tubes. We reasoned that the PM-anchored GECIs may detect the precise sites of Ca2+ influxes. Hence, we imaged the pollen tubes of the CamelliA_PmG line at a rate of two frames per second. We observed regular oscillations of CamelliA_PmG in the apical PM of fast-growing pollen tubes (Figure 5F and Supplemental Movie S2). Using TipQAD algorithm for automated tracing of pollen tube tip contour and analyses of fluorescence intensity and distribution on the PM (Tambo et al., 2020), we generated a kymograph along the contour of a 20-µm PM region in the apex of a fast-growing pollen tube (Figure 5G) and a chart of mean intensity versus time over the same PM region (Figure 5H). Spectral analyses showed regular oscillations of the CamelliA_PmG in the apical PM with a period of 5.56 s (Figure 5I). Furthermore, the kymograph also revealed that CamelliA_PmG fluorescence was exclusively present in the apical PM with a stronger signal in the regions surrounding the extreme apex not only in fast-growing pollen tubes (Figure 5G) but also in slow-growing pollen tubes (Supplemental Figure S15, A–C). Similar results were also observed using the CamelliA_PmR line (Supplemental Figures S10, I–L and S15, D–F). This pattern of CamelliA_PmG is spatially (see above) and temporally (see below) distinct from that of the cytosolic Ca2+ reporter, suggesting that PmG reported the influx of extracellular Ca2+ through the PM. Collectively, our data reveal fast and regular oscillations of Ca2+ influx at the apical PM of pollen tubes with a period similar to that of the cytosolic Ca2+ oscillation.
Since both PM Ca2+ influx and cytosolic Ca2+ levels oscillate with similar frequencies, we next investigated their temporal relationship by observing these two Ca2+ dynamics simultaneously in pollen tubes co-expressing CamelliA_PmG and CamelliA_CytR. As expected, both cytosolic Ca2+ and PM Ca2+ influx oscillate within the same period (Figure 5, J–K and Supplemental Figure S16). Cross-correlation analyses revealed a slight but notable lag in the oscillation of cytosolic Ca2+ compared with the PM Ca2+ influx (Figure 5L), and peaking time of the cytosolic Ca2+ was also lagged behind that of the PM Ca2+ influx within the same period in 31.7% of the oscillations (n = 41, from five pollen tubes) (Figure 5, K and M), both supporting the hypothesis that the influx of the Ca2+ through the apical PM directly contributes to and drives the elevation of cytosolic Ca2+ level (Figure 5N).
High spatiotemporal resolution imaging of multi-compartmental Ca2+ dynamics in response to salt treatments
To demonstrate the full capacity of our toolset for multi-compartmental Ca2+ imaging, we next imaged Ca2+ dynamics in four subcellular compartments, namely the cytosol, the nucleus, the sub-PM region, and the ER, in Arabidopsis root epidermal cells challenged with salt. To avoid any potential adverse impacts on plant growth as a result of combining all four GECIs, we divided the four sensors into two groups used in independent Ca2+ imaging: one group for imaging Ca2+ dynamics in the cytosol, the nucleus, and the sub-PM region (the triple-sensor line generated by crossing CamelliA_CytR, CamelliA_PmG, and CamelliA_NucG lines sequentially); another group for imaging Ca2+ dynamics in the ER and the sub-PM region (the dual-sensor line generated by crossing CamelliA_ErR line to CamelliA_PmG line). The sub-PM Ca2+ is shared by both groups, serving as a reference for superimposing the Ca2+ dynamics in the four subcellular compartments. No growth and morphological phenotypes were observed in the homozygous triple-sensor and dual-sensor lines when compared to the wild type (Supplemental Figure S5), indicating that co-expressing of the multiple Ca2+ sensors have no adverse impacts. To enable fast diffusion of the salt stimulus, the whole seedling was first put on rock wool soaked with 50 µL of imaging buffer, then 150 µL of salt buffer was applied to the seedling (see Supplemental Method S2). Imaging with a sub-second temporal resolution showed that the PM Ca2+ influx (sub-PM region) and the cytosolic Ca2+ elevated within seconds after salt treatment, followed by the elevation of the nuclear Ca2+ a few seconds later (Figure 6, A–D), consistent with a previous report (Kelner et al., 2018). Strikingly, a clear propagation of a Ca2+ wave on the sub-PM region with a speed of 28.92 ± 12.37 µm/s (mean ± standard deviation [SD]) was detected by the PM-anchored Ca2+ sensor in the root epidermal cells (Figure 6C; Supplemental Figure S17; and Supplemental Movie S3). A similar pattern was also revealed by the cytosolic Ca2+ sensor albeit with lower contrast (Figure 6C and Supplemental Movie S3). The onset the nuclear Ca2+ signal was lagged behind that of the cytosolic Ca2+ (Figure 6D) and was not triggered until the Ca2+ wave in the cytosol reached the nucleus, implying that cytosolic Ca2+ elevation may initiate the Ca2+ influx into the nucleus (Figure 6C and Supplemental Movie S3). The spectral properties of the Ca2+ signatures in the above three compartments have no difference in amplitudes, but are significantly different in the signal duration as measured by the full width of half-maximum (FWHM) of signal peaks (Figure 6D).
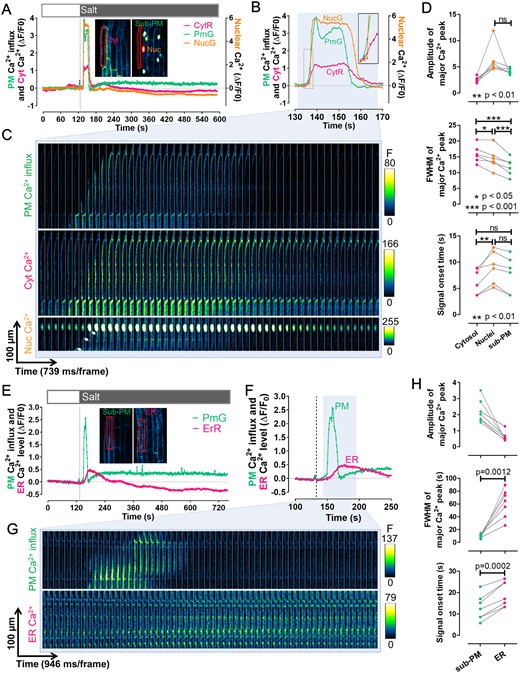
Visualization of the Ca2+ signatures in response to salt treatment in four subcellular compartments of the root epidermal cells. A and B, Time course of fluorescent intensity changes (ΔF/F0) of the CamelliA_CytR, CamelliA_PmG, and CamelliA_NucG in the same root epidermis cell before and after salt treatment (salt buffer: 150 mM NaCl, 5 mM KCl, 10 mM CaCl2, 10 mM MES pH 5.8). The ROIs highlighted by the red line in the inserted two images were used for quantifying the intensity of corresponding Ca2+ sensors. The time course between 130 and 170 s was replotted in B to show the detail of the Ca2+ dynamics in the cytosol, the sub-PM region, and the nucleus. Insert in B showed the detail of the dotted rectangle region. C, Time-lapse images of the sub-PM region (upper), the cytosol (middle), and the nucleus (lower) of the same root epidermis cell expressing the above three Ca2+ sensors during the time course of the blue shaded region in B. The white arrows in the lower panel highlight the propagation of the sub-PM Ca2+ wave toward the nucleus. D, Quantitative analyses of the Ca2+ signal spectra in the three subcellular compartments, including amplitude (upper panel) and FWHM (of signal peaks, as a measure of signal duration) (middle panel) of the major Ca2+ peak, and the signal onset time (lower panel) after salt treatment. Data points measured from the same cell were connected by a gray line in all charts. The difference between the signal amplitudes of sub-PM and nuclear Ca2+ peaks was tested by paired t test, and the difference of the signal durations and onset time in all three compartments was tested by one-way repeated measures ANOVA test. E and F, Time course of fluorescent intensity changes (ΔF/F0) of the CamelliA_PmG and CamelliA_ErR in the same root epidermis cell before and after salt treatment. The ROIs highlighted by the red line in the inserted two images were used for quantifying the intensity of corresponding Ca2+ sensors. The time course between 100 and 250 s was replotted in F to show the detail of the Ca2+ dynamics in the sub-PM region and the ER lumen. G, Time-lapse images of the sub-PM region (upper) and the ER lumen (lower) of the same root cell expressing the two above Ca2+ sensors during the time course of the blue shaded region in F. H, Quantitative analyses of the Ca2+ signal spectra in sub-PM and ER lumen, including amplitude (upper panel) and FWHM (of signal peaks, as a measure of signal duration) (middle panel) of the major Ca2+ peak, and the signal onset time (lower panel) after salt treatment. Data points measured from the same cell were connected by a gray line in all charts. The difference between the duration and signal onset time of sub-PM and ER Ca2+ peaks was tested by paired t test. Positive fluorescence intensity changes (ΔF/F0) indicate increases in Ca2+ concentration in the corresponding subcellular compartment. Representative data from at least three independent biological repeats were shown. Cyt, cytosolic; Nuc., nuclear.
Salt stress also led to the elevation of PM Ca2+ influx in the sub-PM/ER Ca2+ dual-sensor line, as observed in the triple-sensor line (Figure 6, A–C and E–G andSupplemental Movie S4). However, the onset of Ca2+ signal in ER was delayed compared to the sub-PM region (Figure 6H), reaching the peak when the sub-PM Ca2+ restored to the resting level, and then ER Ca2+ slowly decreased to below the basal level (Figure 6, E–G and Supplemental Movie S4). In addition, the Ca2+ signature in the ER lumen has a significantly longer duration than that of the sub-PM region (Figure 6H). The mock treatment, however, did not induce any detectable changes in the Ca2+ levels in the above four compartments (Supplemental Figure S18). Altogether, these observations are in agreement with salt-induced changes in Ca2+ in different subcellular compartments reported in previous studies (Knight et al., 1997; Bonza et al., 2013; Corso et al., 2018; Kelner et al., 2018), but differ in that the simultaneous imaging of Ca2+ in multiple subcellular compartments from the same cell, enabling accurate analysis of the spatiotemporal correlation of the Ca2+ dynamics across two (Resentini et al., 2021) or four subcellular compartments with our toolset.
Subcellular resolution of wounding-induced Ca2+ waves
We next expanded our studies to the leaf epidermis, which is commonly used for studying Ca2+ responses to biotic and abiotic stresses (Keinath et al., 2015; Vincent et al., 2017; Hilleary et al., 2020). Wounding induces a rapid local elevation of cytosolic Ca2+ and initiates a Ca2+ wave propagating across tissues (Beneloujaephajri et al., 2013; Nguyen et al., 2018; Toyota et al., 2018), but how the wave is propagated remains unknown. We visualized the subcellular changes in the wounding-triggered Ca2+ waves in leaf epidermal cells using our triple-sensor line. The Ca2+ levels in all three subcellular compartments of the epidermal cells were monitored after a randomly chosen pavement cell was irradiated with a high dosage of 405 nm laser to produce wounding, which was confirmed by increased propidium iodide (PI) fluorescence in the wounding site (Supplemental Figure S19). In agreement with previous studies (Beneloujaephajri et al., 2013; Nguyen et al., 2018; Toyota et al., 2018; Marhavy et al., 2019), the Ca2+ levels in the cytosol, nucleus, and sub-PM were all elevated immediately after the laser irradiation at the wounding site (Figure 7, A–C). Strikingly, a shock wave-like propagation of Ca2+ radially spread away from the wounding site in these subcellular compartments (Figure 7A and Supplemental Movie S5). We then analyzed the spatiotemporal pattern of the Ca2+ wave in the cytosol and the sub-PM region by generating kymographs on each imaging channel along the edge of the damaged cell to distal cells (Figure 7B). This analysis clearly showed a propagation of Ca2+ in both subcellular compartments, from the wounding site to distal cells with an average speed of 9.8 ± 3.1 µm/s (mean ± sd, acquired by analyzing eight different Ca2+ propagation directions from the wounding site to its surrounding cells in four independent leaf samples).
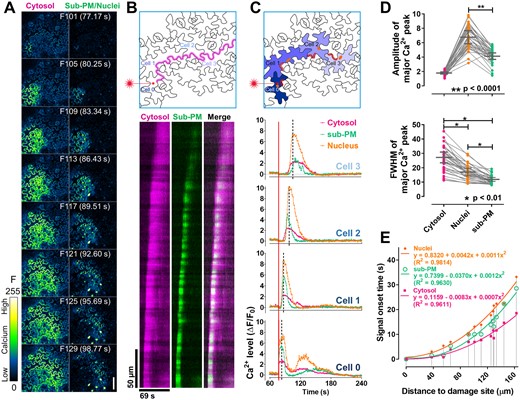
Laser-wounding triggered a local shock wave-like Ca2+ wave in the leaf epidermis. A, Time-lapse images of the leaf epidermis after laser-wounding. The cytosolic Ca2+ dynamics were shown on the left, and the Ca2+ dynamics in the sub-PM regions and the nuclei were shown on the right. The number (F101–F129) and time of each frame were labeled outside and inside of the parenthesis, respectively. At frame 100 (F100), the red square labeled region (upper panel in b and c) of the pavement cell was irradiated by a 405 nm laser. B, Kymograph (lower panel) of the CamelliA_CytR and CamelliA_PmG fluorescence along the path indicated as the purple line across Cell 0–3 in the upper panel. C, Time course of the fluorescence intensity changes (ΔF/F0) of the CamelliA_CytR, CamelliA_PmG, and CamelliA_NucG in four cells (Cell 0 is the wounded cell and Cell 1–3 are three neighboring cells) during the period of 60–240 s (F79–F312). In each cell, the ROI labeled by the red line was used for quantifying the intensity of the Ca2+ sensors in the cytosol and sub-PM region, the ROI labeled by the orange spot was used for quantifying the intensity of the nuclear Ca2+ sensor. The dotted line in each chart highlights the time point when the nuclear Ca2+ level reached its peak. The red square pointed by the laser icon on Cell 0 indicates the wounding site. Positive fluorescence intensity changes (ΔF/F0) indicate increases in Ca2+ concentration in the corresponding subcellular compartment. D, Quantitative analyses of the Ca2+ signal spectra in the three subcellular compartments, including amplitude (upper panel) and FWHM (of signal peaks, as a measure of signal duration) (lower panel) of the major Ca2+ peak. Data points measured from the same cell were connected by a gray line in both charts. The difference between the signal amplitudes of sub-PM and nuclear Ca2+ peaks was tested by paired t test, and the difference of the signal durations among three compartments was tested by one-way repeated measures ANOVA test. E, Quantitative analyses of signal onset time and distance between measured cell to the wounding site. Signal onset time in the three compartments of the same cell is connected by a gray vertical line. The data points of onset time versus distance for each compartment are fit with a second degree polynomial trendline. Representative data from 10 independent biological repeats were shown. Scale bar is 50 µm in A.
To understand the temporal relationship of the Ca2+ dynamics among all three subcellular compartments, we analyzed relative Ca2+ levels in selected region of interests (ROIs) (Figure 7C upper panel) of these compartments in each of the four chosen cells, which show wave-like Ca2+ propagation away from the wounding site (Cell 0) (Figure 7C). In the damaged cell (Cell 0), the Ca2+ level in all three compartments increased immediately after the laser irradiation. As a result, we were unable to distinguish their temporal relationships under our current time-lapse imaging (772 ms per frame) (Figure 7C). However, in the un-damaged cells, there is an obvious temporal sequence of Ca2+ elevation in the compartments. The elevation of cytosolic Ca2+ preceded that of sub-PM Ca2+ (Ca2+ influx) by ∼2–3 s, followed by nuclear Ca2+ (Figure 7, B and C). To have an unbiased overview of the propagation of the Ca2+ wave, we further quantitatively analyzed the Ca2+ signatures in all three compartments from all in-focus cells, including signal amplitude, duration and signal onset time, and physical distance of the center of measured cells to the wounding site (Figure 7, D and E). Plots of the signal onset time in all measured cells versus their distance to wounding site evidently demonstrated that cytosolic Ca2+ elevation was triggered earlier than the sub-PM Ca2+, then followed by the nuclear Ca2+. The differences in signal onset times among these compartments became noticeable in cells further away from the wounding site (Figure 7E and Supplemental Figure S20). In addition, these subcellular compartments displayed unique Ca2+ signatures in all of the cells observed. The PM-anchored GCaMP6f reported a significantly lower amplitude and shorter duration of Ca2+ peaks compared with the nuclear targeted GCaMP6f, but the cytosolic Ca2+ peaks have the longest duration than the other two compartments (Figure 7D). The distinct Ca2+ signatures in the above compartments illustrate the necessity of understanding the Ca2+ dynamics in various subcellular compartments when studying the cellular responses to various stresses.
Discussion
In response to a given environmental and/or developmental signal, a specific spatiotemporal Ca2+ signature is produced thereby providing the specificity of calcium signaling. The generation of a unique Ca2+ signature typically involves calcium uptakes and releases from multiple subcellular compartments. Therefore, it is essential to visualize Ca2+ dynamics in the subcellular compartments simultaneously and within the same cell. In this study, we reported the generation of a toolset, the CamelliA lines, for simultaneously imaging the Ca2+ dynamics in multiple subcellular compartments. We first validated the functionality of the Ca2+ sensors in our CamelliA lines by using the same well-studied extracellular stimuli and comparing their performance with previously well-established sensors. We also assessed the effects of the pH fluctuations on the performance of our sensor lines. Lastly, we demonstrated the power of our CamelliA lines for visualizing the Ca2+ dynamics with high spatiotemporal subcellular resolution in the three most popular cell models in response to environmental stresses and developmental signals, enabling us to uncover several unrecognized Ca2+ signatures, such as rapid oscillations of cytosolic Ca2+ and apical PM Ca2+ influx in fast-growing Arabidopsis pollen tubes, the spatiotemporal relationship of Ca2+ dynamics in four subcellular compartments of root epidermal cells challenged with salt, and a shockwave-like Ca2+ wave propagating in laser-wounded leaf epidermis. As such, this toolset will serve as a crucial asset for dissecting Ca2+-mediated signaling pathways during stress responses and developmental processes where the Ca2+ homeostasis is actively maintained by regulated Ca2+ fluxes across multiple subcellular compartments.
Advantages and consideration of the CamelliA Ca2+ sensor toolset
Our toolset offers several key advantages for Ca2+ imaging:
Simultaneous imaging of Ca2+ dynamics in multiple subcellular compartments
We demonstrated multiplexed imaging of the Ca2+ dynamics in the cytosol, the nuclei, the sub-PM region, and the ER in several types of cells (Figures 5–7). Although simultaneous imaging of nuclear and cytosolic Ca2+ dynamics in plant cells has been reported (Kelner et al., 2018; Luo et al., 2020; Resentini et al., 2021), our toolset has greatly expanded the choices of GECIs with different colors and targeted various compartments.
Improved spatiotemporal resolution
Single-colored GECIs have a higher dynamic range than that of ratiometric GECIs (Supplemental Table S1). Less pixel dwell time during confocal imaging is needed to acquire images with a better or equivalent signal-to-noise ratio compared with ratiometric GECIs, providing increased temporal resolution. What is more, the fluorescence decay of GCaMP3 after dissociation with Ca2+ is much faster than that of two FRET-based GECIs, TN-XXL, and D3cpV (Tian et al., 2009). GCaMP6f and jRGECO1a that are used in our toolset have even faster kinetics than that of GCaMP3 (Supplemental Table S1). Therefore, GCaMP6f- and jRGECO1a-based sensors in the CamelliA lines are well-suited for resolving temporal details of Ca2+ signatures such as fast cytosolic Ca2+ oscillations within 5 s in Arabidopsis pollen tubes, the most rapid Ca2+ oscillations in plants to date (Figure 5). In addition, the ratio images generated by some ratiometric GECIs, such as YC3.6, are noisy. For example, the imaging of the PM Ca2+ dynamics with the PM anchored YC3.6 reported noisy Ca2+ fluctuations post ATP treatment (Krebs et al., 2012). Our PM-anchored GECIs, instead, have visualized Ca2+ influx through PM with minimal noise and a high spatiotemporal resolution (Figures 3G, 5F, 6, and 7 and Supplemental Figure S9I). Consequently, we uncovered a shock wave-like propagation of Ca2+ wave in several subcellular compartments in leaf epidermis after wounding (Figure 7), which was not possible with either YC3.6 (Beneloujaephajri et al., 2013) or aequorin (Kiep et al., 2015).
When using our toolset, one should also consider potential limitations such as determination of absolute Ca2+ levels and pH sensitivity and photo-stability for some probes. Absolute quantification of Ca2+ concentrations with our toolset is more cumbersome than ratiometric Ca2+ sensors and aequorin-based sensors, as the fluorescence intensity of CamelliA sensors depends on the concentration of both Ca2+ and Ca2+ sensors. Absolute quantification of Ca2+ concentration will require calibration for each type of tissue or cell to offset the fluorescence variations resulting from different concentrations of the sensors.
The artificial increase of pH from 6.8 to 8.0 almost doubled the fluorescence intensity of R-GECO1 independent of Ca2+ (Keinath et al., 2015). Whereas in planta observations showed unnoticeable impacts of the pH fluctuations on the reported Ca2+ dynamics (except for the CamelliA_ErG line) (Figures 3 and 4 and Supplemental Figures S9 and S12). This may be in part due to less drastic fluctuations of pH within the physiological range as compared with manipulated pH from 6.8 to 8.0 (Keinath et al., 2015; Behera et al., 2018). Compared with previous GECIs, such as the popular R-GECO1 and GCaMP3, the GECIs in our toolset have lower pKa (Supplemental Table S1), which makes them less vulnerable to pH fluctuations. Nevertheless, it is often left for others to check pH fluctuations independently when using our sensors.
In addition, B-GECO1 is poorly photostable, which limits the duration of imaging experiments when using B-GECO1 based sensor lines. Lastly, the dual and triple sensor lines are generated by crossing, and thus the generation of dual and triple sensor lines in mutant backgrounds would require more efforts of genotyping to identify homozygous lines.
Our CamelliA lines reveal unrecognized characteristics of stimuli-induced Ca2+ signatures
Our toolset uncovered several unrecognized features of plant Ca2+ signatures. First, we discovered fast oscillations of cytosolic Ca2+ and Ca2+ influx at the apical PM in fast-growing Arabidopsis pollen tubes. Previous studies failed to reveal these oscillations due to limited temporal resolution (2–5 s/frame) (Iwano et al., 2009; Damineli et al., 2017; Diao et al., 2018). Using the PM-anchored Ca2+ sensors in the CamelliA_PmG/R lines, we mapped the spatiotemporal pattern of the Ca2+ influx across the apical PM of pollen tubes (Figure 5, F and G). Cross-correlation analysis shows Ca2+ influxes slightly but notably led cytosolic Ca2+ oscillations, implying that the PM Ca2+ influx drives the cytosolic Ca2+ oscillations (Figure 5, K–M). In contrast, Ca2+ specific vibration probes reported presumed Ca2+ influxes lagging behind the cytosolic Ca2+ oscillations (Holdaway-Clarke et al., 1997; Messerli et al., 1999). The vibration electrode cannot distinguish actual Ca2+ influx via the PM from the Ca2+ absorbed by the cell wall. Our PM-anchored Ca2+ sensors are ideal for visualizing the Ca2+ influx from the apoplast to the cytosol.
We also uncovered Ca2+ dynamics at sub-second temporal resolution in four subcellular compartments in salt-stressed root epidermal cells and the spatiotemporal relationship of Ca2+ fluxes among these compartments. No significant difference was observed in the onset time for the increase in the PM Ca2+ influx and cytosolic Ca2+ level, which was followed by a delayed elevation of the nuclear Ca2+ after salt treatment (Figure 6, A–D). These results imply that the nuclear Ca2+ elevation may be a passive result due to the cytosolic Ca2+ increase in response to the salt treatment. Interestingly, the onset time of ER Ca2+ increase was also delayed compared to the PM Ca2+ influx (Figure 6, E–H), similar to a recent observation of the delayed ER Ca2+ uptake compared with the increase in cytosolic Ca2+ levels in root cells post ATP or NAA treatment (Resentini et al., 2021).
Last but not the least, we discovered the propagation of an unrecognized Ca2+ wave in a shock wave-like pattern initiated from the cell that was damaged by laser irradiation of the leaf epidermis (Figure 7). Although wounding is known to trigger cytosolic Ca2+ elevation both locally and systemically (Beneloujaephajri et al., 2013; Kiep et al., 2015; Vincent et al., 2017; Nguyen et al., 2018; Toyota et al., 2018; Marhavy et al., 2019), how wounding-induced Ca2+ propagates among cells remains unknown. Our observation showed that laser irradiation on a single pavement cell triggers both intracellular and intercellular shock wave-like Ca2+ propagation in all three subcellular compartments, hinting that the intercellular Ca2+ propagation is linked to the intracellular Ca2+ shock wave. The Ca2+ wave propagated in the leaf epidermis with a speed of 9.8 ± 3.1 µm/s, which is similar to the speed of Ca2+ wave propagation in nonvascular tissues of osmotic-stressed Physcomitrium patens plantlet (4.5 ± 3.8 µm/s) (Storti et al., 2018), suggesting a potential common mechanism for Ca2+ propagation among non-vascular cells.
We found that the elevation of the cytosolic Ca2+ level preceded that of the PM Ca2+ influx in non-damaged surrounding cells with a more noticeable time difference in cells further away from the damaged cell (Figure 7, B, C, and E and Supplemental Figure S20). Although differences in the properties of the reporters in different subcellular localizations could not be excluded, this suggests a contribution from internal Ca2+ storage to the cytosolic Ca2+ elevation in addition to and faster than PM Ca2+ influxes from the apoplast, consistent with the proposal that vacuolar Ca2+ storage contributes to the rapid rise of the cytosolic Ca2+ during the wounding response (Beyhl et al., 2009; Kiep et al., 2015). The nature of the transmitter(s) of the long-range wounding signal triggering Ca2+ release from internal Ca2+ storage is unknown. Ca2+, glutamate, ROS, and electric signals, which propagate in a wave-like form across tissues, have long been proposed to act as long-range transmitting signals in plants (Steinhorst and Kudla, 2013, 2014; Nguyen et al., 2018; Toyota et al., 2018; Farmer et al., 2020). Our toolset provides a powerful means for testing whether any of these systemic signals play a role in the activation of Ca2+ release from internal Ca2+ storage.
Conclusion
In this study, we have assembled a toolset in Arabidopsis, the CamelliA lines, which enables imaging capability to monitor the dynamics of Ca2+ signature simultaneously and with high spatiotemporal resolution in multiple subcellular compartments, including cytosol, sub-PM region, nucleus, ER, and stroma of the chloroplast. Using the toolset, we have identified several previously unrecognized Ca2+ signatures in three types of Arabidopsis cells. As such, this toolset will serve as a crucial asset for elucidating the subcellular sources contributing to the Ca2+ signature during stress responses and developmental processes. Considering the Arabidopsis UBQ10 promoter can drive ubiquitous expression of YC3.6 in rice (Oryza sativa) (Behera et al., 2015), this toolset shall have a broad application in a number of crop plants.
Materials and methods
Plant materials and growth conditions
All Arabidopsis (A. thaliana) lines are in Col-0 grown under a 16-h-light (22°C) and 8-h-dark (19°C) regime. Seedlings were grown on 0.5 Murashige and Skoog (MS) solid medium (pH = 5.7) supplemented with 1% (w/v) sucrose. The seedlings were grown either vertically for 5–6 d to produce roots, or horizontally for 14 d to produce true leaves for Ca2+ imaging.
Chemicals
Stock solutions of chemicals were prepared as followed: ATP (Sigma-Aldrich, St. Louis, MO, USA), FM4-64 (Thermo Fisher, Waltham, MA, USA), and DAPI (Sigma-Aldrich) were dissolved in water to a concentration of 500 mM, 2 mM, and 10 mg/mL, respectively. Solution of 1 mg/mL PI was purchased from Thermo Fisher.
Generation of the CamelliA lines
The supplemental information details the generation of the CamelliA constructs (Supplemental Method S3 and Supplemental Tables S3 and S4), the transformation and screening of the transgenic lines (Supplemental Method S4).
Ca2+ imaging
The wavelengths for the GECI excitation and emission are listed in Supplemental Table S5. Pollen tubes were germinated, mounted, and observed as described (Guo and Yang, 2020). Ca2+ imaging in root epidermal cells was performed as described (Behera et al., 2015). A “top-imaging” setup (Keinath et al., 2015) was used to image the Ca2+ dynamics in cotyledons and true leaves. Detailed imaging setups are described in Supplemental Method S2.
Visualization of various subcellular compartments for colocalization analysis
The nuclei were stained with 10 µg/mL PI or DAPI in a solution of 0.05% (v/v) Tween 20, 1% (v/v) DMSO, 2 mM CaCl2 for 1 h before observation. PM was stained with 2 µM FM4–64 in MS liquid medium on ice for 5 min and observed immediately. ER marker (ER-ck) (Nelson et al., 2007) was crossed into CamelliA_ErR line for examining their colocalization.
Image analyses
All acquired images were denoised by applying a Gaussian filter (radius = 1) before image analyses. Kymographs of cytosolic GECIs in pollen tubes were generated in Fiji using multi kymograph function. Fluorescence intensity of cytosolic and sub-PM GECIs, kymographs of sub-PM GECIs in pollen tubes were analyzed and generated by TipQAD algorithm (Tambo et al., 2020) in MATLAB (R2018a). The temporal relationship between oscillations of the PM Ca2+ influx and the cytosolic Ca2+ was analyzed using sample cross-correlation function in MATLAB. Frequency of the cytosolic Ca2+ oscillations was analyzed using SpectralAnalysis code (Uhlen, 2004). Time-series images of root and leaf cells were aligned using StackReg plugin in Fiji (Thevenaz et al., 1998). Regions of subcellular compartments (marked in each corresponding figure) were selected using Polygon selections tool, and fluorescence intensity-versus-time data were acquired using Plot Z-axis Profile function in Fiji. Before treatments with ATP, H2O2, or salt, the resting level of Ca2+ in root or leaf samples was imaged for ∼120 s at sub-second frame rates and plotted as part of the intensity versus time plot. Fluorescence changes (dF/F0) of the GECIs in roots and leaves was calculated using the equation of dF/F0 = (Ft – F0)/F0, where Ft is the fluorescence intensity of the GECIs at a given time point (frame) and F0 is the mean fluorescence intensity of the GECIs in all frames when the cells are at resting state. Ratio (between the GCaMP6f intensity and chloroplast autofluorescence) changes (dR/R0) of individual chloroplast in H2O2 treated leaves was calculated using the equation of dR/R0 = (Rt – R0)/R0, where Rt is the ratio of the measured chloroplast at a given time point (frame) and R0 is the mean ratio of the chloroplast in all frames of the resting state. Signal amplitude and duration (as FWHM of signal peaks) were analyzed in OriginPro2021b using Quick Peaks function. The onset of signal is defined by the earliest frame in which the fluorescence intensity of the ROI is higher than mean fluorescence intensity + 3× SD of the same ROI in all frames acquired prior to any treatments, with the exception that the threshold of signal onset in sub-PM region is defined as mean fluorescence intensity + 6× SD so that the signal onset matches with the observed signal. All numerical data were plotted in GraphPad Prism, all figures were assembled in CorelDRAW and Microsoft PowerPoint.
Statistical analyses
Differences in signal amplitude, duration, and time to signal onset in various subcellular compartments were tested using one-way repeated measures ANOVA test or paired t test. The mean and 95% confidence interval or SD of all intensity/ratio vs time data from 5 to 8 individual cells were plotted in GraphPad Prism. All data shown are presentative data from at least three biological repeats. The exact number of the cells and biological repeats for analyses is indicated in the legends of corresponding figures.
Accession numbers
Sequence data from the genes mentioned in this article can be found in the Arabidopsis Genome Initiative under the following accession numbers: CALRETICULIN 1A, AT1G56340; LTI6B, AT3G05890; UBQ10, AT4G05320; BAM4, AT5G55700.
Supplemental data
The following materials are available in the online version of this article.
Supplemental Figure S1. Selection procedures of the CamelliA lines.
Supplemental Figure S2. High expression of the GECIs has adverse impacts on the growth of the CamelliA lines.
Supplemental Figure S3. Screening of the T1 transgenic plants by examining the growth of in vitro or semi-in vivo pollen tubes.
Supplemental Figure S4. Growth phenotypes of the final CamelliA lines that qualify the selection criteria.
Supplemental Figure S5. Growth phenotypes of the CamelliA_PmR line and several homozygous dual and triple Ca2+ sensor lines.
Supplemental Figure S6. Growth phenotypes of heterozygous and homozygous CamelliA_NucB lines.
Supplemental Figure S7. Growth phenotypes of the homozygous CamelliA_ChlG lines.
Supplemental Figure S8. Subcellular localization of the GECIs in the CamelliA lines.
Supplemental Figure S9. Ca2+ signatures at a high spatiotemporal resolution post ATP- or mock treatment of other CamelliA lines.
Supplemental Figure S10. Ca2+ imaging at a high spatiotemporal resolution using other three CamelliA lines in fast-growing Arabidopsis pollen tubes also reveals fast and regular cytosolic Ca2+ oscillations and the pattern of Ca2+ influx on the apical PM.
Supplemental Figure S11. Ca2+ imaging at a high temporal resolution using YC3.6 in fast-growing Arabidopsis pollen tubes reveals fast and regular cytosolic Ca2+ oscillations.
Supplemental Figure S12. Simultaneous visualization of pH fluctuations and Ca2+ oscillations in the same pollen tube.
Supplemental Figure S13. Dual imaging of the Ca2+ dynamics using both YC3.6 and CamelliA_CytR line in the same fast-growing pollen tube.
Supplemental Figure S14. Dual imaging of the Ca2+ dynamics using both YC3.6 and CamelliA_CytR line in the same slow-growing pollen tube.
Supplemental Figure S15. Kymographs of CamelliA_PmG and CamelliA_PmR in slow-growing pollen tubes.
Supplemental Figure S16. Dual imaging of PM Ca2+ influx and cytosolic Ca2+ dynamics in the same pollen tube.
Supplemental Figure S17. Propagation of a Ca2+ wave alongside the PM of the root epidermal cells challenged with salt.
Supplemental Figure S18. Visualization of the Ca2+ signatures in response to mock treatment in four subcellular compartments of the root epidermal cells.
Supplemental Figure S19. Laser irradiation induced leakage of PI into the irradiated cells.
Supplemental Figure S20. Quantitative analyses of signal onset time and distance between measured cells to the wounding site in two additional leaf samples.
Supplemental Table S1. Summary of the properties of the GECIs used in plants.
Supplemental Table S2. Summary of the Kd of the GECIs used in CamelliA toolset and Ca2+ levels reported in the five subcellular compartments.
Supplemental Table S3. Details of the CamelliA constructs.
Supplemental Table S4. List of primers.
Supplemental Table S5. Wavelengths for GECIs and pHluorin2 excitation and emission.
Supplemental Method S1. Selection of the CamelliA lines.
Supplemental Method S2. Ca2+ imaging.
Supplemental Method S3. Generation of the CamelliA constructs.
Supplemental Method S4. Plant transformation and screening.
Supplemental Movie S1. Cytosolic Ca2+ oscillations visualized by CamelliA_CytR sensor in a fast-growing Arabidopsis pollen tube.
Supplemental Movie S2. Oscillations of Ca2+ influx across the apical PM visualized by CamelliA_PmG in a fast-growing Arabidopsis pollen tube.
Supplemental Movie S3. High spatiotemporal resolution imaging of sub-PM, cytosolic, and nuclear Ca2+ dynamics in root epidermal cells post salt treatments.
Supplemental Movie S4. High spatiotemporal resolution imaging of sub-PM and ER Ca2+ dynamics in root epidermal cells post salt treatments.
Supplemental Movie S5. Ca2+ dynamics at subcellular resolution in the sub-PM region, the cytosol, and the nucleus after wounding.
J.G. and Z.Y. designed the research. J.G. and J.H. conducted the experiments. J.G. wrote the original draft. Z.Y., X.C., and K.D. supervised the research and revised the manuscript. All authors have read and approved the manuscript.
The author responsible for distribution of materials integral to the findings presented in this article in accordance with the policy described in the Instructions for Authors (https://dbpia.nl.go.kr/plphys/pages/General-Instructions) is Zhenbiao Yang ([email protected]).
Acknowledgments
We thank members of the Yang laboratory for critical comments on this work. Plasmid CMV-B-GECO1 is a gift from Dr. Robert Campbell (Addgene plasmid #32448); plasmids pGP-CMV-GCaMP6f and pGP-CMV-NES-jRGECO1a are gifts from Dr. Douglas Kim (Addgene plasmid #40755 and #61563); plasmids pCMV-G-CEPIA1er and pCMV-R-CEPIA1er are gifts from Dr. Masamitsu Iino (Addgene plasmid # 58215 and # 58216); and plasmid pME-pHluorin2 is a gift from Dr. David Raible (Addgene plasmid #73794).
Funding
This work is partly supported by a National Science Foundation (1853698) grant awarded to X.C. and Z.Y. and by a National Institute of Health (R01GM107311-8) grant awarded to K.D.
Conflict of interest statement. None declared.
References
Author notes
Senior author
