


Abstract
Primary thickening determines bamboo yield and wood property. However, little is known about the regulatory networks involved in this process. This study identified a total of 58,652 genes and 150 miRNAs via transcriptome and small RNA sequencing using the underground thickening shoot samples of wild-type (WT) Moso bamboo (Phyllostachys edulis) and a thick wall (TW) variant (P. edulis “Pachyloen”) at five developmental stages (WTS1/TWS1-WTS5/TWS5). A total of 14,029 (65.17%) differentially expressed genes and 68 (45.33%) differentially expressed miRNAs were identified from the WT, TW, and WTTW groups. The first two groups were composed of four pairwise combinations, each between two successive stages (WTS2/TWS2_versus_WTS1/TWS1, WTS3/TWS3_versus_WTS2/TWS2, WTS4/TWS4_versus_WTS3/TWS3, and WTS5/TWS5_versus_WTS4/TWS4), and the WTTW group was composed of five combinations, each between two relative stages (TWS1–5_versus_WTS1–5). Additionally, among the phytohormones, zeatin showed more remarkable changes in concentrations than indole-3-acetic acid, gibberellic acid, and abscisic acid throughout the five stages in the WT and the TW groups. Moreover, 125 cleavage sites were identified for 387 miRNA–mRNA pairs via degradome sequencing (P < 0.05). The dual-luciferase reporter assay confirmed that 13 miRNAs bound to 12 targets. Fluorescence in situ hybridization localized miR166 and miR160 in the shoot apical meristem and the procambium of Moso bamboo shoots at the S1 stage. Thus, primary thickening is a complex process regulated by miRNA–gene–phytohormone networks, and the miRNAome and transcriptome dynamics regulate phenotypic plasticity. These findings provide insights into the molecular mechanisms underlying wood formation and properties and propose targets for bamboo breeding.
Introduction
Bamboo plants are major wood resources, which belong to the Bambusoideae subfamily of the Poaceae grass family. They are characterized by rapid growth and excellent wood quality like perennial woody dicots and have well-developed rhizomes, with buds at the nodes that develop into aboveground hollow culms. However, the culms do not show secondary growth due to the lack of interfascicular cambium. Interestingly, the shoots of Moso bamboo (Phyllostachys edulis (Carr.) H. de Lehaie), an economically important species known for its taste and nutritional value, exhibit underground primary thickening during which the bud gradually develops into a mature shoot. Subsequently, the mature shoot grows fast, with the elongation of aboveground internodes maintaining a constant node number and coarseness. Primary thickening largely determines the morphological features and the anatomical characteristics of bamboo mature culms. Therefore, a better understanding of the molecular regulation of the primary growth is essential for improving bamboo biomass and wood property and the shoots edible value.
Shoot apical meristem (SAM) maintenance and organogenesis are responsible for primary thickening, accompanied by various physiological and biochemical changes, including carbohydrate metabolism and energy transformation. Wei et al. (2017) identified many genes involved in plant hormone signal transduction and cell wall development in bamboo shoots. Genes related to programmed cell death, ethylene and calcium signaling pathways, protein hydrolysis, and nutrient cycle have also been identified in Pseudosasa japonica (Guo et al., 2018). Meanwhile, Li et al. (2018) detected changes in hormone pathways in the SAM during rapid aboveground internode elongation in Moso bamboo. Recently, Wang et al. (2021) identified miRNAs in the aboveground internodes of Moso bamboo’s mature culms, suggesting their role in rapid internode elongation. Although bamboo research has gradually progressed, studies are limited to functional genes identification.
In plants, miRNAs guide the Argonaute (AGO)-centered RNA-induced silencing complexes to target genes (Rodriguez et al., 2016). For example, miR165 and miR166 target the homeodomain-leucine zipper (HD-ZIP) transcription factor (TF) family to regulate meristem development and organ polarity (Byrne, 2006; Zhou et al., 2007). Further studies established that ARGONAUTE10 inhibits miR165/166 activity, leading to a localized enrichment of HD-ZIP transcripts for programming SAM from the developing embryos to the entire adaxial domain and vasculature of cotyledons and new leaf primordia (Zhang and Zhang, 2012; Zhou et al., 2015). Meanwhile, expression profile analysis in soybean identified the putative role of miRNA166 and miRNA390 in SAM and bud development (Wong et al., 2011). Researchers have also identified miRNAs in bamboo, especially in aboveground parts, such as flowers (Ge et al., 2017). However, little is known on the role of miRNAs and the regulatory network in the primary thickening bamboo shoots.
The miRNAs are relatively conservative, while a few demonstrate species-specific regulatory effects and mechanisms. For example, in Arabidopsis thaliana, miR156 targets specific members of the SQUAMOSA promoter binding protein-like (SPL14) TF family, promoting the transition from vegetative to reproductive phase (Wu and Poethig, 2006). In rice (Oryza sativa), miR156 affected tillering by regulating OsSPL14 expression (Luo et al., 2012). Furthermore, changes in the expression levels of miRNAs of the same family have been observed in plants of the same family and genus, indicating differences in regulatory effects. The response patterns of miRNAs in Euphorbiaceae plants under abiotic stress showed their species- and stress-specific functions (Zeng et al., 2010). D’Ario et al. (2017) suggested the role of miRNAs in establishing plant cell identity and creating diverse plant organ forms and shapes during plant evolution. Therefore, identifying the conserved and novel miRNAs will provide insights into the molecular mechanism underlying primary thickening and morphological diversity in bamboo.
The thick wall (TW) stable Moso bamboo variant (P. edulis “Pachyloen”) (Yang et al., 1997) has a narrow pith cavity, increased vascular bundles, and a fasciated culm (Guo, 2003; Guo et al., 2005). However, the molecular mechanism underlying the peculiar phenotype remains unclear. This study aimed to (1) detect the key miRNAs and/or regulatory genes and delineate the interplay and (2) discover differences in transcriptome and miRNAome between the wild-type (WT) and the TW variant and assess their roles in promoting morphological novelty. A comprehensive and integrated analysis was performed using thickening bamboo shoots at five different stages collected from the WT Moso bamboo and the TW variant (Figure 1). The study’s findings will provide new insights into the regulatory components and transcriptome dynamics during primary thickening and propose candidates for biomass and wood property improvement in bamboo.
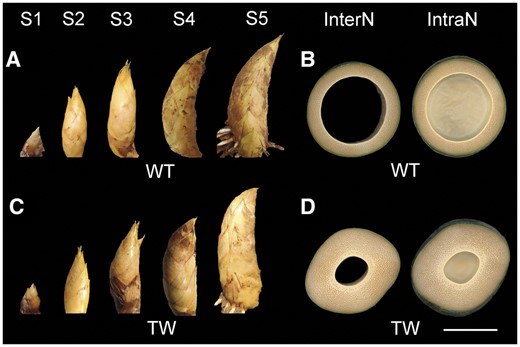
Underground shoots and aboveground mature culms of the WT Moso bamboo and the TW variant. Underground shoots collected at five different stages (S1–S5), and cross-sections of the third internode and intranode of the equal-diameter aboveground mature culms of the WT Moso bamboo (A and B) and the TW variant (C and D). Bamboo shoots collected at different stages from rhizomes, the internode, and intranode of aboveground mature culms were imaged successively. The images were then digitally extracted for comparison. InterN = internode, IntraN = Intranode. Scale bar is 10 cm and applies to all panels.
Results
Transcriptome sequencing identified 7,716 novel genes
Transcriptome sequencing of ten samples, including the WT and the TW variant at five developmental stages (WT1–WT5 and TW1–TW5), generated a total of 221.76 Gb high-quality reads (Q30 > 92.98%), with at least 20.08 Gb from each sample. The reads were uniquely aligned with the Moso bamboo reference genome version 2.0 (Zhao et al., 2018) at an efficiency ranging from 91.20% to 92.10% (Table 1). The reference-guided assembly of the mapped reads using the Cufflinks/Cuffmerge pipeline identified a total of 58,652 genes, of which 7,716 (13.16%) were novel ones. A total of 21,527 genes were expressed (fragments per kilobase of transcript per million fragments mapped [FPKM] > 1) in at least one of the samples.
Summary of transcriptome and small RNA sequencing data generated for 10 samples
| Sample | Transcriptome sequencing | Small RNA sequencing | ||||||
|---|---|---|---|---|---|---|---|---|
| No. of Clean Reads (Single-Ended)a | %≥Q30 (%)a | No. of Uniquely Mapped Reads (%)a | No. of Clean Reads (%)a | Q30 (%)a | GC Contenta | No. of Mapped Reads (%)a | ||
| TW1 | 47,071,280 | 93.10 | 43,159,815 (91.69) | 14,258,388 | 98.70 | 53.67 | 13,373,295 (94.16) | |
| TW2 | 46,796,490 | 93.86 | 42,676,424 (91.20) | 16,682,323 | 98.77 | 51.97 | 14,988,810 (89.84) | |
| TW3 | 46,840,642 | 93.21 | 42,721,327 (91.21) | 16,152,370 | 98.82 | 50.78 | 14,812,891 (91.62) | |
| TW4 | 45,790,175 | 93.48 | 41,957,415 (91.63) | 18,810,718 | 98.49 | 51.58 | 17,531,436 (93.16) | |
| TW5 | 55,625,429 | 93.45 | 50,904,317 (91.51) | 12,188,776 | 98.68 | 51.06 | 11,218,089 (92.05) | |
| WT1 | 47,071,280 | 92.98 | 43,159,815 (91.69) | 14,246,667 | 99.03 | 52.88 | 12,733,649 (89.33) | |
| WT2 | 52,094,893 | 93.22 | 47,622,133 (91.41) | 16,503,209 | 99.09 | 52.09 | 15,428,718 (93.46) | |
| WT3 | 49,691,665 | 93.36 | 45,540,641 (91.64) | 12,377,684 | 99.06 | 51.94 | 10,492,138 (85.29) | |
| WT4 | 44,787,988 | 93.65 | 41,133,288 (91.84) | 12,132,066 | 98.62 | 51.80 | 10712191 (88.23) | |
| WT5 | 55,792,031 | 93.63 | 51,386,324 (92.10) | 15,737,567 | 98.90 | 52.34 | 14,710,592 (94.00) | |
Average of data collected from three biological replications.
Mapped reads, Reads that were uniquely mapped onto the Moso bamboo reference genome.
Genotype- and/or stage-specific expression of genes
Furthermore, the differentially expressed genes (DEGs) were identified from 13 pairwise combinations of the WT, TW, and WTTW groups. The first two groups were composed of four pairwise combinations each between two successive stages (WTS2/TWS2_versus_WTS1/TWS1, WTS3/TWS3_versus_WTS2/TWS2, WTS4/TWS4_versus_WTS3/TWS3, and WTS5/TWS5_versus_WTS4/TWS4), and the WTTW group was composed of five between two relative stages (TWS1–5_versus_WTS1–5). A total of 14,029 (65.17%) DEGs (FPKM > 1 in either of two pairwise combination samples, false discovery rate (FDR) < 0.01, and |log2(FC)| ≥ 1) were identified from the 13 pairwise combinations, with the number ranging from 69 in S5_versus_S4 of the WT group to 8,167 in S2_versus_S1 of the TW group (Figure 2A).
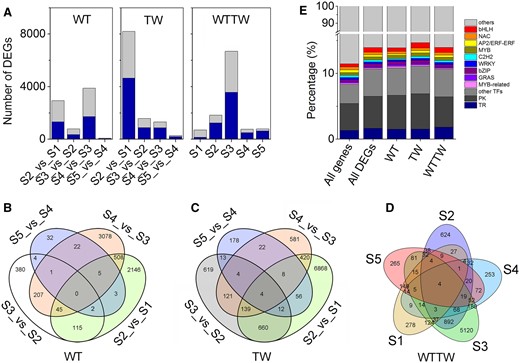
DEGs identified from 13 pairwise combinations of the WT, TW, and WTTW groups. Both the WT and the TW groups were composed of four pairwise combinations between two successive stages (WTS2/TWS2_versus_WTS1/TWS1, WTS3/TWS3_versus_WTS2/TWS2, WTS4/TWS4_versus_WTS3/TWS3, and WTS5/TWS5_versus_WTS4/TWS4), and the WTTW group was composed of five pairwise combinations between two relative stages (TWS1–5_versus_WTS1–5). A, DEGs ranged from 69 in S5_versus_S4 of the WT group to 8,167 in S2_versus_S1 of the TW group, with the upregulated (light gray) and downregulated (dark blue) genes almost equally representing few pairwise combinations. B–D, A total of 5,636, 8,246, and 6,540 DEGs showed stage- and/or genotype-specific differential expression in the WT (B), TW (C), and WTTW (D) groups. E, The percentage of differentially expressed TF, PK, and TR genes among the total genes identified, total DEGs, and DEGs in the WT, TW, and WTTW groups.
The TW group had the maximum DEGs (9,954), followed by the WTTW group (8,445), while the WT group had the minimum (6,585). Interestingly, S2_versus_S1 had the maximum DEGs for the TW (8,167) group, while S4_versus_S3 and S2_versus_S1 both had more DEGs (2,824 and 3,866) than the other pairwise combinations in the WT group. In the WTTW group, the maximum DEGs were identified at S3 (6,650).
Furthermore, these observations indicate the genotype- and/or stage-specific differential expression of genes. About 5,636 (85.59%) and 8,246 (82.84%) DEGs showed stage-specific differential expression in the WT and TW groups, respectively, while 6,540 (77.44%) exhibited genotype-specific differential expression in the WTTW group (Figure 2, B–D). Meanwhile, four DEGs were found in all pairwise combinations of both the TW and the WTTW groups, and none in the WT group.
DEGs of different pairwise combinations shared the gene ontology (GO) terms
A total of 4,754 (72.19%), 7,018 (70.50%), and 5,998 (71.02%) DEGs were assigned GO terms in WT, TW, and WTTW groups, respectively. As shown in Supplemental Figure S1A and Supplemental Table S1, DEGs identified from different pairwise combinations shared several GO terms under the biological process category, including “DNA replication initiation (GO:0006270),” “regulation of transcription, DNA-templated (GO:0006355),” “carbohydrate metabolic process (GO:0005975),” and “microtubule-based movement (GO:0007018)” (q-value < 0.05). The kyoto encyclopedia of genes and genomes (KEGG) analysis indicated that DEGs enriched in various pathways in WT, TW, and WTTW groups, respectively; plant hormone signal transduction (ko04075) and DNA replication (ko03030) were the shared pathways among these three groups (q-value < 0.05; Supplemental Figure S1B).
Several genes encoding TFs showed differential expression
In this study, a total of 3,543 genes, including 3,496 known and 47 novel genes encoding TFs belonging to 66 families, were identified. The maximum TF families included basic helix–loop–helix (bHLH): 270, 7.62%, No apical meristem, Arabidopsis transcription activation factor1/2, and Cup-shaped cotyledon2 (NAC): 267, 7.54%, APETALA2/Ethylene responsive factor: 246, 6.94%, and MYB v-myb avian myeloblastosis viral oncogene homolog: 242, 6.83%) (Figure 2E). In addition, 2,397 and 780 genes encoding protein kinases (PKs) and transcription regulators (TRs), respectively, were identified. Furthermore, 1,040 (29.35%) TFs, 684 (28.54%) PKs, and 230 (29.49%) TRs showed differential expression between the successive and relative stages of the WT, the TW, and the WTTW groups (Supplemental Table S2).
The differentially expressed TF genes accounted for a more substantial percentage (7.32%) of total DEGs than the PK (4.81%) and TR (1.62%) genes of all DEGs identified, while their proportions were similar in the WT (3.35%, 2.39%, and 0.70%), TW (5.43%, 3.78%, and 1.06%), and WTTW (4.47%, 2.74%, and 1.08%) groups. Besides, the percentage of the nine most abundant TF families was roughly the same in the three groups (Figure 2E).
Profiles of DEGs were similar between WT and TW across five stages, except for S3
Clustering analysis showed that 14,029 DEGs formed 12 clusters, which were divided into three groups: Group I (Clusters I–VII), Group II (Clusters VIII–X), and Group III (Clusters XI–XII), based on the expression patterns under the five stages. Interestingly, DEGs in most groups bend at S3 in the WT group, although their trends were nearly the same (Figure 3, A–D).
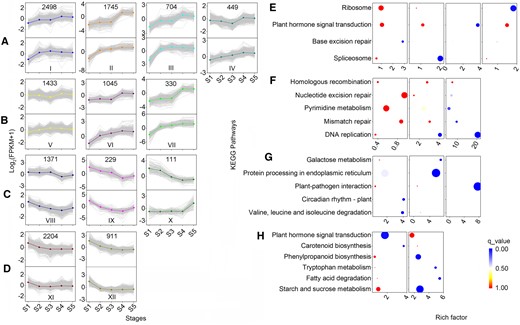
Clustering and KEGG pathway enrichment analysis of DEGs in the WT and the TW groups. Clustering (A–D) and KEGG pathway enrichment (E–H) analysis of DEGs across five unique stages (S1–S5) in the WT (the upper half) and the TW (the second half) groups. The number of genes in each cluster was given in the upper half in Figure 3, A–D. The size of dots in Figure 3, E–H is proportional to the number of genes.
Several GO terms of the DEGs were common among the different clusters (q-value < 0.05, Supplemental Table S3). Clusters III, VI, and VII of the group I shared “microtubule-based movement (GO:0007018)”; clusters VI and VII of the group I shared the maximum significantly enriched GO terms, including “DNA replication (GO:0006260),” “DNA replication initiation (GO:0006270),” “DNA duplex unwinding (GO:0032508),” “carbohydrate metabolic process (GO:0005975),” “chromatin silencing (GO:0006342),” “cell cycle (GO:0007049),” and “cell division (GO:0051301)”; clusters IV and VII of the group I shared “cell wall organization (GO:0071555)”; clusters VII and IX shared “plant-type cell wall organization (GO:0009664)”; clusters VII and X shared “cell wall biogenesis (GO:0042546)”; and “xyloglucan metabolic process (GO:0010411).”
Notably, few significantly enriched KEGG pathways were shared among clusters even in the same group (q-value < 0.05, Figure 3, E–H; Supplemental Table S4). Clusters VI and VII of the group I shared “DNA replication (ko03030)”; clusters III and XI shared “plant hormone signal transduction (ko04075).”
High-throughput small RNA sequencing identified 150 miRNAs
Sequencing of 30 small RNA libraries generated a total of 451.77 million clean reads after filtering and trimming, with no less than 10.98 million reads from each sample. A total of 150 miRNAs, including 86 (57.33%) known and 64 (42.67%) novel miRNAs, were identified, of which 107 belonged to 32 conserved families. The MIR167_1 family, including 10 members, was the largest, followed by MIR164 (9), MIR166 (9), and MIR171_1 (7) families (Supplemental Table S5-1). The length of the miRNAs identified ranged from 18 to 24 nt, and the 21 nt (76.00%) miRNAs were found in the highest proportion (Figure 4A). Among either the known or novel miRNAs, 21 nt long ones accounted for the most substantial proportion (74.42% and 78.13%), and a majority (56.25% and 74.00%) were characterized by a 5′-uridine residue at the first base (Figure 4B). The average GC content of the miRNAs was 52.56%.
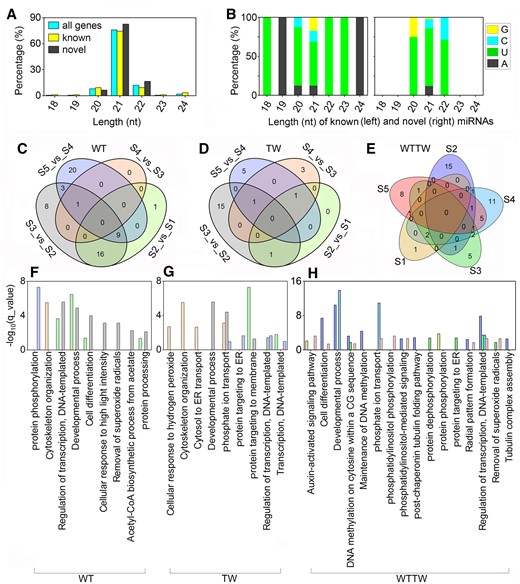
Known and novel miRNAs identified via small RNA sequencing using the underground thickening shoot samples of WT Moso bamboo (P. edulis) and a TW variant (P. edulis “Pachyloen”). A and B, Length and base bias of the miRNAs. C–E, Venn diagram of DEmiRs of the WT (C), TW (D), and WTTW groups (E). F–H, KEGG pathway analysis of DEmiRs identified from the different combinations of the WT (F), TW (G), and WTTW (H) groups.
A total of 15,638 target genes were predicted for all 150 miRNAs (Supplemental Table S5-1); among them, 150 miRNAs and 1,320 predicted TF targets composed 3,394 miRNA-TF pairs (Supplemental Table S5-2). The family MIR156 was engaged with most pairs (168), followed by MIR167_1 (155), and MIR396 (135).
Nearly half of miRNAs were differentially expressed
A total of 140 (93.33%) and 148 (98.67%) miRNAs were expressed (tags per million reads [TPM] > 1) in at least one of the samples from the WT and TW groups, respectively; while 100 (67.33%) and 102 (68.00%) miRNAs were expressed throughout the five stages. Specifically, 10 miRNAs, including 3 MIR166 family members, 2 MIR159 family members, a MIR162_2 family member, and 4 novel members, were highly expressed (TPM > 10,000) throughout all stages in the WT and TW libraries (Supplemental Table S5-1).
Detailed analysis revealed that a total of 68 (45.33%) miRNAs were differentially expressed (TPM > 1 in either of two pairwise combination samples, FDR < 0.05, and |log2(FC)| ≥ 1) among 13 pairwise combinations; 58, 26, and 55 miRNAs showed differential expression in the WT, TW, and WTTW groups, respectively. Among them, 29 and 23 showed stage-specific differential expression in the WT and TW groups, respectively, and 40 showed genotype- and stage-specific differential expression in the WTTW group (Figure 4, C–E). The enrichment analysis found shared GO terms in the WT, TW, and WTTW groups (Figure 4, F–H).
Notably, targets of differentially expressed miRNAs (DEmiRs) from the WT and the TW groups were significantly enriched in “cell differentiation,” “developmental process,” and “cytoskeleton organization”; while those from the WTTW group were also significantly enriched GO terms related to DNA methylation and protein phosphorylation.
Most coherently expressed DEmiRs and their predicted targets were primarily identified between the stages of WTS1–S3/TWS1–S3
Further, the correlation between DEmiRs and DEGs was analyzed. A total of 1,276 distinct miRNA–mRNA interaction pairs, including 685 in the WTTW group, 414 in the WT group, and 177 in the TW group (Supplemental Table S6), were identified; the majority (1,068, 83.70%) were found in the five dominant combinations, namely TWS3_versus_WTS3 (318), WT2_versus_WTS1 (301), TWS2_versus_WTS2 (226), TWS3_versus_TWS2 (122), and WTS3_versus_WTS2 (101). Further analyses were carried out to identify whether these interactions were either coherent (the expression level of target mRNA is more when that of miRNA is less; the “DU” and “UD” patterns) or noncoherent (miRNA and its target mRNA have similar expression profiles).
Analyses revealed that 553 (out of 1,276) miRNA–mRNA pairs, involving 57 miRNAs and 351 targets, were coherently expressed in at least one of the five dominant pairwise combinations (Supplemental Table S6). Besides, 492 (88.97%) coherent pairs were identified only in specific combinations; the WTTW group was engaged with most pairs (266), followed by the WT group (218). Notably, the miRNAs from the same family were consistently coherent with their corresponding targets. A total of 477 (86.26%) coherently expressed pairs were identified between the stages of WTS1–S3/TWS1–S3; maximum coherent pairs were found in WTS3_versus_TWS3. Additionally, a few pairs showed coherent expression in pairwise combinations between two successive stages. For example, members of MIR159, MIR160, and MIR396 families were coherently expressed with their targets in both WTS2_versus_WTS1 and WTS3_versus_WTS2. Most miRNAs shared targets from several TF families, resulting in a network (Figure 5).
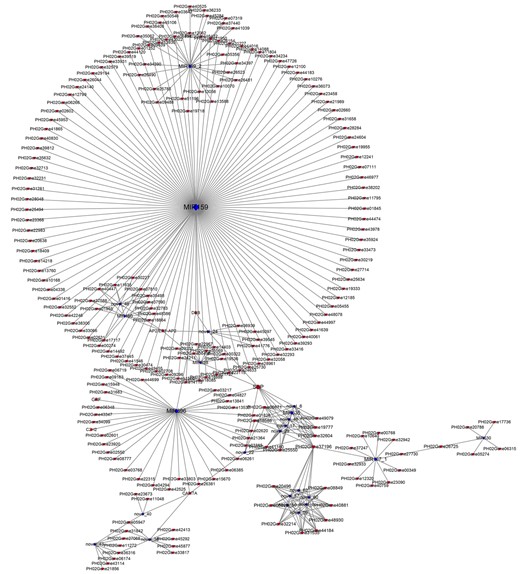
Cytoscape regulatory networks of DEmiRs and their predicted targets of DEGs. Blue graphics represent miRNAs, and red graphics represent genes. The size of dots in the networks was proportional to the number of miRNAs and genes.
Degradome sequencing confirmed 387 miRNA–mRNA pairs
After successive filtering steps, a total of 111.89 M clean tags were generated from two distinct mixed sample pools collected from the WT and TW groups, which were processed to identify the cleavage sites. In total, 125 cleavage sites were identified for 387 miRNA–mRNA pairs, involving 78 miRNAs and 124 targets, and 104 and 113 cleavage sites were identified (P < 0.05) from the WT and TW groups, respectively. A total of 41 miRNA–mRNA pairs were from the 553 coherently expressed pairs.
Notably, PH02Gene00233, an auxin response factor (ARF) 13-like gene, showed two different cleavage sites for MIR160 and MIR530 families in the WT group, while no cleavage site was detected for it in the TW group. The number of miRNA–mRNA pairs of the same miRNA family was different between the groups. For example, 28 and 22 cleavage sites were identified for the MIR159–mRNA pairs in the WT and TW groups, respectively. Interestingly, a few miRNAs and miRNA families showed similarities in cleave sites of targets between two groups. Generally, miRNAs of the same family cleave the same target. For example, PH02Gene00349, which encodes an ARF, had the same cleavage site for seven unique miRNA members of the MIR167-1 family in both the WT and the TW groups (Supplemental Table S7).
ZT showed high concentration changes with stage
The phytohormones showed similarities between the WT and TW groups. Among the four phytohormones analyzed, changes in concentration were the largest for zeatin (ZT) (Figure 6); ZT concentrations showed similar trends throughout the five stages between the WT and the TW groups. Meanwhile, the changes in gibberellic acid (GA3) concentration with stage were the least. At certain stages, ZT and abscisic acid (ABA) concentrations showed opposite trends.
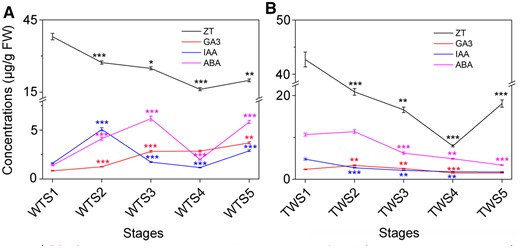
Changes in the concentrations of four phytohormones during five developmental stages in the WT Moso bamboo and the TW variant. A and B, Changes in the concentrations of four phytohormones in the WT (A) and the TW (B) groups. Error bars indicate sd of three technical repeats. Statistical analyses were performed by Student’s t test. *P < 0.05; **P < 0.01; ***P < 0.001.
Additionally, differences in phytohormone concentrations and trends were observed between different developmental stages from the WT and the TW groups. The ZT concentration changes from S1 to S2 were opposite to that of ABA in the TW group, whereas in the WT group the opposite trend in ZT and ABA was observed from S1 to S3; ABA concentrations in TW were generally higher than those in WT. Meanwhile, GA3 concentration increased throughout the stages in WT, while it decreased gradually after reaching the highest level at S2 in TW.
Dual-luciferase reporter assay indicated that 13 miRNAs specifically bind to 12 target genes
In this study, the dual-luciferase reporter assay indicated that 13 miRNAs from six families, specifically bind to 12 target genes (Supplemental Table S8). As shown in Figure 7, A–H, the luciferase activity of the miRNA mimics+mRNA-WT group was lower than that of the NC mimics+mRNA-WT group (P < 0.01) in the transfected cells; however, no significant difference was observed between two mutant (MUT) groups. For example, the dual-luciferase reporter assay confirmed that miR166 binds to PeHOX32 (Figure 7C).
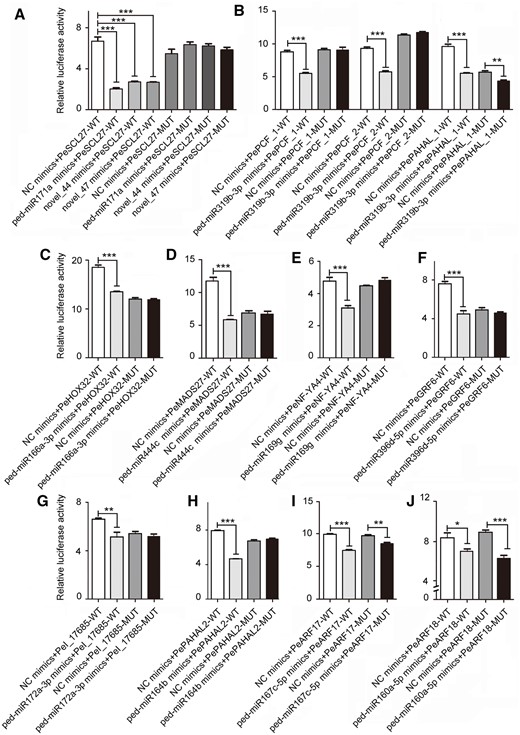
Verification of the correlation between 13 miRNAs and 12 target genes using a dual-luciferase reporter assay. A–H, The luciferase activity of the miRNA mimics + mRNA-WT group was lower than that of the NC mimics + mRNA-WT group (P < 0.01), while no significant difference was observed between two MUT groups. I and J, Significant difference of the luciferase activity was also observed between the MUT groups in addition to the WT groups (P < 0.01). Thirteen miRNAs were as follows: ped-miR171a, novel_44 and novel_47 of the MiR171_1 family, ped-miR319b-3p of the MIR159_1 family, ped-miR166a-3p, ped-miR444c, ped-miR169g, ped-miR396d-5p, ped-miR172a-3p, ped-miR164b, ped-miR167c-5p, and ped-miR160a-5p. Twelve target genes were as follows: PeSCL27 (PH02Gene47151), PePCF6_1–2 (PH02Gene09639 and PH02Gene36822), PePAHAL_1–2 (PH02Gene17565 and PH02Gene15869), PeHOX32 (PH02Gene31932), PeMADS27 (PH02Gene21974), PeNF-YA4 (PH02Gene45106), PeGRF6 (PH02Gene06203), PeOsI (PH02Gene07682), PeARF17 (PH02Gene03160), and PeARF18 (PH02Gene37045). Error bars indicate sd of three technical repeats. Statistical analyses were performed by Student’s t test. *P < 0.05; **P < 0.01; ***P < 0.001.
Interestingly, three miRNAs of the MIR171_1 family, bind to PH02Gene47151, a putative bamboo scarecrow-like ortholog of Brachypodium distachyon SCL27, named PeSCL27 (Figure 7A). And ped-miR319b-3p of the MIR159 family bind to two putative bamboo TF PePCF6s and a PePAHAL, respectively (Figure 7B). Notably, as for ped-miR167c-5p of the MIR167 family and ped-miR160a-5p of the MIR160 family, significant difference in the luciferase activity was also observed between the MUT groups (Figure 7, I and J). This confirmed that they bind to the corresponding targets at more than one sites.
FISH localized miR166 and miR160 in the SAM and the procambium
Differential fluorescence intensity was observed among various tissues of the bamboo shoots in the merged images after excluding false-positive signals from the antisense controls (Figure 8; Supplemental Figure S2). Fluorescence intensity of miR166 is higher than that of 4,6-diamidino-2-phenyiindole 2 hcl staining in the SAM and the procambium (Figure 8, A–C). This confirmed that ped-miR166a-3p was specifically expressed in the SAM and the procambium. In the same way, fluorescence in situ hybridization (FISH) localized ped-miR166h-3p and ped-miR160a-5p in the procambium and the sheath (Figure 8, D–I); and FISH localized ped-miR166a-3p in the vascular tissues of the TW (Figure 8, J–L) and the WT shoots (Figure 8, M–O) at the S3 stage.
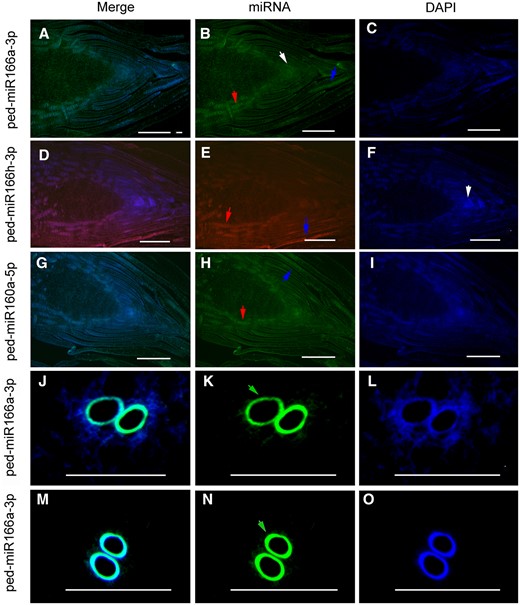
Verification of miR166 and miR160 location in the WT Moso bamboo and the TW variant shoots using FISH. FISH localized ped-miR166a-3p in the SAM (white arrow) and the procambium (red arrow) (A–C), ped-miR166h-3p in the procambium and the sheath (blue arrow) (D–F), and ped-miR160a-3p in the procambium and the sheath (G–I) of the WT Moso bamboo shoots at the S1 stage. FISH localized ped-miR166a-3p in the vascular tissues of (J–L) the TW variant and the WT Moso bamboo (M–O) shoots at the S3 stage. Bar = 100 µm.
Discussion
This study assessed the differences in profiles and levels of genes, miRNA, and key phytohormones between the WT and TW bamboo across five developmental stages and delineated the connections among these factors in the thickening bamboo shoots.
TFs, miRNAs, and miRNA–TF–phytohormone regulatory networks as key players during primary thickening
TFs are regulators and they carry information, which constantly updates plant development programs based on the modifications in environmental conditions, currently available resources, and sites of active organogenesis (Lai et al., 2020). They participate in various processes, including development, immune and stress responses, and light and hormonal signaling (Schmitz and Theres, 2005). In this study, nine TF family genes were found in high but varying proportions in the WT and TW groups. The diverse regulation modes provide a balance between the plasticity needed to rapidly adapt to the new environment and the continuity required to maintain the development of the tissues. Therefore, the differences in the ratio of the nine TF family members observed between the groups in this study indicate the changes in regulatory function, eventually causing morphological innovation of the mature culm’s wall thickness/pith diameter during evolution.
Posttranslational modification is a major mechanism in which miRNAs repress TFs; TFs work synergistically or antagonistically to regulate the downstream various targets. Importantly, miRNAs as parts of the miRNA–TF–plant hormone regulatory network enable complex processes with distinct developmental outcomes. For example, miRNA167-ARF regulates tissue and organ growth and development in various species (Li et al., 2020). Some similarities and differences were observed among the different families in different comparison combinations. In this study, the expression patterns of miRNA–mRNA modules were not exactly same among three dominant pairwise combinations, indicating similarity and specificity in their regulatory functions. Meanwhile, the dual-luciferase reporter assay confirmed that miR160 and miR167_1 bind to PeARFs, and miR396 binds to PeGRF; the various members of the same miRNA family (including novel miRNAs) could degrade the same targets, and a few miRNAs had multiple target gene cleavage sites. Thus, the dissimilarity in the expression patterns of miRNA families possibly indicates the complexity in the miRNA–mRNA regulatory network, while the high similarity in the expression patterns of miRNAs from the same family ensures stability.
Hormones also play essential roles in tissue differentiation and development. In this study, the concentration of ZT was higher than that of the other three phytohormones. A high proportion of ZT concentrations probably contributed to tissue differentiation. ZT concentration was higher than that of GA3, which stimulates cell proliferation and elongation (Liu et al., 2021), and modulates plant architecture (Chen et al., 2020; Miao et al., 2020) and stem elongation (Lu et al., 2020), assisting underground shoots in performing rapid internode elongation. The miRNAs, which are important for the appropriate expression of TFs, probably mediated the plant hormone response and contributed to distinct developmental outcomes in the underground shoots. The study unraveled the importance of phytohormones, especially ZT for the cell division and tissue differentiation, and emphasizes the role of miRNAs in the primary thickening bamboo shoot.
Nonsynchronous tissue differentiation before S3 contributes to morphological differences between WT and TW
TW Moso, the only stable Moso bamboo variant, is characterized by a narrow pith cavity, increased vascular bundles, and a fasciated stem. The deviation in development between WT and TW initially occurs at the S1 stage; and at this stage, the apical meristem of the TW produces more vascular tissue rather than differentiate into pith cells than the WT, while both the WT and the TW develop continuously and actively at S2 and S3 (Wei et al., 2017). Therefore, during this period, the pith zone in the WT shoots was apparent, while the culm wall in the TW shoots was thicker. In this study, several DEGs and DEmiRs were identified from the four pairwise combinations between two successive stages in both the WT and the TW groups, indicating that the primary thickening is a continuous developmental process. Additionally, the expression profiles of genes from 12 clusters mostly bend at the S3 stage in the WT group; many miRNA–mRNA pairs were identified from the relative pairwise combinations of the S3 stage. Moreover, few DEGs and DEmiRs were identified between the stages of WTS4–S5/TWS4–S5 in both the WT and the TW groups; and most coherently expressed DEmiRs and their predicted targets were identified between the stages of WTS1–S3/TWS1–S3. Besides, ZT concentration decreased from S1 to S3. These indicate that it is at S3 that the cells in the WT and the TW would face distinct fates driven by expressions of DEGs and DEmiRs. The pith cavity and the wall possibly develop asynchronously between the WT and the TW variant during primary thickening. Therefore, the genotype-specific DEGs, especially those identified at S3, may play a decisive role in the differences in the mature culm’s wall thickness/pith diameter between the WT and the TW.
Wei et al. (2017) found that the apical meristem of the bamboo shoot was different from that of rice or maize (Zea mays), and suggested a close association between the SAM maintenance and the continuous tissue differentiation. Meanwhile, shoots of the WT and the TW variant appeared spirally twisted from the primary thickening growth, being different from other monocot herbs while similar to few perennial woody trees. Additionally, the SAM in the TW shoots was flat and enlarged, with more cells but a same number of cell layers as that of the WT, which might account for the varied proportion of pith and vascular tissue differentiation. Moreover, the culms of the WT and the TW were spirally twisted at different degrees. Since they initially emerge from the underground shoots, the DEGs and DEmiRs need to be detected in the SAMs, which might probably regulate the shoot twist in both the WT and the TW. In this study, ped-miR166a-3p, ped-miR166e-3p, and ped-miR166h-3p from the MIR166 family were extremely highly expressed; the dual-luciferase reporter assay indicated that miR166 targeted and suppressed the expression of PeHOX32. Besides, FISH localized ped-miR166a-3p in the SAM and the procambium at the S1 stage, and in the shoot vascular tissues at the S3 stage; while FISH localized ped-miR166h-3p in the shoot procambium at the S1 stage. Possibly, miR166 members could either synergistically or antagonistically interact with each other during tissue differentiation and development in the thickening bamboo shoots.
Interestingly, only few DEGs and DEmiRs were identified in pairwise combinations of S5_versus_S4 in both the WT and the TW groups; meanwhile, few miRNA–target pairs were identified at the stages later than S3, consistent with Wei et al. (2017), who demonstrated fewer apical meristematic cells of bamboo shoots at S3. These observations indicate that the SAM activity might have declined at S3, and the developmental activity might have dropped as the number of cells plummeted. However, detailed experiments are needed to verify the role of the genes in regulating spatiotemporal tissue development and differentiation and elucidate the molecular mechanism underlying primary thickening.
Novel miRNAs might promote species- and/or genotype-specific morphological characteristics
Previously, Peng et al. (2013) identified 225 miRNAs from vegetative and flowering bamboo tissues. This study identified 150 miRNAs, with many novel ones (42.67%), substantially higher than that reported in many species, including chickpea (Cicer arietinum; Garg et al., 2018; Kudapa et al., 2018) and cotton (Gossypium hirsutum “Xuzhou142”) (Wang et al., 2012). Additionally, more than half of the coherent pairs involved novel miRNAs and were differentially expressed in combinations between two successive stages and two relative genotypes, revealing the importance of novel miRNAs for shoots in the underground developmental processes. Among them, a few miRNAs were clustered with the conserved miRNA families, such as MIR167_1 and MIR164. This observation suggests complex regulatory roles of miRNAs in the primary thickening growth of underground shoots.
Changes in miRNA folding, expression, processing efficiency, and size lead to changes in miRNA gene loci and produce young miRNAs (Cuperus et al., 2011). The high percentage of (59%) transposable elements in the Moso bamboo genome (Peng et al., 2013) seem to have contributed to the generation of species-specific miRNA genes (Nozawa et al., 2012). Earlier, Tang (2010) demonstrated that a few miRNA genes might evolve from target genes via coevolution, during which the species and number of miRNA families and their corresponding miRNA targets increased. Meanwhile, Peng et al. (2013) claimed that many gene duplicates involved in bamboo shoot development were generated after a whole-genome duplication event 7–12 million years ago. Some duplicates might be targets of the novel miRNA genes identified in this study. In this study, many new genes, including TF genes, were identified, which may be responsible for the changes affecting the biochemical properties of the TF protein or its expression pattern (Lai et al., 2020). Probably, the duplication, inversion, mutation, and other types of genetic drifts from protein-coding genes might have acted as the primary events in the genesis and evolution of the novel miRNA genes. Subsequent co-evolution of the miRNAs and their target genes probably ensured the maintenance and the fine-tuning of a dynamic regulatory network in bamboo.
Bamboo shoots develop from underground vegetative buds located at the nodes of a bamboo rhizome. Thus, the morphological development of the shoots is neither like the seedlings of Arabidopsis and other herbaceous plants nor like the stem or branch of fruit trees. Previous studies indicated that the evolved or evolving novel miRNAs might be important for species-specific gene regulatory functions (Lelandais-Briere et al., 2009). In this study, we showed that MIR167_1 family included five novel miRNAs, among which four members were differentially expressed in pairwise combinations between two recessive stages of the WT group and two relative stages of the WTTW group; furthermore, the dual-luciferase reporter assay indicated that miR167 targeted and suppressed the expression of PeARF17. In soybean, miR167 was highly expressed in pericycle and vascular tissues of roots, which exhibited the cell type-specific expression pattern required for lateral root development; miR167 could directly regulate auxin-mediated nodulation and lateral root development by repressing the target genes (i.e. two ARFs; Wang et al., 2015). Therefore, we speculated that the differentially expressed miR167 was involved in the auxin signaling pathway by repressing its targets during tissue differentiation and development of the underground shoots. Possibly, novel members were recruited to participate in the tissue differentiation to produce specific morphological characteristics in the Moso bamboo, consistent with D'Ario et al. (2017), who demonstrated that evolution occurred via the same pathways that achieved different developmental processes.
Conclusions
The study identified changes in the levels and profiles of DEGs, DEmiRs, their predicted targets, and phytohormones throughout the five stages of tissue differentiation. These findings indicated that the differences in miRNAome and transcriptome are essential for phenotypic plasticity, and the phytohormone ZT plays an important role in tissue differentiation in bamboo. Furthermore, the similarities and dissimilarities in genes, miRNAs, and phytohormones identified between the WT and the TW variant indicated their potential contribution to morphological differences. In this study, only two independent libraries from the WT and TW groups were established for degradome sequencing, and therefore, degradation sites could not be efficiently and adequately detected. Importantly, accurate sampling is required for tissues other than the whole shoots under multiple stages, which will help establish profiles of genes, miRNAs, and targets with high resolution and precision. Additional methods and efforts are required to verify the interaction between miRNAs and their predicted targets. To conclude, the study proposes candidates for bamboo genetics and breeding and the study’s findings unravel a complex association between genes, miRNAs, and phytohormones in the primary thickening of bamboo shoots.
Materials and methods
Plant materials
The studied plant species is Moso bamboo (P. edulis (Carr.) H. de Lehaie). The WT Moso and the TW variant (P. edulis “Pachyloen”) were used for a comparative analyses; and they both grow in the bamboo garden of Jiangxi academy of forestry, Nanchang City, Jiangxi, China (28°44′35.36″ N, 115°49′36.12″ E). We collected at least three underground shoots at S2–S6 stages each from rhizomes of 3-year-old WT Moso bamboo and the TW variant, referring to the method described by Wei et al. (2017). Additionally, for convenience, S2–S6 stages of the WT Moso and the TW variant were named WTS1–S5 and TWS1–S5. After being harvested, they were immediately frozen in liquid nitrogen and stored at −80°C until use.
To confirm the miRNA location, we collected Moso bamboo shoots at the WTS1 stages from rhizomes of 3-year-old pot-seedlings that were maintained in an air-conditioned greenhouse; they were located in the National State Forestry and Grassland Administration Key Open Laboratory on the Science and Technology of Bamboo and Rattan, Beijing, China. Plants were watered 3 times a week and maintained at 25 ± 1°C and 50%–55% relative humidity under a 12/12-h (light/dark) photoperiod with light intensity of 1,250 µmol m−2 s−1. Besides, we also collected underground shoots from rhizomes of 3-year-old bamboo plants of the WT and the TW at the S3 stage (WTS3 and TWS3); and they grow in the bamboo garden of Jiangxi academy of forestry.
Collection of physiological and biochemical data
A total of four representative phytohormones, including ZT, GA3, indole-3-acetic acid (IAA), and ABA, were evaluated. ZT, GA3, IAA, and ABA were purchased from Shanghai Yuanye Bio-Technology Co., Ltd. (Shanghai, China). Three biological replicates (three independent shoots) were maintained for the measurement of each phytohormone, and at least three technical replicates were analyzed for each biological replicate.
Plant samples were snipped and ground to a fine powder with liquid nitrogen. Subsequently, 0.2 g of the powdered plant material was extracted with 1-mL ice-cold extracting solution (methanol:acetic acid:deionized water = 12:3:5, v/v/v) at 4°C for 12 h. The supernatant was collected after centrifugation at 4°C, while the residue was extracted with 0.5 mL extracting solution for 2 h, and the supernatant was collected again after centrifugation. The residue was added to 0.5 mL of the extracting solution, and the supernatant solution was extracted by ultrasonication in an ice bath for 20 min. The supernatant was collected, mixed, and evaporated in a vacuum at 40°C until the organic phase disappeared. The aqueous residue was adjusted to 1.0 mL with petroleum ether for extraction and decolorization. The upper phase was discarded, and the lower phase was evaporated in a vacuum at 40°C. The evaporated solid was dissolved in 0.5 mL of the mobile phase solvent, and the solution was filtered using a needle filter into a chromatographic sample bottle for testing.
The testing was performed on an LC-100 HPLC system (WUFENG, Shanghai, China). Chromatographic separation was achieved on a HiQ-Sil C18 column (250 mm × 4.6 mm, 5 µm). The four phytohormones were eluted with methanol/water (45:55, v/v) containing 0.6% acetic acid. Conditions were as follows: injection volume, 10 µL; flowrate, 0.8 mL.min−1; column temperature, 35°C, and wavelength, 254 nm.
Total RNA isolation, RNA quantification, and qualification
Total RNA was isolated using miRcute Plant miRNA Isolation Kit (DP504) (TIANGEN Biotech (Beijing) CO., Ltd, Beijing, China) according to the manufacturer’s instructions. RNA concentration was measured using NanoDrop 8000 (Thermo Fisher Scientific, Bothell, WA, USA). RNA integrity was assessed using the RNA Nano 6000 Assay Kit of the Agilent Bioanalyzer 2100 system (Agilent Technologies, Santa Clara, CA, USA).
Transcriptome sequencing
Library preparation and sequencing
Three underground shoots collected at WTS1–S5 and TWS1–S5 stages each from rhizomes of 3-year-old WT Moso bamboo and TW variant were used for the transcriptome sequencing. A total amount of 1-μg RNA per sample was used as input material for the RNA sample preparations. Sequencing library construction using VAHTS mRNA-seq V3 Library Prep Kit for Illumina (Vazyme Biotech Co., Ltd, Nanjing, China) according to manufacturer’s instructions. The clustering of the index-coded samples was performed on a cBot Cluster Generation System using TruSeq PE Cluster Kit v3-cBot-HS (Illumina, San Diego, CA, USA) according to the manufacturer’s instructions. After cluster generation, the library preparations were sequenced on an Illumina Hiseq X-TEN platform and paired-end reads were generated.
Data analysis
The raw reads were processed to remove primer/adaptor contamination and low-quality reads (>20% bases <Q30, and N base >10%) using Trimmomatic version 0.35 (Bolger et al., 2014). The filtered reads were mapped with the Moso bamboo reference genome version 2.0 using HISAT2 version 2.0.4 (Kim et al., 2015) with parameters “–dta -p 6 –max-intronlen 5000000” for known gene identification. The mapped reads onto the un-annotated regions were then assembled using StringTie version 1.3.4d (Pertea et al., 2015) with parameters “–merge -F 0.1 -T 0.1” for novel gene identification.
Gene annotation
To annotate genes identified, alignments were performed based on the following databases: NR (ftp://ftp.ncbi.nih.gov/blast/db/), Swiss-Prot (http://www.uniprot.org/), GO (http://www.geneontology.org/), COG (http://www.ncbi.nlm.nih.gov/COG/), KEGG (http://www.genome.jp/kegg/), KOG (http://www.ncbi.nlm.nih.gov/KOG/), and Pfam (http://pfam.xfam.org/) using BLAST version 2.2.26 (Altschul et al., 1997).
Expression analysis of genes
To assess the repeatability of three biological replicates among samples, we conducted Pearson’s correlation analysis, and removed one replicate from a few groups to ensure high consistency (r2 > 0.70) in gene expression patterns between the replicates (Supplemental Figure S3); then, we conducted principal component analysis (PCA) based on the total method (P < 0.05), and ensure that genotype was responsible for most of the variance (PC1, 78.50%), followed by a striking stage effect (PC2, 7.50%) (Supplemental Figure S4A).
To identify DEGs, DESeq2 (Love et al., 2014) was used. To filter out genes with low expressions, those that were expressed (FPKM > 1) in either of two pairwise combinations were allowed and those with |log2(FC)| ≥ 1.00 and a Benjamini–Hochberg FDR corrected P < 0.01 were assigned as differentially expressed. The derived genes were represented by “A_vs_B”; for example, WT1_versus_WT2 represents DEGs between WTS1 and WTS2.
PPI
Sequences of the DEGs were blast (blastx) to the genome of a related species (the protein–protein interaction [PPI] of which exists in the STRING database: http://string-db.org/) to get the predicted PPI of these DEGs. Then the PPI of these DEGs was visualized in Cytoscape (Shannon et al., 2003).
Small RNA sequencing
Library preparation and sequencing
Three underground shoots collected at WTS1–S5 and TWS1–S5 stages each from rhizomes of 3-year-old WT Moso bamboo and TW variant were used for the small RNA sequencing. Small RNA libraries were constructed using the Illumina TruSeq Small RNA Library Prep Kit (Illumina Inc., CA, USA) according to the manufacturer’s instructions. The clustering of the index-coded samples was performed on a cBot Cluster Generation System using TruSeq PE Cluster Kit v4-cBot-HS (Illumina) according to the manufacturer’s instructions. The library preparations were sequenced on an Illumina HiSeq X-Ten platform.
Data analysis
The raw reads obtained were processed to remove reads with adaptor/primer contamination and low-quality reads (>20% bases <Q30, and N base >10%); and those shorter than 18 nt and longer than 30 nt were also discarded.
Identification and annotation of the miRNAs
The derived reads were further screened against rRNA, tRNA, snRNA, snoRNA, and other ncRNAs as well as repeat sequences by mapped to various RNA database, which include Silva (http://www.arb-silva.de/), GtRNAdb (http://lowelab.ucsc.edu/GtRNAdb/), Rfam (http://rfam.xfam.org/), and Repbase (http://www.girinst.org/repbase/) by using Bowtie (Langmead et al., 2009); and the remaining unannotated reads were then mapped onto the Moso bamboo reference genome version 2.0.
Importantly and notably, there was no miRNA annotation in the Moso bamboo genome and miRBase did not reposit any miRNAs from Moso bamboo. Therefore, to identify known miRNAs, the mapped reads with the Moso bamboo reference genome were mapped onto the miRNAs of B. distachyon, which is the most evolutionarily close to Moso bamboo (Zhao et al., 2018), in miRBase (Kozomara et al., 2019) (release 22, http://mirbase.org/) using Bowtie.
The unaligned unique reads were further used for novel miRNA prediction using miRDeep-P2 (Kuang et al., 2018) and newly updated criteria for plant miRNA criteria (Axtell and Meyers, 2018), referring to the method described by Guo et al. (2020). Furthermore, the identified miRNAs were clustered into families based on sequence similarity.
Expression analysis of miRNAs
In the formula, Readcount represents the number of reads mapped onto a certain miRNA; Mapped Reads denotes the number of reads mapped onto all miRNAs in the reference genome version 2.0.
To assess the repeatability of three biological replicates among samples, we conducted Pearson’s correlation analysis, and removed one replicate from a few groups to ensure high consistency (r2 > 0.70) in gene expression patterns between the replicates (Supplemental Figure S5); then, we conducted PCA based on the total method (P < 0.05), ensuring that genotype was responsible for most of the variance (PC1, 71.26%), followed by a striking stage effect (PC2, 16.47%) (Supplemental Figure S4B).
To identify DEmiRs, DESeq2 (Love et al., 2014) was used. To filter out miRNAs with low expressions, those that were expressed (TPM > 1) in either of two pairwise combinations were allowed and those with |log2(FC)| ≥ 1.00 and a Benjamini–Hochberg FDR corrected P < 0.05 were assigned as differentially expressed. The derived DEmiRs was represented by “A_vs_B”; for example, S01_vs_S02 represents the DEmiRs between S01 and S02.
Target prediction
Potential miRNA targets were identified using the psRNATarget (Dai et al., 2018). The newest default parameters of Schema V2 (2017 release) (Dai et al., 2018), except for a more restricted expectation threshold value of 3, were used. Annotation of these sequences was performed to query against various database mentioned in the section of “Data analysis.”
Degradome library construction and analysis
The total RNA from the WT and the TW groups were pooled separately to generate two unique libraries for degradome sequencing. The library was constructed as previously described (German et al., 2009) with slight modifications followed by sequencing on an Illumina Hiseq 2500 platform. The raw reads (single-end; 50 bp) were processed using Trimmomatic (version 0.35) to remove low-quality reads, reads with “N”s, and any reads with adaptor and primer contamination. The filtered reads were searched against all other noncoding RNA sequences from Rfam except miRNA using Bowtie, followed by removing reads aligning to ribosomal RNAs (rRNAs), tranfer RNAs (tRNAs), small nucleolar RNAs (snoRNAs), and repeats. The clean reads obtained were mapped onto the reference genome (version 2.0), allowing a maximum of one mismatch. CleaveLand (version 4.4) pipeline (Addo-Quaye et al., 2009) was used to predict the miRNA cleavage sites and only category 0, 1, and 2 results were kept to reduce false positives.
Luciferase reporter assay
WT of miRNAs and mRNAs of length 200 bp, including the predicted splicing sites and the flanking sequence, and MUT type after site-directed mutation of WT target sites were synthesized artificially (Sangon Biotech, Shanghai, China). Then, they were cloned into pmirGLO vector (GeneCreate, Wuhan, China) between NheI and XhoI (TaKaRa, Nojihigashi, Japan), and the empty plasmid was transfected as the control group.
After confirmation by sequencing, MUT and WT vectors were co-transfected with negative control (NC) mimic and miRNA mimics (GeneCreate) to 293T cells, respectively. Cells were collected and processed 48 h after transfection according to the manufacturer’s protocol with the Luciferase reporter assay kit (RG005; Beyotime, Shanghai, China). The outcomes were quantified in each well as the proportion of activity of firefly luciferase/Renilla luciferase. Three independent experiment was performed likewise. The sequences of NC and miRNA mimics, as well as WT and MUT plasmids are listed in Supplemental Table S8-1.
RNA FISH
FISH assays were conducted to observe the location of miRNAs in cells and tissues of the bamboo shoots. Paraffin-embedded tissues and section were prepared referring to the method described by Wei et al. (2017). The sections were firstly dewaxed to water, incubated with a mixed solution of 30% (w/v) H2O2 and methanol (1:10, v/v) at room temperature for 10 min, and then covered by proteinase K at 37°C for 20 min.
Hybridization was carried out using the FISH kit (C007, Shanghai Gefan Biotechnology.Co., Ltd, Shanghai, China) according to the manufacturer’s protocol. Briefly, the tissues were incubated with fluorescein isothiocyanate (FITC)-labeled probes (Abiocenter, Beijing, China) at 65°C overnight after washing with phosphate buffer saline (PBS), fixing in 4% (w/v) paraformaldehyde, and acetylating in acetic anhydride. Cell nuclei were counterstained with 4,6-diamidino-2-phenylindole (Invitrogen, Waltham, MA, USA), after washing with 2×SSC buffer, formamide/4×SSC (1:1, v/v), and PBS buffer. Then, the tissues were washed using PBS and assembled using antifade buffer (Beyotime, Shanghai, China). Finally, images were captured using a Nikon Eclipse Ci-L microscope with the appropriate filter combination for FITC fluorescence. Antisense probes were designed as the NC. The probe sequences are listed in Supplemental Table S8-2.
Statistical analyses
Statistical analyses were performed using SPSS version 19.0 software (IBM, Armonk, NY, USA). All data in this study are presented as the means ± standard deviation (sd), and all the tests were two-sided. A P-value of <0.05 was considered statistically significant. Student’s t test was used to evaluate the significance of differences between groups. The correlation analysis between biological replicates was detected by Pearson’s correlation coefficient.
Accession numbers
Sequence data have been deposited in National Center for Biotechnology Information (NCBI) Sequence Read Archive (http://www.ncbi.nlm.nih.gov/sra) with the BioProject ID PRJNA753616.
Supplemental data
The following materials are available in the online version of this article.
Supplemental Figure S1. GO term and KEGG pathway enrichment of DEGs identified from 13 combinations of the WT, TW, and WTTW groups.
Supplemental Figure S2. Signals of antisense probes of miR166 and miR160 in the Moso bamboo shoots using FISH.
Supplemental Figure S3. Pearson correlation of the gene expressions between biological replicates collected from rhizomes of 3-year-old bamboo plants of the WT Moso bamboo (P. edulis) and the TW variant (P. edulis “Pachyloen”).
Supplemental Figure S4. PCA analysis of the repeatability between biological replicates collected from rhizomes of 3-year-old bamboo plants of the WT Moso bamboo (P. edulis) and the TW variant (P. edulis “Pachyloen”).
Supplemental Figure S5. Pearson correlation of the miRNA expressions between biological replicates collected from rhizomes of 3-year-old bamboo plants of the WT Moso bamboo (P. edulis) and the TW variant (P. edulis “Pachyloen”).
Supplemental Table S1. Significant enriched GO terms and KEGG pathways for DEGs identified from 13 combinations of the WT, TW, and WTTW groups.
Supplemental Table S2. About 3,543, 2,397, and 780 genes identified encode TFs, PKs, and TRs, respectively.
Supplemental Table S3. GO terms enrichment of DEGs in 12 clusters.
Supplemental Table S4. KEGG pathway enrichment of DEGs in 12 clusters.
Supplemental Table S5. Known and novel miRNAs identified via small RNA sequencing using the underground thickening shoot samples of WT Moso bamboo (P. edulis) and a TW variant (P. edulis “Pachyloen”).
Supplemental Table S6. About 1,276 miRNA–mRNA pairs composed of DEmiRs and DEGs identified.
Supplemental Table S7. A total of 125 cleavage sites for 387 miRNA–mRNA pairs were confirmed by using degradome sequencing.
Supplemental Table S8. Sequences of the miRNAs and their corresponding targets tested using the dual-luciferase reporter assay and RNA FISH.
Yi.L. conceived the original screening and research plans, designed, performed the experiments, and analyzed the data, and wrote the article with contributions of all the authors. D.Z. designed the experiments and supervised the writing. S.Z. performed the experiments using the paraffin embedding method. Yo.L. and X.A. provided technical assistance to Yi.L.. Z.J. performed the association analysis of vascular tissue characteristics between underground shoots and aboveground mature culms. Z.G. supervised the experiments, data analysis, and the writing, and agrees to serve as the author responsible for contact and ensures communication.
The author responsible for distribution of materials integral to the findings presented in this article in accordance with the policy described in the Instructions for Authors (https://dbpia.nl.go.kr/plphys/pages/general-instructions) is Yongfeng Lou ([email protected]).
Acknowledgments
We thank Xiurong Xu (Zhejiang Academy of Forestry) and Kebin Yang (Interactional Center for Bamboo and Rattan) for the collection of plant materials.
Funding
This work was supported by the National Natural Science Foundation of China (No. 31901371) and the Special Funds for Fundamental Scientific Research on Professional Work Supported by International Center for Bamboo and Rattan (No. 1632019025).
Conflict of interest statement. The authors declared that they have no conflicts of interest to this work.
References
Author notes
Senior author
