


Abstract
The Yang cycle is involved in many essential metabolic pathways in plant growth and development. As extended products of the Yang cycle, the function and regulation network of ethylene and polyamines are well characterized. Nicotianamine (NA) is also a product of this cycle and works as a key metal chelator for iron (Fe) homeostasis in plants. However, interactions between the Yang cycle and NA biosynthesis remain unclear. Here, we cloned maize interveinal chlorosis 1 (mic1), encoding a 5′-methylthioadenosine nucleosidase (MTN), that is essential for 5′-methylthioadenosine (MTA) salvage and NA biosynthesis in maize (Zea mays). A single base G–A transition in the fourth exon of mic1 causes a Gly to Asp change, resulting in increased MTA, reduced Fe distribution, and growth retardation of seedlings. Knockout of ZmMIC1 but not its paralog ZmMTN2 by CRISPR/Cas9 causes interveinal chlorosis, indicating ZmMIC1 is mainly responsible for MTN activity in maize. Transcriptome analysis showed a typical response of Fe deficiency. However, metabolic analysis revealed dramatically reduced NA content in mic1, suggesting NA biosynthesis was impaired in the mutant. Exogenous application of NA transiently reversed the interveinal chlorosis phenotype of mic1 seedlings. Moreover, the mic1 mutant overexpressing a NA synthase gene not only recovered from interveinal chlorosis and growth retardation but was also fertile. These findings provide a link between the Yang cycle and NA biosynthesis, which highlights an aspect of Fe homeostasis regulation in maize.
Introduction
Polyamines (PAs), ethylene, and nicotianamine (NA) are three different small biomolecules, but their biosynthesis shares two characteristics: each starts with S-adenosyl-L-methionine (SAM) and produces the toxic by-product 5′-methylthioadenosine (MTA). MTA is hydrolyzed to 5′-methylthioribose (MTR) and adenine by MTA nucleosidase (MTN) (Guranowski et al., 1981; Rzewuski et al., 2007). MTR is subsequently phosphorylated to MTR-phosphate by MTR kinase (MTK) and salvaged after successive enzyme reactions to produce methionine (Met) in the Yang cycle (Figure 1), which is also known as the Met cycle (Miyazaki and Yang, 1987; Sauter et al., 2004; Pommerrenig et al., 2011).
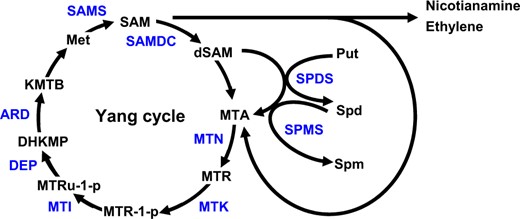
Overview of the Yang cycle and other metabolic pathways that produce MTA. The biosynthesis of NA, ethylene, and PAs produce MTA as a byproduct. The toxic byproduct MTA is salvaged in the Yang cycle, which also generates Met to sustain NA, ethylene, and PAs synthesis. In the Yang cycle, MTA is hydrolyzed by MTN, yielding MTR. MTR is converted into Met by successive reactions. MTK catalyzes the production of 5′-methylthioribose-1-phosphate (MTR-1-P), which is metabolized to 5′-methylthioribulose-1-phosphate (MTRu-1-P) by 5′-methylthioribose-1-phosphate-isomerase (MTI). The dehydratase-enolase-phosphatase-complex1 (DEP) catalyzes the conversion of MTRu-1-P to 1,2-dihydro-3-keto-5-methylthiopentene (DHKMP). The acidoreductone oxygenase (ARD) converts DHKMP to 2-keto-4-methylthiobutyrate (KMTB), which is converted into Met by a transaminase. SAM is produced from Met by SAM synthetase. SAM decarboxylase (SAMDC) removes the carboxyl group from SAM to produce decarboxylated SAM, which serves as a co-substrate with Put for Spd and spermine synthesis catalyzed by Spd synthase and Spm synthase, respectively. Enzymes and metabolites are shown in blue and black letters, respectively.
The Yang cycle is composed of several reactions catalyzing MTA into Met (Sauter et al., 2005; Pommerrenig et al., 2011), sustaining high rates of ethylene and PAs biosynthesis (Miyazaki and Yang, 1987; Bürstenbinder et al., 2007). The Arabidopsis (Arabidopsis thaliana) mtn1-1 and mtn1-2 mutants had impaired seedling and root growth on MTA as the sole sulfur source, whereas wild-type (WT) and the mtk mutant appeared normal on MTA medium (Bürstenbinder et al., 2010). This finding suggests that insufficient MTA hydrolyzing activity rather than insufficient Met recycling is responsible for the growth retardation of mtn1 mutants, highlighting the regulatory role of MTN in multiple metabolic pathways. In addition, the level of putrescine (Put) and spermine (Spm) were increased in mtn1-1 and mtn1-2 mutants, while ethylene and NA synthesis were not affected, indicating that limited MTN activity affects the biosynthesis of PAs (Bürstenbinder et al., 2010). Similarly, the link between MTN activity and PAs synthesis was also observed in the mtn1-1mtn2-1 double mutant, which developed altered vasculature and had impaired fertility with increased Put level. Exogenous feeding of PAs partially recovered fertility, and overexpressing an MTN rescued the mtn mutant phenotypes, suggesting that MTA accumulation accounts for altered PA content and impaired fertility (Waduwara-Jayabahu et al., 2012). Interestingly, the mtn1-1mtn2-1 mutant also had decreased NA content and showed interveinal chlorosis, which can be reversed by exogenous application of NA (Waduwara-Jayabahu et al., 2012). This finding highlights the possibility that the biosynthesis of NA is linked with the Yang cycle.
NA is produced from three molecules of SAM by NA synthase (NAS), and the biosynthesis of NA generates MTA as a byproduct. NA also serves as the precursor for phytosiderophores (PSs) production in graminaceous plants (Takahashi et al., 1999; Nakanishi et al., 2000; Bashir et al., 2006). PSs are secreted into the rhizosphere for the acquisition of iron (Fe), hence maintaining a balance between NA and PS synthesis is essential for the homeostasis of Fe uptake and transport. Over-expression of a barley (Hordeum vulgare) NA aminotransferase (HvNAAT) in tobacco (Nicotiana tabacum) over-consumed NA and resulted in interveinal chlorosis in young leaves (Takahashi et al., 2003). Similarly, loss of function of NAS impaired NA biosynthesis and led to chlorosis leaf in tomato (Solanum lycopersicum; Becker et al., 1995). Since previous studies indicate MTN activity affects the biosynthetic pathways that produce MTA as a byproduct, it is conceivable that the biosynthesis of NA and transport of Fe may be affected by MTA hydrolyzing.
In graminaceous plants, NA is consumed to produce mugineic acid, making the uptake and transport of Fe different from that in Arabidopsis. Therefore, the understanding of the homeostasis between NA and the Yang cycle may provide key information for Fe fortification in maize. Here, we show a nonsynonymous mutation in an MTN enzyme, Maize Interveinal Chlorosis 1 (ZmMIC1), led to MTA accumulation and a Fe-deficiency phenotype. Although the class I NAS genes were induced at the transcriptional level, the NA contents were decreased in the mutant plants. Exogenous and in vivo compensation of NA reversed the Fe-deficiency phenotype. Our results suggest that MTA accumulation inhibits the biosynthesis of NA, providing an enhanced perspective on the interaction between Fe homeostasis and the Yang cycle.
Results
The mic1 mutant displays interveinal chlorosis phenotype
Maize mic1 is an ethylmethane sulfonate (EMS)-induced mutant in the Mo17 background, which was obtained from DuPont Pioneer. The mic1 mutant plants exhibited dramatic interveinal chlorosis and strong growth retardation phenotypes (Figure 2A; Supplemental Figure S1). The mic1 mutant was crossed with B73 and then self-pollinated for two generations. The segregation ratio of mutant and WT plants from self-pollinated heterozygous plants (mic1/+) was 1:3, indicating that mic1 behaved as a monogenic recessive mutant. With the F2 and F3 populations, the mutant phenotype data were collected and individual plants were genotyped with genome-wide single-nucleotide polymorphism (SNP) markers. The mutation was mapped to bin 1.05–1.06. Cytological observation of leaves indicated that the mic1 mutant developed fewer and thicker vascular bundles than the WT (Figure 2B).
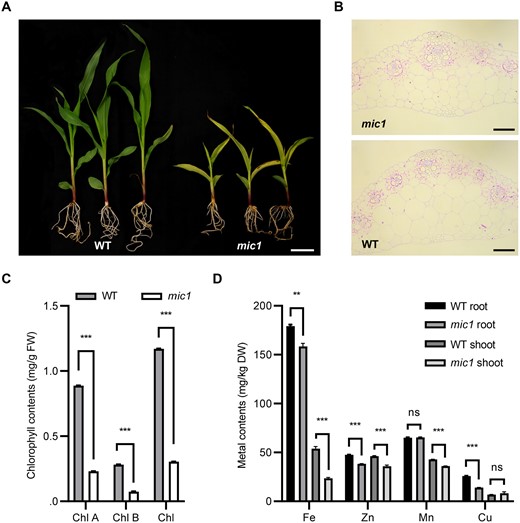
The mic1 mutant is characterized by reduced metal contents and morphology changes in vascular bundles. A, The V3 stage WT and mic1 seedlings grown in pots. Bar = 5 cm. B, Transverse sections showing veins of the mic1 and WT seedling leaves in the V3 stage. Bars = 100 μm. C, Chlorophyll content in leaves of the WT and mic1 mutant plants. D, Metal contents in leaves and roots of the WT and mic1 mutant plants. Values are means ± sd (standard deviation); n = 3 (**P < 0.01; ***P < 0.001; Student’s t test).
To further characterize the yellow stripe phenotype in leaves, we compared the chlorophyll content in leaves of the mic1 and WT plants. Chlorophyll content was significantly lower in the mutant plants than in WT plants (Figure 2C), which is consistent with the observation of interveinal chlorosis phenotype. Furthermore, we measured the metal contents of Fe, zinc (Zn), manganese (Mn), and copper (Cu) to explore the putative cause of the interveinal chlorosis. Contents of Fe, Zn, and Mn were decreased in the shoot of the mic1 mutant, while the content of Fe, Zn, and Cu was significantly reduced in the root of the mic1 plant (Figure 2D). These results suggest that the interveinal chlorosis phenotype of mic1 is likely to be the result of Fe deficiency.
The mic1 phenotype is caused by a nonsynonymous mutation in an MTN like protein
A total of 7,161 mutant F2 individuals were used for map-based cloning of mic1, which was narrowed down to an interval between the markers SNPBM02 and CAPS277, covering 574 kb in maize genome on chromosome 1 (Figure 3A). There are three candidate genes (Zm00001d031620, Zm00001d031621, and Zm00001d031622) in this interval. In mic1 mutants, sequencing in this region only revealed an SNP in the fourth exon of Zm00001d031621, which encodes a protein with 251 amino acid residues (Figure 3B). Since this candidate protein contains a conserved MTN domain, it was designated as mutation of ZmMIC1 (ZmMTN1). Phylogenetic analysis revealed that ZmMTN1 has many plant and bacterial homologs, especially MTN proteins from monocotyledons (Figure 3C). In maize, two MTN encoding genes were found, ZmMTN1 and ZmMTN2 (Zm00001d049823). Since ZmMTN2 has 88% protein identity with ZmMTN1, they may function redundantly. Compared with the WT, only 1 amino acid change, Gly (GGT) to Asp (GAT), was identified in a highly conserved site of ZmMTN1 in the mic1 mutant (Figure 3B; Supplemental Figure S2), indicating the enzymatic activity may be affected by the mutation. Furthermore, we examined the expression of both ZmMTN1 and ZmMTN2 in WT and mic1 seedlings. The expressions of ZmMTN1 and ZmMTN2 were slightly upregulated in shoots of the mic1 mutant plants, while only the expression of ZmMTN1 was induced in roots of the mutant plants (Figure 3D).
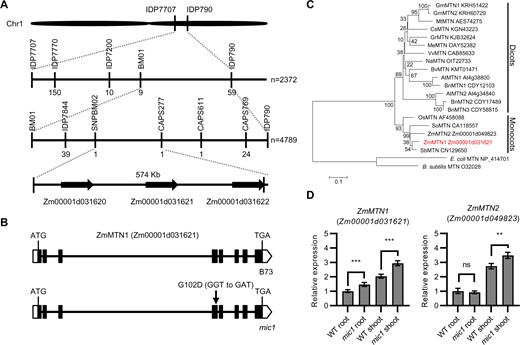
ZmMIC1 encodes a MTN like protein. A, Schematic representation of positional cloning of mic1 gene on chromosome 1 with the number of recombinants indicated below each marker. B, Gene structure of ZmMTN1. Black boxes indicate exons, while lines represent introns. The mutant site is marked with an arrow. C, Phylogenetic Tree of ZmMTN1 and its homologs from other species. Evolutionary distances were estimated using the neighbor-joining algorithm. The homologous proteins include MTN from dicotyledonous plants (GmMTN1 and GmMTN2 from Glycine max, MtMTN from Medicago truncatula, CsMTN from Cucumis sativus, GrMTN from Gossypium raimondii, MeMTN from Manihot esculenta, VvMTN from Vitis vinifera, NaMTN from Nicotiana attenuate, BvMTN from Beta vulgaris, AtMTN1 and AtMTN2 from A. thaliana, BnMTN1, BnMTN2, and BnMTN3 from Brassica napus) and monocotyledonous plants (OsMTN from O. sativa, SoMTN from Saccharum officinarum, ZmMTN1 and ZmMTN2 from Z. mays, SbMTN from Sorghum bicolor). The bacterial MTNs (Escherichia coli and Bacillus subtillis MTN) were used as outgroup. GenBank accession numbers and gene identifiers are given. ZmMTN1 is indicated in red letters. The scale bar indicates the average number of amino acid substitutions per site. D, Relative expression levels of ZmMTN1 and ZmMTN2 in the WT and mic1 seedlings determined by RT-qPCR using ZmActin1 as an internal control. Values are means ± sd; n = 4 (**P < 0.01; ***P < 0.001; Student’s t test).
ZmMTN1 is constitutively expressed and ZmMTN1 protein localized in the cytoplasm
Gene expression atlas (www.maizegdb.org) showed that ZmMTN1 is expressed in various organs of maize. Reverse transcription quantitative PCR (RT-qPCR) was used to further verify the expression pattern, and ZmMTN1 was expressed ubiquitously in all examined tissues, while ZmMTN2 was expressed predominantly in leaf but with little accumulations in the root, ear, and endosperm (En; Figure 4A). To further characterize ZmMTN1, ZmMTN2, and the mutant protein Zmmtn1, their subcellular localization was determined by transiently expressing the GFP fusion proteins in maize mesophyll protoplasts. The fluorescence signals of ZmMTN1-GFP, ZmMTN2-GFP, and Zmmtn1-GFP were localized in the cytoplasm (Figure 4B), suggesting both ZmMTN1 and ZmMTN2 function in the cytoplasm and the nonsynonymous mutation in Zmmtn1 does not affect the subcellular localization.

Expression patterns of ZmMTN1 and ZmMTN2 and subcellular localization of ZmMTN1, ZmMTN2, and Zmmtn1. A, Relative expression levels of ZmMTN1 and ZmMTN2 in different organs of WT plants. The En and Em were collected at indicated days after pollination (12, 21, and 28 d). The expression of ZmActin1 was used as an internal control. Values are means ± sd; n = 4. B, Subcellular localization of Zmmtn1-GFP, ZmMTN1-GFP, and ZmMTN2-GFP in maize mesophyll protoplasts. The subcellular localization of GFP was used as a control. Bars = 10 μm.
Knockout of ZmMTN1 but not ZmMTN2 causes interveinal chlorosis
To verify whether ZmMTN1 is the causal gene for the mic1 phenotype, we generated knockout (KO) mutants of both ZmMTN1 and ZmMTN2 using CRISPR/Cas9. Since ZmMTN1 and ZmMTN2 are highly conserved in both sequence and gene structure, two CRISPR/Cas9 plasmids, Cas9-1 and Cas9-2, were constructed, each containing a single-guide RNA (sgRNA) targeted at the conserved site either in the third (Cas9-1) or in the fourth exon (Cas9-2) of ZmMTN1 and ZmMTN2 (Figure 5A). We obtained one edited event for each CRISPR/Cas9 construct. All the edited T0 plants showed no visible phenotype, and they were self-pollinated to generate homozygous edited plants. In the Cas9-1-edited T2 plants, we identified a homozygous T insertion in the target site of ZmMTN1 which results in frame-shift and a premature stop codon in the coding sequence, though a heterozygous T deletion was present in ZmMTN2 which generates a premature stop-codon in the fourth exon (Figure 5B; Supplemental Figure S3). In the Cas9-2-edited plants, only ZmMTN2 was edited, as a homozygous T deletion was identified in the fourth exon, resulting in frame-shift and a premature stop codon (Figure 5C; Supplemental Figure S3). The ZmMTN1 KO seedlings showed a typical interveinal chlorosis phenotype, although the MTN2 allele was heterozygous. Compared with WT plants, no phenotypic difference was observed in homozygous ZmMTN2 KO plants (Figure 5D).
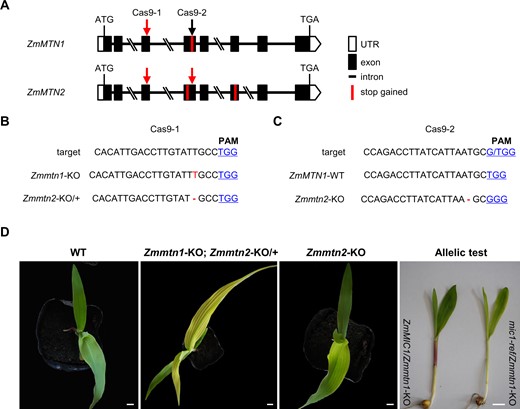
KO of ZmMTN1 but not ZmMTN2 by CRISPR/Cas9 causes interveinal chlorosis. A, Gene structure of ZmMTN1 and ZmMTN2, and target sites used for CRISPR/Cas9 editing. Two CRISPR/Cas9 constructs (Cas9-1 and Cas9-2) were generated, each targeted at one conserved site in ZmMTN1 and ZmMTN2 (indicated by arrows). The red and black arrows indicate edited and unedited sites, respectively. The premature stop-codons resulting from editing are indicated by red vertical bars in the gene structure. B and C, The target sites of CRISPR/Cas9 and edited sequences of ZmMTN1 and ZmMTN2. The protospacer-adjacent motif sequences are underlined and shown in blue color. The single T insertion in ZmMTN1 is indicated in red letters, while deletions are indicated with dashes. D, Interveinal chlorosis phenotype identified in homozygous Zmmtn1 KO plants harboring a heterozygous Zmmtn2 KO site, while no phenotype difference was observed from homozygous KO of ZmMTN2. Allelism test using seedlings from mic1-ref/+ × homozygous Zmmtn1-KO. The mic1-ref/Zmmtn1-KO seedlings showed the interveinal chlorosis phenotype, while ZmMIC1/Zmmtn1-KO seedlings exhibited the WT phenotype. The WT and KO images were digitally extracted for comparison. Bars = 1 cm.
Furthermore, the allelic test was performed to further confirm whether the nonsynonymous mutation in ZmMTN1 is responsible for the mic1 phenotype. The homozygous ZmMTN1 KO plants were crossed with the heterozygous mic1-ref mutant plants. The F1 population showed a 1:1 ratio of normal and mutant (interveinal chlorosis) phenotypes (Figure 5D; Supplemental Table S1), confirming that ZmMTN1 (Zm00001d031621) is the causal gene of mic1, and we rename this gene as ZmMIC1 accordingly.
Accumulation of MTA and repressed NA biosynthesis in the mic1 mutant
Since ZmMIC1 encodes an MTN protein, we speculated that the MTA level might be increased in the mic1 mutant. In addition, since Fe deficiency was observed in the mic1 mutant and MTA is the byproduct of NA, we postulated that the interveinal chlorosis and growth retardation phenotype of mic1 may result from disrupted biosynthesis of NA. To investigate the physiological mechanism of the mic1 phenotype, the contents of MTA, NA, and deoxymugineic acid (DMA) were measured by ultra-high performance liquid chromatography–tandem mass spectrometry (UPLC–MS/MS) using V3 stage roots and leaves of the mic1 mutant and control plants (Figure 6). Compared with the WT, we observed increases in MTA levels in both roots and leaves of the mic1 mutant, particularly in leaves with approximately three-fold higher than the WT (Figure 6A). This result implies that the MTA hydrolyzing activity was impaired in the mutant. As expected, we found that the content of NA and DMA were reduced dramatically in the mic1 mutant, especially in leaves (Figure 6, B and C). NA, as a Fe chelator, is known to play essential roles in Fe transport and distribution; DMA, synthesized from NA, is the precursor for PSs production. Taking these results into consideration, we reason that MTN activity was reduced in the mic1 mutant, resulting in MTA accumulation, which inhibits NA and DMA production and consequently leads to Fe deficiency and interveinal chlorosis.
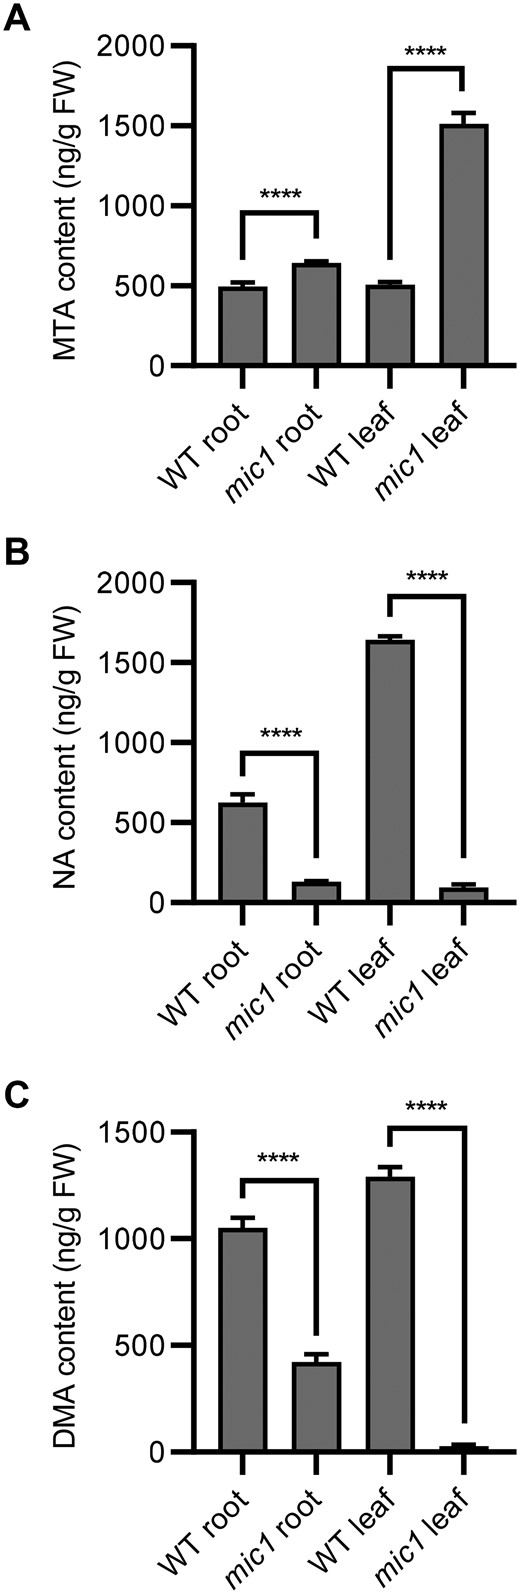
Altered contents of MTA, NA, and DMA in the mic1 mutant. The contents of MTA (A), NA (B), DMA (C) were determined in roots and leaves of the mic1 and WT seedlings. Values are means ± sd; n = 4 (****P < 0.0001; Student’s t test).
Fe-deficiency response was triggered in the mic1 mutant
To explore whether genes associated with the Yang cycle and MTA-related metabolic pathways were differentially expressed in the mic1 mutant, we performed RNA-seq experiments using V3 stage leaves from the mic1 mutant and control plants of the B73 background. A comparison of differentially expressed genes (DEGs) between the mic1 mutant and WT revealed 2,186 DEGs, including 886 upregulated and 1,300 downregulated DEGs (Fold changes > 2, false discovery rate (FDR) < 0.01; Supplemental Table S2). Furthermore, Kyoto Encyclopedia of Genes and Genomes (KEGG) analyses revealed that these DEGs were enriched in multiple biological processes, especially in porphyrin and chlorophyll metabolism, and sulfur metabolism (Figure 7A). Notably, the connection between sulfur and Fe metabolism has been established. Fe deficiency modulates the expression of genes associated with both sulfate uptake and assimilation in barley, durum wheat (Triticum durum), and tomato, suggesting that the Fe and sulfur metabolism needs to be associated to a certain extent (Astolfi et al., 2012; Ciaffi et al., 2013; Zuchi et al., 2015). Nevertheless, compared with sulfur deficiency, the Fe deficiency regulated a different set of genes of the sulfur assimilation pathway in Arabidopsis, indicating the presence of nutrient-specific response for this cross-regulation (Forieri et al., 2017).
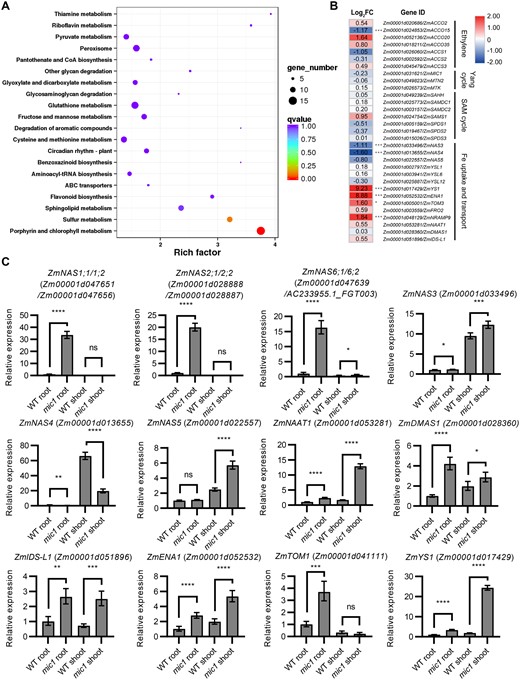
Transcriptome analysis shows the Fe-deficiency response was triggered in the mic1 mutant. A, Pathways with DEGs enrichment in the V3 stage leaves of mic1 mutant compared with WT. B, Fold changes and significances of DEGs associated with Fe uptake and transport, the Yang cycle, the SAM cycle, and the biosynthesis of ethylene. C, RT-qPCR verification of DEGs. ZmActin1 was used as an internal control. Values are means ± sd; n = 4 (*P < 0.05; **P < 0.01; ***P < 0.001; ****P < 0.0001; Student’s t test).
Although we did not find a large number of DEGs in mediating Fe uptake and transport, there are several DEGs related to NA biosynthetic and transport pathways that play important roles in Fe homeostasis (Figure 7B). Therefore, RT-qPCR was performed to verify the RNA-seq results. We found that the expression of ZmYS1, class I NAS genes (ZmNAS1, ZmNAS2, and ZmNAS6), ZmNAAT1, DMA synthase 1 (ZmDMAS1), iron deficiency-specific clone-like 1 (ZmIDS-L1), efflux transporter of NA (ZmENA1), and MAs efflux transporter (ZmTOM1) were all dramatically upregulated in the mic1 mutant (Figure 7C), suggesting the Fe-deficiency response was induced in the mic1 mutant.
Interveinal chlorosis can be restored through exogenous and in vivo supply of NA
To verify whether NA deficiency causes the interveinal chlorosis phenotype, we applied NA either with or without Fe to the leaves of V2-stage mic1 seedlings. Among the combinations tested, exogenous supply of 500 μM NA and 500 μM NA with 500 μM Fe2+ could partially reverse the interveinal chlorosis phenotype, while application of 500 μM Fe2+ and control treatment did not induce recovery from chlorosis (Figure 8A). This result showed that NA application to young leaves of mic1 led to recovery from interveinal chlorosis, suggesting that insufficient NA supply is the main reason for lower Fe and chlorophyll contents between the veins.
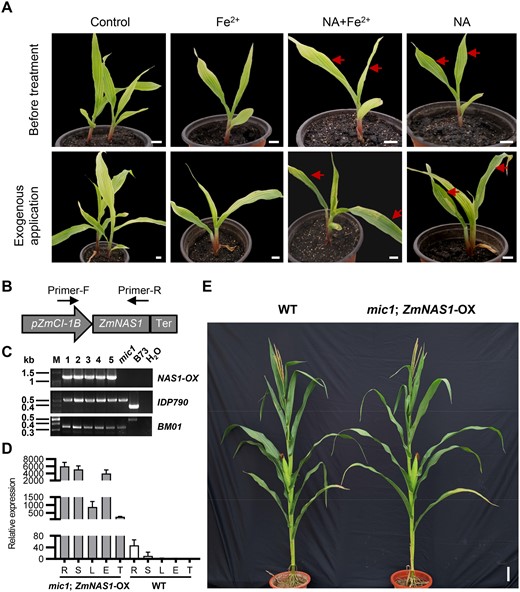
Exogenous application of NA and overexpression of NAS reversed interveinal chlorosis of the mic1 mutant. A, Regreening test of mic1 leaves treated with exogenous NA. Red arrows indicate young leaves that recovered from interveinal chlorosis, and the images were digitally extracted for comparison. Bars = 1 cm. B, Schematic diagram of the ZmNAS1-OX construct. Primers used for examining ZmNAS1-OX were indicated. C, Genotyping of the ZmNAS1-OX and mic1 alleles in the F2 population. Five F2 plants were identified to harbor both the ZmNAS1-OX and homozygous mic1 allele. PCR amplification was used to test the presence of full-length ZmNAS1 transgene. Markers IDP790 and BM01 were used to select homozygous mic1 mutants. D, Strong expression of ZmNAS1 was detected in the F2 mic1 plant harboring the ZmNAS1-OX transgene. Relative expression of ZmNAS1 was determined by RT-qPCR using ZmActin1 as an internal control, and the tassel of WT was used as a reference sample. R, root; S, stem; L, leaf; E, ear; T, tassel. Values are means ± sd; n = 4. E, The F2 mic1 plants overexpressing ZmNAS1 recovered from interveinal chlorosis and growth retardation. Bars = 10 cm.
Since reduced NA may cause interveinal chlorosis in mic1, we overexpressed ZmNAS1 in the mic1 background to test whether in vivo enhancing of NA biosynthesis could rescue the interveinal chlorosis phenotype. To introduce a high expression allele while maintaining the native expression profile of class I NAS genes, ZmNAS1 was overexpressed under a promoter with high expression activity in root and stem (Li et al., 2015; Figure 8B). F2 homozygous mic1 mutants carrying the ZmNAS1 overexpression (ZmNAS1-OX) transgene were identified by genotyping (Figure 8C), and RT-qPCR analysis confirmed the high expression of ZmNAS1 in the root, stem, leaf, ear, and tassel (Figure 8D). Overexpressing ZmNAS1 not only recovered the interveinal chlorosis phenotype but also reversed the growth retardation phenotype in the mic1 mutant plants (Figure 8E). Therefore, these results confirmed that the interveinal chlorosis and growth retardation phenotype was caused by insufficient NA biosynthesis in the mic1 mutant.
Discussion
Efficient operating of the Yang cycle is essential for sustaining high rates of ethylene, PA, and NA synthesis, as the Yang cycle salvages MTA and continuously resupplies Met for these biosynthetic pathways. Interactions between the Yang cycle and ethylene biosynthesis were reported in deepwater rice (Oryza sativa). Submergence of rice roots upregulated ethylene synthesis, which in turn enhanced the expression of acireductone dioxygenase 1, suggesting ethylene mediates the Yang cycle through a positive feedback manner (Sauter et al., 2005). Furthermore, the linkage between ethylene synthesis and the Yang cycle was also uncovered in the mtk mutant, which showed growth retardation with reduced SAM level at sulfur-limiting conditions. The ethylene overproducer 3 (eto3) mutant overproduced ethylene due to its high 1-aminocyclopropane-1-carboxylic acid synthase activity, while loss of function of MTK reduced the unusually high ethylene biosynthesis in the mtk/eto3 double mutant (Bürstenbinder et al., 2007). Since the biosynthesis of ethylene, PAs, and NA utilize SAM as a common substrate, and both produce MTA as byproducts, it can be conceivable that the biosynthesis of PA and NA are affected by the Yang cycle.
As the first reaction of the Yang cycle, MTN catalyzes the hydrolysis of MTA. Two MTN encoded genes, MTN1 and MTN2, were identified in Arabidopsis, while MTN1 counts for ∼80% of the total MTN activity (Bürstenbinder et al., 2010). Accordingly, severe knockdown of the MTA hydrolysis activity was found in mtn1-1 and mtn1-2 mutants grown on MTA medium. As a result, MTA accumulated in these mutants and the seedling growth was retarded. Even though the synthesis of ethylene and NA were not disturbed, the level of Put and Spm has increased in mtn1-1 and mtn1-2 seedlings, suggesting a link between the Yang cycle and PAs synthesis (Bürstenbinder et al., 2010). Interestingly, in the mtn1-1mtn2-1 double mutant, only ∼14% of the WT MTN activity was retained, and both PAs and NA contents were altered. In accordance with impaired NA production, the mtn1-1mtn2-1 leaves exhibited interveinal chlorosis, which could be reserved by exogenous NA supplementation (Waduwara-Jayabahu et al., 2012). Although altered NA synthesis was not observed in the single MTN mutants, mtn1-1 and mtn1-2, reduced NA content was observed in the double mutant, mtn1-1mtn2-1, suggesting a possible interaction between the Yang cycle and NA synthesis in Arabidopsis. However, up to now, little is known about the linkage between NA synthesis and the Yang cycle in graminaceous plants.
NA undergoes different metabolic pathways in graminaceous and nongraminaceous plants. NA is the only final product for Fe transport in nongraminaceous plants, while in graminaceous plants it also serves as a precursor for the synthesis of PSs, chelators of Fe, secreted into the rhizosphere to facilitate Fe uptake. Therefore, theoretically, more efficient NA biosynthesis is required in graminaceous plants than nongraminaceous plants to maintain a balance between Fe transport and uptake. The maize genome has two MTN encoded genes, and loss of function of ZmMIC1 resulted in approximately three-fold accumulation of MTA in leaves of the mic1 mutant. The level of MTA increase is comparable to that in leaves of the mtn1-1, mtn1-2, and mtn1-1mtn2-1 mutants (Bürstenbinder et al., 2010; Waduwara-Jayabahu et al., 2012). Therefore, ZmMIC1 accounts for a majority part of MTN activity in maize. It is interesting to know why the remaining ZmMTN2 cannot compensate for the decreased MTN activity in the mic1 mutant. A speculative explanation is graminaceous plants have higher demands for the NA reservoir than nongraminaceous plants, as NA not only acts as a Fe chelator but also a precursor for PSs synthesis. Therefore, the loss-of-ZmMTN1 function resulted in attenuated NA supply in the mic1 mutant. Besides, the lower accumulation of ZmMTN2 could be another reason. The expression of ZmMIC1 and ZmMTN2 was compared using RNA-seq data of different tissues covering the whole life span of maize (Stelpflug et al., 2016). The expression of ZmMTN2 was much lower than that of ZmMTN1 in all vegetative tissues (Supplemental Figure S4), thus the remaining amount of ZmMTN2 may not be sufficient to compensate for the loss of MTN activity in the mic1 mutant. As a result, the NA content in mic1 was reduced ˂10% of the level in WT plants, which is comparable to that in the Arabidopsis MTN double mutant (mtn1-1mtn2-1), Arabidopsis NAS mutants (nas4x-1 and nas4x-2), tomato NAS mutant (chloronerva), and transgenic tobacco overexpressing a NAAT gene (Ling et al., 1999; Takahashi et al., 2003; Klatte et al., 2009; Waduwara-Jayabahu et al., 2012). All these plants exhibited interveinal chlorosis and impaired fertility along with reduced NA and Fe content. Since disrupted NA synthesis was only observed in the mtn1-1mtn2-1 double mutant, not in the single mutants of MTN1, we postulate that compared to Arabidopsis, the NA synthesis in maize is more sensitive to MTA contents, possibly because a stronger activity of NA synthesis is required to facilitate both Fe transport and PSs production.
Despite the MTA accumulation and reduced level of NA and DMA, we also observed enhanced expression of genes associated with PSs biosynthesis. ZmNAS1, ZmNAS2, and ZmNAS6 belong to the class I subclade of NAS genes, which may associate with PSs synthesis and are known to be strongly induced under Fe deficiency (Zhou et al., 2013). NAAT1, DMAS1, and IDS-L1 catalyze the synthesis of DMA and MAs, while TOM1 and YS1 are responsible for secreting of PSs and uptaking of Fe3+-PSs in the rhizosphere, respectively (Takahashi et al., 1999; Curie et al., 2001). Thus, stimulation of these genes represents Fe-deficiency response in the mic1 mutant. As a result, enhanced PSs synthesis accelerated the consumption of NA in the mic1 mutant. Interestingly, upregulation of ZmNAS genes did not restore NA biosynthesis in the mic1 mutant, suggesting that the inhibition likely occurs through reduced NAS enzymatic activity. As a byproduct, MTA is known to inhibit the activity of PAs synthetic enzymes (Albers, 2009). Therefore, we reason that the reduced NA accumulation is likely through the manner of product inhibition of NAS activity. In summary, we propose a model explaining the mechanism that high MTN activity is required for sustaining a high flow of NA synthesis (Figure 9).
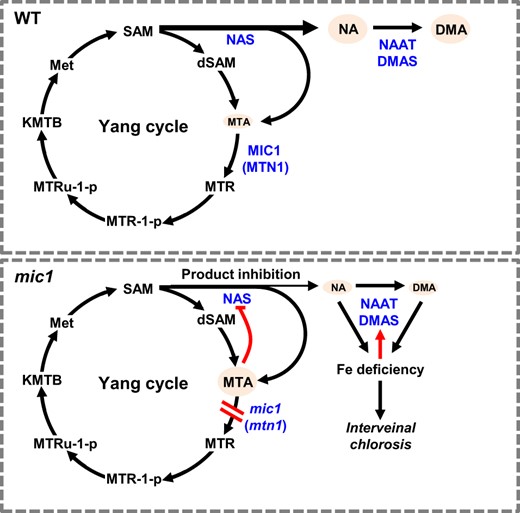
Working model for the interaction between the Yang cycle and NA biosynthesis. In WT, to sustain a high flow of NA synthesis the byproduct MTA is hydrolyzed by MTN and recycled in the Yang cycle. However, in the mic1, mutation of ZmMTN1 impaired MTA salvage; thereby the accumulated MTA represses NAS activity. Insufficient NA supply led to Fe deficiency and interveinal chlorosis. Fe deficiency induced the expression of enzymes associated with DMA synthesis but accelerated NA consumption. Enzymes are indicated in blue color, while compounds are represented in black letters. The black arrows/lines indicate pathways reported previously, while red lines/arrows indicate regulations identified in the mic1 mutant in this study.
Met produced by the Yang cycle serves as a substrate for SAM synthesis, thereby shrinking of SAM supply should also be considered as a possible reason for inhibited NA production. KO of the unique MTK gene and thus impaired Met resupply did not generate growth defects (Sauter et al., 2004), while mtn1-1 and mtn1-1mtn2-1 mutants display morphological phenotypes (Bürstenbinder et al., 2010; Waduwara-Jayabahu et al., 2012). Moreover, constitutive expression of both MTN1 and hMTAP could complement the phenotype of the mtn1-1mtn2-1 mutant, while human 5’-methylthioadenosine phosphorylase (hMTAP) converts MTA to 5′-methylthioribose-1-phosphate (MTR-1-P). These results suggest that increased MTA content led to abnormal growth of the MTN-deficient plants (Waduwara-Jayabahu et al., 2012). Therefore, we speculate that insufficient metabolism of MTA rather than inefficient recycling of Met inhibits NAS activity and results in growth defects of mic1. However, we cannot exclude the possibility that altered ethylene and PA metabolism also contributed to abnormal development.
PAs are low molecular mass organic polycations involved in a wide range of cellular activities related to growth, development, and stress responses in plants (Kusano et al., 2008; Takahashi and Kakehi, 2010; Vera-Sirera et al., 2010; Chan et al., 2013). Put is a precursor for higher PAs synthesis, as spermidine (Spd), Spm, and thermospermine (Tspm) are synthesized sequentially from Put in the PAs biosynthetic pathway (Sauter et al., 2013). Ethylene is a phytohormone that mediates responses to pathogens and abiotic stresses, as well as promotes fruit ripening and senescence (Bleecker and Kende, 2000). Therefore, altered ethylene and PA synthesis may lead to growth defects. In this study, exogenous NA application reserved interveinal chlorosis of the mic1 mutant. Moreover, overexpression of ZmNAS1 further restored the growth retardation and improved fertility of the mutant, suggesting that disturbed NA biosynthesis is likely to be the major reason for Fe-deficiency phenotype and growth defects of the mic1.
The location for NA synthesis is important for understanding how its biosynthesis and subcellular distribution are regulated. Since ZmNAS proteins were examined to be localized in the cytoplasm, we speculate that NA is synthesized in the cytosol (Zhou et al., 2013). Functional characterizations of two Arabidopsis NA transporter, Zn-induced facilitator (ZIF1) and NA efflux transporters (NAETs) support this speculation. ZIF1 is a vacuolar membrane localized major facilitator superfamily protein, and its function was suggested to transport cytoplasmic NA into vacuoles (Haydon et al., 2012). Consistent with this, it was recently proposed that cytoplasmic NA is first collected into secretory vesicles by NAET1 and NAET2 and is then secreted to the apoplastic space through exocytosis (Chao et al., 2021). In our study, we found maize MTN proteins are localized in the cytoplasm, further supporting the cytoplasmic biosynthesis of NA as MTN salvages the byproduct MTA.
In conclusion, we cloned the causal gene of mic1, which encodes ZmMTN1 and accounts for the major MTA hydrolyzing activity in maize. The mutation in ZmMIC1 led to an accumulation of MTA and inhibition of NAS activity along with reduced Fe storage. The dramatic reduction of NA content resulted in interveinal chlorosis, retarded seedling growth, and reduced fertility. Even though Fe-deficient-related phenotypes were reported in maize, most of them are caused by mutations in genes with direct functions in mediating Fe uptake or transport, such as ys1 and ys3 (Curie et al., 2001; Chan-Rodriguez and Walker, 2018). Interveinal chlorosis phenotypes caused by changes in key metabolites due to mutations in non-Fe-related pathways have not previously been reported in crop plants. Therefore, in this study, we reported that the level of MTA mediates the interaction between the Yang cycle and NA biosynthesis, providing an additional aspect of Fe homeostasis regulation in maize and possibly other graminaceous plants.
Materials and methods
Plant materials
The maize (Z. mays) mutant, mic1, used in this study was derived from a cross between B73 and EMS-mutagenized Mo17 pollen in Dupont Pioneer (Johnston, IA, USA). The phenotype was identified in an F2 population and the mutation was mapped to bin 1.05–1.06 by linkage mapping. For phenotypic and transcriptome analysis, the mic1 allele was introduced into B73 to clean up the background, and then mutant and WT plants were compared. All plants were grown in the field in Beijing and Hainan, China.
Phenotypic and histological analysis
The heterozygote seeds were cultivated in a greenhouse in Beijing, in 2014 and a field in Beijing and Hainan, in 2015. The homozygous mutant seedlings were sampled for phenotypic analysis. For light microscopy analysis, WT and mutant leaves were collected at the four-leaf stage, fixed in formaldehyde, acetic acid, and ethanol (FAA) solution (50% ethanol [v/v], 5% acetic acid [v/v], 3.7% formaldehyde [v/v]), and embedded in paraffin wax. The transverse sections of leaves were made as described previously (Zhou et al., 2013).
Measurement of chlorophyll and metal element content
WT and mutant plants were grown in a greenhouse under an 18-h light: 6-h dark photoperiod with day and night temperatures of 28°C and 23°C, respectively. Leaves were sampled at the V3 stage. Then, 500-mg leaf tissues were selected for measuring the content of chlorophyll. The total chlorophyll, chlorophyll a, and chlorophyll b levels were measured by the colorimetric method. To measure levels of Fe and other metal element contents, leaf and root tissues were dried at 60°C for 6 d and then milled to fine powders. For each sample, 500 mg of material was digested in 3-mL nitric acid for 2 h, followed by the addition of 1-mL hydrogen peroxide. After microwave treatment, the samples were filtered and diluted to 25 mL with Millipore-purified water. Finally, the metal contents were measured using ICP-OES (iCAP 6000; Thermo-Fisher, Waltham, MA, USA).
Linkage mapping and gene cloning
The MIC1 allele was initially mapped between InDel markers IDP7707 and IDP790. For fine mapping, InDel markers were obtained from the maizeGDB site (www.maizegdb.org), while more cleaved amplified polymorphic sequences (CAPS) and SNP markers were developed by sequence comparison between two parents. The locus of mic1 was narrowed down to a 574-kb interval using 7,161 homozygous mutants. Three candidate genes were found in this region. They were re-sequenced and only a Gly (GGT) to Asp (GAT) mutation was identified in ZmMIC1.
Generation of CRISPR/Cas9 KO lines
The CRISPR/Cas9 plasmid (pBUN411) contains a maize-codon optimized Cas9, and a sgRNA expression cassette driven by OsU3 promoter was used to generate additional alleles of mic1 mutants (Xing et al., 2014). Since there are two genes encoding MTN-like protein in maize, the sgRNAs were designed to target the conserved sequence in the third and fourth exon of ZmMIC1 and ZmNTN2. The T0 transgenic plants were self-pollinated, and the T2 plants were genotyped by PCR and sequencing.
RNA-seq analysis and RT-qPCR
Total RNA was extracted from WT or mic1 mutant leaves using TRIzol reagent (Invitrogen, Waltham, MA, USA). Four independent biological replicates were performed for RNA-seq. Total RNAs were sent to the Biomarker Company, where the libraries were produced and sequenced using Illumina HiSeq 2500. The functional category analysis of the DEGs was performed using KEGG enrichment. For RT-qPCR, the first-strand cDNA was synthesized using the One-step gDNA Removal and cDNA Synthesis SuperMix (TransGen Biotech, Beijing, China). The real-time PCR reaction was prepared using TB Green Premix Ex Taq (Takara, Shiga, Japan) with gene-specific primers (Supplemental Table S3). The mixture was amplified using the ABI7500 system (Applied Biosystems, Waltham, MA, USA). Data were analyzed with the ΔΔCt method and the expression of ZmActin1 was used as an internal control. Four technical replicates were performed for real-time PCR, and a representative result from at least three biological replicates is shown for each gene.
Detection of NA, DMA, and MTA contents
The NA, DMA, and MTA contents were determined using commercially available standards according to previously described methods (Wada et al., 2007; Bashir et al., 2017). In brief, V3 stage roots and leaves of the mic1 mutant and control plants (0.2 g fresh weight) were ground into powders in liquid nitrogen. Then, MTA, NA, and DMA were extracted with 5 mL of double-distilled water. The extracts were lyophilized and re-dissolved in 1-mL double-distilled water. The contents of MTA, NA, and DMA were measured using UPLC–MS/MS (Agilent Technologies, Santa Clara, CA, USA) with an Atlantis Premier BEH C18 AX column (Waters, Milford, Ms, USA). The NA and DMA standards were purchased from Toronto Research Chemicals (N408500 and D243250). The standard substance for MTA was obtained from Sigma (D5011; St Louis, MO, USA).
Subcellular localization
To determine the subcellular localization of Zmmtn1, ZmMTN1, and ZmMTN2, their full-length coding sequences were amplified using gene-specific primers (Supplemental Table S3) and C-terminus fused with GFP in the pRTL2NGFP plasmid (Zhou et al., 2013). Then, the GFP fusion proteins were expressed in maize mesophyll protoplasts. For transient expression, the plasmids were prepared using the Wizard Plus Miniprep DNA Purification System kit (Promega, Madison, WI, USA) and transformed into maize mesophyll protoplast as previously described (Yoo et al., 2007). The protoplasts were incubated in dark for 12–16 h and the fluorescence signals were visualized using LSM700 confocal microscope with a Plan-Neofluar 40x/1.30 Oil DIC M27 objective (Carl Zeiss, Oberkochen, Germany). GFP and chlorophyll autofluorescence signals were excited at 488 nm, and their emission was collected at 500–530 nm and >650 nm, respectively. The pinhole of confocal was set to 1 Airy unit. The acquired images were processed by Zen Black software (Carl Zeiss) and ImageJ (https://imagej.nih.gov/ij/).
NA complementation assay
Commercial NA (Toronto Research Chemicals, Toronto, Canada) was used to prepare the 500 μM working solution. The second leaf of V2 stage soil-grown mic1 plants was treated with either Fe2+ solutions or in combination with NA. Treatment was performed daily in a greenhouse and lasted for 1 week. Then, the degree of interveinal chlorosis rescue was photographed 10 d after NA application. Three replicates were applied for each treatment and the solutions were freshly prepared every day.
ZmNAS1-OX and complementation test
The full-length coding region of ZmNAS1 was amplified using gene-specific primers (Supplemental Table S3), and inserted into the modified pCAMBIA3301 plasmid which contains a root and stem predominant promoter pZmCI-1B (Li et al., 2015). The maize transformation was performed as previously described (Miller et al., 2002). In brief, the Agrobacterium tumefaciens strain EHA105 was used to infect 10-days after pollination (DAP) immature Hi-II embryos. The T0 plants were screened by herbicide and PCR amplification using vector-specific primers (Supplemental Table S3). For the complementation test, the heterozygous mic1 mutant was crossed with ZmNAS1-OX plants, and the F1 seedlings were self-pollinated to generate the F2 population. Then, the F2 plants were genotyped for the presence of ZmNAS1 transgene and the homozygous mic1 allele.
Statistical analysis
GraphPad Prism version 8 was used for data analysis. The Student’s t test was analyzed to identify a significant difference between two columns. For all statistical analyses: ns, not significant; *P < 0.05; **P < 0.01; ***P < 0.001; ****P < 0.0001.
Accession numbers
Sequence data from this article can be found in the MaizeGDB or GenBank databases under the following accession numbers: ZmMIC1, Zm00001d031621; ZmMTN2, Zm00001d049823; OsMTN, AF458088; SoMTN, CA118557 and CA288933; SbMTN, CN129650; AtMTN1, At4g38800; AtMTN2, At4g34840; VvMTN, CAB85633; E. coli MTN, NP_414701; B. subtillis MTN, O32028; BnMTN1, CDY12103; BnMTN2, CDY17489; BnMTN3, CDY58815; BvMTN, KMT01471; GmMTN1, KRH51422; GmMTN2, KRH60729; CsMTN, KGN43223; GrMTN, KJB32624; MeMTN, OAY52382; MtMTN, AES74275; and NaMTN, OIT22733. RNA-seq data are available from the National Center for Biotechnology Information Sequence Read Archive under accession number PRJNA785715.
Supplemental data
The following materials are available in the online version of this article.
Supplemental Figure S1. The growth retardation of the mic1 mutant.
Supplemental Figure S2. Alignment between ZmMTN1 and its homologs from plants and bacteria.
Supplemental Figure S3. The CRISPR/Cas9 edited sequence of ZmMIC1 and ZmMTN2.
Supplemental Figure S4. The accumulation of ZmMTN2 is lower than ZmMTN1 in all vegetative tissues.
Supplemental Table S1. The interveinal chlorosis phenotype ratio of allelism test.
Supplemental Table S2. DEGs between the mic1 mutant and WT plants.
Supplemental Table S3. Primers used in this study.
S.C. and R.C. planned and designed the experiments. W.S., X.T., X.J.Z., X.Z., and K.X. performed the lab experiments and data collection. C.C. helped with photographing. W.S., X.J.Z., and C.L. wrote the manuscript with the inputs from all the co-authors.
The author responsible for distribution of materials integral to the findings presented in this article in accordance with the policy described in the Instructions for Authors (https://dbpia.nl.go.kr/plphys/pages/general-instructions) is: Shaojiang Chen ([email protected]).
Acknowledgments
We thank Dr Bailin Li for help with maize mutant seed and comments on the manuscript, Dilbag Multani and Kevin Simcox for generating the mutagenized population and identifying the mutant, Jennifer Jaqueth for doing the initial mutant mapping, Dr Jinsheng Lai and Dr Haiming Zhao for generating CRISPR Cas9 KO lines.
Funding
This work was supported by the National Key Research and Development Program of China (2016YFD0101200), the Modern Maize Industry Technology System (CARS-02-04), the National Natural Science Foundation of China (91935303, 31771707), and the National Special Program for GMO Development of China (2016ZX08003-002).
Conflict of interest statement: The authors declare no conflict of interest.
References
Author notes
These authors contributed equally (W.S., X.J.Z., and C.C.).
Senior authors.
