


Abstract
The common ancestor of seed plants and mosses contained homo-oligomeric cellulose synthesis complexes (CSCs) composed of identical subunits encoded by a single CELLULOSE SYNTHASE (CESA) gene. Seed plants use different CESA isoforms for primary and secondary cell wall deposition. Both primary and secondary CESAs form hetero-oligomeric CSCs that assemble and function in planta only when all the required isoforms are present. The moss Physcomitrium (Physcomitrella) patens has seven CESA genes that can be grouped into two functionally and phylogenetically distinct classes. Previously, we showed that PpCESA3 and/or PpCESA8 (class A) together with PpCESA6 and/or PpCESA7 (class B) form obligate hetero-oligomeric complexes required for normal secondary cell wall deposition. Here, we show that gametophore morphogenesis requires a member of class A, PpCESA5, and is sustained in the absence of other PpCESA isoforms. PpCESA5 also differs from the other class A PpCESAs as it is able to self-interact and does not co-immunoprecipitate with other PpCESA isoforms. These results are consistent with the hypothesis that homo-oligomeric CSCs containing only PpCESA5 subunits synthesize cellulose required for gametophore morphogenesis. Analysis of mutant phenotypes also revealed that, like secondary cell wall deposition, normal protonemal tip growth requires class B isoforms (PpCESA4 or PpCESA10), along with a class A partner (PpCESA3, PpCESA5, or PpCESA8). Thus, P. patens contains both homo-oligomeric and hetero-oligomeric CSCs.
Introduction
Cellulose is synthesized at the plasma membrane by cellulose synthesis complexes (CSCs) composed of cellulose synthase catalytic subunits. The CSCs of land plants and their closest algal relatives have a characteristic rosette morphology and the cellulose synthase catalytic subunits, known as CESAs, have characteristic inserts that are thought to play a role in rosette CSC assembly. Evidence accumulated over a decade showed that Arabidopsis (Arabidopsis thaliana (L.) Heynh.) has two types of CSCs, one for primary cell wall biosynthesis and another for secondary cell wall biosynthesis. Both primary and secondary cell wall CSCs are obligate hetero-oligomers, each requiring a different set of three CESA isoforms for assembly and activity (reviewed by McFarlane et al., 2014). Although obligate hetero-oligomeric rosette CSCs appear to be conserved in seed plants (Kumar et al., 2009; Carroll and Specht, 2011; Jokipii-Lukkari et al., 2017), it is unknown whether CESAs can form functional homo-oligomeric rosette CSCs. Answering this question is a starting point for investigating the biochemical and adaptive implications of the hetero-oligomeric state.
The moss Physcomitrium patens subspecies patens (Hedwig) Mitten, formerly Physcomitrella patens (Medina et al., 2019), represents a group of land plants that diverged from the vascular plant lineage at least 450 mya (Lang et al., 2018). Like other mosses, P. patens has a haploid dominant life cycle consisting of protonemal filaments that extend by tip growth and produce buds that develop into leafy gametophores. The gametophores are primarily composed of thin-walled photosynthetic cells that expand by diffuse growth, but the leaf midribs contain support cells called stereids with thick, unlignified secondary cell walls (Kenrick and Crane, 1997). In contrast to the tracheary elements of vascular plants, the water conducting cells of mosses, known as hydroids, lack secondary cell walls (Hebant, 1977). Phylogenetic analyses showed that the last common ancestor of P. patens and seed plants had a single CESA gene and that this ancestral CESA diversified independently in both lineages (Roberts and Bushoven, 2007; Yin et al., 2009; Carroll and Specht, 2011). Through comparative analysis of CSC composition and subunit interchangeability, we have sought to understand the evolutionary processes that drove CESA diversification and functional specialization in these independent lineages (Goss et al., 2012; Roberts et al., 2012; Norris et al., 2017; Haigler and Roberts, 2019; Li et al., 2019).
The seven P. patens CESA proteins that have been characterized can be divided into two phylogenetic clades that are supported by intron/exon structure (Roberts and Bushoven, 2007) and synteny analysis (Lang et al., 2018). Genetic complementation experiments showed that these clades correspond to functionally distinct classes designated class A and class B (Scavuzzo-Duggan et al., 2018). Class A includes PpCESA5, which is required for development of leafy gametophore buds beyond the 4-cell stage. The ppcesa5 knockout (KO) phenotype is characterized by defects in division and expansion of meristem cells, indicating that PpCESA5 participates in primary cell wall deposition (Goss et al., 2012). PpCESA5 and the other two members of class A (PpCESA3 and PpCESA8) are distinguished from the members of class B (PpCESA4, PpCESA6, PpCESA7, and PpCESA10) by their ability to rescue the ppcesa5KO phenotype (Scavuzzo-Duggan et al., 2018) and also the ppcesa3/8KO secondary cell wall phenotype (Norris et al., 2017) when expressed constitutively. Although the class A PpCESAs encode functionally interchangeable proteins, they are subfunctionalized with distinct roles in development. In contrast to PpCESA5, PpCESA3 and PpCESA8 are required for cellulose deposition in the secondary walls of the stereid cells that strengthen the leaf midribs (Norris et al., 2017).
The cellulose-deficient midrib phenotype of ppcesa3/8KOs is shared by ppcesa6/7KOs, and this phenotype is not rescued by PpCESA7 expressed under control of the PpCESA8 promoter, suggesting that class A and B PpCESAs serve distinct roles in secondary cell wall deposition (Norris et al., 2017). Combined with evidence that PpCESA3, PpCESA8, PpCESA6, and PpCESA7 physically interact (Li et al., 2019), these results support the hypothesis that the CSCs that synthesize secondary wall cellulose in P. patens are obligate hetero-oligomeric with distinct positions occupied by members of class A (PpCESA3 or PpCESA8) and class B (PpCESA6 or PpCESA7). The A and B PpCESA clades were created in the first duplication of the ancestral moss CESA (Roberts and Bushoven, 2007; Lang et al., 2018). If neofunctionalization occurred shortly after this duplication, it is conceivable that all moss CSCs assemble from non-interchangeable class A and class B CESAs. However, it is unknown whether gametophore morphogenesis requires a class B PpCESA in addition to PpCESA5.
Compared with the members of class A, relatively little is known about the functions of the class B PpCESAs. Whereas PpCESA6 and PpCESA7 have been implicated in secondary cell wall biosynthesis in gametophore leaf midribs (Norris et al., 2017), the other two members of class B (PpCESA4 and PpCESA10) are expressed primarily in the filamentous protonemal stage (Tran and Roberts, 2016). We have also observed that ppcesa4/10KOs have no obvious gametophore phenotype (Norris et al., 2017). These results suggest a role for PpCESA4 and PpCESA10 in protonemal growth, but this has not been tested. Protein–protein interactions among the PpCESAs that are implicated in secondary cell wall synthesis have been reported (Li et al., 2019), but the interactions among the remaining PpCESAs are unknown. Finally, it is not known whether the class B PpCESAs are functionally interchangeable.
Here, we further examine the protein–protein interactions among the PpCESAs and investigate the roles of the class B PpCESAs in gametophore morphogenesis, secondary cell wall deposition, and protonemal growth. The results indicate that both class A and class B PpCESAs are required for normal secondary cell wall deposition and protonemal growth, whereas PpCESA5 activity is sufficient for gametophore morphogenesis in the absence of PpCESA partners. Thus, P. patens has both homo-oligomeric CSCs composed of PpCESA5 and obligate hetero-oligomeric CSCs composed of isoforms from class A and class B.
Results
Three secondary PpCESAs are distinctive in their inability to self-interact in heterologous systems
Our previous results showed that PpCESA3, PpCESA8, and PpCESA6 fail to self-interact (Li et al., 2019). To determine whether this lack of self-interaction is typical, we tested the interactions among the other PpCESAs. Results from membrane-based yeast two-hybrid (MbYTH) assays show that PpCESA5, PpCESA4, and PpCESA10 self-interact (Figure 1), as was shown previously for PpCESA7 (Li et al., 2019). Overall, positive interactions between different PpCESAs predominated. The exceptions were PpCESA5 (bait) with PpCESA3, PpCESA7, and PpCESA10; and PpCESA4 (bait) with PpCESA6. A few of the positive interactions were weak, including PpCESA3 (bait) with PpCESA10; PpCESA6 (bait) with PpCESA4, PpCESA5, and PpCESA10; and PpCESA10 (bait) with PpCESA3, PpCESA5, and PpCesA6. The results of reciprocal tests with bait and prey switched were consistent with the exceptions of PpCESA5 (bait versus prey) with PpCESA3, which were opposite in reciprocal tests, and PpCESA5 (bait versus prey) with PpCESA7, which differed in strength. Differences in the stability of CESA–CESA interactions for reciprocal MbYTH pairs have been reported previously (Timmers et al., 2009; Carroll et al., 2012; Li et al., 2013, 2019). Whereas results from reciprocal experiments corroborate one another when they agree, we are unable to draw conclusions about the interaction of PpCESA5 with PpCESA3 or PpCESA7 based on the data reported here.
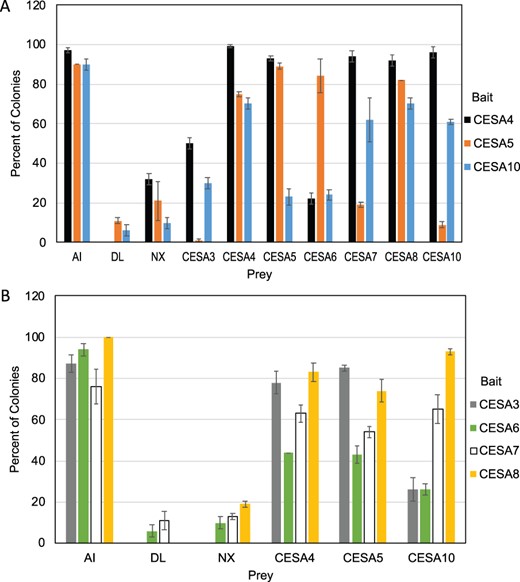
Interactions between PpCESAs measured by membrane-based yeast two-hybrid assay. Yeast expressing each of the PpCESAs as bait with the ALG5 protein fused to NubI as a positive control (AI), NubG as a negative control (DL), an empty prey vector as another negative control (NX), and PpCESA proteins fused to NubG as prey. The percentage of colonies that show visible growth after 3 d at 30°C on selective medium is shown with errors bars representing standard deviation (n = 3). A, Interactions of all PpCESAs and controls as prey with PpCESA4, 5, and 10 as bait. B, Interaction of PpCESA4, 5, 10, and controls as prey with the secondary PpCESAs as bait.
PpCESA5 does not require a class B partner
Our previous results showed that members of both class A (PpCESA3 or PpCESA8) and class B (PpCESA6 or PpCESA7) are required for cellulose deposition in the secondary walls of stereid cells in leaf midribs (Norris et al., 2017) and co-immunoprecipitation (coIP) of PpCESA3, PpCESA8, and PpCESA6/7 indicated that these isoforms form hetero-oligomeric CSCs (Li et al., 2019). These results, along with failure of PpCESA3, PpCESA8, and PpCESA6 to self-interact, are consistent with the hypothesis that interactions between class A and class B PpCESAs are required for assembly or function of CSCs that synthesize secondary cell walls in P. patens (Li et al., 2019).
To test whether class B PpCESAs are required along with PpCESA5 for gametophore morphogenesis, we made class B quadruple ppcesa4/6/7/10KOs by transforming ppcesa4/10KO-4B (Norris et al., 2017) with the CESA6/7KO vector (Norris et al., 2017). Three independent ppcesa4/6/7/10KO lines were identified by screening for 5′ and 3′ integration of the CESA6/7KO vector and deletion of the target gene (Supplemental Figure S1). All three ppcesa4/6/7/10KO lines produced leafy gametophores that were morphologically similar to wild type (Figure 2), indicating that the class B PpCESAs are not required for gametophore morphogenesis.

Class B PpCESAs are not required for gametophore development. A, Unrooted phylogram of PpCESAs showing class A (blue) and class B (green). B and C, Wild-type (WT) P. patens colony (B) and leafy gametophore (C). D–I, Three independent ppcesa4/6/7/10KO lines produce colonies (D–F) and leafy gametophores (G–I) that are similar to WT. Scale bar in B refers to D–F and scale bar in C refers to G–I.
To determine whether PpCESA5 interacts with class B PpCESAs in planta, we conducted a quantitative proteomic analysis of proteins that coIP with PpCESA5. A vector driving expression of HA-PpCESA5 under control of the native PpCESA5 promoter was transformed into ppcesa5KO-2 (Goss et al., 2012). Complementation of the mutant gametophore developmental phenotype was verified for a PpCESA5pro:HA-PpCESA5 line that was used for further analysis (Supplemental Figure S2). Peptides were prepared from HA-IP enriched solubilized membrane protein fractions from three independent preparations each of PpCESA5pro:HA-PpCESA5 and wild-type control lines. Samples were individually labeled with unique isobaric tandem mass tags (TMTs), combined, and analyzed in a single multiplexed mass spectrometry experiment to obtain protein identification and abundance ratios in the HA-PpCESA5-enriched samples versus the control samples. Peptide abundance levels were averaged between the three HA-PpCESA5-enriched samples and three control samples. PpCESA5 was enriched 25-fold in the IP samples compared with the control samples (Figure 3B). However, no other PpCESA proteins were enriched suggesting that PpCESA5 does not stably interact with other PpCESAs in gametophore tissue. In contrast to these results, both PpCESA6/7 and PpCESA8 were detected in an HA-PpCESA3-enriched fraction. However, PpCESA5 was not detected in HA-PpCESA3-, HA-PpCESA8-, or HA-PpCESA7-enriched IP fractions (Li et al., 2019). Several other proteins were identified with greater than four-fold enrichment in HA-PpCESA5 IP samples. These represent ubiquitous membrane or photosynthetic proteins that mainly localize to the chloroplast and likely represent abundant sample contaminants that do not form meaningful interactions with PpCESA5.
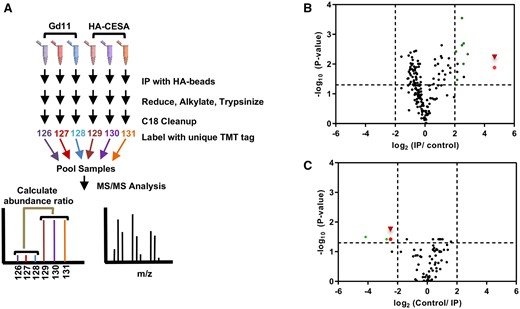
Quantitative proteomic analysis of PpCESA immunoprecipitated (IP) samples. A, Representative work-flow schematic of PpCESA IP sample processing. Solubilized membrane extracts from three independent WT Gd11 and transgenic lines expressing PpCESA5pro:HA-PpCESA5 were subjected to anti-HA affinity chromatography. Each sample was individually processed for mass spectrometry and labeled with a unique TMT isobaric tag, which were used to quantify peptide abundance level changes between control and transgenic samples. B, Volcano plot representing IP/control abundance ratios versus –log (P-value) for all proteins identified in HA-PpCESA5 IP experiments. C, An independent replicate experiment was performed in which the TMT tag order was reversed compared with the workflow described in (A), and the resulting volcano plot representing Control/IP abundance ratios versus –log (P-value) for all proteins are shown. Vertical dashed lines represent four-fold significance cutoff values, while the horizontal dashed line represents a P-value of 0.05. Green points represent abundant chloroplast or mitochondrial proteins, and the red points with arrowheads represent PpCESA5. P-values were calculated in Proteome Discoverer and the Benjamini–Hochberg correction for false-discovery rate was applied.
To confirm these results, three independent preparations each of PpCESA5pro:HA-PpCESA5 and wild-type control lines were subjected to HA-IP and trypsinolysis as described above. In this independent experiment, the TMT order was reversed compared with what is described in Figure 3A and during data processing, the ratio of control to IP samples was taken. Therefore, proteins that were enriched in the PpCESA5pro:HA-PpCESA5 IP relative to control should exhibit abundance ratios substantially less than 1. As demonstrated in Figure 3C, PpCESA5 is enriched in both experiments. However, none of the other proteins that were enriched more than four-fold in the first experiment were identified among the enriched proteins in this second experiment. This indicates that only the PpCESA5 self-interaction is consistent. These results further support the hypothesis that PpCESA5 self-interacts and that no additional PpCESA proteins associate with PpCESA5 under these experimental conditions. Protein assignment of PpCESA5 in these experiments was based on six peptides that were unique to PpCESA5 and quantifiable based on TMT reporter quantification. This result is likely due to the low protein abundance of PpCESA5 in gametophore tissue, but the sole enrichment of PpCESA5, and no other PpCESAs in HA-PpCESA5 IPs across two independent experiments and six technical replicates, is consistent. Additionally, it is possible due to the high sequence similarity between PpCESAs and the low abundance of PpCESA5-enriched protein, that other PpCESAs may have been co-purified with PpCESA5 but were not identified in these experiments. However, our data suggest that these putative protein complexes containing PpCESA5 and other hypothetical PpCESAs are of extremely low abundance if they are present, suggesting that the dominant isolated form of PpCESA5 exists as a homo-oligomeric complex.
Data reported above indicate that although PpCESA5 can interact with class B PpCESAs in heterologous systems (Figure 1), these isoforms are not major PpCESA5 interactors in planta (Figure 3) and PpCESA5 can sustain its role in gametophore morphogenesis when all four class B PpCESAs are deleted (Figure 2). These results, along with the earlier observation that PpCESA3 and PpCESA8 are not required for gametophore morphogenesis (Norris et al., 2017), support the hypothesis that PpCESA5 function in gametophore morphogenesis is independent of the other six PpCESAs.
Class A PpCESAs are not functionally interchangeable
We previously suggested that the class A PpCESAs are functionally interchangeable based on rescue of ppcesa5KO by constitutive expression of PpCESA3 or PpCESA8 (Scavuzzo-Duggan et al., 2018). However, this interpretation is inconsistent with evidence that PpCESA5 differs from PpCESA3 and PpCESA8 in its ability to self-interact and its lack of dependence on class B partners (Figures 1–3). To further examine functional interchangeability, we tested PpCESA7pro::PpCESA vectors for their ability to rescue ppcesa6/7KO-7A-lox as measured by the restoration of birefringence and pontamine fast scarlet 4B (S4B) staining in the leaf midribs (Norris et al., 2017). Polarization microscopy screening of stable antibiotic resistant lines with morphologically normal gametophores (12–15 lines per transformation) revealed little or no midrib birefringence for PpCESA7pro:PpCESA3 and PpCESA7pro:PpCESA8, but moderate to strong birefringence for 66% of PpCESA7pro:PpCESA5 lines as well and 100%, 92%, and 100% of PpCESA7pro:PpCESA4, PpCESA7pro:PpCESA7, and PpCESA7pro::PpCESA10 lines, respectively. Quantitative analysis of S4B staining in three lines from each transformation (Figure 4) confirmed that PpCESA7pro:PpCESA4 and PpCESA7pro:PpCESA10 rescued the ppcesa6/7KO phenotype, consistent with interchangeability of class B PpCESAs, and that PpCESA7pro:PpCESA3 and PpCESA7pro:PpCESA8 were unable to rescue ppcesa6/7KO (Figure 4), consistent with functional differentiation of class A and class B PpCESAs and the inability of PpCESA8 and PpCESA3 to function in the absence of a class B partner. However, full or partial rescue of ppcesa6/7KO was also confirmed for two independent PpCESA7pro:PpCESA5 lines (Figure 4). A third line, PpCESA7pro::PpCESA5-1, showed no rescue of the ppcesa6/7KO phenotype, but also had very low PpCESA5 expression based on analysis by western blotting (Supplemental Figure S3). Taken together, these results are consistent with functional differences among the class A PpCESAs, specifically that PpCESA3 and PpCESA8 require a class B partner and PpCESA5 does not.

Class A PpCESAs differ in their ability to rescue the ppcesa6/7KO phenotype. Quantitative analysis of S4B fluorescence in WT, ppcesa6/7KO-7A-lox (6/7KO), and ppcesa6/7KO-7A-lox transformed with PpCESA7pro:PpCESA expression vectors (denoted by PpCESA number and line number, separated by “R” to indicate attempted rescue). For each rescue genotype, three independent genetic lines were sampled in triplicate and measured with three samples each of WT and ppcesa6/7KO-7A-lox. Boxes show the means (center line) and the 95% confidence intervals (standard error of the mean) and whiskers indicate the ranges. Blue bars indicate means that are significantly different from WT, but not ppcesa6/7KO. Magenta bars indicate means that are significantly different from ppcesa6/7KO, but not WT. Medium gray bars indicate means that are significantly different from WT and ppcesa6/7KO. Light gray bars indicate means that do not differ significantly from WT or ppcesa6/7KO (Student’s t test, 0.05 P-value cutoff).
Given that PpCESA3 and PpCESA8 do not self-interact (Li et al., 2019) and require a class B partner to function in secondary cell wall deposition (Norris et al., 2017), it is surprising that they can substitute for PpCESA5 (Scavuzzo-Duggan et al., 2018), which functions without a class B partner in primary cell wall deposition (Figure 2). One possible explanation is that when expressed constitutively, PpCESA3 and PpCESA8 interact with class B PpCESAs that are present during gametophore morphogenesis but are not required as partners for PpCESA5. Since PpCESA4 and PpCESA10 are not expressed in gametophore buds (Tran and Roberts, 2016), we could test this hypothesis by making ppcesa5/6/7KOs and then assaying whether they were rescued with each of the class A PpCESAs. Stable antibiotic-resistant lines were recovered from a transformation of ppcesa6/7KO-1 (Norris et al., 2017) with the CESA5KO-npt vector and genotyped by PCR. Integration of the vector by homologous recombination and deletion of the target gene was verified for two lines (Supplemental Figure S4A), both of which lacked gametophores as expected when PpCESA5 is impaired (Goss et al., 2012). A ppcesa5/6/7KO line was transformed with vectors that drive expression of PpCESA5, PpCESA3, and PpCESA8, as well as PpCESA4 (clade B) and empty xt18 vector as negative controls. The stable lines resulting from these transformations were scored for presence or absence of gametophores (Scavuzzo-Duggan et al., 2015). In contrast to ppcesa5KO-2 (Scavuzzo-Duggan et al., 2018), ppcesa5/6/7KO was not rescued by vectors that drive constitutive expression of PpCESA3 and PpCESA8 (Figure 5). However, constitutive expression of PpCESA5 restored gametophore production in about 70% of transformed lines (Figure 5). Western blots confirmed protein expression for lines transformed with vectors that did not rescue the mutant phenotype (Supplemental Figure S5). Thus, PpCESA5 differs from PpCESA3 and PpCESA8 in functioning without a class B partner both in secondary cell wall synthesis and gametophore morphogenesis, as well as in its ability to self-interact and its failure to pull down other PpCESAs.
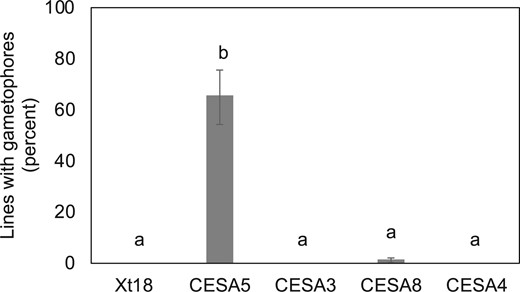
Class A PpCESAs differ in their ability to rescue the ppcesa5/6/7KO phenotype. Percentages of independent lines that produced gametophores when ppcesa5/6/7KO-2 was transformed with vectors driving constitutive expression of each of the class A PpCESAs (CESA5, CESA3, CESA8), a representative class B PpCESA (CESA4), and an empty negative control vector (xt18). Only PpCESA5 complemented the mutant phenotype. Percentages include the results of two trials for each vector (60–89 independent lines per treatment) and error bars show 95% confidence intervals. Bars with different letters designate statistically different means within each trial (P < 0.01, Fisher’s exact test).
PpCESA5 sustains gametophore morphogenesis in the absence of other PpCESAs
To test whether PpCESA5 can sustain gametophore morphogenesis in the absence of other PpCESAs, we created sextuple cesaKO lines. Starting with ppcesa6/7KO-7A-lox, which contains no antibiotic resistance cassette (Norris et al., 2017), we used CRISPR-Cas9 genome editing to disable PpCESA3, PpCESA8, PpCESA10, and PpCESA4. For each step, a background line was transformed with one or two vectors that drive expression of Cas-9 and sgRNAs targeting two sites within a PpCESA gene. Colonies selected for transient antibiotic resistance were screened by PCR to detect deletion of the region between the sites targeted by the sgRNAs (Supplemental Figure S6). The PCR products were sequenced to identify lines in which the deletion introduced a frame shift and premature stop codon or excised the catalytic domain. Supplemental Table S1 summarizes the genome modifications in lines that were used as background lines for the subsequent editing steps. All were free of off-target edits.
The ppcesa6/7/3/8KO and ppcesa6/7/3/8/10KO lines were similar to the ppcesa6/7KO-7A-lox background line with morphologically normal gametophores and cellulose deficient midribs. Following two transformations of ppcesa6/7/3/8/10KO-10 with the vector that targets PpCESA4, a new phenotype was observed in all lines in which large gene deletions introducing frame shifts were confirmed (Figure 6 and Supplemental Figure S6). These lines produced gametophores that were stunted. The same phenotype was observed in about 80% of the antibiotic resistant lines in which a deletion was not detected by PCR. To examine the relationship between phenotype and gene disruption, we sequenced additional PCR products (Supplemental Figure S6D) to compare lines that had no apparent deletion and stunted gametophores (lines 1, 2, 8, and 9) or normal gametophores (line 13). The results confirmed that the abnormal gametophore phenotype is consistently associated with substantial PpCESA4 disruption (Supplemental Figure S7). All lines with stunted gametophores were edited at one sgRNA target with introduction of a frameshift or a premature stop codon. Line 13 with normal gametophores had a small deletion that did not introduce a frameshift.
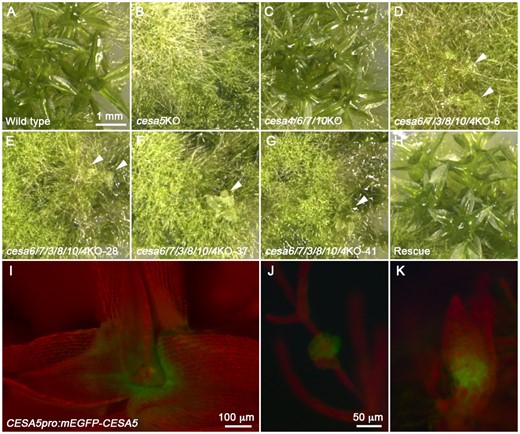
PpCESA5 alone sustains gametophore morphogenesis in the absence of other PpCESAs. In contrast to WT (A) and ppcesa5KO, which produces no leafy gametophores (B) and ppcesa4/6/7/10KO, which produces normal leafy gametophores (C), four independent ppcesa6/7/3/8/10/4KO lines produce colonies with stunted leafy gametophores (D–G, white arrow heads). Constitutive expression of PpCESA5 in ppcesa6/7/3/8/10/4KO-41 restored normal gametophore morphology (H). PpCESA5pro:mEGFP-PpCESA5 is expressed in the gametophore shoot apical meristems (I) and in gametophore buds before (J) and after (K) initiation of the first leaves. Scale bar in A refers to B–H and scale bar in J refers to K.
Whereas ppcesa5KO is characterized by gametophore meristem failure (Figure 9 in Goss et al., 2012), the formation of stunted gametophores in ppcesa6/7/3/8/10/4 KO indicates that PpCESA5 alone supports gametophore meristem function. Stunting indicates that either (1) PpCESA5 expression is inadequate to support development of morphologically normal leaves or (2) that this process requires additional PpCESA isoforms. To test this, we transformed ppcesa6/7/3/8/10/4 KO with a vector driving expression of PpCESA5 with either the native promoter or the constitutive Act1 promoter from rice. Constitutive expression of PpCESA5 restored normal gametophore morphogenesis (Figure 6 and Supplemental Figure S8), whereas an additional copy of PpCESA5pro:PpCESA5 did not (Supplemental Figure S9). When expressed from the native promoter, mEGFP-PpCESA5 rescues the ppcesa5KO phenotype. However, expression is limited to gametophore buds and the meristematic regions of developing gametophores (Figure 6). Taken together, these results indicate that PpCESA5 alone can sustain normal gametophore morphogenesis when constitutively expressed.
PpCESAs participate in protonemal development
Protonemal filaments of P. patens extend by apical cell division and tip growth, and undergo subapical branching to form colonies (Vidali and Bezanilla, 2012). To test whether class B PpCESAs are required for protonemal growth, we imaged chlorophyll autofluorescence of protonemal colonies from various ppcesaKOs and conducted a morphometric analysis of area, circularity, and solidity (Vidali et al., 2007; Bibeau and Vidali, 2014). Whereas colony area is a positive measure of polarized filament extension, circularity (the ratio of colony area to colony perimeter) and solidity (a measure of the presence of concavities with the colony) are both negative measures of tip growth (Vidali et al., 2007). Chlorophyll autofluorescence images of representative colonies from the analysis are shown in Supplemental Figure S10. When compared with wild-type controls, ppcesa4/6/7/10KO colonies had significantly higher solidity and circularity (Figure 7A), consistent with reduced growth. Similarly, ppcesa4/10KOs showed significant increases in solidity and circularity compared with wild-type (Figure 7C). In contrast, ppcesa6/7KO colonies were not significantly different from wild type (Figure 7B). We also analyzed single ppcesa4KOs and ppcesa10KOs (Norris et al., 2017). Solidity and circularity were slightly increased in ppcesa4KO lines compared with wild type, but significant differences were observed for only two of the three independent lines (Figure 7D). The ppcesa10KO lines did not differ significantly from the wild type for any measured parameter (Figure 7E). These results are consistent with partially redundant roles of PpCESA4 and PpCESA10 in protonemal growth.
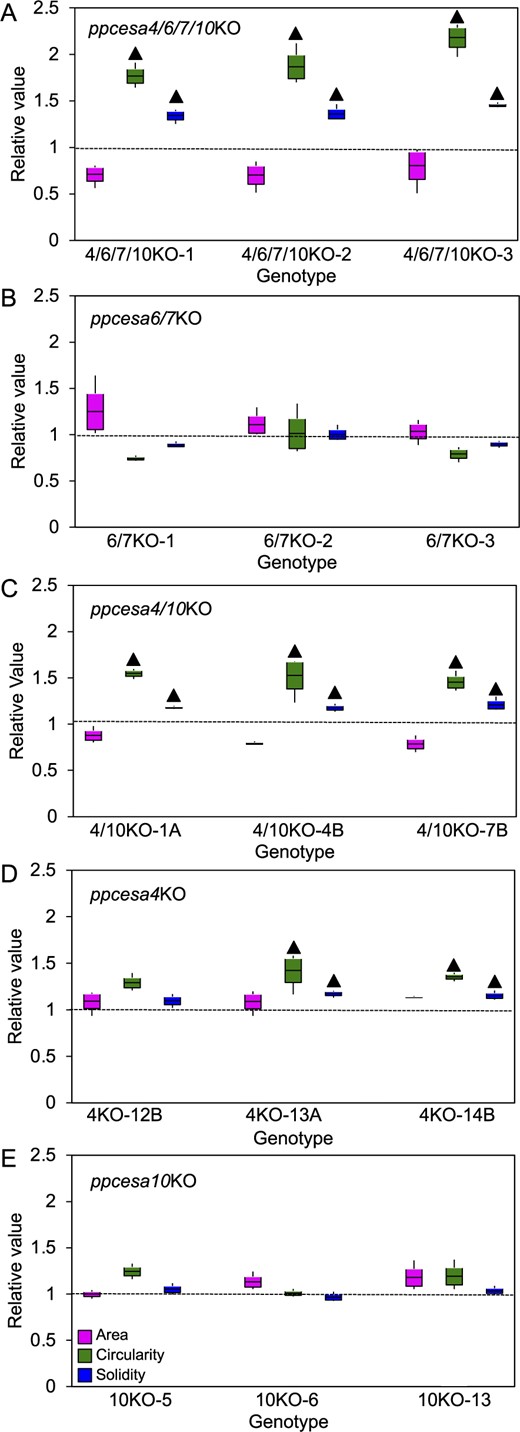
Morphometric analysis of protonemal colonies of PpCESA class B KO-mutant lines and WT P. patens. Protonemal colonies of P. patens cesa3/5/8KO (A), cesa6/7KO (B), cesa4/10KO (C), cesa4KO (D), and cesa10KO (E) mutant lines and WT line were analyzed for three parameters: area, circularity, and solidity. For each KO line, the mean for each replicate plate (n = 3) was divided by the mean for the WT measured in the same experiment (n = 3 replicate plates). Boxes show the means and the 95% confidence intervals (standard error of the mean) and whiskers indicate the ranges. Values larger than unity (dotted lines) indicate increases in KO lines compared with WT. Statistically significant differences between KO mutants and WT are indicated by “” (P < 0.05, one-way ANOVA with Tukey’s HSD post-hoc test). Examples of images used for this analysis are shown in Supplemental Figure S6.
To test whether class A PpCESAs are required for protonemal growth, we made triple ppcesa3/5/8KOs. We identified three independent KO lines from three transformations of ppcesa3/8KO-86-lox (Norris et al., 2017) with the CESA5KO-hph vector by PCR screening for 5′ and 3′ integration of the vector and deletion of the target gene (Supplemental Figure S4B). Similar to ppcesa4/6/7/10KO colonies, ppcesa3/5/8KO colonies had significantly greater circularity. Solidity was significantly greater for one line, whereas area was significantly smaller for all three lines (Figure 8A). In contrast, none of ppcesa3/8KOs were significantly different from wild type in any of the three parameters measured (Figure 8B). To test the role of PpCESA5, we used ppcesa5KOs generated by deleting the entire coding sequence. Two lines were not significantly different from the wild type. A third line showed slight, but significant increases in circularity and solidity compared with the wild type and was also significantly different from the other ppcesa5KO lines (Figure 8C).
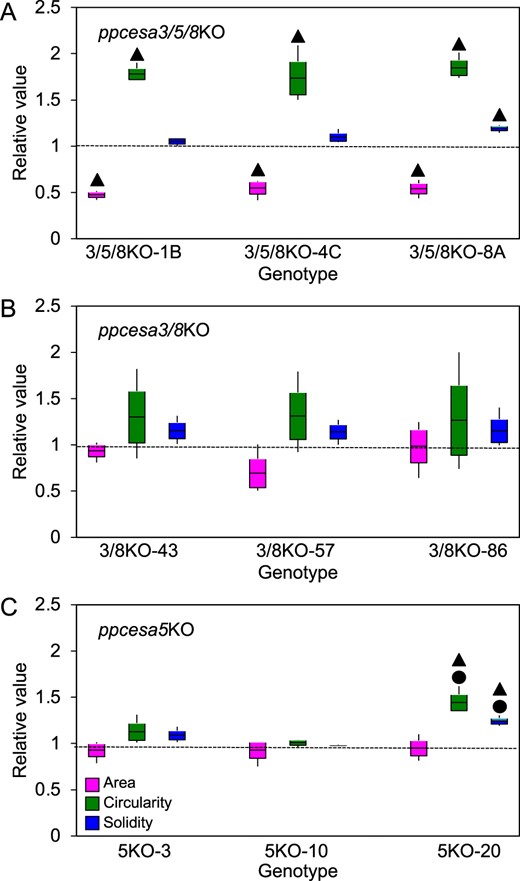
Mophometric analysis of protonemal colonies of PpCESA class A KO-mutant lines and WT P. patens. Protonemal colonies of P. patens cesa4/10KO (A), cesa3/8KO (B), and cesa5KO (C) mutant lines and WT line were analyzed for three parameters: area, circularity, and solidity. For each KO line, the mean for each replicate plate (n = 3) was divided by the corresponding mean for the WT measured in the same experiment (n = 3 replicate plates). Boxes show the means and the 95% confidence intervals (standard error of the mean) and whiskers indicate the ranges. Values larger than unity (dotted line) indicate increases in KO lines compared with WT. Statistically significant differences between KO mutants and WT are indicated by “” and statistically significant difference among independent KO lines are indicated by “●” (P < 0.05, one-way ANOVA with Tukey’s HSD post-hoc test). Examples of images used for this analysis are shown in Supplemental Figure S6.
We have shown that ppcesa6/7KOs have a much stronger secondary cell wall mutant phenotype than ppcesa4/10KOs (Norris et al., 2017), which is consistent with relatively weak PpCESA4 and PpCESA10 expression in gametophores (Tran and Roberts, 2016). To further examine whether PpCESA4 and PpCESA10 function primarily in protonemata or contribute substantially to gametophore development, we compared ppcesa4/6/7/10KOs with ppcesa4/10KOs, PpCESA6/7KOs, and wild type. As expected, ppcesa4/6/7/10KO midribs had substantially reduced midrib birefringence compared with wild type (Supplemental Figure S11). Quantitative analysis of S4B fluorescence showed that ppcesa4/6/7/10KOs had significantly reduced fluorescence compared with ppcesa4/10KOs, but they were not significantly different from ppcesa6/7KOs (Supplemental Figure S11E), indicating that PpCESA4 and PpCESA10 function primarily in protonemal development.
Class B PpCESAs are not required for caulonemal or rhizoid development
The quadruple clade B ppcesa4/6/7/10KOs were also tested for developmental defects in rhizoid and caulonema development. When cultured with auxin for two weeks, all three independent quadruple KOs produced leafless gametophores with several rhizoids similar to wild type (Supplemental Figure S12), indicating that PpCESA4, PpCESA6, PpCESA7, and PpCESA10 are not required for normal rhizoid development. When explants of quadruple KOs were cultured vertically in the dark, caulonemal filaments produced by the resulting colonies grew upright against gravity and were similar in appearance to wild-type controls (Supplemental Figure S13). Caulonemal length was also not significantly different between the mutant lines and wild-type lines (Supplemental Figure S13E).
Inactivation of PpCESA1 does not alter ppcesa KO phenotypes
After completing the work described above, we became aware that PpCESA1 (Pp3c9_11990V3.1), originally thought to be a pseudogene (Roberts and Bushoven, 2007), is expressed at a low level (Fernandez-Pozo et al., 2020). To eliminate the possibility that PpCESA5 was functioning as a hetero-oligomer with PpCESA1, we used CRISPR-Cas9 to inactivate PpCESA1 in three critical KO lines, ppcesa4/6/7/10KO-26, ppcesa6/7/3/8/10/4KO-41, and ppcesa6/7/3/8/10/4KO rescued by expression of PpCESA5 under control of the Act1 promoter, line 8 (Supplemental Figure S14). The gametophore phenotype was not altered by inactivation of PpCESA1 in any of these lines (Supplemental Figure S15). We also confirmed that PpCESA2 (Pp3c1_22600V3.1) is in fact a pseudogene with several nonsense mutations. The PpCESA9 transcript (Pp3c10_10270V3.1) encodes a 150 amino acid CESA fragment. Another small CESA fragment resides at locus Pp3c16_15210V3.1. PpCESA1, -2, and -9, as well as the fragment at locus Pp3c16_15210V3.1, belong to clade B.
Discussion
PpCESA5 functions as a homo-oligomer
Genetic and biochemical studies in seed plants have shown that both primary and secondary cell wall CSCs are obligate hetero-oligomeric with three non-interchangeable CESA isoforms (McFarlane et al., 2014). This has raised questions about whether distinct CESA isoforms are required for CSC assembly or microfibril synthesis (Guerriero et al., 2010). Genetic evidence reported here demonstrates that CESA5 function in P. patens does not depend on interaction with other PpCESA isomers. Gametophore meristem function in P. patens is CESA5 dependent (Goss et al., 2012). Thus, normal gametophore production in P. patens lines lacking all class B PpCESAs demonstrates that PpCESA5 does not require a class B partner (Figure 2) in contrast to the other class A PpCESAs (Norris et al., 2017). PpCESA5 also supports CESA-dependent gametophore meristem function at native expression levels and development of gametophores with normal morphology when expressed constitutively in the absence of all other PpCESAs (Figure 6 and Supplemental Figure S15).
Previously we reported that the class A PpCESAs are functionally interchangeable based on their shared ability to rescue gametophore defects when constitutively expressed in ppcesa5KO (Scavuzzo-Duggan et al., 2018) and midrib defects when expressed in ppcesa3/8KO midribs (Norris et al., 2017). Additional complementation experiments reported here revealed functional differences between the class A PpCESAs. In contrast to PpCESA3 and PpCESA8, PpCESA5 restored gametophore morphogenesis (Figure 5) and fully or partially rescued midrib development (Figure 4) in the absence PpCESA6/7 (Figure 9). PpCESA5 also differs from the class A secondary cell wall PpCESAs (Norris et al., 2017; Li et al., 2019) in its ability to self-interact in MbYTH assays (Figure 1) and in failing to coIP other PpCESAs (Figure 3). Taken together, these results support the hypothesis that whereas PpCESA3 and PpCESA8 function as hetero-oligomeric complexes containing both class A and class B members (Norris et al., 2017; Li et al., 2019), PpCESA5 can function as a homo-oligomeric complex. On this basis, we designate subclasses A1 for PpCESA5 and A2 for PpCESA3 and PpCESA8.
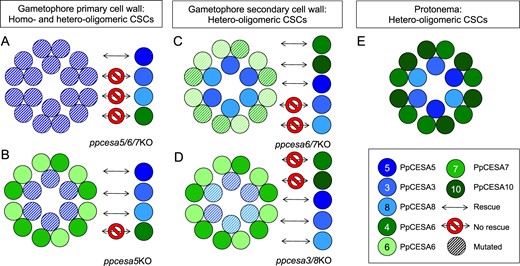
Summary of the roles of PpCESAs in P. patens development. Complementation assay results support participation of both homo-oligomeric (A) and hetero-oligomeric (B) CSCs in gametophore meristem function. The ppcesa5/6/7KO mutant phenotype (A) is rescued only by PpCESA5. The ppcesa5KO phenotype (B) is also rescued by PpCESA3 or PpCESA8, indicating that these class A isomers (blue) require a class B partner (green). The CSCs that synthesize gametophore secondary cell walls are hetero-oligomeric (C, D) with at least one member of class A and one member of class B. Assays testing for complementation of the midrib secondary cell wall phenotype demonstrate functional differentiation of class A and class B isomers (Norris et al., 2017). Rescue of ppceas6/7KO by PpCESA5, but not PpCESA3 and PpCESA8 (C), further supports the ability of PpCESA5 to function without a class B partner. Protonemal development requires PpCESA4 or PpCESA10 from class B and any class A PpCESA (E).
Although PpCESA5 can function in gametophore morphogenesis without a class B partner in ppcesa4/6/7/10/1KO lines, it interacts with PpCESA6 and PpCESA7 in MbYTH assays (Figure 1). Thus, both homo-oligomeric CSCs composed of PpCESA5 alone and hetero-oligomeric CSCs composed of PpCESA5 with PpCESA6 and/or PpCESA7 may participate in gametophore morphogenesis in wild-type P. patens (Figure 9). One interpretation of the difference between the ppcesa4/6/7/10/1KO phenotype (normal gametophores) and ppcesa6/7/3/8/10/4/1KO (stunted gametophores) is that PpCESA3 and PpCESA8 contribute to gametophore development, even in the absence of class B PpCESAs. Given that we have demonstrated two instances where PpCESA3 and PpCESA8 fail to function in the absence of a class B partner (i.e. rescue of gametophore development in ppcesa5/6/7KO and rescue of midrib secondary cell wall deposition in ppcesa6/7KO), the most parsimonious explanation for this observation is differences in the expression pattern of PpCESA5 in the quadruple KO versus the sextuple and septuple KO mutants. This is consistent with restoration of normal development by constitutive expression of PpCESA5 in ppcesa6/7/3/8/10/4/1KO. It does not rule out the possibility that PpCESA3/8 partnered with PpCESA6/7 contributes to leaf development in the wild type.
The possibility that seed plant CESAs can function in vivo as homo-oligomers has been suggested based on the observation that Populus tremula CESA8b is highly upregulated in tension wood, resulting in an isomer ratio that would permit PtCESA8b to form both homo- and hetero-oligomeric CSCs (Zhang et al., 2018). Both PpCESA5 and PttCESA8 from hybrid aspen synthesize fibrillar β-1,4-glucan in vitro (Purushotham et al., 2016; Cho et al., 2017). Trimeric assemblies of PttCESA8 were isolated from in vitro reactions, although no intact CSCs were observed (Purushotham et al., 2020). Together, these observations suggest that PpCESA5 may not be unique in its ability to form functional homo-oligomeric CSCs (Kumar and Turner, 2015; Haigler and Roberts, 2019).
Class A and class B PpCESA cooperate to support protonemal growth
The participation of PpCESA4 and PpCESA10 (class B) and the class A PpCESAs in protonemal growth is supported by the alteration of protonemal colony morphology (Vidali et al., 2007; Bibeau and Vidali, 2014) in ppcesa4/10KO (Figure 7) and ppcesa3/5/8KO lines (Figure 8). Redundant function of the class A PpCESAs in this process is supported by normal protonemal growth in ppcesa3/8KO and ppcesa5KO lines (Figure 8). Although the class B PpCESAs are functionally interchangeable in rescuing the ppcesa6/7KO phenotype (Figure 4), they appear to be partially subfunctionalized such that PpCESA4 and PpCESA10 function redundantly in protonemal growth (Figure 7) and PpCESA6 and PpCESA7 contribute primarily to secondary cell wall deposition (Figure 7 in Norris et al., 2017). This is also consistent with higher expression of PpCESA4 and PpCESA10 in protonemata compared with gametophores (Tran and Roberts, 2016). These results indicate that protonemal growth is similar to secondary cell wall deposition in requiring both class A and class B PpCESAs, but it differs in relying on PpCESA4 and PpCESA10 rather than PpCESA6 and PpCESA7 (Figure 7).
Extension by tip growth is characteristic of seed plant pollen tubes and root hairs, as well as moss protonemata and rhizoids (Rounds and Bezanilla, 2013). Although Arabidopsis cesa mutants have defects in pollen tube growth (Persson et al., 2007), mutant phenotypes, gene expression, and differential effects of cellulose synthesis inhibitors indicate that cellulose synthase-like D (CLSD) proteins are the primary cellulose synthases in Arabidopsis root hairs (Park et al., 2011), Nicotiana alata pollen tubes (Doblin et al., 2001), and rhizoids of the liverwort Marchantia polymorpha (Honkanen et al., 2016). In P. patens, bursting of protonemal tips treated with dichlorobenzonitrile, but not isoxaben, indicates that CSLD activity may be important for maintaining tip integrity. Although both inhibitors reduced the motility of fluorescent protein-tagged PpCESA5 and PpCESA8, neither altered protonemal growth rate (Tran et al., 2018). Notably protonemal growth in ppcesa4/6/7/10KO and ppcesa3/5/8KO lines was not abolished, suggesting that either cellulose is not essential or that a cellulose-like cell wall polysaccharide is synthesized by CSLDs during this process. Protonemal extension occurs at the cell apex (Menand et al., 2007) and the morphometric analysis used here was designed to detect changes in tip growth (Vidali et al., 2007; Bibeau and Vidali, 2014). However, we have not measured tip growth directly, and thus we cannot rule out the possibility that disabling PpCESAs affects protonemal growth in other ways. Unraveling the roles of CESAs and CSLDs in protonemal development will be an interesting focus for future work.
Class B PpCESAs are not required for rhizoid formation or growth based on normal development of these structures in ppcesa4/6/7/10KO lines (Supplemental Figures S9 and S10). Rhizoids also developed normally ppcesa3/8KO lines (Norris et al., 2017). However, we could not test for rhizoid formation in ppcesa5KO or ppcesa3/5/8KO because they lack gametophores, where rhizoids are initiated. Thus, CESA5 may be responsible for cellulose synthesis in rhizoids.
Functional specialization of PpCESAs
Combining results from this and previous studies, we can now propose a model for the roles of each of the PpCESAs in P. patens development (Figure 9). We have shown that PpCESA5 (class A1) is unique in its ability to function as a homo-oligomer, although we cannot rule out the possibility that it is also capable of forming hetero-oligomeric complexes with class B PpCESA. In contrast, PpCESA3 and PpCESA8 (class A2) function only with class B PpCESA, based on their ability to rescue ppcesa5KO, but not ppcesa5/6/7KO. When interpreted in light of the constructive neutral evolution hypothesis (Doolittle, 2012; Finnigan et al., 2012), these results provide insight into the evolution of CSCs in the moss and seed plant lineages (Roberts et al., 2012; Scavuzzo-Duggan et al., 2018; Haigler and Roberts, 2019). Phylogenetic analysis reveals (1) that hetero-oligomeric CSCs evolved from a homo-oligomeric CSC (i.e. the common ancestor of mosses and seed plants had a single CESA gene) and (2) that the moss and seed plants CESA families evolved independently (i.e. moss and seed plant CESAs occupy separate branches in phylogenetic trees) (Roberts and Bushoven, 2007; Yin et al., 2009; Carroll and Specht, 2011). As we described previously, the existence of hetero-oligomeric CSCs in both mosses and seed plants is best explained by convergent evolution of the hetero-oligomeric state (Norris et al., 2017) and the constructive neutral evolution hypothesis provides a plausible mechanism (Scavuzzo-Duggan et al., 2018). Constructive neutral evolution acts as ratchet, driving neofunctionalization as paralogs that occupy the same complex lose their ability to form homo-oligomeric complexes through self-interaction. This hypothesis predicts that evolution of obligate hetero-oligomeric protein complexes is a likely outcome of whole-genome duplications, and thus explains convergent evolution of these complexes in mosses and seed plants (Doolittle, 2012; Finnigan et al., 2012). The constructive neutral evolution hypothesis also asserts that the paralogous subunits of protein complexes become specialized in the absence of selection for functional differentiation. This has important implications as we examine how different CESA subunits contribute to CSC function.
In Arabidopsis, the obligate hetero-oligomeric CSCs that synthesize primary and secondary cell walls are composed of different sets of three CESA isoforms that are non-interchangeable (McFarlane et al., 2014) and thus, fully neofunctionalized. In contrast, the P. patens CESA family allows us to examine an intermediate stage in this process. Results reported here show that PpCESA5 has not lost its ability to function as a homo-oligomer and that all of the PpCESAs retain greater interchangeability compared with AtCESAs. This is consistent with the operation of constructive neutral evolution over a shorter period of time as expected given that the genome duplications that produced the PpCESA paralogs occurred more recently (Lang et al., 2018). Furthermore, because it has one CESA (PpCESA5) that is capable of functioning as a homo-oligomer and two related isoforms (PpCESA3 and PpCESA8) that have lost much of their ability to self-interact, P. patens provides an opportunity to identify the mutations that were responsible for the loss of self-interaction in PpCESA3 and PpCESA8 through complementation with domain swapped and mutagenized PpCESAs.
Materials and methods
Vector construction
Split-ubiquitin MbYTH vectors
cDNA templates for PpCESA4 (DQ902545) and PpCESA5 (DQ902546) were obtained from RIKEN BioResource Center, Tsukuba, Ibaraki Japan (clones pdp21409 and pdp24095, respectively). Preparation of a cDNA template for PpCESA10 (PNR47708.1) was described previously (Scavuzzo-Duggan et al., 2018). Bait vectors (Cub) were constructed by amplifying the full-length PpCESAs from cDNA templates as described previously (Timmers et al., 2009) using appropriate primers (Supplemental Table S2) and ligating them into pTFB1 (Dualsystems Biotech AG, Zurich, Switzerland) in-frame and downstream of the C-terminal half of ubiquitin and the chimeric transcriptional reporter LexA-VP-16. Prey vectors (NubG) were constructed by ligating the amplified PpCESAs into pADSL-Nx (Dualsystems Biotech AG) in-frame and downstream of the N-terminal half of ubiquitin. All vectors were sequence verified. Construction of bait and prey vectors for PpCESA3, PpCESA6, PpCESA7, and PpCESA8 was reported previously (Li et al., 2019).
KO vectors
The CESA5KO vectors were constructed using Gateway Multisite Pro cloning (Invitrogen, Grand Island, NY, USA) as described previously (Roberts et al., 2011). Flanking sequences were amplified using appropriate primers (Supplemental Table S2) and Phusion DNA polymerase (New England Biolabs, Ipswich, MA), cloned into pDONR 221 P1–P4 and pDONR 221 P3–P2 using BP Clonase II (Invitrogen), and sequence-verified. For CESA5KO-hph conferring hygromycin resistance, entry clones with flanking sequences in pDONR 221 P1–P4 and pDONR 221 P3–P2 were inserted into BHSNRG (Roberts et al., 2011). For CESA5KO-npt conferring G418 resistance, entry clones with flanking sequences in pDONR 221 P1–P4 and pDONR 221 P3–P2 were linked with an entry clone containing the nph selection cassette (Norris et al., 2017) and inserted into pGEM-gate (Vidali et al., 2009) using LR Clonase II Plus (Invitrogen). Construction of the CESA6/7KO vector was described previously (Norris et al., 2017). The vectors were linearized with NcoI (CESA5KO-hph), NotI (CESA5KO-npt), or BsrGI (CESA6/7KO) for transformation into P. patens.
HA-PpCESA and mEGFP-PpCESA expression vectors
Expression vectors for HA-tagged PpCESAs under control of PpCESA promoters were constructed using Gateway Multisite Pro cloning (Invitrogen). PpCESA5 and PpCESA7 promoters cloned in pDONR 221 P1-P5r (Tran and Roberts, 2016) were linked to HA-PpCESA coding sequences in pDONR 221 P5-P2 (Norris et al., 2017) and inserted into pSi3(TH)GW (Tran and Roberts, 2016) using LR Clonase II Plus (Invitrogen). These vectors target the expression cassettes to the intergenic 108 locus, which can be disrupted with no effect on phenotype (Schaefer and Zryd, 1997). A vector driving expression of PpCESA5 under control of the constitutive rice Act1 promoter was constructed as described previously (Scavuzzo-Duggan et al., 2018) using an entry clone amplified from 3XHA-CESA5 in xt18 (Burris et al., 2021). Construction of vectors driving expression of PpCESA3, PpCESA4, and PpCESA8 under control of the constitutive rice Act1 promoter was described previously (Scavuzzo-Duggan et al., 2018). An entry clone encoding an mEGFP-PpCESA5 translational fusion in pDONR 221 P5-P2 was constructed by PCR fusion of the mEGFP coding sequence amplified from an expression clone containing the pDONR 221 P1-P5r mEGFP entry clone (gift of Magdalena Bezanilla) and the PpCESA5 coding sequence amplified from expression clone 3XHA-CESA5 in xt18 using the appropriate primers (Supplemental Table S2) as described previously (Scavuzzo-Duggan et al., 2015). The entry clone was inserted into pSi3(TH)GW along with the pDONR 221 P1-P5r entry clone containing the PpCESA5 promoter (Tran and Roberts, 2016). All expression vectors were linearized with SwaI for transformation into P. patens.
CRISPR-Cas9 vectors
CRISPR-Cas9 vectors were constructed as described previously (Mallett et al., 2019). Protospacers targeting two sites within PpCESA3, PpCESA8, PpCESA4, and PpCESA10 (Supplemental Table S2) were designed using CRISPOR at http://crispor.tefor.net/ (Haeussler et al., 2016). The two protospacers targeting each gene were cloned, respectively, into entry vectors pENTR-Ppu6p-sgRNA-L1R5 and pENTR-Ppu6p-sgRNA-L5L2 for tandem insertion into a destination vector. Protospacers were annealed as described previously (Mallett et al., 2019) and ligated into pENTR-PpU6p-sgRNA entry vectors using Golden Gate assembly (New England Biolabs) in 10 μL reactions containing 37.5 ng of entry vector and 1.1 μL of a 1,000× dilution of annealed protospacer incubated at 37°C for 1 h and 60°C for 5 min. Entry vectors encoding sgRNAs that target PpCESA3 or PpCESA10 were cloned into pMK-Cas9-gate conferring G-418 resistance and those encoding sgRNAs that target PpCESA8 or PpCESA4 were cloned into pMH-Cas9-gate conferring hygromycin resistance using LR Clonase II Plus according to the manufacturer’s instructions (Invitrogen). All plasmids were sequence verified.
MbYTH assay
Interactions between PpCESAs were tested using an MbYTH assay as described previously (Li et al., 2019). Briefly, yeast strain NMY51 was co-transformed with PpCESA bait and prey vectors or control vectors provided in the kit (DUAL Membrane Kit 1, DualSystems Biotech AG) and cultured for 3 d at 30°C on solid synthetic medium lacking leucine (auxotrophic selection marker for the bait vector pTFB1) and tryptophan (auxotrophic selection marker for prey vector pADSL-Nx). Expression of auxotrophic growth markers ADE2 and HIS3 was monitored by growth on medium lacking adenine and histidine in the presence of 3-aminotriazole (3-AT) (Timmers et al., 2009) and bait was screened for auto activation in medium containing 3-AT to test for auto activation. Interactions were tested for each bait/prey combination by streaking 100 colonies on selective medium with 3-AT and counting after 3 d.
Culture and transformation of P. patens
Wild-type and transformed P. patens lines were cultured on basal medium supplemented with ammonium tartrate (BCDAT). For stable transformation, protoplasts were generated and transformed as described previously (Roberts et al., 2011) with KO or HA-PpCESA expression vectors. Stably transformed lines were collected after two rounds of selection with the appropriate antibiotic. For transformation of ppcesa6/7/3/8/10/4KO-41, 3% mannitol (w/v) was included in the first round of selection medium and selection was started 7 d after transformation. Potential KO lines were PCR genotyped as described previously (Norris et al., 2017) using primers and annealing temperatures listed in Supplemental Table S2. Protein expression was verified by western blot for lines transformed with HA-PpCESA expression vectors as described in Scavuzzo-Duggan et al. (2015). For CRISPR-Cas 9 editing, protoplasts were transformed as for stable transformation, but transiently transformed lines were selected for genotyping after one round of selection (Mallett et al., 2019). Genomic DNA isolated as described previously (Roberts et al., 2011) was amplified with primers (Supplemental Table S2) flanking the target sites and also potential off-target sites predicted by CRISPOR (Haeussler et al., 2016). PCR products were analyzed by gel electrophoresis to identify large deletions and sequenced to confirm editing at target sites and absence of editing at off-target sites.
Co-immunoprecipitation and proteomic analysis
Protein was extracted from gametophore tissue from a P. patens line expressing HA-PpCESA5 under control of the native promoter and immunoprecipitated as described previously (Li et al., 2019). Briefly, tissue was ground in liquid nitrogen, combined with ice-cold IP buffer (Li et al., 2019), incubated on ice for 30 min with occasional inversion, and centrifuged at 20,000 × g for 30 min. The supernatant was incubated with Pierce Anti-HA Magnetic Beads (Thermo Fisher Scientific) for 50 min. Beads were collected and eluted in elution buffer (8 M Urea,150 mM NaCl, 25 mM NH4HCO3). Samples were reduced and alkylated as described previously (Li et al., 2019). Briefly, eluate was reduced for 30 min at 37°C with 5 mM dithiothreitol (DTT), alkylated for 30 min at 25°C with 15 mM iodoacetamide (IAA), and quenched with 5 mM of DTT for 15 min at 25°C. Tryptic peptides were generated, purified, and TMT labeled and describe in Li et al. (2019). Briefly, samples diluted to 1.5 M urea were digested with trypsin at 37°C for 16 h and tryptic peptides were purified and dried. Dried samples were resuspended in 100 mM triethyl ammonium bicarbonate, combined with their respective TMT label reagent, and incubated at 25°C for 16 h. Reactions were quenched with 5% (w/v) hydroxylamine and TMT-labeled peptides were purified and resuspended in 0.1% (v/v) formic acid for mass spectrometry analysis as described below. Finally, mass spectrometry was performed and data were analyzed as described previously (Li et al., 2019). Briefly, TMT-labeled peptides were separated using an UltiMate 3000 RSLCnano system (Thermo Scientific) on a self-packed UChrom C18 column (100 µm × 35 cm). Mass spectrometry was performed on an Orbitrap Fusion mass spectrometer (Thermo Scientific). An MS3 multi-notch approach was used for TMT analysis. Data analysis was performed using Sequest (Thermo Scientific, v.27 rev.11) and Proteome Discover (Thermo Scientific, v.2.1). The resulting mass spectrometry data were searched against the P. patens UNIPROT database using SEQUEST. The full dataset containing all identified peptides in this experiment is included in Supplemental Data Set S1.
Phenotype analysis
Polarization microscopy of cell wall birefringence
Stable lines recovered from transformation of ppcesa6/7KO-7A-lox with various PpCESA7pro::PpCESA vectors were screened for complementation of the mutant phenotype by polarization microscopy to select lines for quantitative analysis by fluorescence histochemistry as described below. Cell wall birefringence of leaf midribs was imaged as described previously (Norris et al., 2017). Images were captured using identical settings for the KO mutants and the wild-type control.
Pontamine fast S4B fluorescence histochemistry
S4B fluorescence arising from leaf midribs was quantified in PpCESAKO lines and PpCESAKO lines transformed with PpCESA7pro::PpCESA expression vectors. Gametophore leaves were stained with S4B and imaged, and images were analyzed as described previously (Norris et al., 2017). For mutant analysis, three independent lines of each KO genotype (n = 3) and three independent explants of wild type (n = 3) were sampled in triplicate. For analysis of rescue lines, three independent explants of each genetic line (n = 3) were sampled in triplicate. cesaKO lines were compared using a one-way analysis of variance (ANOVA) followed by post hoc Tukey Honest Significant Difference (HSD) test, and rescued lines were compared with wild-type and background ppcesaKO lines using a Student’s t test. Transgene expression was verified by western blot as described previously (Scavuzzo-Duggan et al., 2015).
Gametophore morphogenesis complementation assay
Stable lines resulting from transformation of ppcesa5/6/7KO-2 with Act1pro::PpCESA expression vectors or an empty control vector were arrayed and scored for complementation as described previously (Scavuzzo-Duggan et al., 2015; Scavuzzo-Duggan et al., 2018). The number of independent lines scored per treatment ranged from 120 to 178 and 95% confidence intervals were calculated using the Wilson Score method (Wilson, 1927; Newcombe, 1998). Statistical analysis was preformed using a two-tailed Fisher’s exact test of independence (Sokal and Rohlf, 1981) as described previously (Scavuzzo-Duggan et al., 2018). Transgene expression was verified by western blot as described previously (Scavuzzo-Duggan et al., 2015) for vectors that failed to complement.
Analysis of caulonema and rhizoid development
Caulonema and rhizoid assays were carried out as previously described (Roberts et al., 2011) to test ppcesa4/10KO, ppcesa6/7KO, ppcesa4/6/7/10 KO lines for phenotypic changes. For the caulonema and rhizoid assays, samples were analyzed using a Leica M165FC stereomicroscope and images were recorded using a Leica DFC310FX camera (Leica). The length of caulonema was measured as described in Norris et al. (2017). Three independent experiments (n = 3) were done. For each experiment, caulonema colonies were cultured on seven replicate plates containing solid BCDAT medium supplemented with 35 mM sucrose. Four explants were placed along the equator of each plate, with each explant representing a unique genotype.
Protonema colony morphology assay
Colony morphology was analyzed as described previously (Vidali et al., 2007; Bibeau and Vidali, 2014). Protoplasts were isolated from three independent lines for each genotype along with three biological replicates of wild-type using the method described previously (Roberts et al., 2011). However, it was necessary to add 21 units/mL of cellulase from Trichoderma reesei (Worthington Biochemical Corporation, Lakewood, NJ, USA) to the digestion mixture when using driselase lot # SLBP0654V (Sigma-Aldrich, St. Louis, MO, USA) for effective digestion. Five thousand protoplasts suspended in 1 mL of PRML were spread on each of three plates containing PRMB medium overlain with cellophane. The plates were incubated at 25°C with constant illumination at 50–80 μmol/m2/s for 4 d and cellophane membranes were then transferred to BCDAT plates for an additional 2 d. Colony morphology was documented by capturing chlorophyll autofluorescence images of approximately 50 regenerated protoplasts per plate at 63× magnification using an M165FC stereo microscope with 10447407 GFP filter and DFC310FX camera (Leica). Images were analyzed for area, solidity, and circularity with ImageJ (National Institutes of Health, USA) using a macro developed by Vidali et al. (2007).
Accession numbers
Sequence data from this article can be found in the GenBank/EMBL data libraries under accession numbers XM_024529261.1, XM_024527060.1, XM_024528639.1, XM_024507389.1, DQ160224.1, DQ160225.1, XM_024515618.1, and XM_024529472.1.
Supplemental data
Supplemental Figure S1. PCR-based genotyping of ppcesa4/6/7/10KO lines.
Supplemental Figure S2. Phenotype rescue of PpCESA5pro:HA-PpCESA5.
Supplemental Figure S3. Western blot analysis of protein expression for P. patens lines derived from transformation of ppcesa6/7KO-7A-lox protoplasts with vectors driving expression of PpCESA3, PpCESA4, PpCESA5, PpCESA7, PpCESA8, and PpCESA10 under control of the PpCESA7 promoter.
Supplemental Figure S4. PCR-based genotyping of ppcesa5/6/7KO and ppcesa3/5/8KO lines.
Supplemental Figure S5. Western blot analysis of protein expression for P. patens lines derived from transformation of ppcesa5/6/7KO-2 protoplasts with vectors driving expression of PpCESA3, PpCESA4 or PpCESA8.
Supplemental Figure S6. PCR-based genotyping of ppcesa6/7/3/8/10/4KO lines.
Supplemental Figure S7. Schematic summarizing edits induced when ppcesa6/7/3/8/10KO-10 was transformed with a vector that drives expression of Cas-9 and sgRNAs targeting two sites within PpCESA4 determined by sequencing PCR products shown in Supplemental Figure S11D.
Supplemental Figure S8. Gametophore morphology and western blot analysis of HA-CESA5 expression for selected lines resulting from stable transformation of ppcesa6/7/3/8/10/4KO-41 with a vector driving expression of 3XHA-CESA5 with the constitutive Act1 promoter from rice or a control empty vector.
Supplemental Figure S9. Gametophore morphology and western blot analysis of HA-CESA5 expression for selected lines resulting from stable transformation of ppcesa6/7/3/8/10/4KO-41 with a vector driving expression of HA-CESA5 with the native promoter or a control empty vector.
Supplemental Figure S10. Chlorophyll autofluorescence micrographs of representative (median area) colonies of P. patens wild-type ppcesaKO protonemal colonies.
Supplemental Figure S11. The class B PpCESAs have different roles in secondary cell wall deposition in leaf midrib stereid cells.
Supplemental Figure S12. Class B PpCESAs are not required for rhizoid development.
Supplemental Figure S13. Class B PpCESAs are not required for caulonema development and gravitropism.
Supplemental Figure S14. PCR-based genotyping of PpCESA1KO in various genotypes.
Supplemental Figure S15. Inactivating PpCESA1 does not alter the phenotypes of KO lines.
Supplemental Table S1. Summary of genome edits in lines used for subsequent editing steps.
Supplemental Table S2. Oligonucleotides used for vector construction and genotype analysis.
Supplemental Data set S1. Peptide identifications for all proteins identified using Co-IP mass spectrometry.
Funding
This work was supported by the National Science Foundation Awards IOS-1257047 (to A.W.R., J.H.N., and L.M.T.) and MCB-1750359 (to I.S.W.). CRISPR-Cas9 genome editing was supported by a University of Rhode Island Research Bridge Grant (K.Y. contribution) and as part of the Center for LignoCellulose Structure and Formation, an Energy Frontier Research Center funded by the U.S. Department of Energy, Office of Science, Office of Basic Energy Sciences under Award Number DE-SC0001090 (A.M.C. contribution). DNA sequencing was conducted using the Rhode Island Genomics and Sequencing Center, a Rhode Island NSF EPSCoR research facility, supported in part by the National Science Foundation EPSCoR Cooperative Agreement EPS-1004057. Proteomic analyses were performed at the Nevada Proteomics Center, which is supported by Nevada INBRE, a grant from the National Institute of General Medical Sciences within the National Institutes of Health under Award Number P20GM103440.
Conflict of interest statement. None declared.
A.W.R., I.S.W., J.H.N., and L.M.T. conceived the original research plans and supervised the experiments. X.L., A.M.C., D.C.T.D., N.M., K.Y., T.L.S., and J.H.N. designed and performed the experiments and analyzed the data. X.L. and A.W.R. wrote the article with contributions of all the authors. A.W.R. agrees to serve as the author responsible for contact and ensure communication.
The author responsible for distribution of materials integral to the findings presented in this article in accordance with the policy described in the Instructions for Authors (https://dbpia.nl.go.kr/plphys/pages/General-Instructions) is Alison Roberts ([email protected]).
References
Author notes
These authors contributed equally to this work and are listed in alphabetical order.
Senior author.
Present addresses: Xingxing Li, Department of Biochemistry and Molecular Biology, Michigan State University, East Lansing, Michigan 48824, USA.
Nasim Mansoori, Zymergen Inc., Emeryville, California 94608, USA.
Kai Yuan, Molecular and Cellular Biology Graduate Program, Dartmouth College, Hanover, New Hampshire 03755, USA.
