


Abstract
The documentation of plant growth and development requires integrative and scalable approaches to investigate and spatiotemporally resolve various dynamic processes at different levels of plant body organization. The present update deals with vigorous developments in mesoscopy, microscopy and nanoscopy methods that have been translated to imaging of plant subcellular compartments, cells, tissues and organs over the past 3 years with the aim to report recent applications and reasonable expectations from current light-sheet fluorescence microscopy (LSFM) and super-resolution microscopy (SRM) modalities. Moreover, the shortcomings and limitations of existing LSFM and SRM are discussed, particularly for their ability to accommodate plant samples and regarding their documentation potential considering spherical aberrations or temporal restrictions prohibiting the dynamic recording of fast cellular processes at the three dimensions. For a more comprehensive description, advances in living or fixed sample preparation methods are also included, supported by an overview of developments in labeling strategies successfully applied in plants. These strategies are practically documented by current applications employing model plant Arabidopsis thaliana (L.) Heynh., but also robust crop species such as Medicago sativa L. and Hordeum vulgare L. Over the past few years, the trend towards designing of integrative microscopic modalities has become apparent and it is expected that in the near future LSFM and SRM will be bridged to achieve broader multiscale plant imaging with a single platform.
The complex development of plants in space and time presents imaging challenges.
Developmental imaging by different light-sheet-based modalities can address subcellular, cellular, tissue, and organ dynamics in plants with minimal disturbances and at enhanced resolution when combined with SRM methods.
The imaging capabilities of LSFM and SRM are increasingly translated to crops such as alfalfa and barley, providing insights in cellular and tissue dynamics during growth, thus deepening our understanding of regulatory mechanisms useful for the development of strategies for biotechnological crop improvement.
Recent advances in super-resolution imaging and the recent application of STED and RESOLFT open possibilities in live SRM imaging of plants at 3D.
Introduction
Progress in plant sciences requires complex understanding of structural and molecular organization of the plant body. Imaging of plants, however, is challenging as they are organisms with elaborate and highly dynamic development over space and time scales (Komis et al., 2018; Ovečka et al., 2018; Prunet and Duncan, 2020). Most advances of imaging technologies utilized in biologically oriented research, stem from progress in animal and human science. The spatiotemporal documentation of plant development with different light-sheet-based modalities brought insights into plant complexity, addressing subcellular, cellular, and tissue dynamics in whole plants with minimal disturbances (Ovečka et al., 2018). Through adaptation and application of super-resolution microscopy (SRM) methods sensitive enough to bring structural details at subcellular and supramolecular levels of both fixed and living cells, astonishingly enhanced resolution of plant imaging can be achieved (Komis et al., 2018). Here, we provide an update on current achievements in the imaging of plant cells and organs during the last 3 years. These include multi-dimensional volumetric observations of intact developing plants by original applications of light-sheet fluorescence microscopy (LSFM) and the visualization of organelles and subcellular compartments in plant cells by downscaling of the resolution limits with established or recently implemented SRM methods. Applications of LSFM and SRM in plants are opening the door to additional approaches for large and challenging samples, providing gentle, high-speed, high-resolution, and deeper imaging. The current trend shows shifting from purely basic to applied research. Advanced imaging of crops is a next milestone in the effort to improve their development, yield, and stress resistance. DeVree et al. (2021) recently comprehensively reviewed SRM methods used on plant cell wall components; therefore, this topic is not covered here.
Light-sheet fluorescence microscopy
The current efforts to study plant cells, tissues, organs, and whole plants in developmentally oriented research by live-cell imaging are based on advanced microscopy platforms. LSFM includes microscopy methods with a unique geometry of imaging modalities, which is conceptually distinct from classical widefield-based or pointillistic illumination systems. Two main technical innovations that hallmarked LSFM as a breakthrough in microscope technology, originate from the utilization of a thin light sheet for excitation, and from uncoupling the excitation and detection pathways that are positioned orthogonally to each other. By moving of the thin light sheet through the sample, the excitation optical system illuminates only a single plane at a time, providing thus intrinsic optical sectioning ability for the whole volume of the sample. As this mode of illumination is transmitted by an independent illumination objective(s), the particular excited single plane in the sample serves as one illuminated focal plane. Fluorescence is only emitted from this defined illuminated focal plane and is consequently acquired by an independent detection objective, which is positioned perpendicularly to the axis of the single illuminated plane. Importantly, the axial sectioning capability is defined by the thickness of the generated light sheet, which is equal to or even less than the focal depth of the detection objective. This eliminates out-of-focus fluorophore excitation, alleviating photobleaching and phototoxicity, considerably increasing the signal-to-noise ratio, and allowing for spherical aberration-free detection (Weber and Huisken, 2011). The emitted fluorescence signal from the focal plane illuminated by the light sheet (the entire field of view) is collected by a full-frame camera system. The implementation of Electron Multiplying Charge-Coupled Devices (EMCCD) or scientific Complementary Metal Oxide Semiconductors (sCMOS) considerably increased the speed and sensitivity of acquisition, enabling observations of fast events in living organisms with high temporal and spatial resolution, while still utilizing very low levels of excitation energy.
Profiting from high-speed acquisition of a large field of view, together with full volumetric (along x-, y-, and z-axes) and multi-angle (in a range of 360°) imaging, LSFM became a popular imaging technique for multidimensional visualization of intact robust biological samples, providing near isotropic spatial resolution. Although originally designed for the study of early developmental processes in animals, these methods were established as ideal for subcellular, cellular, tissue, and organ developmental multiscale imaging of plants (Table 1). The implementation of systems controlling environmental conditions, such as perfusion pumps for continuous supply of nutrients and diurnally adjusted external light sources, allowed long-term live and developmental imaging of plants within experiments lasting for hours or even days (reviewed in Ovečka et al., 2018). Of particular interest to plant scientists is a geometry of LSFM systems where illumination and detection objectives are arranged horizontally. In such systems, intact plants mounted on special holders can be introduced vertically in the observation chamber and kept in natural orientation according to the gravitational vector during imaging. Moreover, sample holders can be adjusted and regions of interest in the imaged plant can be positioned precisely in front of the detection objective. Protocols for sample preparation, especially for imaging of growing roots, are based on the so-called “open system” for mounting, insertion, and maintenance of intact plants in LSFM chambers and securing aeration of their green parts (Baesso et al., 2018; Madison et al., 2020). Although the geometry of LSFM platforms and features of particular samples may still pose some limitations in imaging depth, resolution and speed (Supplemental Table S1), these adaptations allowed the true long-term developmental imaging of viable and continuously growing plants over hours and days.
Overview of plant volumetric LSFM imaging used in the last 3 years
| Aim | Plant, nematode and fungal species | Studied sample (cell/tissue/organ/whole plant fixed/living, sample modifications) | Imaging method | References |
|---|---|---|---|---|
| Tissue specific and developmentally regulated localization of PLDα1 (PLDα1-YFP) | Arabidopsis thaliana Col-0, pldα 1-1, pldα 1-2 | Whole root, root cap, and rhizodermis cells (live-imaging) | LSFM | Novák et al. (2018) |
| Plant–nematode interactions in the rhizosphere | Arabidopsis thaliana Nicotiana benthamiana Nicotiana tabacum Lactuca sativa Petunia multiflora Free living nematodes from soil | Whole root (live-imaging) |
| O’Callaghan et al. (2018) |
| Plant–fungi interactions in the rhizosphere | Arabidopsis thaliana Piriformospora indica Mortierella hyaline Verticillium dahlia Alternaria brassicicola | Whole root (live-imaging) | LSFM | Meents et al. (2019) |
| Microtubule orientation during cell division (GFP-TUA6, GFP-MBD) | Arabidopsis thaliana Col-0 Medicago sativa Regen SY | Whole root, root epidermal cells (live-imaging) | LSFM | Vyplelová et al. (2018) |
| Root 3D reconstruction, cortex and epidermal cell files patterning, and root hair spacing under low phosphate availability | Arabidopsis thaliana Col-0 | Root tip excised from plant (propidium iodide staining) | LSFM | Janes et al. (2018) |
| Calcium oscillation in roots expressing the cytosolic-targeted FRET-based sensor Cameleon YC3.6 | Arabidopsis thaliana Col-0 | Primary root and root hairs (live-imaging) | LSFM | Armada et al. (2019) |
| Root meristematic cell division (CYCLINB1,1-GFP) | Arabidopsis thaliana Col-0 | Region of root meristem (live-imaging) | LSFM | Buckner et al. (2019, 2020) |
| Spatial distribution of lateral root primordia initiation and outgrowth in response to external water availability and in relation to the medium surface | Arabidopsis thaliana Col-0, the reporter line pLBD16::LBD16-GFP | Excised mature root segment (multiview imaging) | LSFM | von Wangenheim et al. (2020) |
| Ectopic cell division in primary and lateral roots of katanin1 mutant | Arabidopsis thaliana Col-0 and ktn1-2 expressing 35S::GFP:TUA6 | Primary and lateral roots (live-imaging) | LSFM | Ovečka et al. (2020) |
| Spatial distribution in deep tissues, developmental and subcellular localization of ANNEXIN1 (ANN1-GFP) | Arabidopsis thaliana Col-0 | Developing roots, trichoblasts, root hairs (live-imaging) |
| Tichá et al. (2020c) |
| Plant germline differentiation and 3D modeling of flowers at subcellular level, male and female meiosis, and pollen asymmetric division (H2B-mRuby2, ASY1-eYFP, HTA10-RFP, DR5-N7-Venus, PCNA-TagRFP) | Arabidopsis thaliana Col-0, asy1, smg7-1 | Whole flowers (live-imaging) | LSFM | Valuchova et al. (2020) |
| Developmental expression pattern of FSD1-GFP during germination and early seedling development, tissue-specific localization | Arabidopsis thaliana Col-0 and fsd1-1 expressing pFSD1-FSD1::GFP:3′-UTR-FSD1 | Seed germination, seedling development, root growth, root hairs (live-imaging) | LSFM | Dvořák et al. (2021) |
| Examination of auxin reporter lines for overview of auxin distribution during flower head patterning and phyllotaxis development | Gerbera hybrida and transgenic line expressing DR5rev::3XVENUS-N7 | Entire excised flower heads, VENUS, and chlorophyll autofluorescence imaging | LSFM | Zhang et al. (2021) |
SPIM, selective plane illumination microscopy; BSPIM, biospeckle selective plane illumination microscopy, PLDα1, PHOSPHOLIPASE Dα1, GFP-TUA6, GFP-TUBULIN ALPHA 6, GFP-MBD, GFP-MICROTUBULE-BINDING DOMAIN, FSD1-GFP, IRON SUPEROXIDE DISMUTASE 1-GFP.
Implementation of LSFM in plant science was facilitated by the employment of the model plant Arabidopsis (Arabidopsis thaliana) (L.) Heynh. Arabidopsis plants are tiny, their roots are very thin (∼100 µm), virtually transparent, and organized in geometrically defined tissue and cellular patterns. The availability of a wide range of fluorescence reporter lines makes this model species ideal for any type of microscopy imaging. Being well suited for the study of early development, LSFM provides an opportunity to visualize formation and growth of primary Arabidopsis roots after seed germination. Upon mounting and transferring young seedlings (1–2 days after germination) to the light-sheet microscope, the root cellular organization and growth dynamics can be recorded over time. However, capturing the whole process of seed germination from early stages is also possible (Ovečka et al., 2018). Priming of seeds and their immobilization in transparent gel allows the spatial and temporal visualization of the germination process and allowed mapping of IRON SUPEROXIDE DISMUTASE 1 (FSD1-GFP) distribution during seed germination. The LSFM recording visualized testa rupture, radicle protrusion, subsequent primary root elongation, and the emergence of the first root hairs (Dvořák et al., 2021). Importantly, the visualization of such early germination events by LSFM revealed sequential accumulation and spatial relocation of FSD1-GFP in micropylar endosperm before its rupture and radicle emergence. This temporal event could be easily overlooked in other microscopy approaches.
The study of Arabidopsis root growth and development has been one of the most popular scientific aims of LSFM imaging. However, unlike roots, imaging of other plant parts, and above-ground photosynthetically active organs in particular, is more challenging. Owing to their content of autofluorescent pigments, and due to the light scattering properties of the epidermis of air-grown organs, it is difficult to achieve high signal-to-noise ratio during imaging of leaves, cotyledons, and shoots (see Outstanding Questions). However, LSFM significantly reduces the loss of contrast and resolution typically caused by out-of-focus light emitted during imaging of thick samples by standard wide-field or point-scanning confocal microscopy. By far higher sensitivity and ability to collect all emitted light, LSFM could potentially solve 3D imaging problems of above-ground plant organs. An appropriate adaptation of sample preparation protocols allowed LSFM to document auxin maxima-dependent activation of transcription factors responsible for leaf primordia initiation on shoot apical meristem of tomato (Lycopersicon esculentum; Capua and Eshed, 2017), to create 3D reconstitution of the flower at the cellular resolution and live imaging of germline differentiation during flower development in Arabidopsis (Valuchova et al., 2020; reviewed in Prunet and Duncan, 2020), or to visualize auxin distribution during later stages of flower head patterning and phyllotaxis formation in daisy (Gerbera hybrida; Zhang et al., 2021). Owing to the spatial complexity and thickness of aerial plant organs, LSFM offers imaging by optical sectioning from different angles. Subsequently, a high-quality specimen visualization is provided through software alignment and 3D reconstruction (multiview processing). Multiangle imaging can compensate for irregularities of illumination by the absorption of light sheet at the sample and facilitates deeper thick tissue imaging. The temporal resolution of imaging, however, is proportionally reduced (Supplemental Table S1).
Growth of primary roots in relation to the regulated cell division pattern was documented through LSFM imaging of mitotic microtubule (MT) transitions using fluorescently tagged molecular markers of tubulin, MT-associated protein, or MT end-binding protein (Komis et al., 2018; Vyplelová et al., 2018). Multiscale aspects of LSFM imaging revealed a complex pattern of root system development through documentation of lateral root establishment and emergence. Long-term volumetric imaging showed a global cell division pattern during lateral root primordia formation, spatial interactions among neighboring cells, and mechanical properties of the overlying tissues during lateral root primordia outgrowth, and acquisition of a particular angle of developing lateral roots in respect to the main root and the gravity vector (reviewed in Grossmann et al., 2018; Komis et al., 2018; Ovečka et al., 2018).
In most recent applications, LSFM is still very popular and efficient in the elucidation of Arabidopsis root development. It was used in the analysis of root growth dynamics and cell cycle patterns over time under iron deficiency and in combination with temporary heat stress by tracking of CYCLINB1;1-GFP (CYCB1;1-GFP), a marker for cell entry into mitosis (Buckner et al., 2019). Multi-dimensional time-course LSFM study and cell file tracking in Arabidopsis root reacting to different water availability, showed the flexibility of lateral root development during the root system branching. This study revealed how the position of emerging lateral roots and angle of their growth is influenced by root hydrological environment, showing different responses in water or on surface of the agar plate (von Wangenheim et al., 2020). LSFM provided the tool for non-invasive and gentle imaging of growing roots of the katanin1-2 (ktn1-2) mutant carrying a GFP-TUBULIN ALPHA 6 (GFP-TUA6) MT marker. It revealed ectopic longitudinal cell divisions that were localized to the calyptrogen, the procambium, and the mature parts of roots during the formation of lateral root primordia (Ovečka et al., 2020). As such ectopic divisions may significantly contribute to the radial expansion of ktn1-2 roots, their developmental visualization by LSFM contributed to better understanding of cellular patterning in morphologically abnormal ktn1-2 mutant.
LSFM also brought multi-dimensionality in Arabidopsis developmental biology, through the documentation of developmental gene expression patterns and subcellular localizations of plant proteins, sometimes revealing additional cellular functions. In such studies, translational fusion constructs for fluorescent protein-tagged variants controlled by their own native promoters were used. In this way, LSFM was employed in developmental imaging and subcellular localization of PHOSPHOLIPASE D alpha 1 (PLDα1), an enzyme involved in plant signaling and stress responses (Novák et al., 2018), ANNEXIN 1 (ANN1), a member of a large protein family participating in cell growth, differentiation, vesicle trafficking, and stress responses (Tichá et al., 2020c) and FSD1, a member of important antioxidant enzymes, catalyzing the dismutation of superoxide into hydrogen peroxide, thus regulating the redox status in plant cells (Dvořák et al., 2021).
LSFM and 3D reconstruction allowed the study of anatomical changes in Arabidopsis root radial patterning induced by low availability of phosphate. The imaging of whole root apex identified and located radial anticlinal cell divisions in the cortex cell layer under low phosphate conditions that also led to significant increase in the number of epidermal cell files at root hair forming positions. Thus, developmental adaptation of Arabidopsis root to low phosphate availability resulted in significant change of the root hair patterning, their spacing, and abundance (Janes et al., 2018). The rapid and gentle imaging with sufficiently high spatio-temporal resolution predetermined LSFM for studying calcium oscillations in Arabidopsis root hairs in association with the rate of root hair polarized growth (Armada et al., 2019). In addition, LSFM revealed developmentally regulated expression patterns of PLDα1-YFP (Novák et al., 2018) and ANN1-GFP (Tichá et al., 2020c), including cell-specific accumulation in trichoblasts. Subsequently, both proteins accumulated in the tips of emerging and growing root hairs. In general, root hair tip growth represents an excellent model of polar cell expansion in plants. Structural integrity of growing root hairs is very sensitive to external conditions including high illumination during imaging. LSFM imaging, unlike conventional microscopy, takes place in voluminous chambers offering enough space for root growth (Supplemental Figure S1, A–D), which is comparable to natural mode of cultivation. LSFM can capture all developing root hairs that grow radially out from the root surface into 3D space of imaging chamber. Therefore, LSFM is an excellent method to study root hair formation and tip growth. Indeed, once continuous root growth of the seedling inserted to the LSFM chamber is established, undisturbed development of root hairs and their sustained tip growth is effectively achieved. It is exemplified here by developmental imaging of root hair formation in two transgenic Arabidopsis lines. In the first one, ANN1-GFP serves as an ideal cytosolic molecular marker accumulating in the apex of growing root hairs (Figure 1, A and B and Supplemental Videos S1, S2). In the second one, GFP-ROOT HAIR DEFECTIVE 2 (GFP-RHD2) appears as a vesicular trafficking molecular marker in the apex of growing root hairs, including apical domain of the plasma membrane (PM) (Figure 1, C and D and Supplemental Videos S3, S4).
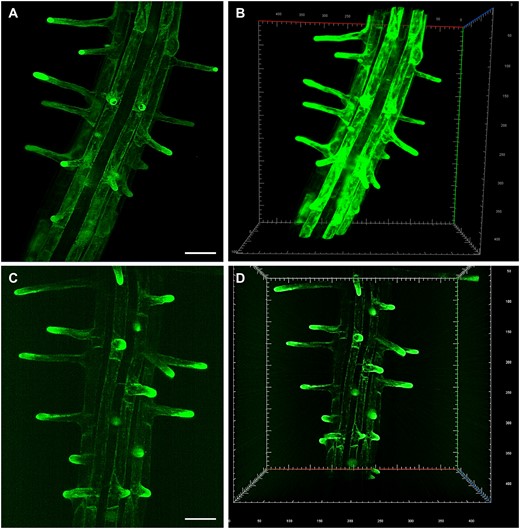
LSFM of transgenic Arabidopsis plants carrying genetically encoded molecular markers, which are developmentally and subcellularly regulated during root hair development. A and B, ANNEXIN1-GFP (ANN1-GFP) as a cytosolic marker. C and D, GFP-ROOT HAIR DEFECTIVE 2 (GFP-RHD2) as endosomal and apical PM marker. Specific subcellular distribution in root hair formation zone and tip-focused accumulation in growing root hairs of both markers is visualized in 2D maximum intensity projections (A, Supplemental Video S1; C, Supplemental Video S3) and 3D volumetric renderings (B, Supplemental Video S2; D, Supplemental Video S4). Bar = 50 µm (A, C). Gridline spacing = 10 µm (B, D). Imaging: (A–D) W Plan-Apochromat 20×/1.0 NA, 488 nm excitation at 2% of relative laser power level, BP505–545 detection encompassing the emission maximum of GFP (509 nm), light sheet thickness 4.52 µm, z-stacks of 0.48 µm/plane, encompassing the volume of 438.69 × 438.69 × 152.08 µm (x × y × z) in (A, B) and 438.69 × 438.69 × 229.79 µm (x × y × z) in (C, D).
Lattice LSFM, a volumetric imaging method utilizing optical lattice as illumination beam, provided better resolution of developmentally regulated protein localization at the subcellular level. The symmetrical lattice shape with non-diffracting performance generates an ultrathin stable light sheet for sample illumination. This is, when compared with standard Gaussian light sheet, considerably thinner and uniform in thickness across the field of view (reviewed in Chatterjee et al., 2018). Thus, lattice LSFM technology improves spatiotemporal subcellular resolution with higher acquisition speed during live-cell imaging. Utilizing lattice LSFM, ANN1-GFP was shown to be enriched in trichoblast cell files of the root elongation zone (Tichá et al., 2020c). Subcellular localization performed by lattice LSFM revealed the clear cytoplasmic distribution of ANN1-GFP (Figure 2, A). Moreover, time-lapse lattice LSFM imaging showed that ANN1-GFP specifically accumulated around the nucleus, at the vicinity of the nuclear envelope. Later on, ANN1-GFP was enriched in the cortical cytoplasm of developing bulges during root hair formation (Tichá et al., 2020c).
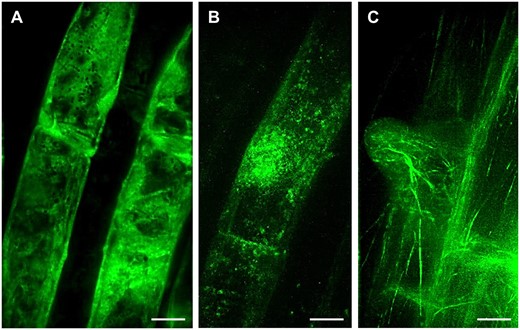
Lattice LSFM of transgenic Arabidopsis plants carrying diverse genetically encoded molecular markers which are developmentally and subcellularly regulated in bulging trichoblasts and in outgrowing root hairs. A, ANN1-GFP as a cytosolic marker, (B, Supplemental Video S5) GFP-RHD2 as endosomal and apical PM marker and (C) GFP-FABD2 as actin cytoskeleton marker. Bar = 10 µm (A–C). Imaging: W Plan-Apochromat 25×/1.1 NA, excitation at 488 nm at 75% relative laser power, detection with BP520/30 (a bandpass filter transmitting an emission from 505 to 535 nm), the pixel size 104 nm/pixel, z-stacks of 0.5 µm/plane, encompassing the volume of ∼50.5 µm, exposure time 50 ms, and full stack acquisition 5.3 s.
The gene locus RHD2 encodes RESPIRATORY BURST OXIDASE HOMOLOG C of Arabidopsis (AtRBOHC), a NICOTINAMIDE ADENINE DINUCLEOTIDE PHOSPHATE (NADPH) oxidase that is localized in root hair tips. It is responsible for the generation of reactive oxygen species (ROS) by transfer of electrons from NADPH to an electron acceptor (Foreman et al., 2003). ROS are required for the establishment of a tip-focused Ca2+ gradient, which is indispensable for root hair tip growth. This tip-focused Ca2+ gradient is disturbed and the polarized growth of root hairs is blocked just after the bulge formation in the rhd2 loss-of-function mutant. A translational fusion of RHD2 with GFP (GFP-RHD2) expressed under native promoter fully complements the defective root hair phenotype of the rhd2 mutant (Carol et al., 2005; Takeda et al., 2008). Dynamic subcellular localization of GFP-RHD2 in root trichoblasts during the pre-bulge and bulging stages using lattice LSFM, revealed spot-like vesicular structures moving in the trichoblast and preferentially accumulating at the bulging site (Figure 2, B). The high spatiotemporal resolution of lattice LSFM in capturing vesicles delivering GFP-RHD2 to developing root hair is obvious from time-lapse imaging (Supplemental Video S5). Although lattice LSFM has certain limitations regarding sample mounting and the deep imaging of bulky multicellular samples (Supplemental Table S1), the potential of this method can be adopted for the study of epidermal cell layers, for example for subcellular documentation of fine and dynamic structures that play an indispensable role in a sudden change of growth polarity in trichoblasts during root hair formation. Here, it is exemplified by the documentation of fine actin filaments labeled with FIMBRIN ACTIN BINDING DOMAIN 2 (FABD2) of Arabidopsis fused to green fluorescent protein (GFP-FABD2) in young root hairs at the bulge-to-tip growth transition stage (Figure 2, C).
Owing to their unique optical configuration, LSFM modalities are useful for the accommodation of bulkier samples for volumetric imaging. Recent technical advances and knowledge of sample preparation allowed the transition from the slender Arabidopsis seedling to bulkier crop species for imaging by LSFM. As a proof of concept, we show here the potential of developmental, long-term live-cell imaging of alfalfa (Medicago sativa L.) and barley (Hordeum vulgare L.) employing LSFM (Figures 3, 4 and Supplemental Figure S1, E and F). Both species are considerably bigger than Arabidopsis and at the seedling stage, their root is three- to five-fold wider than the Arabidopsis root. In both crop species, LSFM provides a good spatial resolution for multiangle imaging of whole organs, with the possibility to visualize also deeper tissues. LSFM visualization of growing alfalfa roots using a transgenic line carrying a molecular marker for MTs (GFP-MBD), allowed quantitative determination of cell divisions in epidermis and cortex of the root meristem that were correlated with the root growth rate (Vyplelová et al., 2017). Thus, growth and development of crop organs can be captured by LSFM in real time. Alfalfa interacts with Sinorhizobium meliloti bacteria that provide host plants with nitrogen by fixing and converting atmospheric N2 in specialized root nodules (Roy et al., 2020; Tichá et al., 2020b). Sinorhizobium meliloti is internalized and colonizes the host using a special tubular structure called the infection thread (IT). Documentation of such symbiotic interactions by conventional microscopy modalities is limited due to the horizontal position of the host plant and by enclosing microscopic sample in a very narrow space between slide and coverslip. LSFM imaging chamber provides enough space for vertically oriented roots and offers the possibility to apply rhizobia by controlled perfusion. Here, we have used transgenic alfalfa plants carrying pro35S::GFP:FABD2 construct, encoding for a molecular marker for actin cytoskeleton (Figure 3, A and Supplemental Video S6), co-cultivated with S. meliloti strain Sm2011 labeled with mRFP. Application of S. meliloti to stabilized alfalfa plants by perfusion for 3 h (Figure 3, B) provided enough time for successful interaction, leading to stable attachment of bacteria to the surface of root hairs, resisting subsequent washing steps with culture medium (Figure 3, C and Supplemental Video S7). In comparison to the control before application of bacteria (Figure 3, D and Supplemental Video S8), some root hairs with attached S. meliloti showed accelerated tip growth and compromised polarity (Figure 3, E and Supplemental Video S9). This polarity change was promoted by massive rearrangements and accumulation of abundant actin filaments, as visualized by GFP-FABD2 marker (Figure 3, E). The analysis of early symbiotic events clearly documented the potential of LSFM to study dynamic behavior of actin related to polarity changes after attachment of S. meliloti to alfalfa root hair. Thus, LSFM could be used for alfalfa biotechnological improvements based on a detailed knowledge of the mutualistic interactions with microbes.

LSFM of transgenic alfalfa plants with actin filaments visualized by GFP-FABD2 marker (green). (A, Supplemental Video S6) Root growing in the light-sheet microscope before the application and (B, Supplemental Video S7) during the application of S. meliloti labeled by mRFP (magenta). C, After perfusion, S. meliloti attached to the root hairs. (D, Supplemental Video S8) Actin filaments in the control root hair and (E, Supplemental Video S9) in two root hairs with attached S. meliloti imaged for the period of 8 h. Bar = 50 µm (A–C), 10 µm (D, E). Imaging: (A–E) W Plan-Apochromat 20×/1.0 NA, 488 nm (for GFP excitation) and 561 nm (for mRFP excitation) at 4% and 2% of relative laser power level, respectively, BP505–545 and BP575–615 detection, light sheet thickness 4.52 µm, z-stacks of 0.48 µm/plane, encompassing the volume of 438.46 × 438.46 × 380.43 µm (x × y × z) in (A–C) and 313.02 × 159.71 × 153.12 µm (x × y × z) in (D and E).
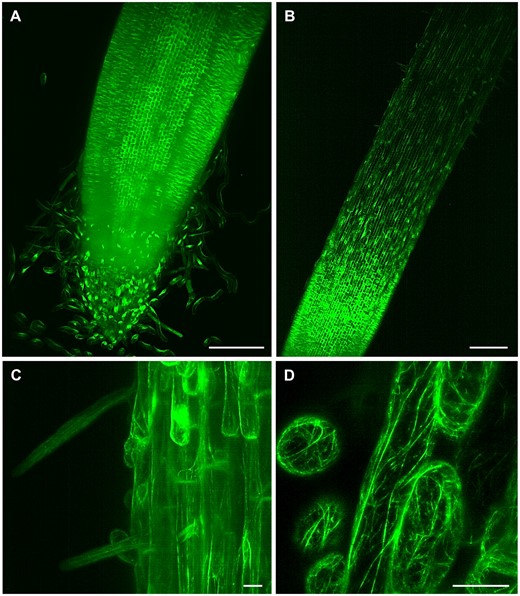
LSFM of transgenic barley plants with actin cytoskeleton visualized by GFP-FABD2-GFP marker. A, Root apex with root cap and separating border cells, (B, Supplemental Video S10) root elongation and differentiation zone, (C) epidermis with developing root hairs, and (D, Supplemental Video S11) detail on actin filaments in root epidermal cells. Bar = 200 µm (A, B) and 20 µm (C, D). Imaging: W Plan-Apochromat 10×/0.5 NA (B) and W Plan-Apochromat 20×/1.0 NA (A, C and D), 488 nm excitation at 5% (A and B, D) and 10% (C) of relative laser power level, BP505–545 detection, light sheet thickness 6.36 µm (A and B), 4.52 µm (C) and 2.61 µm (D), z-stacks of 1.11 (A), 2.52 (B), 0.48 (C), and 0.45 (D) µm/plane, encompassing the volume of 1217.95 × 1217.95 × 585.76 µm (x × y × z) in (A), 1753.85 × 1753.85 × 567.31 µm (x × y × z) in (B), 438.46 × 438.46 × 160.18 µm (x × y × z) in (C) and 146.00 × 146.00 × 23.01 µm (x × y × z) in (D).
Important part of our understanding how plants react to biotic factors rely on study of plant–fungi interactions. The aim is to reveal how both beneficial and pathogenic fungi affect plant development and how such interactions can be efficiently visualized. This was addressed in roots of transgenic Arabidopsis plants carrying the construct for auxin reporter DR5::EGFP-DR5v2::tdTomato colonized by different fungi (Meents et al., 2019). Plants were stabilized on custom sample holders by 2% low melting-point agarose, root tips were infected by spores of different fungi and plants were imaged by LSFM for 24 h. Beneficial fungi enhanced the auxin levels and stimulated expression of auxin-responsive reporter genes in roots, while pathogenic fungi reduced the expression of such genes rapidly. Thus, gentle LSFM imaging revealed that interaction of plant roots with pathogenic or beneficial fungi leads to deregulation of auxin-responsive genes, which modulates plant development (Meents et al., 2019). Numerous plant symbiotic and pathogenic fungi are economically important and LSFM could be employed for effective study of their interactions with plants at controlled environmental conditions. In addition, LSFM can be also used to study nematodes interacting with plant roots in the rhizosphere by Biospeckle Selective Plane Illumination Microscopy (BSPIM; O’Callaghan et al., 2018).
Studies on monocot roots are more challenging, considering that root anatomy, structure, and architecture are different from dicots. In crops such as rice (Oryza sativa) or barley, both primary and seminal embryonic roots, are crucial components of the root system at the onset of plant development. After that, shoot-borne post-embryonic roots contribute to the final fibrous root system, characteristic of the cereals (Orman-Ligeza et al., 2013). Barley is of particular interest because it shows higher abiotic stress tolerance (Gürel et al., 2016), is an important source of food for animals and human, and its diploid genome has been sequenced (Mascher et al., 2017). All these aspects make it an excellent model for genetic studies in Triticeae. We prepared transgenic barley plants expressing GFP fused to both the C- and N-termini of FABD2 (GFP-FABD2-GFP) of barley under the maize ubiquitin-1 promoter for in vivo visualization of actin cytoskeleton in roots. LSFM allowed imaging of a substantial part of the barley root including the meristematic zone, the root cap (Figure 4, A), elongation, and differentiation zones (Figure 4, B and Supplemental Video S10). Time-lapse LSFM visualized actin filaments in epidermis during root hair development in the differentiation root zone (Figure 4, C). It also provided details on actin filaments organization in root epidermal cells (Figure 4, D) and captured their dynamic rearrangements (Supplemental Video S11). Thus, LSFM represents the method with a great potential to study barley root growth and development, usable in strategies of biotechnological crop improvement.
Super-resolution microscopy
SRM refers to microscopy methods that surpass the resolution limits of conventional widefield or scanning modalities. Depending on the extent of the resolution improvements, such methods may be referred to as extended resolution methods with resolution potential marginally to slightly better than Abbe’s limit (extended resolution methods such as structured illumination microscopy (SIM); e.g. Gustafsson, 2000), and nanoscopy methods downscaling resolution to few tens of nanometers or much less than that (Sahl et al., 2017).
Imaging applications of SRM stemmed from the statistical improvement of single-molecule detection and spatial assignment or from adjustments in sample illumination or the spatial manipulation of emission (Komis et al., 2018). Few SRM methods such as SIM and Airyscan confocal laser scanning microscopy (ACLSM) are diffraction-limited (Komis et al., 2018), while pointillistic methods based on stochastic localization, including photoactivation localization and stochastic optical reconstruction (PALM and STORM), go below the diffraction limits. The third conceptual and powerful SRM method is stimulated emission depletion (STED) through which the point spread function (PSF) is appropriately shaped and together with single-molecule localization microscopy (SMLM) are by principle unlimited by diffraction barriers and constitute the so-called nanoscopy approaches (Sahl et al., 2017).
The rapid dissemination of SRM methods is concomitant to the advances in sample preparations, including unique chemistries for selective labeling of subcellular structures and methods of sample handling to increase signal-to-noise ratios at considerable depths (Supplemental Table S2). CLIP-, HALO-, and SNAP-genetically encoded tags reduced the size of the labeling compared with standard fluorescent proteins and allowed labeling with cell-permeable fluorophores suitable for single-molecule localization (Hoelzel and Zhang, 2020). Such tags have recently found their way in plant cell imaging applications (Iwatate et al., 2020), while a split variant of the HALO-tag was recently developed for the detection of protein–protein interactions in plants (Minner-Meinen et al., 2021). In the same direction, far-red emitting silicon-rhodamine (SiR) affinity probes with suitability for single-molecule localization studies have been developed for several subcellular structures (Wang et al., 2019), and it remains to see if they are cell wall permeable and applicable to plant tissues (see Outstanding Questions).
Super-resolution ACLSM
The employment of the airyscan module improved lateral resolution of CLSM up to 120 nm and enabled fast super-resolution imaging (Huff et al., 2017). In conventional CLSM systems with the classical pinhole, a part of the emitted light is lost. In contrast, all emitted light is collected by the virtual pinhole in ACLSM. More detectors were implemented and every detection element functions as an individual pinhole (Korobchevskaya et al., 2017). The detector comprises of 32 hexagonally arranged units, called the channel gallium arsenide phosphide (GaAsP). Higher resolution is achieved by deconvolution applied during the reconstruction of output data (Korobchevskaya et al., 2017).
The potential of ACLSM has been often exploited for fixed samples (Table 2). Staining procedures are relatively fast and allow high-resolution imaging without the need to maintain proper environmental and physiological conditions during imaging. Immunofluorescence labeling of tubulin can effectively resolve complex structural organization and spatial rearrangements of mitotic and cytokinetic MTs during cell division in alfalfa roots (Tichá et al., 2020a, 2020b). Moreover, high resolution of ACLSM allowed detailed documentation of colocalization between ANN1-GFP and MTs revealing the association of ANN1 with MTs and its possible function in cell division (Tichá et al., 2020c). The resolution of ACLSM may also be useful for other applications, such as discrimination of 3D morphology of pollen grains for their taxonomic differentiation, which is not possible using standard light microscopy (Romero et al., 2020a, 2020b). Super-resolved 3D visualization showed disturbed organization of MTs in dividing cells of the Arabidopsis ktn1 mutant using the GFP-TUA6 MT marker (Komis et al., 2017; Vyplelová et al., 2018). In addition, high-resolution ACLSM images of MAP65-2 labeled with eGFP or tagRFP proved its partial association with MTs visualized with TUA6-GFP or mRFP-BETA-6 TUBULIN (mRFP-TUB6) markers (Vavrdová et al., 2020). ACLSM was used for dynamic localization of PM proteins with divergent functions, such as FLAGELLIN-SENSITIVE 2 (FLS2), PIN-FORMED 3 (PIN3), and BRASSINOSTEROID-INSENSITIVE 1 (BRI1), which were associated to clusters and moved at different rates (McKenna et al., 2019). In addition, life imaging using ACLSM was applied in the study of symbiotic interaction between barrel medic (Medicago truncatula) and S. meliloti showing that the progression of ITs into root cortical cells requires stabilization of receptor LYSINE MOTIF KINASE 3 (LYK3) in PM nanodomains (Liang et al., 2018). In the case of high-resolution ACLSM imaging of alfalfa, it is necessary to optimize the sample scanning to keep it under physiological conditions. The vertically mounted ACLSM platform (Supplemental Figure S1, G and H) and optimization of sample preparation allowed to perform dynamic study on beneficial interaction between alfalfa carrying actin and microtubular markers and S. meliloti-mRFP (Figure 5 and Supplemental Figure S1, I and J). Interestingly, actin accumulated around the apex of the growing IT (Figure 5, A–C) and fully decorated grown IT in the form of longitudinal bundled filaments (Figure 5, D–F and Supplemental Video S12). On the other hand, MTs were mostly longitudinally arranged in the root hair cortex (Figure 5, G–I and Supplemental Video S13). ACLSM using vertical imaging platform with plant illumination and special sample chambers/dishes represents an approach to observe alfalfa interactions with symbiotic and pathogenic microbes over a prolonged time at the super-resolution level, and can be applied to other crops, like barley (Supplemental Figure S1, K).
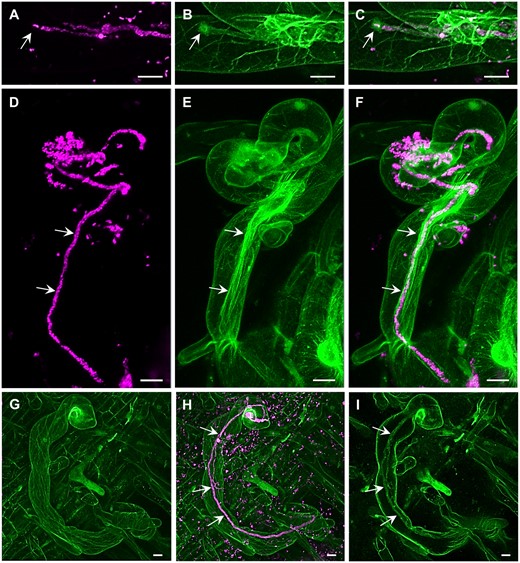
Super-resolution mode of the Airycsan confocal laser scanning microscope used for the simultaneous imaging of S. meliloti (magenta) and the host cytoskeleton (green) in transgenic alfalfa plants carrying genetically encoded cytoskeletal markers (GFP-FABD2 for actin and GFP-MBD for MTs). Actin filaments and bundles (A–F, Supplemental Video S12) and MTs (G–I, Supplemental Video S13) in root hairs infected by S. meliloti labeled by mRFP within ITs. Actin accumulated around the apex of growing IT (arrows in A–C), and decorated fully grown IT in the form of longitudinal bundled filaments (arrows in D–F, Supplemental Video S12). MTs were longitudinally arranged in the extensive cortical network (G and H, Supplemental Video S13) and only occasionally were associated with fully grown IT (arrows in H and I) in root hairs (I). Bar = 10 µm (A–I). Imaging: Dry Plan-Apochromat 20×/0.8 NA, 488 nm (for GFP excitation) and 561 nm (for mRFP excitation) at 2% and 0.6% of relative laser power level, respectively, BP 420–480 + BP 495–550 for GFP signal detection and BP 420–480 + LP 605 for RFP signal detection, image scaling 0.074 × 0.074 × 0.397 µm (x × y × z), pixel dwell time 1.98 µs.
Overview of super-resolution plant imaging in the last 3 years
| Imaging method | Plant species | Cellular structure | Studied sample | References |
|---|---|---|---|---|
| Airyscan CLSM |
|
|
| |
| SIM (linear SIM, fast interferometric SIM, 3D SIM) |
|
|
| |
| dSTORM | Arabidopsis thaliana | Nuclear colocalization of glutaredoxin with the RNA polymerase II variants | Fixed cells | Maß et al. (2020) |
| PALM, sptPALM | Arabidopsis thaliana |
|
| |
| STED |
|
|
| |
| TIRFM |
|
|
| |
| RESOLFT | Arabidopsis thaliana | Cortical MTs | Living cells | Schnorrenberg et al. (2020) |
| FRET-FLIM | Arabidopsis thaliana | Formation of stimuli-dependent nanodomains by ROP6 after hyperosmotic stress | Living cells | Smokvarska et al. (2020) |
| ExM SIM | Hordeum vulgare | Chromatin ultrastructure determination | Fixed cells | Kubalová et al. (2020) |
| HILO | Physcomitrium patens | MT cytoskeleton | Living cells | Kozgunova and Goshima (2019) |
| SRRFM | Arabidopsis thaliana | Temporal integration of auxin information for the regulation of patterning | Living cells | Galvan-Ampudia et al. (2020) |
CLSM, confocal laser scanning microscopy; dSTORM, direct stochastical optical reconstruction microscopy; PALM, photo-activated localization microscopy; sptPALM, single-particle-tracking PALM; TIRFM, total internal reflection fluorescence microscopy; RESOLFT, reversible saturable optical fluorescence transitions; FRET-FLIM, Förster resonance energy transfer analyzed by fluorescence lifetime imaging microscopy; ExM SIM, expansion microscopy SIM; HILO, highly inclined and laminated optical sheet; SRRFM, super-resolution radial fluctuations microscopy.
SCLIM
Super-resolution confocal live imaging microscopy has been a recent advancement of spinning disk imaging combined with a high sensitivity sensor and off-line image deconvolution, which allows high-speed super-resolution of fast processes such as the sorting and trafficking of post-Golgi vesicles (Shimizu et al., 2021).
SIM
SIM is a fairly old method requiring the patterned illumination of the sample with moving light patterns that may be generated by grid lines (Gustafsson, 2000), parallelization of illumination by micromirror arrays (Li et al., 2020), or spinning disk pinholes (Azuma and Kei, 2015), interferometry (Shao et al., 2012), or spot patterns (e.g. lattice SIM; Yu et al., 2020). In cases when emission is directly proportional to excitation, the final image is reconstructed to include undiffracted light and two diffraction orders, improving planar resolution by a factor of 2 (linear SIM; Gustafsson et al., 2008), while at saturating light intensities (Gustafsson, 2005) or under other non-linear conditions such as when using photo-switchable fluorophores (Rego et al., 2012), SIM becomes diffraction unlimited (saturated or non-linear SIM; Gustafsson, 2005). With recent developments in SIM, commercial platforms harness the potentials of the method to pursue multichannel super-resolution 3D imaging at high acquisition rates (Komis et al., 2018).
In plant science, SIM is likely the most used super-resolution method with recently published examples of 3D-multichannel imaging of fixed probes encompassing limited parts of plant organs, single cells, or isolated compartments such as nuclei, chromosomes, and cytoskeletal elements and it is particularly useful for colocalization studies (Novák et al., 2018; Vavrdová et al., 2019; Schubert et al., 2020; Municio et al., 2021; Figure 6, A–G).
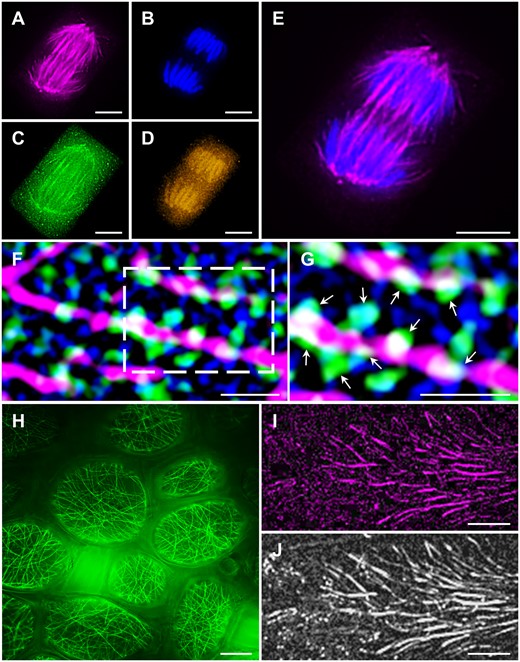
Super-resolution imaging applications in plants. A–E, Multicolor SIM fluorescent localization of (A) Alexa Fluor 647-labeled MTs, (B) DAPI-labeled chromosomes, (C) Alexa Fluor 488-labeled γ-tubulin, and (D) Alexa Fluor 546-labeled pERK species in a barley anaphase root tip cell. E, Magnified overlay of A and B. F and G, Immunofluorescence SIM colocalization of cortical MTs (magenta), PLDα1-YFP (green), and clathrin (blue) in Arabidopsis root cells. Boxed area in (F) is shown magnified in (G). Arrows indicate PLDα1-YFP spot-like structures in close contact with cortical MTs and individual clathrin-coated pits and vesicles. H, Live SIM imaging of GFP-MBD labeled cortical MTs of alfalfa pavement leaf cells after application of perfluorodecalin. I and J, PALM visualization of the MT-associated protein MAP65-2 fused to (I) mEos3.2 and (J) the respective HiLO widefield image. Bar = 10 µm (H), 5 µm (A–E), and 1 µm (F, G, I, and J). Imaging: Oil Plan-Apochromat 63×/1.4 NA (A–I), 405 nm at 6.5% for DAPI excitation (A–E) and 5.0% for photoconversion of mEos3.2 (I–J), 488 nm at 3.5% (A–E), 2% (F–H) and 2% for excitation of non-converted mEos3.2 (I–J), 561 nm at 2.8% (A–E), 2% (F and G) and 100% for excitation of photoconverted mEos3.2 (I–J), 642 nm at 3% (A–E), and 2% (F and G), signal detection with BP420–480+LP750 for DAPI (A–E), BP 495–550 + LP 750 for Alexa Fluor 488 (A–G) and for GFP (H), BP 570–620 + LP 750 for Alexa Fluor 546 (A–G), LP 655 for Alexa Fluor 647 (A–G), a combination of BP 420–480 + BP 570–640 + LP 740 for PALM visualization (I–J), five rotations, and five phase shifts for SIM (A–H).
The classical and relatively slow grid line illumination mode of linear SIM is sufficient to report the resolution of subcellular structures of living cells (Supplemental Figure S1, L–N), at nearly the theoretical optical resolution of 100 nm (depending on the numerical aperture of the objective used), but also allows for the live documentation of 2D recordings of MT dynamics (Komis et al., 2018; Vavrdová et al., 2020), or subcellular co-localization of cytokinin probe and the receptor CYTOKININ RESPONSE 1/ARABIDOPSIS HISTIDINE KINASE 4 fused to GFP (CRE1/AHK4-GFP) with FM4-64 labeled PM (Kubiasová et al., 2020). In fixed probes, imaging speed is not limiting, thus standard linear SIM can be used for remarkable resolution improvement of appropriately immunolabeled samples at considerable imaging depths (Dvořáčková et al., 2018). Multilabeling in such cases is also permissive (Vavrdová et al., 2019). Interferometric, TIRF-SIM, and parallelized illumination SIM can drastically increase the frame rates of image acquisition, again at the two dimensions (Shaw et al., 2019; Vavrdová et al., 2020); however, imaging speed was highly revolutionized through the commercial implementation of lattice SIM, for high-speed documentation at the three dimensions.
Linear SIM has finite resolution limits by principle (Supplemental Table S2). At the third dimension, linear SIM is not better than single-photon CLSM, thus resolution improvements of SIM are not isotropic (Schermelleh et al., 2019). Moreover, efficient image reconstruction requires a high signal-to-noise ratio, rendering this method problematic for deep imaging of highly diffractive plant tissues. The feasibility of time-resolved dynamic events has been quite an issue in the early days of SIM, but today imaging speed has been drastically improved via lattice SIM or parallelized multi-spot illumination and it remains to see how such implementations will improve spatiotemporal imaging in 3D. Improvements of sample preparation to reduce or eliminate refractive index mismatches can improve 3D SIM of both fixed and living samples. Such methods include clearing approaches suitable for plant tissues and with the capacity to maintain the activity of fluorescent proteins (e.g. Imoto et al., 2021) and the use of high refractive index mounting media in fixed (Vavrdová et al., 2019) and living (Figure 6, H) samples.
Precision of localization
There is a very wide range of methods based on stochastic localization built upon similar principles, which allow the spatial assignment of single fluorophore molecules with high precision (Komis et al., 2018). Such methods include PALM and STORM, and involve the stochastic transition of special fluorophores between on and off states (blinking), fluctuations of emitted light intensity (Schidorsky et al., 2018), time-resolved bleaching under high-intensity illumination (Cox et al., 2011), or differences in the symmetry of point emitters against the background (Super-Resolution Radial Fluctuations (SRRF); Gustaffson et al., 2016). PALM requires the use of genetically encoded photo-activatable, photo-switchable, and photo-convertible proteins, while STORM is based on the fluctuation of fluorophores between emission and dark states in redox conditions (Sahl et al., 2017). Since illumination of the sample requires total internal reflection or highly inclined and laminated optical sheet (HILO) modes, the precision of localization methods are mostly limited to surface imaging or to very shallow depths with 3D options not exceeding 1 µm in the z-axis (Temprine et al., 2015; Figure 6, I and J). An advancement striving for single-molecule localization at higher imaging depths is 4Pi-SMS which combines standard stochastic localization methods, such as PALM and STORM with image acquisition by means of two opposing objectives, which in principle doubles the imaging depth to whole cell volumes (Wang et al., 2021). Although this approach is still restricted to thin samples, it might prove suitable for observing cell suspensions, protoplasts, or pollen tubes. Additionally, the precision of localization is proportional to the number of fluctuations detected, and therefore it is also time-consuming (Hess et al., 2006). Nevertheless, when the field of view is limited, PALM can be combined with single-particle tracking (spt) and used, for example to decipher the two-dimensional dynamics of membrane protein mobility (Manley et al., 2010).
Generally, SMLM studies are quite a few in the plant field. PALM localization was recently used to decipher single molecules of topoisomerase II in chromosomes of barley (Kubalová et al., 2021) and sptPALM was applied to demonstrate the dynamics of membrane-anchored signaling proteins such as ROP6 (Platre et al., 2019), to deduce the kinetics of remorins in membrane nanodomains (Gronnier et al., 2017) and has been streamlined to study the kinetics of membrane protein diffusion in several circumstances (Bayle et al., 2021).
STED/RESOLFT
STED conveys structured light to the sample in such a way as to sculpt sub-diffraction areas of emission surrounded by fluorophores enforced into a dark state. Moreover, it can convey isotropic super-resolution in all three dimensions by specially configured sample illumination following the 4Pi principle of dual objective (4Pi-STED or isoSTED). The potential of STED to resolve subcellular ultrastructure below diffraction limits has not found broad applications in plants and was previously used to delineate membrane clustering of the auxin transporter PIN2 (Kleine-Vehn et al., 2011). More recently, it was utilized for nuclear and chromosomal imaging (Kurzbauer et al., 2021), PM analysis (Collot et al., 2020), and visualization of MT and actin organization (Chumová et al., 2018; Komis et al., 2018; Molines et al., 2018).
RESOLFT (REversible Saturable Optical Linear Fluorescence Transitions) microscopy is similar to STED. However, it requires the use of photo-switchable fluorophores that reversibly transit between on and off states according to illumination intensity rendering this method unsuitable for use with conventional fluorescent proteins. Nevertheless, RESOLFT being a scanning method such as STED can be used for live imaging and was recently applied in plants to visualize MTs and actin filaments (Schnorrenberg et al., 2020).
Expansion microscopy
Expansion microscopy employs the copolymerization of soft biological tissues within an expandable polyacrylamide matrix. In this way, cellular nanostructures are expanded beyond their physical size (Gambarotto et al., 2019; Wassie et al., 2019). Impermeability and stiffness of the plant cell wall might be the major limiting factor for wide applications of expansion microscopy, but there have already been protocols for expansion of either isolated nuclei and chromosomes (Kubalová et al., 2020, 2021), thus devoid of cells walls. In addition, there are adaptations of expansion microscopy applied to the immunostaining of Arabidopsis ovules and developing seeds raising the application possibilities of the method to all wall-encased plant cells and organs (Kao and Nodine, 2019, 2021).
Since expansion microscopy is a sample preparation method, it is not limited to the imaging approach, and it can be combined with standard CLSM or ACLSM (Sheard and Jayasinghe, 2021) but also with super-resolution regimes such as single-molecule localization approaches with STORM (Xu et al., 2019) as well as with STED (Gao et al., 2018, 2021).
Conclusions and perspectives
To understand plant development, it is necessary to employ long-term multiscale imaging approaches of plants growing under nearly natural conditions including gravity, illumination, and mechanical impendance of the soil/imaging medium. Moreover, it is necessary to consider the optical properties of plant tissues that introduce severe spherical and chromatic aberrations during deep imaging. At present, nearly all major advances in mesoscopy, microscopy, and nanoscopy have been applied in plant imaging, taking into account all the above limitations. Imaging platforms have largely adopted vertical orientation options for sample loading in chambers with controlled light conditions and possibilities to exchange nutrients and bioactive chemicals. The vigorous development of clearing methods allows aberration free three-dimensional imaging of whole plant organs with the possibility to track cell fates through the preservation of appropriate fluorescent markers. High-throughput studies of many seedlings simultaneously are facilitated by the development of multichannel microfluidic systems (Grossmann et al., 2011), which can be compatible with LSFM imaging in custom configurations (Bissardon et al., 2020).
In the SRM field, there has been a substantial progress over the past few years. Although SIM is still the method of choice to overcome Abbe’s resolution limits in plant imaging, there are increasing applications of SMLM and STED/RESOLFT, which are expected to expand even further. Once such technologies will become streamlined in the plant cell biology, we expect to witness more elaborate applications, such as single-molecule FRET and single-molecule FRAP. It will allow the in situ detection of protein complex formation, protein conformational changes (Mazal et al., 2019; Mazal and Haran, 2019), or to trace protein dynamics at the nanoscale (Fu and Zhang, 2019), in addition to sptPALM.
The ongoing evolution of imaging modalities and the possibilities for long-term visualization enriches the quality and increases the number of datasets documented and for this reason, it goes hand-in-hand with advances in software development. Nowadays, image analysis is scalable (Ku et al., 2016; Swaney et al., 2019) and integrative, allowing image improvement, deconvolution, and multiview registration of volumetric documentations with custom or commercial resources (e.g. Verveer et al., 2018; Becker et al., 2019). The aim is to extract multiple outputs ranging from the annotation of individual cells or entire cell populations (Valuchova et al., 2020) to the documentation and quantification of intracellular dynamics within single cells or subcellular compartments (e.g. Novák et al., 2018; Tichá et al., 2020c; Dvořák et al., 2021).
Will small molecule cell-permeable probes for intracellular labeling find broad application in plants?
How will advances in tissue preparation, such as clearing, be combined with isotropic LSFM and SRM imaging to overcome chromatic aberrations and light scattering issues of plant material?
Will recent advances in LSFM allow high-speed and high-resolution documentation of coordinated events such as symmetry breaking or cell divisions in meristems?
Accordingly, will the combinations of LSFM or RESOLFT with two-photon imaging allow the three-dimensional documentation of early embryonic development within the seed at subcellular or molecular resolution?
Supplemental data
The following materials are available in the online version of this article.
Supplemental Figure S1. Setup of various instruments for LSFM and super-resolution using ACLSM and SIM for advanced imaging of crop species.
Supplemental Table S1. Limitations of LSFM methods.
Supplemental Table S2. Limitations of SRM methods.
Supplemental Video S1. Visualization of the root hair formation zone and growing root hairs in root of transgenic Arabidopsis plant carrying ANNEXIN1-GFP using LSFM. Exposure time 30 ms, time point every 5 min, and imaging time 2 h 30 min.
Supplemental Video S2. 3D volumetric rendering of the root hair formation zone and elongating root hairs in root of transgenic Arabidopsis plant carrying ANNEXIN1-GFP from LSFM imaging.
Supplemental Video S3. Visualization of the root hair formation zone and growing root hairs in root of transgenic Arabidopsis plant carrying GFP-ROOT HAIR DEFECTIVE 2 using LSFM. Exposure time 40 ms, time point every 5 min, and imaging time 6 h 42 min.
Supplemental Video S4. 3D volumetric rendering of the root hair formation zone and elongating root hairs in root of transgenic Arabidopsis plant carrying GFP-ROOT HAIR DEFECTIVE 2 from LSFM imaging.
Supplemental Video S5. Imaging of the trichoblast progressing in bulge formation in the root hair formation zone of the root in transgenic Arabidopsis plant carrying GFP-ROOT HAIR DEFECTIVE 2 using lattice LSFM. Exposure time 50 ms, time point every 5.3 s, and imaging time 20 min.
Supplemental Video S6. Dynamic actin cytoskeleton in root hairs of transgenic alfalfa plant visualized by GFP-FIMBRIN ACTIN BINDING DOMAIN 2 marker using LSFM. Exposure time 50 ms, time point every 10 min, and imaging time 16 h.
Supplemental Video S7. Root and root hairs of transgenic alfalfa plant with actin filaments visualized by GFP-FIMBRIN ACTIN BINDING DOMAIN 2 marker (green) after application of S. meliloti labeled by mRFP (magenta) during imaging in the light-sheet fluorescence microscope. Exposure time 50 ms, time point every 10 min, and imaging time 11 h 48 min.
Supplemental Video S8. Dynamic actin cytoskeleton visualized by GFP-FIMBRIN ACTIN BINDING DOMAIN 2 marker in non-growing root hair of transgenic alfalfa plant using LSFM. Exposure time 50 ms, time point every 10 min, and imaging time 16 h.
Supplemental Video S9. Re-activation of tip growth and re-arrangement of actin cytoskeleton visualized by GFP-FIMBRIN ACTIN BINDING DOMAIN 2 marker in root hair of transgenic alfalfa plant after application of S. meliloti labeled by mRFP (magenta) during imaging in the light-sheet fluorescence microscope. Exposure time 50 ms, time point every 10 min, and imaging time 11 h 48 min.
Supplemental Video S10. Visualization of actin cytoskeleton by GFP-FIMBRIN ACTIN BINDING DOMAIN 2-GFP marker in cells of growing root of transgenic barley plant using LSFM. Exposure time 50 ms, time point every 1 min, and imaging time 1 h.
Supplemental Video S11. Dynamic actin cytoskeleton visualized by GFP-FIMBRIN ACTIN BINDING DOMAIN 2-GFP marker in root epidermal cells of transgenic barley plant using LSFM. Exposure time 50 ms, time point every 10 s, and imaging time 16 min.
Supplemental Video S12. 3D volumetric rendering and orthogonal projection of actin cytoskeleton visualized by GFP-FIMBRIN ACTIN BINDING DOMAIN 2 marker (green) in the alfalfa root hair with internalized bacteria of S. meliloti labeled by mRFP (magenta) in the IT. Live cell imaging by the Airycsan confocal laser scanning microscope.
Supplemental Video S13. 3D volumetric rendering and orthogonal projection of MTs visualized by GFP-MICROTUBULE-BINDING DOMAIN marker (green) in the alfalfa root hair with internalized bacteria of S. meliloti labeled by mRFP (magenta) in IT. Live cell imaging by the Airycsan confocal laser scanning microscope.
M.O., J.S., M.T., G.K., C.M., O.Š., and J.Š. wrote the manuscript and prepared the tables. M.O., M.T., G.K., J.B., C.M., O.Š., L.K., and J.Š. prepared the materials, figures, and videos. J.Š. provided the infrastructure and funding.
The author responsible for distribution of materials integral to the findings presented in this article in accordance with the policy described in the Instructions for Authors (https://dbpia.nl.go.kr/plphys/pages/General-Instructions) is: Jozef Šamaj ([email protected]).
Acknowledgments
We cordially thank Nicola Maghelli for possibility to use lattice LSFM platform at MPI-CBG Dresden. The authors apologize to colleagues whose work could not be included in this review because of space limitations.
Funding
This work has been supported by the Czech Science Foundation GAČR (project Nr. 19-18675S) and by the ERDF project “Plants as a tool for sustainable global development” (No. CZ.02.1.01/0.0/0.0/16_019/0000827).
Conflict of interest statement. Authors declare that they have no conflicts of interests.
References
Gronnier J, Crowet JM, Habenstein B, Nasir MN, Bayle V, Hosy E, Platre MP, Gouguet P, Raffaele S, Martinez D, et al. (2017) Structural basis for plant plasma membrane protein dynamics and organization into functional nanodomains. eLife 6: e26404
Author notes
Senior author.
These authors contributed equally to this work.
