


Abstract
The Arabidopsis (Arabidopsis thaliana) BTB-TAZ DOMAIN PROTEIN 2 (BT2) contains an N-terminal BTB domain, a central TAZ zinc-finger protein–protein interaction domain, and a C-terminal calmodulin-binding domain. We previously demonstrated that BT2 regulates telomerase activity and mediates multiple responses to nutrients, hormones, and abiotic stresses in Arabidopsis. Here, we describe the essential role of BT2 in activation of genes by multimerized Cauliflower mosaic virus 35S (35S) enhancers. Loss of BT2 function in several well-characterized 35S enhancer activation-tagged lines resulted in suppression of the activation phenotypes. Suppression of the phenotypes was associated with decreased transcript abundance of the tagged genes. Nuclear run-on assays, mRNA decay studies, and bisulfite sequencing revealed that BT2 is required to maintain the transcriptionally active state of the multimerized 35S enhancers, and lack of BT2 leads to hypermethylation of the 35S enhancers. The TAZ domain and the Ca++/calmodulin-binding domain of BT2 are critical for its function and 35S enhancer activity. We further demonstrate that BT2 requires CULLIN3 and two bromodomain-containing Global Transcription factor group E proteins (GTE9 and GTE11), to regulate 35S enhancer activity. We propose that the BT2-CULLIN3 ubiquitin ligase, through interactions with GTE9 and GTE11, regulates 35S enhancer activity in Arabidopsis.
Introduction
Activating endogenous genes using DNA enhancers, i.e. activation tagging, has led to the discovery of numerous genes and their functions (Marsch-Martínez and Pereira, 2010). Activation tagging has advantages over traditional loss-of-function screens. For instance, it can be used to study functions of essential genes, redundant genes, and for positive selection or gain-of-function screens for resistance to chemical, physical, or biological stresses. This approach is popular in plant biology, both in model and nonmodel plant species such as Arabidopsis (Arabidopsis thaliana; Weigel et al., 2000), rice (Oryza sativa; Jeong et al., 2002), tobacco (Nicotiana tabacum; Ahad et al., 2003), tomato (Solanum lycopersicum; Mathews et al., 2003), barley (Hordeum vulgare; Ayliffe et al., 2007), petunia (Petunia × atkinsiana; Zubko et al., 2002), poplar (Populus trichocarpa; Busov et al., 2011), resurrection plant (Selaginella lepidophylla; Furini et al., 1997), Catharanthus roseus (van der Fits and Memelink, 2000), and Lotus japonicus (Imaizumi et al., 2005). Multimerized Cauliflower mosaic virus (CaMV) 35S enhancers are often the choice for activation tagging because of their versatility (Hayashi et al., 1992; Weigel et al., 2000), and several variants of the 35S enhancer-based activation tagging systems exist (Pogorelko et al., 2008; Qu et al., 2008).
CaMV is a double-stranded DNA virus that belongs to the Caulimovirus genus (supergroup: pararetrovirus; Ow et al., 1987). Seminal work performed more than three decades ago discovered that CaMV 35S is a very strong promoter that confers constitutive expression to heterologous genes without any requirement for CaMV proteins (Odell et al., 1985). The promoter consists of two domains, A and B (Benfey and Chua, 1990; Supplemental Figure S1). Domain A contains nt −90 to +8 relative to the transcription start site (TSS; from here on referred to as the 35S core promoter). The 35S core promoter contains a tandem repeat of TGACG nucleotides separated by 7 bp known as activating sequence 1 (as-1; Lam et al., 1990). Members of the TGA family of plant bZIP transcription factors, also implicated in pathogenesis-related gene expression, bind to as-1 elements and contribute to the promoter activity in host cells (Katagiri et al., 1989; Lam and Lam, 1995).
The less studied domain B consists of nt −343 to −90 from the TSS and constitutes the 35S enhancer. The enhancer includes a binding element, as-2, which contains two GT motifs. A so-called ACTIVATION SEQUENCE FACTOR 2 (ASF2) from tobacco (N. tabacum) nuclear extracts interacts with as-2 elements (Lam and Chua, 1989). Although the specific identity of ASF2 is not yet known, it is presumed to be a member of the GATA-binding family of transcription factors (Teakle et al., 2002). A third upstream, CA-rich region and a putative binding factor, CA-RICH REGION FACTOR (CAF), has been suggested (Benfey and Chua, 1990), but was not fully characterized.
35S enhancers can function independently of the core promoter, and they confer different developmental stage- and tissue-specific expression patterns to reporter genes because of intrinsic differences in cis- and trans-regulatory elements (Benfey et al., 1989). Moreover, 35S enhancers activate endogenous expression of genes, causing constitutive expression (Weigel et al., 2000). The presumed mechanism of 35S enhancers is that when randomly inserted near a gene, they direct recruitment of transcriptional machinery, including general transcription factors, mediators, histone acetyltransferases, chromatin remodelers, etc., which activate transcription. This model is based on studies with model enhancers such as those from Drosophila wing margins (Jack et al., 1991), Simian virus 40 (Weiher et al., 1983), and Human immunodeficiency virus-1 (Jakobovits et al., 1988).
Despite their extensive use in plant biology and functional genetics, the identity of the cellular factors that regulate 35S enhancer function have remained unknown. In this study, we show that the Arabidopsis BTB-TAZ DOMAIN PROTEIN 2 (BT2) is essential for activation of gene expression by the multimerized 35S enhancers. We propose that BT2 assembles into a CULLIN3-based ubiquitin ligase that, together with the bromodomain containing GLOBAL TRANSCRIPTION FACTOR GROUP E PROTEINS (GTE9 and GTE11), is required for 35S enhancer-mediated transcription.
Results
BT2 is essential for gene activation by multimerized 35S enhancers
Overexpression of BT2 in yucca1d, a 35S enhancer activation-tagged line that possesses enhanced transcript levels of YUCCA1 (involved in auxin biosynthesis; Zhao et al., 2001), exacerbates its high-auxin phenotypes (Ren et al., 2007; Figure 1B). In contrast, loss of BT2 (bt2-1, a SALK T-DNA knockout line) in the yucca1d line suppresses its characteristic high-auxin phenotypes such as epinastic cotyledons and leaves, shorter primary roots, excessive root hairs, and delayed flowering (Mandadi et al., 2009; Figure 1B). Further analysis of BT2 revealed that it did not affect auxin responses per se in the yucca1d line (Supplemental Figure S2) and suggested that BT2 affected yucca1d phenotypes in a different manner.
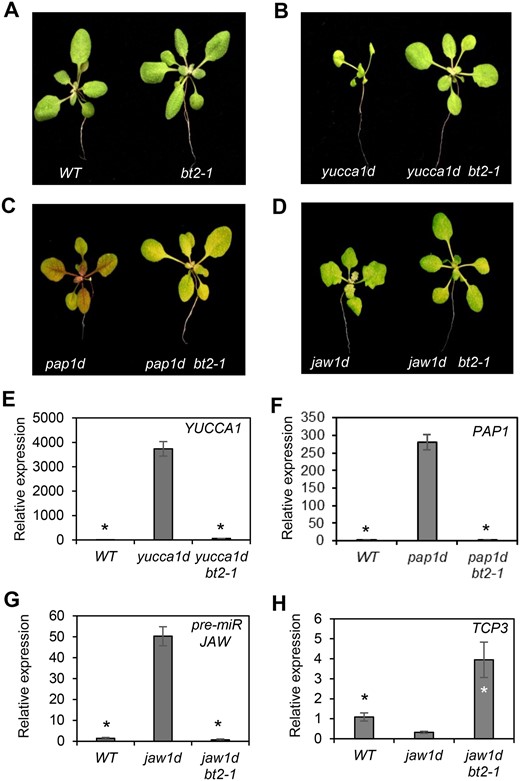
Loss of BT2 suppresses 35S enhancer activation-tagged phenotypes and gene expression. A, WT and bt2-1 phenotypes. B–D, Reversal of activation-tagged phenotypes such as: (B) epinastic leaves of the yucca1d line in yucca1d bt2-1 plants, (C) purple leaves of the pap1d line in pap1d bt2-1 plants, and (D) uneven/jagged leaf shape of the jaw1d line in jaw1d bt2-1 plants. E–H, Expression of (E) YUCCA1, (F) PAP1, (G) precursor of miR-JAW and its target, and (H) TCP3 was determined in the indicated activation-tagged lines and yucca1d bt2-1, pap1d bt2-1, and jaw1d bt2-1 lines. Total RNA was extracted and subjected to RT-qPCR. EIF-4A2 was used to normalize the expression data. Expression values are plotted relative to the WT (set to ∼1). Error bars represent standard error (se) among biological replicates (n = 3). The asterisks represent statistically significant differences between the indicated samples and the respective activation-tagged lines as determined by two-sample t test (P ≤ 0.01).
In addition to the yucca1d line, we studied BT2 in several unrelated but well-characterized 35S enhancer activation-tagged lines, including pap1d (Borevitz et al., 2000) and jaw1d (Palatnik et al., 2003). Each activation line has a characteristic phenotype associated with activation of a single gene by the 35S multimerized enhancers inserted nearby. pap1d plants have purple pigmentation in their organs due to accumulation of anthocyanins caused by overexpression of a MYB family transcription factor, PRODUCTION OF ANTHOCYANIN PIGMENT 1 (PAP1; Borevitz et al., 2000; Figure 1C). jaw1d plants have uneven leaf shape and curvature caused by overexpression of a microRNA (miR-JAW) precursor (Figure 1D). The jaw mutants also have reduced expression of genes in the TCP family of transcription factors, which are targets of miR-JAW (Palatnik et al., 2003). We crossed the yucca1d, pap1d, and jaw1d activation lines with bt2-1 plants to generate the yucca1d bt2-1, pap1d bt2-1, and jaw1d bt2-1 lines. Loss of BT2 reversed the 35S enhancer activation phenotypes in the offspring (Figure 1, A–D).
Reverse transcription quantitative PCR (RT-qPCR) analysis revealed that BT2 is required to maintain expression of the activated genes in the activation lines. Expression of YUCCA1, PAP1, and the miR-JAW precursor in the yucca1d bt2-1, pap1d bt2-1, and jaw1d bt2-1 lines was suppressed when compared to the respective activation-tagged lines (Figure 1, E–G). Furthermore, the level of TCP3 mRNA, the miR-JAW target, was restored in jaw1d bt2-1 plants (Figure 1H). To further investigate the cellular factors that regulate 35S enhancer function, we chose the yucca1d activation line as our main model because of its conspicuous phenotype, which is amenable to easy screening.
The introduction of another BT2 T-DNA loss-of-function allele (bt2-2; Ren et al., 2007) in the yucca1d activation line also suppressed its characteristic high-auxin phenotypes (Supplemental Figure S3A). We obtained similar phenotypes in progeny from reciprocal crosses between the yucca1d line and the bt2-1 or bt2-2 mutants, which ruled out any parental effects (Supplemental Figure S3B). Our results with multiple, unrelated activation-tagged lines eliminated the possibility of any locus-specific suppression occurring in the 35S enhancer lines independent of BT2 function.
Next, to eliminate the possibility of any potential cross hybridization-induced silencing phenomena that could be occurring in the yucca1d bt2 line, we directly edited BT2 in the yucca1d background (yucca1d Cas9-sgBT2) using the clustered regularly interspaced short palindromic repeats (CRISPR)/CRISPR-associated protein 9 (Cas9) gene editing approach (Figure 2A). Amplicon sequencing of a homozygous yucca1d Cas9-sgBT2 edited line revealed a single-nucleotide (C) frameshift insertion in the target site (BT2 fourth exon; Figure 2B). This insertion would potentially result in a truncated BT2 protein (282 aa) with only a portion of the central TAZ domain and devoid of the C-terminus calmodulin-binding domain (CaMBD; Du and Poovaiah, 2004). We observed significant suppression of YUCCA1 expression and general reversal of the activation-tagged phenotypes in the yucca1d Cas9-sgBT2 edited line, but not in the yucca1d Cas9-alone control, when compared to yucca1d plants (Figure 2, C and D).
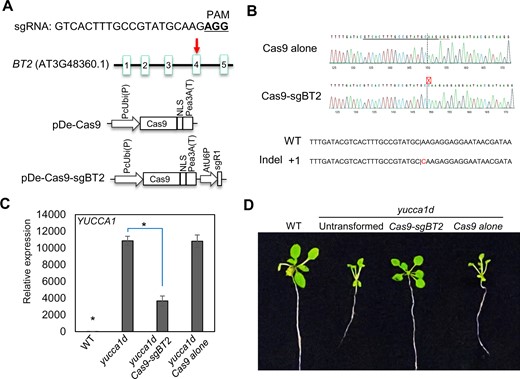
CRISPR–Cas9-mediated gene editing of BT2 in the yucca1d line suppressed YUCCA1 expression and reversed the activation-tagged phenotype. A, Schematic representation of the Arabidopsis BT2 gene; the position of the sgRNA targeting the fourth exon of BT2 is indicated by a red arrow. Green boxes indicate different exons; lines indicate introns, and the sequence of the 20-bp sgRNA and its corresponding protospacer adjacent motif sequence (underlined) is shown on the top. CRISPR-Cas9 binary vectors (pDe-Cas9 alone or with sgBT2) used to transform yucca1d plants are shown in the bottom panels. B, Amplicon sequencing of a homozygous edited line showed a single base insertion in the BT2 target site. C. Expression analysis of YUCCA1 in the WT, yucca1d, and yucca1d transformed with the Cas9-sgBT2 or Cas9 constructs showed suppression of YUCCA1 expression in the BT2-edited line, but not in the transformant containing Cas9 alone. EIF-4A2 was used to normalize the expression data. Expression values are plotted relative to the WT (set to ∼1). Error bars represent se among biological replicates (n = 3). The asterisks represent statistically significant differences between the indicated samples and the yucca1d line as determined by two-sample t test (P ≤ 0.01). D, Phenotypic analysis showed reversal of the high-auxin phenotypes in the BT2-edited line, which correspond with the lower YUCCA1 levels, when compared to the yucca1d line or the yucca1d line transformed with Cas9 alone.
Because vectors used to generate activation-tagged lines (Weigel et al., 2000), T-DNA knockout lines from SALK (Alonso et al., 2003), and/or the CRISPR–Cas9 vectors share ∼300-bp identity at the 35S enhancers, we tested for homology-dependent trans-silencing (Mette et al., 1999, 2000; Sijen et al., 2001). We crossed yucca1d plants to two other SALK T-DNA loss-of-function lines, pht4;2-1 and tpt-2, in unrelated genes PHOSPHATE TRANSPORTER4;2 (PHT4;2) and TRIOSE PHOSPHATE TRANSLOCATOR (TPT; Irigoyen et al., 2011). We found no suppression of yucca1d activation phenotypes in the yucca1d pht4;2-1 or yucca1d tpt-2 lines (Supplemental Figure S3, C and D). Finally, direct introduction of the full-length 35S promoter driving GFP expression in the bt2-1 mutant had no effect on GFP expression (Supplemental Figure S4). Taken together, these results exclude potential silencing triggered by 35S promoter/enhancer homology in the background genotype.
Further indication that BT2 affects multimerized 35S enhancer activity comes from the observation that overexpression of BT2 using the full-length 35S promoter (BT2OE) in the yucca1d line exacerbated its high-auxin phenotypes (Ren et al., 2007). The yucca1d BT2OE line also exhibited poor seed set, partial sterility (Supplemental Figure S3, E and F), a phenotype reminiscent of constitutive activation of YUCCA1 (Zhao et al., 2001). Taken together, these results support our hypothesis that BT2 is a bona fide regulator of 35S enhancer activity.
Loss of BT2 results in hypermethylation of the 35S enhancers in the activation-tagged lines
BT2 might modulate transcript levels in the activation-tagged lines by activating transcription via the 35S enhancer or by stabilizing mRNA turnover post-transcriptionally. Using a robust transcription inhibitor, cordycepin (Gutierrez et al., 2002), we determined the rate of YUCCA1 mRNA turnover. The YUCCA1 mRNA turnover half-life was ∼30 min in the wild-type (WT; Supplemental Figure S5A). The turnover kinetics largely remained unaffected by BT2 loss of function in the bt2-1 and yucca1d bt2-1 plants (Supplemental Figure S5A). If anything, there appeared to be a slight increase in YUCCA1 mRNA turnover in the yucca1d line, which perhaps could be due to the very high (more than 10,000-fold) levels of YUCCA1 mRNA that is being transcribed relative to the WT (Figure 2C). These results suggest that BT2 does not function in stabilizing YUCCA1 mRNA. Next, to determine whether BT2 affected transcription, we performed nuclear run-on assays. The results showed that YUCCA1 transcription was high in the yucca1d line when compared to the WT, as expected, due to the expression activation by the 35S enhancers (Figure 3A). In contrast, YUCCA1 transcription in the yucca1d bt2-1 line was suppressed to a similar level as that in the WT, suggesting that BT2 is required to maintain high levels of YUCCA1 transcription in the yucca1d line (Figure 3A). We also performed nuclear run-on analysis in the pap1d and pap1d bt2-1 lines and obtained similar results (Figure 3B). The two independent experiments with yucca1d and pap1d support BT2’s involvement in transcriptional activation in the multimerized 35S enhancer-tagged lines.
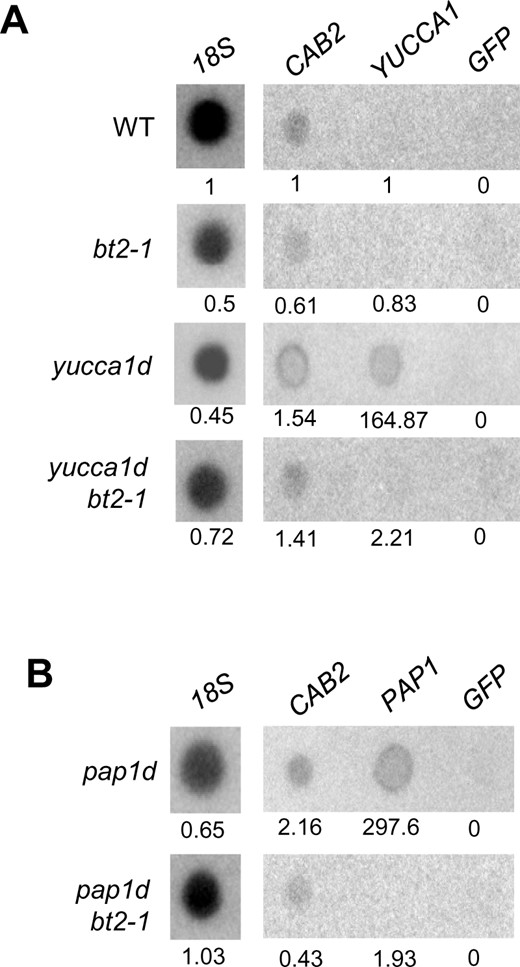
BT2 regulates transcription in the 35S enhancer lines. A, Active nuclei from the WT, bt2-1, yucca1d, and yucca1d bt2-1 lines or (B) pap1d and pap1d bt2-1 lines were extracted and subjected to in vitro run-on transcription reactions with 32P-UTP. Nascent labeled RNA was extracted and hybridized to nylon membranes bound with denatured 18S, CAB2, YUCCA1, PAP1, and GFP cDNA sequences. The intensity of radioactive signals represents the rate of transcription of the respective genes. 18S rRNA and CAB2 signals were used as positive controls for labeling and hybridization. GFP signal was used as a control for non-specific binding. ImageJ was used to quantify the intensity of the blot signals and the values shown are relative to that of the WT (set to ∼1).
Because epigenetic modifications to DNA and/or chromatin can affect transcription, we examined the DNA methylation status of the yucca1d locus (Figure 4A). We first used the methylation-sensitive endonuclease McrBC-based PCR analysis (Martin et al., 2009). McrBC specifically cleaves DNA that contains methylated cytosines (mC) on either single or double strands. The recognition region consists of two half-sites of the form (G/A)mC separated by ∼50–3,000 nt (Sutherland et al., 1992). McrBC does not cleave unmethylated DNA. Subsequent PCR amplification of the digest will enrich only unmethylated, un-cleaved DNA (Martin et al., 2009). Using this approach, we found methylation at −600 to −2,000-nt upstream from the ATG site of YUCCA1 in the WT (Figure 4B). Coincidentally, while analyzing the genomic sequences, we found a transposable element, HELITRONY1D, in this region. Since transposable elements, which are frequently methylated and silenced, can affect expression of nearby genes (Martin et al., 2009), it is possible that HELITRONY1D in the YUCCA1 promoter could contribute to the low and restricted expression of endogenous YUCCA1 in shoot apical meristems and flower primordia (Cheng et al., 2006). However, loss of BT2 in the yucca1d bt2-1 line had no effect on the methylation status of this region (Figure 4B). We did not find any methylation in either the promoter proximal regions (−400 nt) or the YUCCA1 gene body in this line (Figure 4B). In contrast, we observed increased methylation of the region spanning the multimerized 35S enhancer insertion in the yucca1d bt2-1 line, visualized by lack of enrichment of the corresponding PCR amplicons (Figure 4B). The observed 35S enhancer amplification differences in the McrBC-treated yucca1d and yucca1d bt2-1 samples were further quantified by quantitative (q) PCR (Figure 4E). Next, we performed bisulfite sequencing of yucca1d and yucca1d bt2-1, and the results confirmed the hypermethylation patterns observed in McrBC analysis (Figure 4C;Supplemental Figure S6). Bisulfite sequencing revealed hypermethylation of the 35S enhancers not only at CpGs, but also at several non-CpG dinucleotides in the yucca1d bt2-1 line (Figure 4C), which is not uncommon for plant DNA methylation patterns (Lister et al., 2008). Lastly, the 35S enhancers were also hypermethylated in a second line, pap1d bt2-1, based on McrBC-analysis, compared to the pap1d line (Figure 4, D and F).
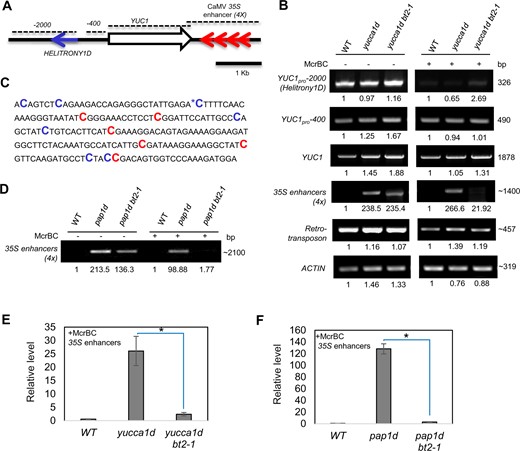
Loss of BT2 results in hypermethylation of 35S enhancers in the activation-tagged lines. A, The YUCCA1 locus in the yucca1d line. 35S enhancers are indicated as red arrows. Dotted lines represent regions of DNA subjected to McrBC-PCR analysis. B, McrBC-sensitive PCR analysis of the YUCCA1 locus in WT, yucca1d, and yucca1d bt2-1 plants. (−) and (+) represent mock and McrBC digestion, respectively. With this assay, unmethylated DNA regions are amplified by PCR and can be visualized as a single fragment, while methylated DNA regions are sensitive to digestion by the McrBC endonuclease; hence, their amplification is greatly reduced or eliminated. Note: The lack of amplification of the 35S enhancer (4×)-spanning region in WT samples is because they do not have any 35S enhancers, and as such are not linked to the methylation status. A retrotransposon and ACTIN genomic regions were amplified to serve as positive and negative controls for methylated and unmethylated DNA loci, respectively. C, 35S enhancer methylation status as determined by bisulfite sequencing in the yucca1d bt2-1 line. Methylated CpGs and non-CpGs are highlighted in red and blue font, respectively. The asterisk represents mC also observed in the yucca1d line. D, McrBC-sensitive PCR analysis of 35S enhancers in the pap1d and pap1d bt2-1 lines. ImageJ was used to quantify the intensity of the PCR products in B and D, and the values shown are relative to the WT (set to 1). E and F, Quantitative (q) PCR estimation of McrBC-treated 35S enhancers. In an independent experiment, genomic DNA of WT, yucca1d, yucca1d bt2-1, pap1d, pap1d bt2-1 lines were subjected to McrBC digestion, followed by qPCR-based amplification of 35S enhancers. Unmethylated ACTIN was used to normalize the qPCR data and 35S enhancer amplicon levels were plotted relative to the WT (set to ∼1). The asterisks represent statistically significant differences between the indicated samples and the yucca1d line as determined by two-sample t test (P ≤ 0.01).
The Ca++/CaMBD and TAZ domain of BT2 are critical for its effect on 35S enhancer activity
BT2 has a CaMBD at its C-terminus, which interacts with recombinant calmodulin in a calcium-dependent manner in vitro and in yeast two-hybrid (Y2H) assays (Du and Poovaiah, 2004). Uno et al. (2009) found that BT2 interacts with two constitutively active forms of CALCIUM-DEPENDENT PROTEIN KINASE (CPK), CPK3, and CPK11, in Y2H assays. BT2 also has a central zinc-finger (TAZ) domain, presumably involved in protein–protein interactions (Du and Poovaiah, 2004). CRISPR–Cas9 editing of BT2 in the yucca1d line, resulting in a putative truncated BT2 protein with a disrupted TAZ domain and no CaMBD, attenuated the 35S enhancer-mediated activation of YUCCA1 expression (Figure 2). To further analyze the role of these BT2 subdomains in regulating 35S enhancer-mediated transcription, we generated the following: (1) a mutant form of BT2 (BT2mut) with three point mutations (K333E, W334K, and K335E) in the conserved CaMBD (Du and Poovaiah, 2004; Du et al., 2009), presumably affecting its ability to bind to calmodulin and (2) a truncated form of BT2 with only the TAZ domain (TAZBT2). Overexpression of either TAZBT2 or BT2mut forms in the yucca1d line suppressed the YUCCA1 activation phenotypes likely by competing with native BT2 in a dominant-negative manner (Figure 5, A and B; Supplemental Figure S7A), and resulted in lower YUCCA1 expression (Figure 5C), suggesting the importance of the CaMBD and the TAZ domains in BT2 function. Similar results were obtained with multiple independent transformants (Figure 5, A and B; Supplemental Figure S7B). Verification of endogenous BT2 levels in the transgenic lines excluded potential BT2 silencing occurring due to overexpression of TAZBT2 or BT2mut in the yucca1d line (Supplemental Figure S7D).
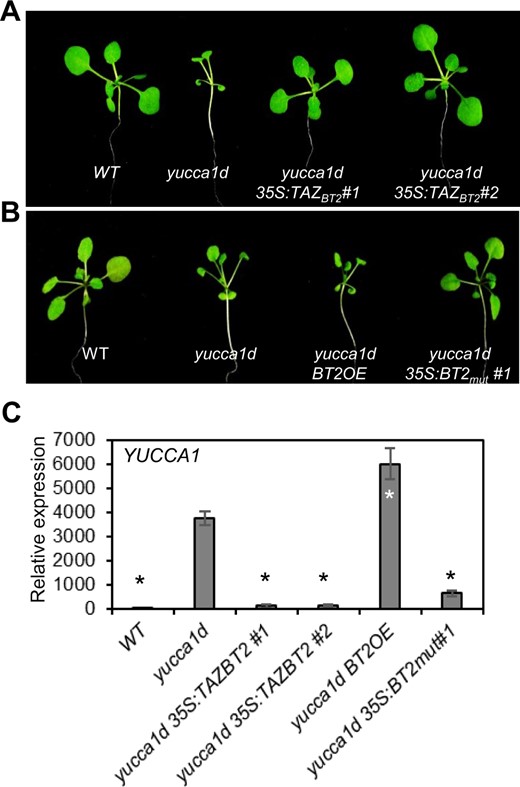
The TAZ domain and the CaMBD are required for BT2 function and 35S enhancer activity. Suppression of activation-tagged phenotypes by (A) overexpression of TAZBT2, and (B) overexpression of BT2mut in the yucca1d line. C, YUCCA1 expression in yucca1d, yucca1d 35S:TAZBT2, and yucca1d 35S:BT2mut lines. Total RNA was extracted and subjected to RT-qPCR. EIF-4A2 was used to normalize the expression data. Expression values are plotted relative to the WT line (set to ∼1). Error bars represent se among biological replicates (n = 3). The asterisks represent statistically significant differences between the indicated samples and the yucca1d line as determined by two-sample t test (P ≤ 0.01).
BT2-interacting proteins GTE9, GTE11, and CULLIN3 are required for BT2 function
BT2 interacted with the GTE11 bromodomain protein in a Y2H assay (Du and Poovaiah, 2004), and with CULLIN3 in an in vitro pull-down assay (Figueroa et al., 2005) through its N-terminal BTB domain. Recently, we demonstrated that GTE11 and its homolog GTE9 genetically interact with BT2 in mediating nutrient and hormone responses (Misra et al., 2018).
We next tested whether these protein partners of BT2 also affected 35S enhancer activity. Similar to loss of BT2, loss of either GTE9 or GTE11 in the yucca1d line suppressed its high-auxin phenotypes (Figure 6A). Moreover, expression of YUCCA1 mRNA was suppressed in yucca1d gte9 and yucca1d gte11 plants, in a manner similar to that in the yucca1d bt2-1 line (Figure 6C). Arabidopsis has two redundant isoforms for CULLIN3 (CUL3A and CUL3B), and cul3a cul3b double mutants are not viable (Figueroa et al., 2005). CUL3A is the predominantly expressed form, and a loss-of-function mutant, cul3a-1, has dramatic reduction of CULLIN3 accumulation (Figueroa et al., 2005). We crossed the cul3a-1 mutant to yucca1d plants. Similar to the yucca1d bt2-1 line, reduction of CULLIN3 expression in the yucca1d cul3a-1 line suppressed its high-auxin phenotypes (Figure 6B) and reduced the expression of YUCCA1 (Figure 6C). Similar results were obtained with the yucca1d cul3b line (Supplemental Figure S8). Finally, we generated and analyzed triple combination lines of yucca1d BT2OE gte9, yucca1d BT2OE gte11, and yucca1d BT2OE cul3a-1. The exacerbated phenotypes of the yucca1d BT2OE line (Ren et al., 2007) were completely reversed upon loss of CULLIN3 (Figure 6D), GTE9 or GTE11 (Figure 6E) in the respective triple lines. Taken together, our results implicate a role for the BT2-interacting proteins CULLIN3, GTE9, and GTE11 in controlling 35S enhancer activity.
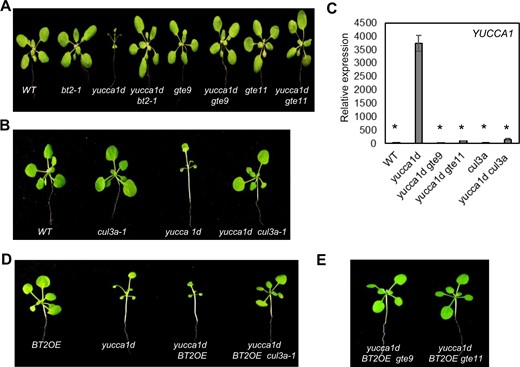
GTE9, GTE11, and CULLIN3 are required for BT2 function and 35S enhancer activation. Suppression of the yucca1d phenotypes (A, B) and YUCCA1 expression (C) in yucca1d gte9, yucca1d gte11, and yucca1d cul3a-1 lines. Total RNA was extracted and subjected to RT-qPCR. EIF-4A2 was used to normalize the expression data. Expression values are plotted relative to the WT line (set to ∼1). Error bars represent se among biological replicates (n = 3). The asterisks represent statistically significant differences between the indicated samples and the yucca1d line as determined by two-sample t test (P ≤ 0.01). Reversal of the exacerbated phenotypes of the yucca1d BT2OE line in (D) the yucca1d BT2OE cul3a-1 lines, and (E) the yucca1d BT2OE gte9 and yucca1d BT2OE gte11 lines.
Discussion
A large proportion (∼20%–40%) of proteins in eukaryotic genomes are annotated as unknown or partially known (Horan et al., 2008; Lamesch et al., 2011; Dhanyalakshmi et al., 2016). Activation tagging of genes with multimerized 35S enhancers was a breakthrough when it was introduced in the year 2000 (Weigel et al., 2000; Jeong et al., 2002; Zubko et al., 2002; Ahad et al., 2003; Mathews et al., 2003; Imaizumi et al., 2005; Ayliffe et al., 2007; Pogorelko et al., 2008; Qu et al., 2008; Busov et al., 2011; Marsch-Martínez and Pereira, 2010; Sato et al., 2017). Despite its widespread use, very little is known about the mechanism of 35S enhancer action. Our study demonstrates that BT2 and its associated proteins are required for 35S enhancer function in Arabidopsis. Loss of BT2 function suppressed the phenotypes of multiple independent 35S enhancer activation-tagged lines (Figures 1, A–D and 2). The reversal of phenotypes was due to loss of expression of the activation-tagged genes (Figures 1, E–H and 2). Mimicking the characteristics of a true regulator (Blackwood and Kadonaga, 1998), BT2 regulated 35S enhancer activity independent of the position or location of the enhancer in the different activation lines. Using nuclear run-on assays and mRNA turnover experiments, we showed that BT2 likely mediates transcription of the activation-tagged genes (Figure 3, A and B and Supplemental Figure S5A).
Although 35S enhancers are derived from the full-length 35S promoter, loss of BT2 did not affect full-length 35S promoter activity (Supplemental Figure S4). There are two plausible explanations for this result. First, the CaMV 35S promoter functions as a combinatorial module (Benfey and Chua, 1990). The strong 35S core promoter can itself recruit multiple transcription factors/activators (Lam and Chua, 1989; Supplemental Figure S1), and BT2 may not be one of them. Second, due to their relatively weak activity alone, 35S enhancers were multimerized for effective utilization in activation tagging (Benfey et al., 1989; Fang et al., 1989; Lam and Chua, 1989; Hayashi et al., 1992). Consequently, multimerization may be a prerequisite for BT2 to regulate 35S enhancers. Further research is needed to address this possibility. Furthermore, the fact that loss of BT2 did not affect full-length 35S promoter activity, and the failure of the unrelated 35S promoter-containing SALK T-DNA lines pht4;2-1 and tpt2-1, and the pROK2 vector, to suppress yucca1d phenotypes (Supplemental Figure S3C) argues against any 35S promoter homology-dependent trans-silencing (Mette et al., 1999; Sijen et al., 2001) triggered in the activation lines because of multiple 35S promoter sequences.
Enhancers activate transcription by recruiting or enhancing the interaction among transcription factors and regulators (Blackwood and Kadonaga, 1998). However, high A/T nucleotide content, a general feature of nuclear matrix-interacting regions (MARs), can act as enhancers and activate transcription (Sandhu et al., 1998). A pea (Pisum sativum) plastocyanin gene PetE enhancer/MAR, rich in A/T nucleotides (80%), interacts with nuclear matrices, and mediates acetylation of histones at the linked promoters (Sandhu et al., 1998; Chua et al., 2003). Our analysis of 35S enhancer sequences did not reveal any substantial A/T-rich nucleotide regions (overall 53% AT), and hence may not support their ability to function as MARs. Alternatively, multiple 35S enhancers could be substrates for DNA/chromatin modifications and may recruit transcriptional machinery, such as BT2, which could be required to maintain the transcriptionally active state of the multimerized enhancers and the tagged genes. Indeed, loss of BT2 in the activation-tagged lines resulted in hypermethylation of the 35S enhancers at multiple CpG and non-CpG dinucleotides (Figure 4, B–D). The pattern of methylation is consistent with the activity of an RNA-directed DNA methylation pathway, which induces silencing of repetitive DNA elements and genes in plants (Matzke and Mosher, 2014).
Based on its protein structure, BT2 does not seem to directly function as an enhancer-binding transcription factor or an activator. BT2 has three distinct subdomains: an N-terminal BTB/POZ domain, a central TAZ domain, and a C-terminal CaMBD (Du and Poovaiah, 2004). The TAZ domain of BT2 is similar to the TAZ domain of transcriptional scaffold and activator proteins such as CREB-binding protein (CBP) and p300 (De Guzman et al., 2000). CBP and p300 are also involved in transcriptional regulation of genes in a variety of biological functions by interacting with numerous cellular factors via TAZ domains (Goodman and Smolik, 2000). CRISPR–Cas9-mediated editing of the BT2 coding sequence to disrupt its TAZ domain in the yucca1d line (Figure 2), or overexpression of truncated BT2 containing only the TAZ domain (TAZBT2) in the yucca1d line suppressed the activation phenotypes and decreased the expression of YUCCA1 (Figure 5, A and C). The dominant-negative effect of TAZBT2 overexpression could be due to sequestering of cellular factors required for 35S enhancer activity by the TAZ domain. It is possible that those factors include chromatin remodelers, transcription factors, or activators. Similarly, CRISPR–Cas9-mediated editing of the BT2 coding sequence, resulting in deletion of the CaMBD, in the yucca1d line (Figure 2) or overexpression of mutated BT2 (BT2mut) with altered calmodulin-binding sites in the conserved CaMBD region (Du and Poovaiah, 2004; Du et al., 2009) in the yucca1d line suppressed the yucca1d phenotypes and YUCCA1 expression (Figure 5, B and C). As hypothesized by Du and Poovaiah (2004), our results provide evidence for a critical role of the CaMBD in BT2 function, possibly to perceive and transduce Ca++ signals via calmodulin, which remains to be tested. Given the pervasive role of Ca++ signaling in plant growth and development, it is also tempting to speculate that the control of 35S enhancers by Ca++ may also explain the apparent differential developmental and spatial expression patterns rendered to reporter genes by 35S enhancers (Benfey et al., 1989; Benfey and Chua, 1990).
BTB domain-containing proteins in yeast (Saccharomyces cerevisiae), Caenorhabditis elegans, Arabidopsis, and other organisms generally associate with CULLIN3 and function as substrate-specific adapters in a ubiquitin ligase to target specific proteins for degradation. Previous studies using Y2H and pull-down assays found that BT2 interacted with the bromodomain protein GTE11 (Du and Poovaiah, 2004; Misra et al., 2018), as well as CULLIN3 (Figueroa et al., 2005), via its N-terminal BTB domain. In contrast, multiple studies failed to detect the interaction of BT2 and CULLIN3 in both library and directed Y2H screens (Gingerich et al., 2005; Monika et al., 2005; Weber et al., 2005). In the current study, we demonstrate that GTE9, GTE11, and CULLIN3 are all essential in vivo for BT2 function to regulate 35S enhancer activity (Figure 6). It is rather surprising that multiple GTE proteins and CULLIN3 interact with BT2 via the same BTB domain. It is possible that BT2 could homodimerize or heterodimerize with other BT family proteins and either simultaneously or sequentially interact with GTE proteins and CULLIN3 to form distinct complexes (Gingerich et al., 2005; Robert et al., 2009). Nevertheless, our results provide strong genetic evidence for a BT2, CULLIN3, and GTE protein interaction in vivo.
We propose that BT2 assembles into a functional complex comprising at least GTE9, GTE11, and CULLIN3, and is required for multimerized 35S enhancer activity (Figure 7). BT2 and CULLIN3 could function as a ubiquitin ligase and target certain proteins for destruction by poly-ubiquitination or stabilize them by mono-ubiquitination. Alternatively, the complex may serve as a scaffold and promote interactions among transcriptional regulators such as the GTE proteins. Regardless of the exact mechanism, the BT2 complex may directly or indirectly suppress de novo and/or maintenance methylation of 35S enhancers, and thus preserve their transcriptionally competent state. Notably, since GTE11 activates transcription via its C-terminus extraterminal domain in yeast (Du and Poovaiah, 2004), its requirement in the BT2 complex points toward a potential role in activation of transcription from the multimerized 35S enhancers in plants. Given that BT2 also functions in diverse developmental, environmental, and stress-related responses (Ren et al., 2007; Mandadi et al., 2009; Robert et al., 2009; Araus et al., 2016; Sato et al., 2017), it will be interesting to identify the transcriptional targets of the BT2 complex in the respective signaling pathways.
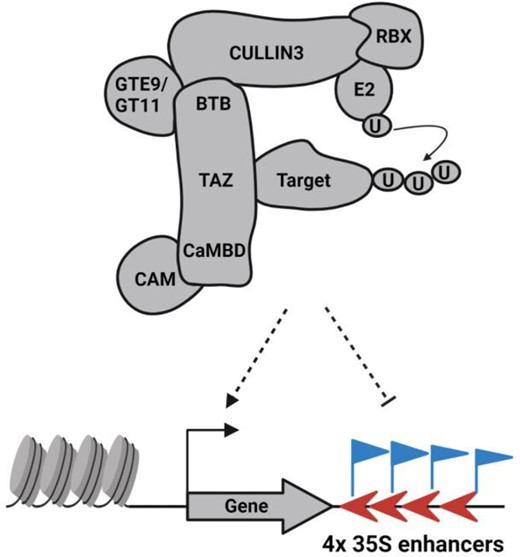
Hypothetical model for regulation of multimerized 35S enhancers by the BT2 complex. BT2 assembles into a functional complex that contains GTE9, GTE11, and CULLIN3. The other components of the ubiquitin ligase complex include UBIQUITIN (U), a UBIQUITIN conjugating enzyme (E2), a RING-box protein (RBX) that interact with CULLIN3, and CALMODULIN (CAM) protein that interacts with BT2 at the C-terminus. As a putative ubiquitin ligase, BT2 may interact with and mark transcriptional regulators (target) for destruction by polyubiquitination or activation by monoubiquitination, leading to reduced methylation of multimerized 35S enhancers, and consequently potentiating their transcriptional activity. 35S enhancers are indicated by red arrowheads. Blue flags indicate DNA methylation marks. Chromatin and gene sequences are colored gray. Figures are not scaled to molecular weights of proteins and were created with BioRender.com.
Materials and methods
Plant growth conditions
Plants were grown in soil in a 14-h light/10-h dark photoperiod at 21°C and a light intensity of ∼120–130 µmol m−2s with 70% relative humidity, unless otherwise stated. For growth in nutrient media, seeds were surface sterilized with 50% (v/v) bleach and 0.1% (v/v) Triton X-100 for 7 min, cold treated at 4°C for 3–4 d and grown on Murashige and Skoog (MS) medium (Sigma) with 0.8% (w/v) phytagar under continuous low light (∼30 µmol m−2s−1). All media contained 1% w/v sucrose.
Transgenic lines, plasmids, and constructs
The BT2OE, bt2-1, yucca1d, gte9, and gte11 lines were previously described (Zhao et al., 2001; Ren et al., 2007). The cul3a-1, pap1d, and jaw1d lines were obtained from the Arabidopsis Biological Resource Center at the Ohio State University. yucca1d seeds and the 35S:YUC1 plasmid were a generous gift from Dr Yunde Zhao, University of California at San Diego. The pht4;2-1 and tpt-2 lines were previously described (Irigoyen et al., 2011). The 35Spro:GFP construct was constructed in the binary vector pCBK05 with phosphinotricine (BASTA) herbicide resistance as the selectable marker and was used to generate the 35S:GFP transgenic lines. The sequence corresponding to the TAZ domain of BT2 (Du and Poovaiah, 2004) was cloned under the control of the 35S promoter in the binary vector pCBK05. The BT2mut construct containing mutations in the BT2 coding sequence (K333E, W334K, and K335E) corresponding to the CaMBD (Du and Poovaiah, 2004; Du et al., 2009) was generated by QuickChange II mutagenesis system following the manufacturer’s instructions (Stratagene). All clones were verified by Sanger DNA sequencing.
For CRISPR experiments, single-guide RNA (sgRNA) targets were designed to disrupt the BT2 fourth exon using the CRISPR-P design toolset (Lei et al., 2014). The sequences of the sgRNA are shown in Figure 2A. The sgRNA was synthesized as complementary oligos (Integrated DNA Technologies, Inc., IA, USA) with the appropriate overhang sequences and were self-annealed followed by phosphorylation. The sgRNA was then ligated into the pChimera vector containing the Arabidopsis U6-26 promoter (Fauser et al., 2014) at the BbsI site. The customized RNA chimera cassette was subcloned into the pDe-Cas9 (Fauser et al., 2014) vector to obtain a functional Cas9 binary vector (Figure 2A). The Cas9 vector carrying sgBT2 or the empty Cas9 vector was independently transformed into Arabidopsis using the floral dip approach. Seeds from primary transformants were selected on hygromycin to recover the transformed T1 plants. We conducted insertion/deletion analysis of the T1 transformants and the selected lines with mutations (as determined by amplicon sequencing of the target site) were propagated further to the T2 generation to recover a homozygous BT2-edited line with a single-nucleotide insertion. For amplicon sequencing, a 500-bp target region encompassing the BT2 fourth exon was amplified using PCR with gene-specific primers and Phusion Polymerase (New England Biolabs). The PCR amplicons were cleaned using DNA PCR clean up kits (Zymo Research, Irvine, CA, USA) and sequenced using Sanger sequencing (Eton Bioscience, Inc., San Diego, CA, USA), followed by sequence analysis by the Inference of CRISPR Edits tool (Hsiau et al., 2018).
RNA isolation and gene expression analysis
For treatments with exogenous indole acetic acid (IAA; Supplemental Figure S2), 7- to 8-d-old seedlings grown on MS agar medium were transferred to MS liquid medium containing either IAA (10 µM) or DMSO (0.1%) and were treated for 3 h. Expression of auxin-responsive genes was determined by RT-qPCR analysis. Total RNA was isolated using TRI reagent following the manufacturer’s protocol (Ambion). We used 1 µg of RNA to make cDNA using SuperScript first-strand cDNA synthesis kit (Invitrogen). Amplification was performed using Power SYBR Green Master Mix (Applied Biosystems) and the ABI Prism 7500 sequence detection system (Applied Biosystems). EIF-4A2 (At1g54270) was used to normalize the expression and fold changes were calculated following the ΔΔCT method (Livak and Schmittgen, 2001). Expression values are plotted relative to the WT (set to 1). Statistically significant differences were determined by two-sample Student’s t test (P ≤ 0.01 as indicated).
Nuclear run-on analysis
Run-on analysis was performed as described previously (Folta and Kaufman, 2006), with minor modifications. First, 3–4 g of one-week-old Arabidopsis seedlings were harvested and briefly rinsed in three tissue volumes of ice-cold anhydrous ethyl-ether (Sigma). Tissues were washed three times with three volumes of extraction buffer (2.0 M hexylene glycol, 20 mM PIPES-KOH [pH 7.0], 10 mM MgCl2, and 5 mM β-mercaptoethanol). Tissues were re-suspended in three volumes of extraction buffer and homogenized. The homogenate was filtered through three layers of Miracloth, and Triton X-100 (1%) solution was added to the final volume and mixed gently. The extract was overlayed on a gradient of 80% and 30% Percoll solutions (Sigma) prepared in gradient buffer (0.5 M hexylene glycol, 5 mM PIPES-KOH [pH 7.0], 10 mM MgCl2, 5 mM β-mercaptoethanol, and 1% Triton X-100) and centrifuged at 2,000g for 30 min at 4°C. After centrifugation, the nuclei accumulated at the interface were collected and re-suspended in 10 mL of gradient buffer. The nuclei were overlayed again on a 30% percoll solution in gradient buffer and centrifuged at 2,000g for 15 min at 4°C. The final nuclei pellet was re-suspended in nuclei storage buffer (50 mM Tris–HCl [pH 7.8], 10 mM β-mercaptoethanol, 20% glycerol, 5 mM MgCl2, and 0.44 M sucrose) and stored at −80°C in aliquots of 50 µL.
Batches of nuclei obtained similarly at the same time from different genotypes were used directly for the nuclear run-on reactions. Twenty units of RNAsin (Promega) was added to 50 µL of nuclei and incubated at 30°C for 10 min. Then, 100 mM of ATP, GTP, and CTP (Epicenter), and 100 µCi of 32P-UTP (Amersham) were added to the nuclei along with 10× transcription assay buffer (250 mM Tris–HCl [pH 7.8], 375 mM NH4Cl, 50 mM MgCl2, and 50% (v/v) glycerol) to a final reaction volume of 100 µL. The reaction was incubated at 30°C for 30 min. Then, 10 U of DNaseI was added and incubated at 30°C for another 10 min. The reaction was completely terminated by adding two reaction volumes of termination buffer (7.5 M urea, 0.5% SDS, 20 mM EDTA [pH 7.5], and 100 mM LiCl). Total radiolabeled RNA was isolated using TRI reagent following the manufacturer’s protocol (Ambion). Target gene coding sequences (CDS) were PCR amplified and 1 µg of each CDS was dot-blotted to Hybond N+ membrane (Amersham). Blots were then probed with 32P-labeled in vitro-synthesized nascent transcripts. Following hybridization and washing, the radioactive signals were quantified using a phosphorimager. Expression of 18S rRNA and CAB2 mRNA were used as internal hybridization and loading controls. GFP was used as a negative control for non-specific binding of RNA to DNA. Changes in CAB2 and BT2 transcription during the light and dark phase were used as positive controls for quantifying differences in transcription using this protocol (Supplemental Figure S5, B and C). Primers used are listed in Supplemental Table S1. ImageJ (Schneider et al., 2012) was used to quantify the intensity of the blot signals or RT-PCR products and the values shown are relative to the WT (set to 1), as described in the figure legends.
mRNA turnover determination
YUCCA1 mRNA turnover was analyzed as described previously (Gutierrez et al., 2002), with minor modifications. One-week-old Arabidopsis seedlings grown on MS agar plates were transferred to MS liquid media for a pre-incubation period of 30 min. For inhibiting transcription, 0.6 mM of cordecypin (Sigma) was added to the MS solution. Tissue samples were harvested at 0, 30, 60, and 120 min after cordecypin addition and frozen in liquid nitrogen. Total RNA was isolated using TRI reagent following the manufacturer’s protocol (Ambion). Expression of YUCCA1 was analyzed by RT-qPCR (Supplemental Figure S5A). EIF-4A2 expression was used to normalize the YUCCA1 expression.
McrBC-based methylation assay
McrBC-based methylation analysis was performed according to the manufacturer’s instructions (New England BioLabs). Approximately 1 µg of genomic DNA isolated from the respective genotypes was digested using 50 U of McrBC along with a mock digestion for 8 h. Subsequent amplification of the genomic regions was performed via PCR using specific primers (25–35 cycles). ACTIN7 and a retrotransposon locus (At4g03770) were amplified to serve as negative and positive controls for methylation, respectively. Primers used for PCR are listed in Supplemental Table S1. ImageJ (Schneider et al., 2012) was used to quantify the intensity of the PCR products and the values shown are relative to the WT (set to 1), as described in the figure legends. Additionally, quantitative (q) PCR was performed to quantify the observed changes in 35S enhancer levels in the McrBC-treated WT, yucca1d, yucca1d bt2-1, pap1d, and pap1d bt2-1 lines (Figure 4, E and F). ACTIN7 amplification was used to normalize the qPCR data and 35S enhancer amplicon levels were plotted relative to the WT (set to 1). Statistically significant differences were determined by two-sample Student’s t test (P ≤ 0.01 as indicated). Primers used for qPCR are listed in Supplemental Table S1.
Bisulfite sequencing
Two microgram of genomic DNA from the respective lines was digested to completion using Bgl II restriction endonuclease (New England BioLabs). Bisulfite treatment and conversion of digested genomic DNA was performed using EpiTect bisulfite sequencing kit (Qiagen) according to the manufacturer’s instructions. Bisulfite primers for sense (+) strand PCR amplification were designed using the MethPrimer tool (Li and Dahiya, 2002). Subsequently, direct sequencing of PCR products was performed. Analysis of bisulfite sequences was performed using a quantification tool for methylation analysis (Kumaki et al., 2008). Primers used for the bisulfite sequencing analysis are listed in Supplemental Table S1.
Accession numbers
AGI locus numbers for genes used in this article are: BT2, At3g48360; GTE9, At5g14270; GTE11, At3g01770; CULLIN3A, At1g26830; CULLIN3B, At1g69670; YUCCA1, At4g32540; PAP1, At1g56650; JAW, At4g23713; PHT4;2, At2g38060; TPT, At5g46110; EIF-4A2, At1g54270; ACTIN7, At5g09810; 18S, At2g01010; CAB2, At1g29920.
Supplemental data
The following materials are available in the online version of this article.
Supplemental Figure S1. Schematic of the CaMV 35S promoter.
Supplemental Figure S2. BT2 does not affect auxin-responsive gene expression.
Supplemental Figure S3. Analysis of activation-tagged phenotypes in multiple genotypes.
Supplemental Figure S4. BT2 is not required for full-length CaMV 35S promoter activity.
Supplemental Figure S5. BT2 does not stabilize YUCCA1 mRNA.
Supplemental Figure S6. Bisulfite sequencing analysis of yucca1d and yucca1d bt2-1.
Supplemental Figure S7. Analysis of yucca1d 35S:BT2mut (#1, #2, and #3) and yucca1d 35S:TAZBT2 (#1 and #2) transgenic lines.
Supplemental Figure S8. Suppression of yucca1d phenotypes in yucca1d cul3b line.
Supplemental Table S1. List of primers used in the study.
K.K.M. and T.D.M. designed and supervised the research; S.I., M.R., A.M., and K.M. performed the research; K.K.M., S.I., and T.D.M. analyzed the data; and all authors contributed to the preparation of the article. The authors declare no conflict of interest.
The author responsible for distribution of materials integral to the findings presented in this article in accordance with the policy described in the Instructions for Authors (https://dbpia.nl.go.kr/plphys/pages/general-instructions) is Kranthi K. Mandadi ([email protected]).
Acknowledgments
We thank Wayne Versaw, Keith Maggert, Herman Scholthof, Karen Scholthof (Texas A&M University), and Renesh Bedre (Texas A&M AgriLife Research) for valuable comments and help during the preparation of the manuscript. We also thank Herman Scholthof (Texas A&M University), Will Cody (Stanford University), and Holger Puchta (Karlsruhe Institute of Technology) for kindly providing the CRISPR reagents.
Funding
U.S. Department of Agriculture (USDA NIFA HATCH 1023984), Texas A&M AgriLife Research Insect-Vectored Disease Seed Grant (124190-96210) to K.K.M. and National Science Foundation (NSF) award (MCB 0244159) to T.D.M.
Conflict of interest statement. None declared.
References
Author notes
Present address: Life and Physical Sciences, Allan Hancock College, Santa Maria, California 93454, USA
Joint Senior authors
