


Abstract
Maintaining the activity and function of the shallow root system of plants is essential for withstanding drought stress, but the associated mechanism is poorly understood. By investigating sap flow in 14 lateral roots (LRs) randomly selected from trees of a Chinese white poplar (Populus tomentosa) plantation receiving three levels of irrigation, an unknown root water transport mode of simultaneous daytime bi-directional water flow was discovered. This mode existed in five LRs confined to the surface soil without attached sinker roots. In the longer term, the bi-directional water flow was correlated with the soil water content. However, within the day, it was associated with transpiration. Our data demonstrated that bi-directional root sap flow occurred during the day, and was driven by evaporative demand, further suggesting the existence of circumferential water movement in the LR xylem. We named this phenomenon evaporation-driven hydraulic redistribution (EDHR). A soil-root water transport model was proposed to encapsulate this water movement mode. EDHR may be a crucial drought-tolerance mechanism that allows plants to maintain shallow root survival and activity by promoting root water recharge under extremely dry conditions.
Introduction
In arid environments, or in situations where prolonged dry periods may occur, maintaining live surface roots is crucial, because the shallow soil is where most nutrient turnover and storage occurs (Jobbágy and Jackson, 2001, 2004), where most soil microorganisms live (Fang and Moncrieff, 2005; Allison et al., 2007), and where plants mainly absorb water following periodic rain showers (Gaines et al., 2016). Researchers documenting nighttime hydraulic lift (HL) by deep roots and water redistribution to surface soils have highlighted this root maintenance function (Richards and Caldwell, 1987; Caldwell et al., 1998). In further studies, the term HL has gradually been replaced by the term hydraulic redistribution (HR) with the discovery of other modes of water transport by roots (Burgess et al., 1998). Currently, HR includes several types: vertical HR (including HL and hydraulic descent), horizontal HR, foliar uptake, and tissue dehydration (Nadezhdina et al., 2010).
Generally, HR has been considered to be driven by the soil water potential gradient between different soil layers (ΔΨs; e.g. Burgess et al., 1998; Leffler et al., 2005) and commonly observed at night (e.g. Caldwell and Richards, 1989; Nadezhdina et al., 2010). During daytime, the water potential gradient (ΔΨ) from the canopy to the atmosphere is much larger than the ΔΨs between different soil layers, so that the evaporation demand causes all roots to supply water to the canopy. During nighttime, transpiration stops, or is low, and the ΔΨ mainly exists inside a plant between roots and the stem. This leads to the appearance of HR. The magnitude of HR ranges between flux densities of 0.04 and 3.23 mm H2O d−1 across different ecosystems worldwide (Neumann and Cardon, 2012), and it is mainly affected by local conditions and plant characteristics, such as groundwater depth, soil texture, soil hydraulic conductivity, rooting patterns, and nighttime transpiration.
The mechanism of HR plays an essential role at both the plant- and ecosystem-scale. Redistributing soil water within the bulk of the root zone by HR can improve soil water storage and utilization that homogenizes soil moisture within the whole root system (Lee et al., 2005; David et al., 2013; Nadezhdina et al., 2015). During drought periods, the water lifted from deep soil maintains transpiration and gross ecosystem productivity (Lee et al., 2005; Domec et al., 2010, 2012), and it can supply water to neighboring shallow-rooted plants (Ludwig et al., 2004; Lee et al., 2018). Also, HR helps to avoid xylem embolisms and to maintain the functioning of shallow roots by keeping them alive in the drying soil (Scholz et al., 2008; Prieto and Ryel, 2014). Furthermore, HR can enhance soil organic matter decomposition and nitrogen cycling in surface soil (Armas et al., 2012; Cardon et al., 2013).
Chinese white popar (Populus tomentosa) is a native and unique tree species of the North China Plain and provides valuable ecosystem services through wood production plantations and farmland shelterbelts. This species tends to develop a dimorphic and deep root system, which can span many soil layers (Di et al., 2018). In our HR study of P. tomentosa, we discovered an unknown root water transport pattern by chance. Namely, the bi-directional water movement simultaneously existed in some surface roots during the daytime. To gain a mechanistic understanding of this phenomenon, a 2-year study was conducted in P. tomentosa plantations growing under different irrigation treatments to answer three key questions: (1) Does this phenomenon occur in all surface roots? (2) What broad morphological features of root architecture are required for this phenomenon to occur? and (3) What soil and plant factors lead to its occurrence?
Results
Temporal and spatial variations in soil water content
Contrasting changes in soil water content (SWC) from 10 to 550 cm soil depth among the three treatments are shown in Figure 1. The upper sandy layers (0–140 cm) had lower and rapidly changed SWC, while the lower silt layers (>140 cm) had higher and more stable SWC. As noted by changes in near-surface SWC following rainfall or an irrigation event, the SWC could be replenished (see also Supplemental Figures S1–S2). However, it was only replenished by a major rainfall event at the 120-cm distance from a tree base between tree rows. There were distinct SWC gradients in shallow soil layers among treatments [full irrigation (FI) > control irrigation (CI) > no irrigation (NI)] except that the CI treatment had the highest SWC at 10-cm depth and 120-cm distance in 2018 and at 50-cm depth and 120-cm distance in 2019 (Supplemental Figure S3). This provided contrasting soil water conditions for the roots we studied.
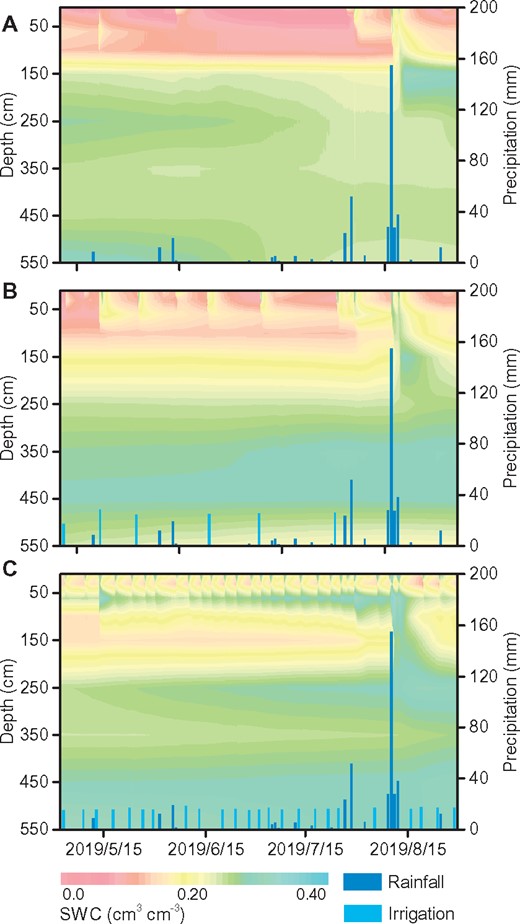
SWC in 2019. NI treatment (A), CI treatment (B), and FI treatment (C)
Root architecture
The measured 14 lateral roots (LRs) could be roughly classified into two types (Figure 2). Type I roots (1, 2, 3, 4, 6, 7, 8, and 9) were the roots distributed in the surface soil layer without any attached sinker roots. Roots of Type II (5, 10, 11, 12, 13, and 14) were distributed in deeper or surface soil layers with sinker roots directed towards deeper and wetter soil. Because Type I roots could utilize water only from the near-surface layers, they were considered vulnerable to drought. In contrast, Type II roots could likely use relatively stable water resources from the deeper soil layers and might have a lower risk of experiencing drought stress.
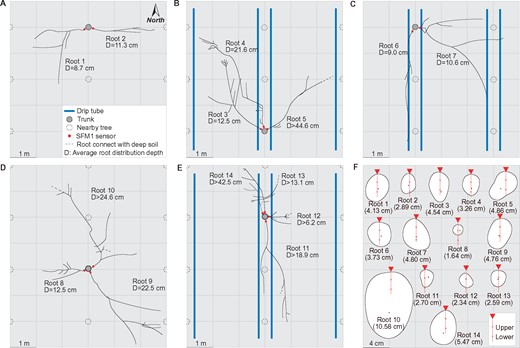
Plan view of measured roots and their cross-sections at measured positions. Roots in NI treatment in 2018 (A) and 2019 (D), CI treatment in 2018 (B), and FI treatment in 2018 (C) and 2019 (E). Sap flow sensor positions in roots are marked by red points and blue lines are drip tubes with the emitters (A–E). Positions of the upper and lower sap-flow measured points in each root’s cross-section (F). The root piths are represented by black points and the vertical diameter of the root cross-sections are shown in brackets (F)
Root sap flow
An unknown phenomenon of synchronous bi-directional sap flow occurrence was observed during the daytime within roots 1, 2, 3, 7, and 9 (Figure 3). In these roots, the sap flux density (SFD) recorded by the upper point of the sap-flow sensor (SFDupper) routinely increased in the morning and decreased in the afternoon. However, SFD recorded by the lower point of the same sensor (SFDlower) had a completely opposite tendency, in that it decreased in the morning and increased in the afternoon, thus being negative during the daytime. The dynamic changes of bi-directional flow were closely related to rainfall events. Using root 1 as an example (Figure 3A): even a little rainfall on July 28, 2018 changed the opposite daily sap-flow direction, and both the SFDupper and SFDlower were basipetal (SFD >0, toward the stem) during the daytime. Over the next days, the diurnal SFDupper decreased slowly, while the diurnal SFDlower dropped rapidly and again turned into the acropetal (SFD <0, reverse) after 5 d. Both SFDupper and SFDlower abruptly increased after a large rainfall on August 16, 2018 being positive during the daytime. During nights, both SFDupper and SFDlower had a similar pattern approaching zero (Figure 3A). Nighttime reverse sap flow only occurred in root 9, where it was negative during day and night for a long dry period before rain occurrence (Figure 3B).
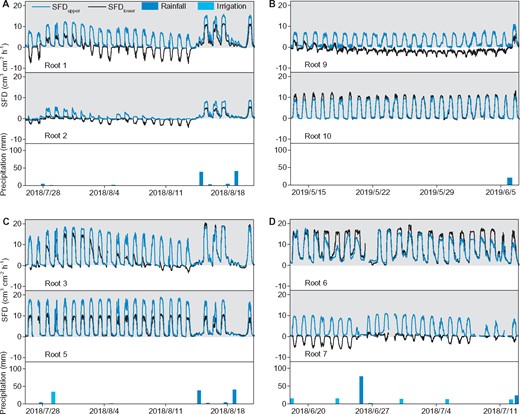
Dynamic changes of root sap flow. NI treatment in 2018 (A) and 2019 (B), CI treatment in 2018 (C), and FI treatment in 2018 (D). SFD recorded by the upper measured point (SFDupper) and the lower measured point (SFDlower) are from the same sap-flow sensors in each root, and their positions are shown in Figure 2F. Every two roots in (A–D) experienced the same rainfall and irrigation events, respectively. The shaded area indicates positive sap flow, and the white area indicates reverse sap flow. Roots 1, 2, 3, 6, 7, and 9 are Type I roots (without sinker), while roots 5 and 10 are Type II roots
In total, the observed phenomenon was recorded in 5 of the 14 randomly measured LRs (36% in proportion), and all of these five LRs belonged to Type I. Additionally, when this phenomenon occurred, the acropetal flow was only recorded by the “lower” point, while the basipetal flow was recorded by the “upper” point of the sap-flow sensors. This indicates that the acropetal flow occurred in the lower half section, but the basipetal flow occurred in the upper half section of the root cross-section during the daytime bi-directional flow observation (Figure 2F). However, the timing of bi-directional flow in these five roots was different (all sap-flow data during the study periods are shown in Supplemental Figures S4–S5). For example, root 3 had fewer days with bi-directional flow occurrence and a longer transition time from positive daytime SFDlower to negative than roots 1, 2, and 7. The bi-directional flow always existed in root 7 during the early study period but disappeared during the later study period. Furthermore, different roots had different magnitudes of SFDupper and SFDlower when bi-directional flow occurred.
Environmental control of root sap flow
Actual transpiration (Ec) in all treatments synchronously changed with the reference crop evapotranspiration (ETo) in both years. However, the Ec in 2019 was greater than that in 2018 due to the increase of tree age (Supplemental Figure S6). As a result of prolonged drought and heavier summer rainfall, the water table depth (WTD) had a greater fluctuation in 2019, than in 2018 (Supplemental Figure S6). The results of correlation analysis between root sap flow and environmental factors (Table 1) indicate that in general, the main factors affecting root SFD were SWC, ETo (Ec), vapor pressure deficit (VPD), and solar radiation (Rs; Table 1). However, the SFD of different roots was affected by environmental factors differently. For the roots with poor soil water resources, e.g. roots 1 and 2 (Type I roots with no irrigation), the SFD had a stronger correlation with SWC (Table 1), whereas for the roots with rich soil water resources, e.g. roots 3, 4, 5, and 6 (Type I roots with irrigation or Type II roots), the SFD had a stronger correlation with Rs, VPD, ETo, and Ec (Table 1).
The correlation coefficients between daily root SFD and environmental factors
| Root sap flow | Rs | VPD | ETo | Ec | SWC |
|---|---|---|---|---|---|
| SFDroot 1 lower | −0.123 | −0.275* | −0.229 | −0.177 | 0.710** |
| SFDroot 1 upper | 0.342** | 0.252* | 0.263* | 0.357** | 0.478** |
| SFDroot 2 lower | −0.077 | −0.157 | −0.245 | −0.162 | 0.782** |
| SFDroot 2 upper | 0.012 | −0.098 | −0.101 | −0.016 | 0.749** |
| SFDroot 3 lower | 0.283* | 0.162 | 0.169 | 0.297* | 0.628** |
| SFDroot 3 upper | 0.648** | 0.576** | 0.604** | 0.757** | 0.346* |
| SFDroot 4 lower | 0.550** | 0.594** | 0.453** | 0.671** | 0.327* |
| SFDroot 4 upper | 0.615** | 0.603** | 0.517** | 0.633** | 0.249 |
| SFDroot 5 lower | 0.835** | 0.831** | 0.831** | 0.857** | 0.053 |
| SFDroot 5 upper | 0.825** | 0.871** | 0.843** | 0.950** | 0.018 |
| SFDroot 6 lower | 0.612** | 0.665** | 0.521** | 0.776** | 0.304* |
| SFDroot 6 upper | 0.341* | 0.342** | 0.19 | 0.329* | 0.323* |
and ** indicate significant correlation at P < 0.05 and P < 0.01, respectively; SWC (cm3 cm−3) was chosen from the corresponding distribution layer of each root; root SFD (cm h−1), solar radiation (Rs, kW m−2), VPD (kPa), reference crop evapotranspiration (ETo, mm), actual transpiration (Ec, mm), and SWC were analyzed using daily average value.
For the roots exhibiting bi-directional sap flow, both daily SFDupper and SFDlower significantly decreased with the decline of daily SWC (Figure 4). The SFDlower became acropetal when the daily SWC was lower than 0.13 cm3 cm−3 for root 1, 0.12 cm3 cm−3 for root 2, and 0.06 cm3 cm−3 for root 9. Thus, superficial soil water was an important factor driving the bi-directional sap flow. The slope of the linear relationship between SFD and SWC was greater for the SFDlower than for the SFDupper in roots 1 and 9, but similar in root 2. The biggest difference was observed for root 9 that was present in the driest soil. At the beginning of the study period, the SFDlower was higher than the SFDupper in this root (Figure 4C). Nevertheless, the SFDlower decreased rapidly and reversed with decreasing SWC while the SFDupper decreased slowly.
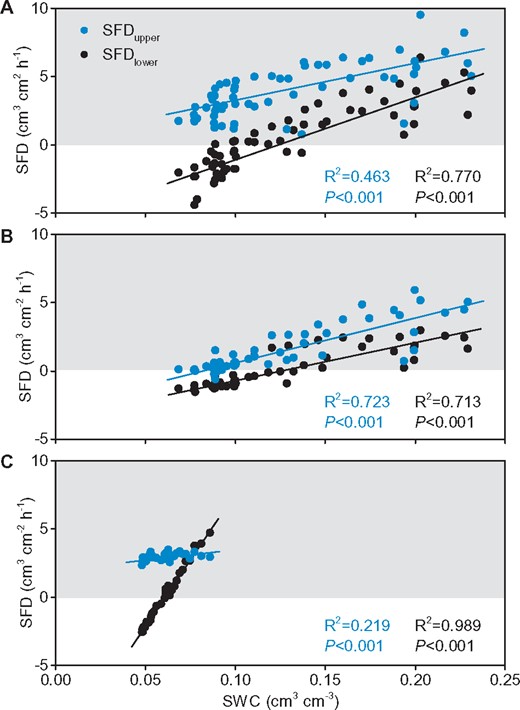
The long-term relationship between daily root sap flow and daily SWC. Root 1 (A), root 2 (B), and root 9 (C). The shaded area indicates positive sap flow, and the white area indicates reverse sap flow
At the diurnal-scale, root sap flow did not correlate with SWC due to small diurnal changes of SWC. On the contrary, the root sap flow had a good diurnal relationship with stem sap flow, as shown in the example of root 1 (Figure 5). When the soil was wet, there was almost a linear relationship between SFDlower, SFDupper, and SFDstem (blue symbols in Figure 5, A and B) and between both SFD in the root (blue symbols in Figure 5C). When the soil became drier, the slope in the relationship with SFDstem decreased for both SFD in the root, and SFDlower fell with increasing transpiration (green symbols in Figure 5, A and B). This drastically changed the relationship between midday SFD in the root and introduced a hysteresis loop with afternoon SFDlower values behind SFDupper (green symbols in Figure 5C). Under extreme drought, SFDlower completely turned to negative values and hysteresis loop appeared between SFDupper and SFDstem (yellow symbols in Figure 5, A and B). Meanwhile, the hysteresis loop increased between SFDlower and SFDupper (yellow symbols in Figure 5C). A similar pattern was also observed in roots 2 and 9 (Supplemental Figures S7–S8).
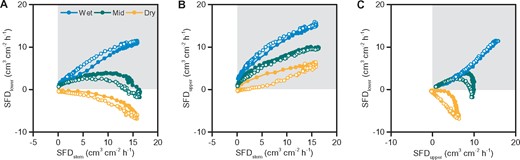
Diurnal sap-flow relationship between stem and root 1 and within the measured positions in root 1. SFD recorded by the lower point of the sap-flow sensor (SFDlower) versus SFDstem (A), sap-flux density recorded by the upper point of the sap-flow sensor (SFDupper) versus SFDstem (B), and SFDlower versus SFDupper (C). Symbols of different colors represent different days: blue (August 17, 2018 when SWC at the depth close to root 1 was 0.18 cm3 cm−3), green (July 21, 2018 when SWC was 0.12 cm3 cm−3), yellow (August 12, 2018 when SWC was 0.07 cm3 cm−3). Filled symbols are 0:00–12:00, and open symbols are 12:00–24:00. The shaded area indicates positive sap flow, and the white area indicates reverse sap flow
The data of root 1 on August 12, 2018 were selected to further investigate the relationship of sap flow between root and stem (Figure 6). According to Figure 2F, the SFDupper and SFDlower of root 1 correspond with their positions in the upper and lower sections, respectively. The SFDlower was multiplied by −1 (−SFDlower) to represent the absolute value of the reverse sap flow. Sap flow in the upper root section started to increase with the increase of transpiration (SFDstem) in the morning but sap flow increased with a certain delay in the lower root section (Figure 6A). The slope of SFDupper gradually decreased but it gradually increased in −SFDlower. After the asynchronous changes, both SFDupper and −SFDlower reached similar values at noon, and then decreased similarly with transpiration in the afternoon (Figure 6A). Figure 6B showed the asynchronous changes in the morning and the synchronous changes in the afternoon of SFDupper and −SFDlower more clearly. According to root 1, the possible water movement pattern through the LR is shown in Figure 6C, which was confirmed by our root dyeing test conducted in 2020 (Supplemental Figure S9).
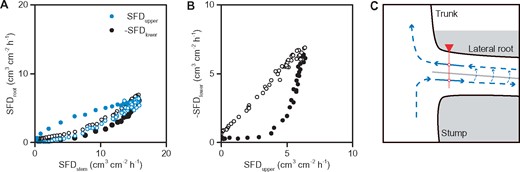
Diurnal sap-flow relationship between stem and root 1 on August 12, 2018. SFD recorded by the lower point of the sap-flow sensor (SFDlower) was multiplied by −1 to represent the absolute value of the reverse sap flow. SFD recorded by the upper point of the sap-flow sensor (SFDupper) and −SFDlower versus SFDstem (A), and −SFDlower vs. SFDupper (B). Filled symbols are 0:00–12:00, and open symbols are 12:00–24:00. Note two-fold decrease in SFDupper compared with wet soil conditions (Figure 5B, blue August 17, 2018), supporting the same level of transpiration (SFDstem). Hypothetical water-transport mode within root 1 (C). The gray line is the root pith. The sap-flow probe and the measured points were according to their actual positions (Figure 2F). The solid arrows represent the actual water flow which was monitored by sap-flow sensors (positive flow in the upper root section and reverse flow in the lower root section). The dashed arrows represent the presumed water movement
Discussion
The mechanism of HR, which was generally believed to be driven by soil water potential gradients (ΔΨs), and to occur as transpiration approached, or was zero, has been demonstrated in many shrub and tree species by either soil water (Richards and Caldwell, 1987; Caldwell et al., 1998) or sap-flow measurements (Burgess et al., 1998, 2000). Typically, HR takes place at night under conditions of low evaporation. As Ψs is rather stable during the night, the same also applies for nighttime sap-flow reversal driven by ΔΨs (Nadezhdina et al., 2008). However, in our study, HR was observed during daytime with a rather large magnitude of sap-flow reversal with its diurnal changes mirroring transpiration (SFDstem). In contrast, at night, the typical period of HR occurrence, sap flow in our LRs was close to zero. The reasons for the absence of nocturnal sap flow in our study could be the sandy shallow soil and the deep groundwater table. Passioura (1988) noted that as roots remove water from sand, the water-filled pores steadily drain until they fairly suddenly become discontinuous. Wang et al. (2009) stated that sandy soil suppresses the occurrence of HR, as well as its frequency and intensity. This fits with the results of Hultine et al. (2003), who did not find significant HR in three desert species. However, Yu et al. (2013) reported HR occurrence in two desert plants growing in an extremely arid region of northwest China. Neumann and Cardon (2012) indicated that soil texture and access to groundwater have an important influence on the degree of HR. Ninety-five percent of all the fine roots in our P. tomentosa plantations under different treatments were found in the upper 2.65–3.60 m of the soil profile (Supplemental Figure S9), while the site water table was lower than 7 m (Supplemental Figure S6). Thus, groundwater could be reachable only by a few roots, and the small conducting area of the deep roots could not immediately provide sufficient water to the whole huge bulk of roots above them. Of course, conditions for deep water-uptake differ among ecosystem types. Bleby et al. (2010), for example, reported that during the drought in a semi-arid woodland above a unique cave system in central Texas, deep roots with permanent access to water in a cave stream at 20-m depth redistributed water to shallow roots at night.
The existence of bi-directional sap flow in roots is not new, but just rarely detected. Up to now, it has been reported for a large root of Douglas-fir as a consequence of night horizontal HR following localized irrigation (Nadezhdina et al., 2009). The reason why researchers often missed this unusual root water transport pattern may be that when sensors with two or multiple measuring points were used, the root sap-flow data at different measurement points were usually averaged (Bleby et al., 2010; Ferreira et al., 2018; Lee et al., 2018). Furthermore, our results indicate that this rare phenomenon likely can be detected when the following conditions are met: (1) the soil surrounding the roots is extremely dry; (2) the LRs have no sinker roots attached, thus, the LRs lack direct contact with a wetted soil zone; and (3) the root size allows simultaneous sap-flow measurements in upper and lower half sections of LR xylem in a vertical plane of the root cross-section. The work on bi-directional root flow in Douglas-fir established the way we might model or think about this flow process (Nadezhdina et al., 2009). However, our recent observations with Populus suggest a more complex model of bi-directional flow. The found facet of this HR is driven by evaporative demands (Figure 6A). Thus we have termed it as evaporation-driven HR (EDHR), bearing in mind the evaporation from leaves. This EDHR is a new addition to the already known and described types of HR (Figure 1 in Nadezhdina et al., 2010) and further extends our comprehension of the importance of HR in plant ecophysiology and hydrology.
As we mentioned above, bi-directional daytime root sap flow only occurred in shallow LRs without attached sinkers (Type I roots) when the surrounding soil became very dry. The sap flow, especially SFDlower, in these LRs had a strong correlation with the surrounding SWC over the long-term (Table 1 and Figure 4). Nadezhdina et al. (2015) and Wang et al. (2020) also showed that the shallow roots in dry soil were more affected by SWC rather than the deeper roots in wetter soil. All of our daytime sap-flow reversals were recorded in the lower sections of the shallow roots, while sap flow in the upper root sections was always positive. Burgess et al. (2000) reported that night sap flow reversal also occurred in the lower root section of Banksia prionotes. It seems that circumferential water transport could exist within the root xylem. Burgess and Bleby (2006) and Nadezhdina et al. (2009) showed that, at night, when the soil was unevenly moist, water was transported from a wet root to a dry root through circumferential transport in the stem, by the so-called stem-mediated HR. The circumferential water transport in the xylem, through inter-vessel pits, has a more considerable resistance than axial resistance between vessels. Although the location, time, and magnitude of our bi-directional sap flow were different from the stem-mediated HR, a similar water-transport pattern may exist in our LRs: the circumferential water transport may occur from the lower root section to the upper root section (Figure 6C).
As demonstrated from numerous papers studying LR formation mainly on the model plant Arabidopsis thaliana, LR originates deep within the primary root from the pericycle cells, an internal tissue surrounding the central vascular cylinder (Malamy and Benfey, 1997; Peret et al., 2009; Atkinson et al., 2014; Vilches-Barro and Maizel, 2015; Banda et al., 2019). The LR thus has the common vasculature with the primary root and is similarly sensitive to changes of water potential gradients within the soil–plant–atmosphere continuum, where water movement depends on the interplay between water potential gradients created in different parts of this continuum. While the appearance of bi-directional sap flow differs substantially between Douglas-fir and our poplar trees, HR in both cases follows the same law (namely, Darcy’s law), that is any water movement within the soil–plant–atmosphere continuum is driven by a difference in water potential. According to this law, flow between any two points is directly proportional to the water potential difference between these points and inversely proportional to the resistance in the pathway between them. As mentioned above, even if ΔΨs was evidently well developed due to dry superficial soil, a very deep water-source was unachievable at night for our poplar trees due to the high hydraulic resistance of root water pathways. However, during the daytime, high evaporative demands can pull water upward from deep soil layers. The upper section of the root is always under the control of transpiration as can be seen from always positive SFDupper (Figure 3) and direct proportionality between SFDupper and SFDstem (Figures 5B and 6A). Under certain conditions, this tension allows the entrance of deep water into the lower section of the root. When diurnal dynamics of sap flow in both root sections were compared with transpiration in the day with the driest soil (Figure 6), we can see the proportional start of SFDupper with SFDstem followed by gradual SFDupper decrease due to the absence of supporting water influx from the surrounding dry soil and the need to take water from deeper wetter soil through the lower root section. Reswitching to deeper water input in the LR occurred under the certain tension in the stem/upper root xylem (Figure 6, A and B). Rapid increases of SFDlower following the morning delay after SFDupper and SFDstem indicate that the force of this tension was rather strong. Both root SFDs reached similar values (although directed oppositely) in the middle of the day under maximum transpiration and decreased further similarly with gradually ceasing transpiration. This reciprocal pattern of sap flow in both root sections is well demonstrated in Figure 6B as it was traced by the applied equipment allowing simultaneous sap flow measurements in a vertical plane of the root cross-section (Figure 6C). The water may be transported from the lower section of the root to its upper section circumferentially or radially. Pathways for water movement from the lower to the upper sections of roots are not yet known and are the subject of our future research.
Based on the assumptions that EDHR pattern is a result of both morphological LR formation and the physics of water movement under evaporation tension, we propose a soil water and root-transport model for different shallow soil water conditions to demonstrate how the water is drawn up by transpiration demands, and simultaneously circulates in LRs (Figure 7). When soil is wet, water moves upward from the whole root system. During wet periods, the shallow LR can absorb enough water from the shallow soil, and the upper and lower sections of the LR supply water to the canopy similarly during daytime (see days after heavy rain in Figure 3). As the SWC drops near the soil surface, the water becomes difficult to extract by roots from upper soil layers, and root water uptake for tree transpiration gradually moves to deeper soil horizons. This is clearly visible from the decrease of SFD in both upper and lower sections of LRs with soil drying (green in Figure 5). Thus, to support the same SFDstem, another source of water needs to be used, which in our case is the water from the deeper soil layers. The movement of deep water upward can be through sinkers connected to superficial roots (Root Type II) or through vertical roots attached to the stump (Figure 7). Strong water potential differences created between crown and root due to water transpiration from the leaves continue to pull water also from LRs and trigger water uptake in them from the deep soil. The water being moved to the stem from the upper section of the shallow root begins to circulate also through the lower section of the root as the force for water income from the stele of the primary root becomes lower than for water influx from surrounding drying soil. As a result, the SFDlower decreased more rapidly than SFDupper with the decreasing SWC (roots 1, 2, and 9 in Figure 4), and the clockwise hysteresis loop appeared between sap flow in both root sections (Figure 5C; Supplemental Figures S7 and S8). Under extreme drought conditions, the shallow LRs cannot absorb water from the shallow soil. Evaporative demand driving water from the deep soil also creates option for the simultaneous restoration of water status in very dry LRs. Deep water then moves axially along the LR through its lower section (Figure 6C). The stronger the transpiration demands are, the more water moves upward to the tree crown alongside the dry LR, and also circulates through it. That is why the sap flow reversal has a similar trend to transpiration, but it (SFDlower) always started slower than SFDstem and SFDupper (Figures 5 and 6). The SFDupper substantially gradually decreased with the surface soil drying (see Figure 5, green and yellow symbols) compared with the day when surface soil was wet (see Figure 5, blue symbols). This is due to the transferring of water uptake for transpiration to deeper soil sources, and increasing losses of energy and water supply through the LR for its recharge. This is visible from the increasing hysteresis loop between SFD in both root sections (Figure 5). Larger tension has to be developed first in the upper root section to move deep water along the lower root section. The SFD in both root sections reached equilibrium with the maximum strength of transpiration. Afterward, sap flow in both root sections gradually decreased in a similar way with weakening environmental driving forces (Figures 5 and 6).
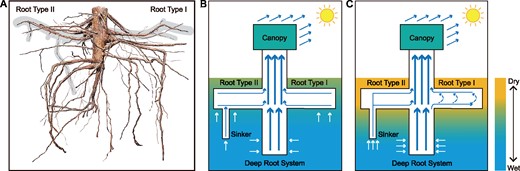
The root system of P. tomentosa and water transport model. Actual root system of a 5-year-old P. tomentosa tree (A), where the shaded area highlights two root types (I, II). Shallow soil water status progresses from wet (B) to dry (C). Solid arrows indicate water transport, and dashed arrows indicate the circumferential water transport within the Type I root when EDHR occurs
The wide hysteresis loop between SFD in the upper and lower root sections indicates that water refill of the lower root section from the deep-water source cannot immediately follow water use from the upper root section (Figure 6B). As the water storage capacity is considered to be negligible in the root system (Waring et al., 1979; Huang et al., 2017), clockwise hysteresis between root sap flow and transpiration during the drought period (Figure 5, A and B) could be explained by repairing root vessels which, similar to aboveground plant organs, could be embolized by drought (Rodriguez-Dominguez et al., 2018; Wu et al., 2020), and also by the high resistance of circumferential water transport. Further research is needed to provide a definite answer as to the reason for a time lag between sap flow in different root sections and on water pathways between them.
At the moment, we do not know if the deep water that entered the LR may also be released into the very dry soil. Huang et al. (2017) noted that the upper layers of the very dry soil might serve as competing sinks to transpiration during the daytime. Our SWC measurements demonstrated a daytime SWC increase when EDHR was observed (Supplemental Figure S11). However, as SWC measurements were sensitive to temperature, additional evidence of possible daily water efflux from the root is needed.
Our results indicate that EDHR is a kind of internal HR, and it seems to be a drought-resistance mechanism that provides water for dry shallow roots. Bauerle et al. (2008) and Prieto and Ryel (2014) indicated that internal HR could delay shallow soil water depletion, prevent root embolism, and extend root survivorship. Huang et al. (2017) proposed a hypothesis that internal HR, instead of HR between different soil layers, could be more advantageous for plants under drought conditions.
The additional experiment conducted in 2020 at the same plantation with the application of dye in the tree stump below the LR and simultaneous sap flow measurements in several positions along the treated root confirmed the logic of our suggested model and clearly indicated the entrance of deep water into the lower section of the dry root (Supplemental Figure S9) synchronously with tree transpiration.
In our case, EDHR occurred in more than one-third of the 14 randomly selected LRs (Figure 3; Supplemental Figures S4–S5). This proportion was even up to 60% (three of the five roots) in the NI treatment, which is, in fact, the common growing condition of rain-fed poplar trees around the world. Therefore, on a global scale, EDHR may be widely present in rain-fed vegetation of arid and semi-arid areas. This is not presently known, therefore, it could be physiologically and ecologically critical in such environments. It is clear that our results ultimately create new questions concerning water transport through roots under wet and dry soil conditions, specifically the distribution of water within root xylem. This gives additional credence to our research as it paves the way to a better understanding of plant function under changing environments.
Conclusion
Through a 2-year study of sap flow in LRs and analyzing its relationship with SWC and environmental factors, we have revealed a mechanism of bi-directional root sap flow that occurred during the daytime. Extremely dry superficial soil and shallow roots without attached sinkers were the prerequisites. Evaporation was the driving force. This phenomenon, which we have named EDHR, was detected in more than one-third of our randomly selected roots, and represents a not yet fully understood facet of HR, suggesting that it may widely exist on a global scale. A water-transport model was proposed for this diurnal bi-directional root sap flow occurrence by considering that circumferential water movement might occur within the root xylem under certain conditions.
EDHR could be an essential drought-tolerance mechanism to maintain shallow root survival and plant activity by promoting water movement within the root. This plant drought-tolerance strategy may be crucial for forest ecosystems in arid and semi-arid lands to maintain their functioning. Moreover, we assume that EDHR might be observed in plants with dimorphic root systems also in other ecosystem types if the following conditions could be met: sap flow is measured by multi-point sensors in large enough LRs with no sinkers attached under very dry soil where possible night HL (e.g. in the case of the shallow water table) cannot sufficiently recharge the soil. Consequently, we advocate that EDHR should be more thoroughly investigated for different tree species and forest ecosystems.
Materials and methods
Experimental site description and experimental plantation
Our experimental site is located in Gaotang County, Shandong Province, China (36.81° N, 116.09°E). The site has the warm temperate weather of a monsoon-type climate. The upper soil (0–140 cm) is sandy loam, and the lower soil (deeper than 140 cm) is silt loam. The groundwater level is about 7–9 m below the soil surface. The mean annual precipitation is 545 mm, and the mean annual reference evaporation is 1,880 mm.
The experiments were carried out in 4- (in 2018) and 5-year-old (in 2019) triploid Populus tomentosa [clone B301; (P. tomentosa × P. bolleana) × P. tomentosa] plantations. The trees were planted with 2 m between trees in a row and 3 m between rows. The drip irrigation system used tubes produced by Netafim Co., Ltd., Israel. The emitter flow rates were 1.6 L h−1, and the spacing between emitters was 50 cm. The emitters were directly on the ground and aligned in two belts along each tree row. The drip tubes were 30 cm away from the trees on both sides. Three treatments, namely FI, CI, and NI, were set up to create a gradient of shallow soil water availability. Soil water potential (Ψ) at 20 cm below the emitters was measured by tensiometers. The irrigation was initiated when the water potential reached −18 kPa in FI and −45 kPa in CI. Due to the sandy loam soil texture, the 27-kPa difference in Ψ between FI and CI treatments can lead to a 30% difference in the soil water availability. The SWC in the wetting volume around the tube was irrigated to field moisture capacity in each irrigation event. Thus, the CI treatment had a greater quantity of irrigation with each irrigation event, but had lower irrigation frequency and less total water applied.
Root sap flow
Root dyeing
A dyeing test was performed in a surface root to prove the visible existence of bi-directional sap flow in 2020. This root was excavated and exposed to the air before dyeing in order to create extreme drought. A syringe was used to continuously inject the yellow dye into the upper section of the root base, and another syringe was used to continuously inject the blue dye into the stump below the root. The dyeing test started in the morning and lasted for four sunny days (from July 14, 2020 to July 17, 2020). After finished, the root and stump was cut to see the dye movement. The pictures were taken by the camera and processed by Adobe Photoshop CC 2018 (Adobe Systems Incorporated, CA, USA).
Stem sap flow and transpiration
Actual transpiration (Ec, mm d−1) of each tree was calculated by multiplying the SFDstem and its SA and was then divided by its average growing space area (6 m2). The reference crop evapotranspiration (ETo, mm d−1) was estimated using the measured meteorological data following the Penman–Monteith equation used in FAO-56 (Allen et al., 1998).
Soil water content
Changes in the two-dimensional SWCs (cm3 cm−3) were measured using frequency domain reflectometry. In 2018 and 2019, the SWC was monitored by TSM640 (Sinton Technology Ltd., Beijing, China) at different vertical depths (10, 30, 50, and 70 cm) and horizontal distances (35 and 120 cm) from the base of the trees. Measurements were carried out every 10 min. However, it was difficult to monitor the diurnal changes in SWC by this type of sensor, as it did not have sufficient accuracy. That is why three greater-precision sensors (GS301, Sinton Technology Ltd., Beijing, China) were additionally installed in 2019 at the 35-cm distance from the trees in each treatment, and the SWC at different depths (10, 30, 60, 100, 150, 250, 350, 450, and 550 cm) throughout the 0–6 m soil were then automatically monitored every 30 min.
Meteorological parameters
Data analysis and statistical methods
Roots 1–6 had a longer measuring period of root SFD. Thus their daily data from July 1, 2018 to August 31, 2018 were chosen to perform Spearman correlation analysis with the environmental factors. The reason for selecting the data in this period was that leaves gradually dropped off after September. Spearman correlation was chosen because the meteorological factors and sap flow did not conform to the normal distribution. Roots 1, 2, and 9 were chosen to analyze the main driver of the bi-directional sap flow: root SFD was plotted with SFDstem and linear regression was used between root SFD and SWC. Roots 3 and 7 were excluded because of a few days of bi-directional sap flow occurrence and missing data. The Spearman correlation was done by SPSS 25 (IBM Corporation, Chicago, USA) and linear regression was done by Origin 9.1 (OriginLab, Northampton, USA).
Supplemental data
The following materials are available in the online version of this article.
Supplemental Figure S1. Long-term changes of shallow SWC in 2018.
Supplemental Figure S2. Long-term changes of shallow SWC in 2019.
Supplemental Figure S3. Average SWC of shallow soil layers during the study period.
Supplemental Figure S4. Long-term changes of root sap flow in different roots in 2018.
Supplemental Figure S5. Long-term changes of root sap flow in different roots in 2019.
Supplemental Figure S6. Environmental factors and transpiration dynamics over the study periods.
Supplemental Figure S7. Diurnal sap-flow relationship between stem and root 2.
Supplemental Figure S8. Diurnal sap-flow relationship between stem and root 9.
Supplemental Figure S9. Longitudinal sections of a dyed lateral root in 2020.
Supplemental Figure S10. Fine roots distribution in the 0 to 4-m soil profile in April 2019 of the NI, CI, and FI treatments.
Supplemental Figure S11. Short-term changes of the SWC in the no irrigation treatment.
Supplemental Methods. Root dyeing.
Acknowledgments
The authors would like to acknowledge the work of the Monitoring Editor and the anonymous reviewers, which has helped to substantially improve this article.
Funding
This work was funded by the National Natural Science Foundation of China [grant numbers 31872702, 32001304, 31971640].
Conflict of interest statement. The authors declare that they have no known competing financial interests or personal relationships that could have appeared to influence the work reported in this paper.
Y.L., X.M., J.L., and S.Z. performed most of the experiments. Y.L., N.D., and X.M. processed the raw data. Y.L., N.D., and B.X. proposed the research questions. All authors coordinated the analyses and contributed to the final results. Y.L. and N.D. generated the figures. Y.L., N.N., B.X., and B.C. contributed to and approved the final manuscript.
The author responsible for distribution of materials integral to the findings presented in this article in accordance with the policy described in the Instructions for Authors (https://dbpia.nl.go.kr/plphys/pages/general-instructions) are: Benye Xi ([email protected]) and Brent Clothier ([email protected]).
References
Author notes
Senior authors.
