


Abstract
The marine microalgae Nannochloropsis oceanica (CCMP1779) is a prolific producer of oil and is considered a viable and sustainable resource for biofuel feedstocks. Nitrogen (N) availability has a strong impact on the physiological status and metabolism of microalgal cells, but the exact nature of this response is poorly understood. To fill this gap we performed transcriptomic profiling combined with cellular and molecular analyses of N. oceanica CCMP1779 during the transition from quiescence to autotrophy. N deprivation-induced quiescence was accompanied by a strong reorganization of the photosynthetic apparatus and changes in the lipid homeostasis, leading to accumulation of triacylglycerol. Cell cycle activation and re-establishment of photosynthetic activity observed in response to resupply of the growth medium with N were accompanied by a rapid degradation of triacylglycerol stored in lipid droplets (LDs). Besides observing LD translocation into vacuoles, we also provide evidence for direct interaction between the LD surface protein (NoLDSP) and AUTOPHAGY-RELATED8 (NoATG8) protein and show a role of microlipophagy in LD turnover in N. oceanica CCMP1779. This knowledge is crucial not only for understanding the fundamental mechanisms controlling the cellular energy homeostasis in microalgal cells but also for development of efficient strategies to achieve higher algal biomass and better microalgal lipid productivity.
Microalgae are a diverse group of photoautotrophic organisms with great potential as renewable feedstock for the production of fuels and chemicals. Many algae have high photoautotrophic growth rates and can accumulate significant amounts of neutral lipids, i.e. triacylglycerol (TAG), which is readily converted into biodiesel through transesterification (Chisti, 2007; Hu et al., 2008). Consequently, to fully utilize algae as a biofactory for TAG production, it is necessary to continue elucidating the mechanisms and optimal conditions for TAG accumulation. In algae, there are multiple TAG synthesis pathways (Liu et al., 2016a; Xin et al., 2017, 2019). In the chloroplast, de novo synthesized fatty acids (FAs) can be incorporated into chloroplast diacylglycerol (DAG), an essential precursor in the synthesis of photosynthetic membrane glycerolipids, or possibly plastidic TAG as reported for Chlamydomonas (Goodson et al., 2011; Goold et al., 2016). Alternatively, FAs can be exported from the plastid and assembled into TAGs at the endoplasmic reticulum (ER) through a series of sequential acylation steps termed the Kennedy pathway (Chapman and Ohlrogge, 2012). Finally, TAG can be produced using acyl chains recycled from the degradation of membrane lipids, such as monogalactosyldiacylglycerol (MGDG) or digalactosyldiacylglycerol (DGDG), as well as phosphoglycerolipids (Yoon et al., 2012).
TAG biosynthesis in microalgae is much more active under unfavorable environmental or stress conditions, when growth rates are reduced (Khotimchenko and Yakovleva, 2005; Li et al., 2014; Zienkiewicz et al., 2016). For example, nitrogen (N) deprivation induces increased de novo TAG synthesis resulting in deposition of TAGs in specialized cytosolic organelles called lipid droplets (LDs; e.g. Vieler et al., 2012b; Yang et al., 2013; Zienkiewicz et al., 2018). In the green microalga model Chlamydomonas reinhardtii, N deprivation induces cellular quiescence, a stage where cells stop to grow and divide (Tsai et al., 2014). Metabolic changes leading to N deprivation-induced quiescence include the reorganization of the photosynthetic apparatus, induction of autophagy machinery, protein turnover, and accumulation of storage compounds (Miller et al., 2010; Pérez-Pérez et al., 2010; Simionato et al., 2013; Martin et al., 2014; Schmollinger et al., 2014; Juergens et al., 2015). These metabolic rearrangements appear to be essential to maintain cellular energy homeostasis and cell viability in response to stress conditions. However, the negative effects of N deprivation can be abolished by supplementing the growth medium with excess N, termed N resupply (NR; Miller et al., 2010; Tsai et al., 2014, 2018). During NR, TAG reserves are rapidly degraded, providing energy through released carbon supporting a fast recovery process. TAGs also serve as a reservoir for recycling of polyunsaturated FAs after NR for the rapid synthesis of new plastid membranes. TAG degradation is catalyzed by TAG lipases, such as SUGAR-DEPENDENT1 (SDP1) in plants (Eastmond, 2006), adipose triglyceride lipase (ATGL) in mammals (Zechner et al., 2009), or Tgl3 and Tgl4 lipases in yeast (Saccharomyces cerevisiae; Athenstaedt and Daum, 2003, 2005). Many putative lipases are annotated as such in reported algae genomes (Miller et al., 2010; Vieler et al., 2012b), but few of them have been characterized (Barka et al., 2016; Siegler et al., 2017; Warakanont et al., 2019).
Recent studies have suggested a crucial function for autophagy in LD breakdown (Singh and Cuervo, 2012; van Zutphen et al., 2014; Velázquez et al., 2016). In mammalian organisms, autophagy-mediated lipolysis (macrolipophagy) plays an important role in lipid metabolism and homeostasis and has been linked to several metabolic disorders, such as obesity or atherosclerosis (Singh et al., 2009; Kaushik and Cuervo, 2015; Wang, 2016; Ward et al., 2016). Regulation of lipid metabolism by autophagy is mostly unknown in plants. However, there is evidence that autophagy might be involved in the LD mobilization and lipid metabolism during pollen development (Kurusu et al., 2014). Autophagy-like processes are involved in LD degradation in the green algae Auxenochlorella protothecoides during the heterotrophy-autotrophy transition (Zhao et al., 2014).
The unicellular photosynthetic Nannochloropsis species (family Eustigmatophyceae) are considered promising oleaginous microalgae due to their rapid growth, high photosynthetic efficiency, and ability to produce large amounts of TAG (Rodolfi et al., 2009; Meng et al., 2015; Ma et al., 2016). The recently sequenced genomes and deep transcriptional profiling of several Nannochloropsis species aided by advances in genetic transformation methods have enabled increasing efforts to investigate and ultimately engineer Nannochloropsis metabolism (Radakovits et al., 2012; Vieler et al., 2012b; Li et al., 2014; Wang et al., 2014; Iwai et al., 2015; Poliner et al., 2015, 2018a, 2018b, 2018c; Zienkiewicz et al., 2017). Despite several attributes that support Nannochloropsis species as a microalgal source of biofuels, recent studies have also demonstrated that the high lipid content under stress conditions is negatively correlated with biomass productivity, affecting its commercial potential in industrial settings (Simionato et al., 2013; Zienkiewicz et al., 2017; Sun et al., 2018). To provide a deeper understanding of the metabolic changes occurring under N deprivation and resupply conditions, we performed a global transcriptome analysis of Nannochloropsis oceanica CCMP1779. In this study, we demonstrate that the intracellular storage and degradation of neutral lipids in N. oceanica CCMP1779 is associated with changes in expression of many genes likely involved in de novo TAG biosynthesis, the recycling of membrane lipids, photosynthesis, and the cell cycle. Furthermore, we demonstrate a role for autophagy in microalgal lipid metabolism by demonstrating a direct interaction between LD surface protein (LDSP) and AUTOPHAGY RELATED PROTEIN8 (ATG8), occurring during LD degradation in response to NR. Taken together, our data contribute to a deeper understanding of the fundamental mechanisms of cellular energy homeostasis in microalgae necessary for developing new strategies to achieve high algal biomass and lipid productivity.
RESULTS AND DISCUSSION
Nitrogen Availability Affects N. oceanica CCMP1779 Cell Organization
We first visualized the impact of nutrient availability on the structure and organization of organelles within N. oceanica CCMP1779 cells (denoted henceforth as N. oceanica). During N deprivation, LDs progressively increased in size and number, a process which was reversed following NR (Fig. 1A). Turnover of LDs and associated lipids was previously investigated in C. reinhardtii (Tsai et al., 2014; Valledor et al., 2014), where a complete degradation of LDs occurred during 24 h after NR. To gain more detailed insights into the organization of N. oceanica cells during this process, we analyzed their ultrastructure (Fig. 1B). The majority of cells prior to removing N (0 h N−) showed well-organized chloroplasts, one dominant vacuole, and a nucleus as the most prominent organelles. After 24 h of growth under N deprivation (24 h N−), at least one LD per cell was observed, as was a substantial reduction in chloroplast size. Prolonging N deprivation (36–48 h N−) resulted in a progressive reduction in chloroplast size and number that coincided with an expansion of the volume occupied by LDs. By 72 h N−, LDs filled up most of the cell volume. A similar pattern of cellular changes was documented in other N-deprived microalgal cells (Dong et al., 2013; Yang et al., 2013; Park et al., 2015), indicating that the expansion of LDs, chloroplast shrinkage, and vacuole reduction are common responses to N deprivation. In contrast, structural changes occurring in microalgae cells during NR have been poorly described. In N. oceanica, NR resulted in (1) the recovery of the endomembrane system in close proximity to LDs (Fig. 1B, 24 h NR, arrows); (2) progressive size reduction of LDs; and (3) gradual restoration of well-organized chloroplasts (Fig. 1B, 48 h to 72 h NR). These changes in organelle distribution and morphology reflect the metabolic transition of N-deprived cells from quiescence to autotrophy, including the turnover of stored lipids in LDs that supply energy and precursors for rebuilding the thylakoids inside chloroplasts and other membranes, and a return to normal levels of photosynthetic activity. Additionally, later stages of NR (Fig. 1B, 72 h NR′) were accompanied by an increasing number of dividing cells, consistent with previous observations that N deprivation-induced quiescence in microalgae is reversible upon nutrient resupply (Tsai et al., 2014; Valledor et al., 2014). Finally, cells growing in medium lacking N usually contained one nucleus and one chloroplast (Fig. 1C, top row). By contrast, multiple dividing cells were observed after NR (Fig. 1C, bottom row).
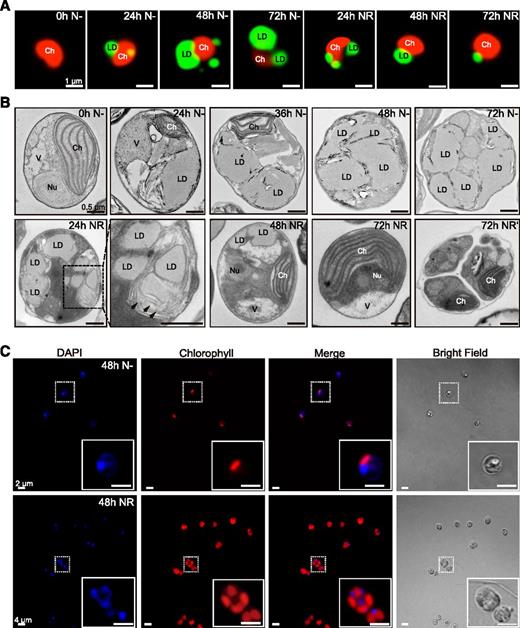
Cellular changes in N. oceanica in response to N deprivation (N−) and NR. A, Representative images of LDs stained by BODIPY 493/503 (green) and autofluorescence of chlorophyll (red). Bars = 1 µm. B, Representative electron micrographs of cells growing under N− and NR conditions. Arrows indicate the endomembrane system around LDs (24 h NR, magnified area marked with the dashed line, 72 h NR indicates a single cell, and 72 h NR′ indicates dividing cell). Bars = 0.5 µm. Ch, chloroplast; Nu, nucleus; V, vacuole. C, Visualization of nuclear DNA by DAPI (blue) and chlorophyll autofluorescence (red). Bars = 2 µm (top) and 4 µm (bottom).
N Deprivation and Resupply Induce Distinct Patterns of Gene Expression in N. oceanica
To further understand the fundamental mechanisms underlying the growth, metabolism, and cellular reorganization of N. oceanica under N deprivation and after NR, we performed global transcriptome profiling using RNA sequencing (RNA-Seq). Correlation analysis showed excellent reproducibility between the two biological replicates, with R2 values varying between 0.95 and 0.99 (Supplemental Fig. S1; Supplemental Dataset 1). Moreover, we confirmed that RNA-Seq transcript profiles (Supplemental Dataset 2) were reproducible by reverse-transcription quantitative PCR (RT-qPCR) analysis of selected genes (Supplemental Fig. S2). Of all genes, 2,270 showed significant differential expression (P ≤ 0.01) in at least one of the growth conditions (see “Materials and Methods” for statistical analysis of differential expression). These genes were subsequently grouped into four clusters (Fig. 2A, C1–C4) based on their temporal expression patterns. The first cluster included 750 genes (33%) down-regulated in response to NR (Fig. 2A, C1). In contrast, 1,520 genes (67%) were found to be significantly up-regulated under NR conditions (Fig. 2A, C2–C4). Among these genes, three independent clusters were found with 728 genes (32%) up-regulated primarily during the first 24 h of NR (Fig. 2A, C2), 391 genes (17%) with peak expression at 24 h of NR (Fig. 2A, C3) and 401 genes (18%) up-regulated during later steps of NR (Fig. 2A, C4). To generate the distribution of gene ontology terms, the annotated genes (Poliner et al., 2015) in each cluster were categorized into 16 functional categories (Fig. 2B). All the clusters contained a substantial fraction of genes with unknown function (46% to 54%), which limited a comprehensive gene ontology characterization. However, relative to the other clusters, Cluster 1 was overrepresented in genes commonly activated under N deprivation, including genes associated with stress response, cellular energy pathways and transport, and lipid metabolism. In contrast, clusters 2-4 were generally overrepresented in genes associated with DNA, RNA metabolism and gene expression, protein synthesis/degradation, and cell wall synthesis.
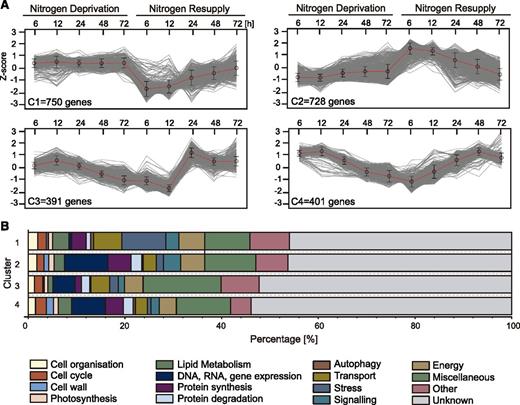
Cluster analysis of differential gene expression in N. oceanica under N deprivation and after NR. A, Expression patterns of differentially expressed genes (P ≤ 0.01) grouped into four clusters (C1–C4). Analysis and normalization were performed using K-means clustering (k = 4) with the Pearson correlation distance metric using MeV (version 4.8.1) software. B, Distribution of differentially expressed genes categorized by function within each cluster.
Expression of Cell Cycle-Controlling Genes Tightly Depends on N Availability
By blocking the proliferation of microalgal cells, N deprivation leads to a physiologically reversible state of the cell cycle, called quiescence, that cells enter to survive unfavorable environmental conditions (Valcourt et al., 2012; Bertozzini et al., 2013; Tsai et al., 2014; Park et al., 2015). Under N deprivation, the N. oceanica cultures maintained the ability to grow, although at a lower growth rate compared to optimal conditions (Fig. 3A). NR was accompanied by a substantial and significant increase in the cell number, with a peak of 90 × 106 cells/mL at 72 h of NR, consistent with dividing cells of N. oceanica under these culture conditions (Fig. 1, B and C).
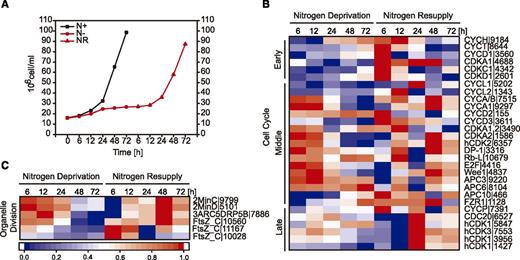
Cell cycle regulation under different N conditions. A, N. oceanica cell growth in a N-rich medium (N+), under N deprivation (N−), and after NR. Data are averages of three independent cultures. ses of the mean are smaller than the symbol. B and C, Expression profile of genes involved in the cell cycle (B) and organelle division in N. oceanica under N− and NR conditions (C). Log2-fold changes in expression >1 were normalized between 0 and 1 and used for heat map generation, and changes with P ≤ 0.01 were considered statistically significant (P values are given in Supplemental Dataset 2). Red indicates up-regulation of expression and blue a corresponding down-regulation. Numbers indicate the N. oceanica gene ID. Descriptions of the genes and expression values can be found in Supplemental Dataset 2.
As N. oceanica cell proliferation was clearly affected by N deprivation, we analyzed transcripts of commonly associated cell cycle-related genes (Fig. 3B). The expression of cyclin-dependent kinases (CDK) and cyclin-related genes (CYC) were in general down-regulated under N deprivation and up-regulated in response to NR (Fig. 3B). Transcript levels corresponding to cell cycle regulators of the retinoblastoma (Rb)-mediated pathway, including DP-1 and E2F, decreased in N-free medium. In contrast, putative retinoblastoma-like transcript (Rb- l) abundance increased at later times of N deprivation (Fig. 3B). In microalgae, the Rb protein has been proposed to directly bind to the E2F-DP1 complex, repressing the genes of cell cycle progression during quiescence (Olson et al., 2010; Desvoyes et al., 2014). Moreover, a progressive decrease in the abundance of transcripts encoding proteins involved in DNA replication was observed within 24 h of N deprivation (Supplemental Fig. S3). Genes potentially involved in organelle division were down-regulated under N deprivation and strongly up-regulated after NR (Fig. 3C).
Similar to the patterns observed in N. oceanica, the repression of cell cycle progression-related genes in response to N deprivation was observed also in Micractinium pusillum (Li et al., 2012a). Thus, the negative impact of N deprivation on cell cycle progression in microalgae corresponds to a major bottleneck limiting algae biomass productivity (Bertozzini et al., 2013; Chokshi et al., 2017). As expected, NR was accompanied by reinitiation of cell cycle genes, as shown by the presence of dividing cells and increasing growth rates. The molecular and physiological mechanisms underlying this phenomenon are still poorly understood. Providing further insights into the cell cycle control in response to dynamic environments will have important implications for engineering increased biomass with elevated algal oils.
Photosynthesis and Carbon Fixation Pathways Are Reactivated in Response to N Resupply
Under N deprivation, microalgae are potentially subjected to oxidative damage through reactive oxygen species produced as side products of the photosynthetic reactions. To limit this damage, cells decrease their photosynthetic activity while simultaneously channeling the excess energy into the synthesis of inert storage products, such as starch and TAG (Miller et al., 2010; Hockin et al., 2012; Dong et al., 2013; Simionato et al., 2013; Juergens et al., 2015). To test the effects of N deprivation and NR on photosynthesis in N. oceanica, we examined the expression of genes encoding proteins governing the function of the photosynthetic apparatus, light-dependent reactions, and carbon fixation (Fig. 4; Supplemental Fig. S4).
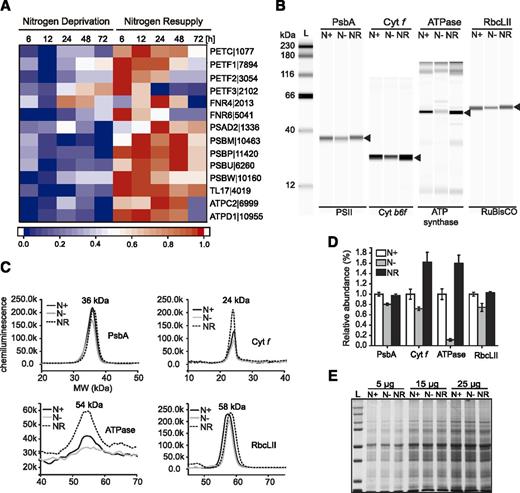
Profiling of photosynthesis-related machinery. A, Expression of selected genes involved in photosynthesis. Log2-fold changes in expression >1 were normalized between 0 and 1 and used for heat map generation, and changes with P ≤ 0.01 were considered as statistically significant (P values are given in Supplemental Dataset 2). Red indicates up-regulation of expression and blue a corresponding down-regulation. Descriptions of the genes and expression values can be found in Supplemental Dataset 2. B, A representative digital immunoblot for PsbA (D1), cytochrome b6f, ATP synthase, and RbcLII proteins. N+, 72 h under N-replete conditions; N−, 72 h of N deprivation; NR, 72 h after NR. C, Profiles of molecular weights of protein bands shown in B. D, Abundance of proteins from B under different N conditions. Each data point represents the average of three biological replicates. Values represent means ± sd (n = 3). E, SDS-PAGE gel of total proteins loading control stained by Coomassie blue.
As expected, the genes encoding proteins involved in chlorophyll (Chl) a (a light absorbing pigment) biosynthesis were progressively down-regulated during N deprivation and up-regulated after NR (Supplemental Fig. S4A).
The measured levels of Chl a under N deprivation and NR fit well with the expression patterns of respective genes, as a strong decrease of Chl a content in the N-deprived cultures was followed by a gradual increase through NR, reaching the highest level at 72 h of NR (Supplemental Fig. S4B). Similar changes in transcript levels and Chl content were observed under N deprivation in other algae, including C. reinhardtii (Juergens et al., 2015) and Thalassiosira pseudonana (Hockin et al., 2012).
We also analyzed the expression profiles of genes involved in the synthesis of carotenoids that participate in light harvesting and are essential for photoprotection against excess light (Supplemental Fig. S4C). The genes involved in carotenoid synthesis (GGDS|9014/3156/3532, PSY|10288, PDS|4802, ZDS|501) were substantially suppressed under N deprivation. The expression of zeaxanthin epoxidase (ZEP|6822), responsible for interconversion of zeaxanthin and violaxanthin, and of three of six genes encoding violaxanthin deepoxidase (VDE|10439, VDE|7381, and VDE|6030) were elevated in response to N deprivation. In contrast, the remaining genes (VDE|11477, VDE|11475, and VDE|1346) were down-regulated during N deprivation (Supplemental Fig. S4C). It has been reported in N. gaditana that the content of xanthophyll cycle carotenoids, including violaxanthin, anteraxanthin, and zeaxanthin, increased under N-deprivation conditions, while the level of their precursor, β-carotene, significantly decreased (Simionato et al., 2013). N. oceanica VCP (for Violaxanthin-Chl a-binding protein) proteins belong to three different families: (1) fucoxanthin Chl a/c-binding protein of diatoms, called FCP or LHCF, (2) red algae LHC, and (3) stress-responsive LHC of green algae (Vieler et al., 2012b). The expression of two VCP-encoding genes from the stress-responsive LHC family, VCP8|6809 and VCP14|6226, and one from the red algae LHC family, VCP16|904, increased after 24 h of N deprivation and decreased in response to NR (Supplemental Fig. S4D). However, the remaining VCP-encoding genes were down-regulated under N deprivation and up-regulated after NR. Recent studies also showed up-regulation of stress-responsive LHC-encoding genes in response to N deprivation in C. reinhardtii and Phaeodactylum tricornutum (Juergens et al., 2015; Taddei et al., 2016).
Additionally, to evaluate the changes in fluorescence emission of endogenous fluorescent molecules in N. oceanica cells, we performed a spectral analysis using laser-scanning microscopy. Microalgae pigments once excited by UV-visible laser light of appropriate wavelengths produce a specific emission spectrum (Kleinegris et al., 2010; Hyka et al., 2013). Carotenoid fluorescence emission is detected in the green-yellow range of the spectrum, while Chl a is mostly detected in the red spectral area. In our spectral analysis experiments using blue light excitation (488 nm) on N-deprived N. oceanica cells, we detected a different spectral behavior, probably due to an increase in carotenoid and flavonoid pigments compared to cells grown in the presence of N (Supplemental Fig. S4E). When N-deprived cells were probed for Chl a fluorescence by red light excitation (560 nm) the spectral behavior was similar compared to N-sufficient (N+) cells, but it was possible to detect a slightly diminished change in the overall curve emission without variation in the max peak intensity of Chl a (Supplemental Fig. S4F).
During N deprivation the levels of mRNAs corresponding to the components of PSI and PSII, cytochrome b6f, and ATP synthase decreased within 12 h after transfer to N-free medium (Fig. 4A). Meanwhile, an up-regulation of all the genes was observed after NR. We confirmed the changes in expression profiles of the mentioned genes by immunoblotting of proteins acting in different photosynthetic complexes (Fig. 4, B–E). A decrease in protein level in response to N deprivation was observed for PsbA (D1), cytochrome b6f, Rubisco large subunit form II (RbcLII), and ATP synthase, the last of which was the most strongly reduced. NR was accompanied by a substantial increase in the level of all mentioned proteins. It is noteworthy that cytochrome b6f and ATP synthase were more abundant after NR than under N-rich conditions. The down-regulation of the photosynthetic pathway under N deprivation was observed in many microalgae at the level of both transcript and protein of the most essential enzymes (Valledor et al., 2014; Juergens et al., 2015; Longworth et al., 2016).
Since certain reactions of the Calvin-Benson cycle are common to different metabolic pathways, we also performed the clustering of multiple genes involved in the processes of carbon fixation and partitioning (Supplemental Fig. S5). The Calvin-Benson cycle-related genes were strongly repressed under N deprivation. This was particularly evident for the already mentioned Rubisco-encoding genes (RuS|10920 and RuL|4877 in cluster 5 and RuL|11329 in cluster 2), and for the sedoheptulose bisphospate-encoding gene (SbP|2947, in cluster 5; Supplemental Fig. S5). The genome of N. oceanica encodes also some enzymes of C4-type carbon fixation. Among them, genes encoding malic enzymes (ME|9004 in cluster 5 and ME|4675 in cluster 1), a PEP carboxykinase (PCK|6821 in cluster 4), and pyruvate phosphate dikinase (PPDK|2768 in cluster 3 and PPDK|1520 in cluster 1) were up-regulated in response to N deprivation. Transcript levels of all the genes encoding glyceraldehyde-3P dehydrogenase (GAPDH|2231, GAPDH|4900, and GAPDH|3236) were up-regulated immediately after NR (Supplemental Fig. S5); however, in the case of GAPDH|4900, increased expression was observed also under N deprivation. Moreover, the transcripts of phosphoglycerate kinase (PGK|4644 in cluster 4) were abundantly present at the later time points of N removal. The abundance of mRNA encoding four of five putative pyruvate kinases (PK|5759, PK|8130, and PK|10510 in cluster 1 and PK|497 in cluster 4) increased and maintained high levels through the entire period of N deprivation. As was proposed for other green algae (Valledor et al., 2014), diverse patterns of expression between the genes governing carbon fixation might reflect high metabolic flexibility of N. oceanica for maintaining crucial rates of CO2 fixation under diverse types of stress.
Nitrogen Accessibility Affects FA Biosynthesis
Numerous studies in microalgae have shown that N deprivation induces de novo FA biosynthesis and results in an accumulation of significant amounts of storage lipids in the form of TAG (Li et al., 2012a, 2014; Yang et al., 2013; Tan and Lee, 2016). The core building block of FA biosynthesis, acetyl-CoA, is generated by one of two types of multienzyme pyruvate dehydrogenase complex, plastidial (pPDHC) or mitochondrial PDHC. pPDHC converts pyruvate into acetyl-CoA for de novo FA synthesis, whereas mitochondrial PDHC generates acetyl-CoA that enters the tricarboxylic acid cycle for cellular respiration. Figure 5A shows that transcript levels for a putative pPDHC E1 subunit (E1|10574, E1|8013) were up-regulated, while transcript levels for the putative pPDHC E2 and E3 subunits (E2|2363, E3|6382) were down-regulated under N deprivation. By directing carbon flux into TAG synthesis, the E1α subunit of pPDHC plays a role in stress responses in microalgae (Li et al., 2014; Shtaida et al., 2014; Avidan et al., 2015). It should be noted that mitochondrial E2|6999, E3|196, and PDK|9282 (Fig. 5B) were down-regulated under N deprivation, agreeing with previously reported effects of antisense knockdown of mPDK leading to significant TAG accumulation in P. tricornutum (Ma et al., 2014).
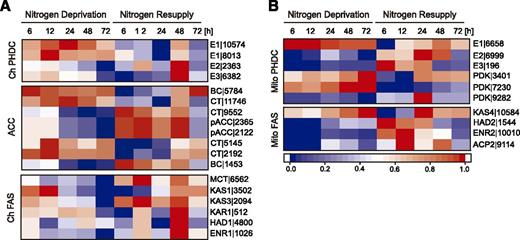
Expression of genes encoding plastidial and mitochondrial enzymes involved in lipid biosynthesis under N deprivation and after NR. Log2-fold changes >1 in expression of genes encoding plastid (A) and mitochondrial (B) enzymes were normalized between 0 and 1 and used for heat map generation. Changes with P ≤ 0.01 were considered statistically significant (P values are given in Supplemental Dataset 2). Red indicates up-regulation of expression and blue a corresponding down-regulation. Descriptions and expression values are given in Supplemental Dataset 2. ACC, acetyl-CoA carboxylase components; Ch, chloroplast; Mito, mitochondria; PHDC; pyruvate decarboxylase complex. Numbers indicate digits in the gene IDs given in Supplemental Dataset 2.
The first committed step in FA biosynthesis, the conversion of acetyl-CoA into malonyl-CoA, is catalyzed by acetyl-CoA carboxylase (ACCase; Huerlimann and Heimann, 2013). In previous studies in microalgae, ACCase was down-regulated under N deprivation, although the abundance of individual components at the protein or RNA level was still relatively high and sufficient for maintaining FA synthesis (Rismani-Yazdi et al., 2012; Corteggiani Carpinelli et al., 2014; Li et al., 2014; López García de Lomana et al., 2015; Park et al., 2015). In our study, the genes encoding components of the multimeric form of ACCase: biotin carboxylase (BC|5784), carboxyltransferases (CT|11746, CT|5145, and CT|2192), were up-regulated under N deprivation, repressed at early steps of NR and up-regulated again after 48 h of NR (Fig. 5A). However, CT|9552, pACC|2365, pACC|2122, and BC|1453 transcript levels decreased within 24 h N deprivation and increased substantially in response to NR (Fig. 5A). Prior to entering the FA synthesis pathway, this malonyl-CoA is converted into malonyl-acyl carrier protein (ACP) by malonyl-CoA-ACP malonyltransferase (MCT|6562), which showed progressive down-regulation after N removal (Fig. 5A).
The FA synthase (FAS) complex utilizes this malonyl-ACP to produce 16:0-ACP and 18:0-ACP through a series of elongation steps. Expression of all the genes encoding putative components of plastidic FAS (ChFAS, 3-ketoacyl-ACP synthase [KAS], 3-ketoacyl-ACP reductase [KAR], hydroxyacyl-ACP dehydrogenase [HAD], and enoyl-ACP reductase [ENR]) was up-regulated at the initial steps of N deprivation, followed by gradual repression, and finally up-regulated again after NR (Fig. 5A). Similar expression patterns for ChFAS were reported for N-deprived N. oceanica IMET1 and C. reinhardtii (Li et al., 2014; Valledor et al., 2014; López García de Lomana et al., 2015). By contrast, KAS4|10584, which encodes one of the four putative components of mitochondrial FAS, showed up-regulation under N-deprivation conditions, whereas the expression of the remaining three genes encoding presumed components of mitochondrial FAS peaked just after NR (Fig. 5B). Based on these expression profiles, our data support the hypothesis that mitochondria might increase their FA synthesis output through transcriptional changes under stress conditions (Li et al., 2014).
Profiling of Genes Governing Glycerolipid Assembly Reveals High Flexibility of N. oceanica Lipid Metabolism
Analogous to seed plants, two distinct glycerolipid biosynthetic pathways, prokaryotic (chloroplast) and eukaryotic (ER), have been proposed in N. oceanica (Vieler et al., 2012b). In general, most genes involved in the chloroplast pathway (Fig. 6A, Membrane lipids [Ch]) of DAG synthesis (GPAT|4533, LPAAT| 2512, and PP|4742) and some genes encoding the putative plastid galactolipid synthases, including DGDS|4384 and SQD1|6637, showed slightly repressed or no differences in transcript levels during N deprivation and increased expression levels during NR (Fig. 6A). Most of the genes synthesizing membrane phospholipids in the ER (eukaryotic pathway; Fig. 6A, Membrane lipids [ER]), including CDS (for cytidinediphosphate DAG synthase; CDS|9149), CDP:DAG (CDP:DAG|6627 and CDP:DAG|7121), and DAG-N,N,N-trimethyl-homo-Ser synthase (BTA1|10012), were repressed under N deprivation and up-regulated after NR (Fig. 6A). These expression levels were consistent with reduced levels of membrane phospholipids measured in N-starved Nannochloropsis cells (Simionato et al., 2013; Li et al., 2014), as well as the observed reorganization of the cellular membranes in response to changing N availability (Fig. 1).
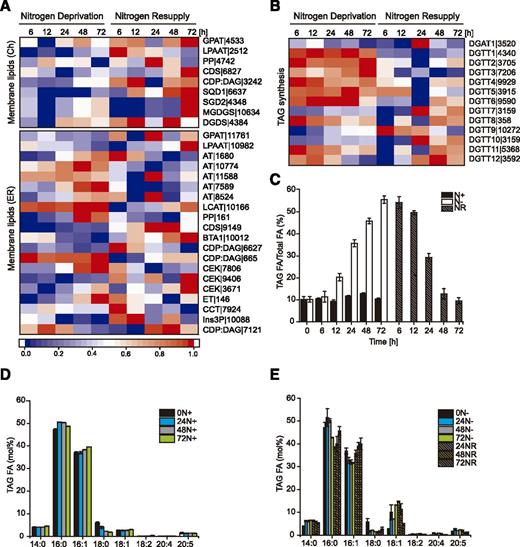
Glycerolipid biosynthesis under N deprivation and after NR. A, Expression of the genes governing membrane lipid synthesis. B, Transcriptional regulation of DGAT genes. For A and B, log2-fold changes in expression >1 were normalized between 0 and 1 and used for heat map generation, and changes with P ≤ 0.01 were considered statistically significant (P values are given in Supplemental Dataset 2). Red indicates up-regulation of expression and blue a corresponding down-regulation. Descriptions of the genes and expression values can be found in Supplemental Dataset 2. C, Changes in TAG content (shown as the ratio of TAG FAs to total FAs) during growth in N-rich medium (N+), N free medium (N−), and after NR. D, FA composition of TAG from cultures growing under N-rich (N+) conditions. E, Profile of FAs in TAG during growth under N deprivation (N−) and NR conditions. Each data point represents the average of three biological replicates. FAs are reported by number of carbons:number of double bonds. Values represent means ± sd (n = 3).
This reorganization of cell membranes is associated with a massive increase in TAG synthesis primarily utilizing the ER-localized Kennedy pathway (Chapman and Ohlrogge, 2012). The genes encoding the Kennedy pathway enzymes showed strong change in expression in response to N deprivation and NR. For example, the acyltransferases GPAT|1176 and LPAAT|10982 were slightly down-regulated in response to N deprivation. In contrast, the expression of the phosphatidic acid phosphatase PP|161 gene was progressively up-regulated under these conditions and down-regulated under NR (Fig. 6A, Membrane lipids [ER]). The last step of the Kennedy pathway is catalyzed by DAG acyltransferases (DGATs), usually either type 1 or type 2 DGAT (DGAT1 or DGAT2 [DGTT]; Turchetto-Zolet et al., 2011). In microalgal genomes, DGTT genes are usually present in multiple copies (Zienkiewicz et al., 2016) with N. oceanica containing one DGAT1 and 12 DGTT genes (Vieler et al., 2012b). The DGAT1-encoding gene (DGAT1|3520) was down-regulated under N deprivation, followed by up-regulation after NR with a peak at 24 h (Fig. 6B). Six of the 12 DGTT-encoding genes (DGTT1|4340, DGTT2|3705, DGTT3|7206, DGTT4|9929, DGTT5|3915, and DGTT6|9590) were up-regulated in response to N deprivation, but a strong decrease of their expression occurred after NR. A similar pattern, although less evident, also occurred for DGTT7 (DGTT7|3159), DGTT9 (DGTT9|10272), and DGTT10 (DGTT10|3159). In contrast, the genes encoding DGTT8 (DGTT8|358), DGTT11 (DGTT11|5368), and DGTT12 (DGTTT12|3592) showed a progressive down-regulation in response to N deprivation (Fig. 6B) and up-regulation after NR. Such diverse expression patterns of DGAT-encoding genes in N-deprived cells of N. oceanica is consistent with previous reports (Li et al., 2014; Zienkiewicz et al., 2017). Apparent up-regulation of DGTT1- to DGTT6-encoding genes under N deprivation suggests their direct contribution to TAG formation, as demonstrated for NoDGTT5, whereas other DGTTs might possess specialized functions under different environmental conditions (Zienkiewicz et al., 2017).
To test the relationships between alterations in expression as described above and TAG synthesis, we measured the changes in TAG content under N deprivation and resupply (Fig. 6, C–E). N deprivation was accompanied by a progressive and massive accumulation of TAG that afterward decreased in response to NR as TAG was mobilized by cells to resume normal growth and cellular functions (Fig. 6C). The acyl composition in TAG under N-rich conditions showed a slight increase of 16:0 and 16:1 (Fig. 6D). N deprivation induced an increase in 18:1 (presumably from increased de novo FA synthesis) and a decrease in 16:1 content, whereas NR resulted in a depletion of 18:1 and an increase in 16:1 (Fig. 6E). Additionally, a slight increase in 20:4 and 20:5 acyl-containing TAG (discussed in the next section) and their subsequent depletion was observed in response to N deprivation and NR, respectively. These results support the hypothesis that membrane-derived polyunsaturated FAs (PUFAs) are recycled into de novo synthesized TAG utilizing the breakdown of lipids from a structural reorganization of chloroplast membranes (Fig. 1).
The observed levels of TAG were associated with the appearance of the LDs in N. oceanica cells under the tested N conditions (Fig. 1). As NoLDSP has been found to encode the major LD-associated protein in N. oceanica (Vieler et al., 2012a), we analyzed its gene expression and its localization (Fig. 7). The bulk of NoLDSP expression occurred during N deprivation (Fig. 7A). In turn, NR was accompanied by a rapid drop in NoLDSP expression. Supporting these expression results, the levels of NoLDSP protein gradually increased during N deprivation, reaching the highest levels at 72 h, whereas NR resulted in a sharp decrease of NoLDSP content during the first 24 h, followed by a gradual depletion of the NoLDSP pool (Fig. 7B). We also observed the specific NoLDSP-GFP location on the LD surface under N deprivation (Fig. 7C, arrows). Similarly, the expression patterns of major LD-associated proteins found in other microalgae, like MLDP in Chlamydomonas (Moellering and Benning, 2010; Nguyen et al., 2011) or the recently described Stramenopile-type LD protein (StLDP) from P. tricornutum (Yoneda et al., 2016), follow the levels of TAG and abundance of LDs in N-deprived cells. Thus, NoLDSP itself, as shown by Vieler et al. (2012a), or NoLDSP-GFP, as shown here, serve as cellular markers of TAG accumulation and LD dynamics in N. oceanica.
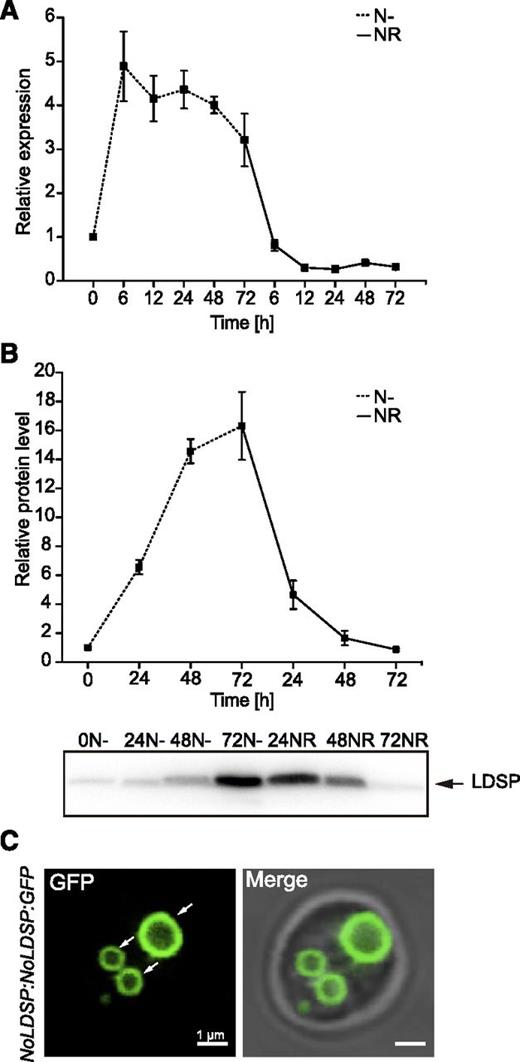
Expression of NoLDSP in N. oceanica. Expression profiling of the NoLDSP-encoding gene determined by RT-qPCR and normalized against NoACTIN reference gene (A) and NoLDSP protein levels (B) under N deprivation and after NR. Each data point represents the average of three biological replicates. Values represent the means ± sd (n = 3). C, Representative image of cellular distribution of the NoLDSP:GFP construct during N deprivation.
N Presence Stimulates Long-Chain PUFA Biosynthesis
The core FA biosynthesis pathway in the plastid ends with production of 16:0-ACP, 18:0-ACP, and 18:1-ACP (Ohlrogge and Browse, 1995; Li-Beisson et al., 2015). The gene encoding the stromal Ɗ9 stearoyl-ACP desaturase (SAD/FAB2) responsible for 18:1-ACP production (Shanklin and Cahoon, 1998) was strongly up-regulated throughout N deprivation (SAD|11506), similar to a previous study in N. oceanica IMET1 (Li et al., 2014), followed by a consistent down-regulation under NR (Fig. 8A, Desaturases). Interestingly, overexpression of SAD in C. reinhardtii resulted not only in elevated levels of 18:1 but also of 18:2 and 16:0 (Hwangbo et al., 2014). This expression pattern fits with the changes in the cellular level of 18:1 in the pool of total lipids (Fig. 8D) and clearly suggests the intensification of FA desaturation under N deprivation.
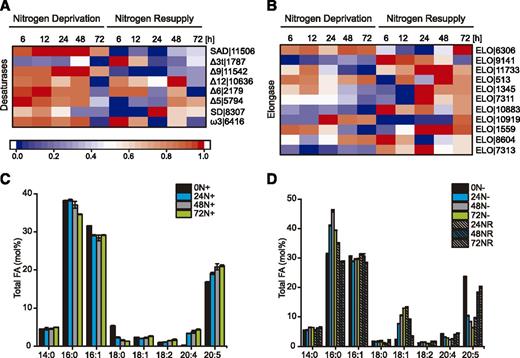
Expression of genes involved in LC-PUFA biosynthesis and total lipid composition under N deprivation and after NR. A and B, Expression of desaturases (A) and elongases (B) encoding genes. Log2-fold changes in expression >1 were normalized between 0 and 1 and used for heat map generation, and changes with P ≤ 0.01 were considered statistically significant (P values are given in Supplemental Dataset 2). Red indicates up-regulation of expression and blue a corresponding down-regulation. Descriptions and expression values are given in Supplemental Dataset 2. C, FA composition of total lipids from cultures growing under nitrogen-rich (N+) conditions. Values represent means ± sd (n = 3). D, Changes in FA composition of total lipids during growth in N-depleted (N−) medium and after NR. Fatty acids are reported by number of carbons:number of double bonds. Values represent means ± sd (n = 3).
Nannochloropsis species are important producers of long-chain PUFAs (LC-PUFAs), such as eicosapentaenoic acid (EPA, 20:5), that are crucial components of human (Homo sapiens) health and nutrition (Kaye et al., 2015; Poliner et al., 2018b). The Nannochloropsis LC-PUFA biosynthesis pathway is localized in the ER and includes five ER membrane-bound FA desaturases, Ɗ9, Ɗ12, Ɗ6, Ɗ5, and ω3, and the Ɗ6 FA elongase (Kaye et al., 2015; Poliner et al., 2018b). The Ɗ9 desaturase (Ɗ9|11542) transcript levels increased after 12 h of N deprivation; meanwhile, the peak in expression of Ɗ12|10636, Ɗ6|2179, Ɗ5|11542, and ω3|6416 was observed within the first 12 h of N deprivation, followed by a progressive decrease in expression. NR resulted in a second peak of their expression (Fig. 8A, Desaturases). The eleven putative elongases (ELOs) can be divided into two main groups with regard to their expression pattern (Fig. 8B, Elongases). The genes of the first group, including ELO|6306, ELO|513, ELO|10919, ELO|1559, and ELO|8604, were highly expressed during N deprivation. The second group of genes, represented by ELO|9141, ELO|7311, ELO|10883, and ELO|7313, were up-regulated in response to NR (Fig. 8B). ELO|9141 was identified as a Ɗ6 FA ELO and proposed to be involved in LC-PUFA biosynthesis. Indeed, coexpression of N. oceanica Ɗ12, Ɗ6, Ɗ5, ω3, and Ɗ6 ELO (ELO|9141) coding sequences induced the synthesis of EPA in S. cerevisiae and N. oceanica (Kaye et al., 2015; Poliner et al., 2018b).
In Nannochloropsis, EPA is mostly associated with chloroplast membrane lipids such as MGDG, DGDG, and DAG-N,N,N-trimethyl-homo-Ser (Vieler et al., 2012b; Simionato et al., 2013). As shown previously, N depletion induced significant decreases in the 20:5 acyl content in the total lipid pool (Breuer et al., 2012; Simionato et al., 2013). The largest relative decreases of 20:5 were observed in polar lipids and were associated with the reduction of total MGDG and DGDG. Our analysis of FA composition in the total lipid pool showed substantial changes in response to different N conditions (Fig. 8, C and D). In the presence of N, 16:0, 16:1, and 18:0 decreased while 18:2, 20:4, and 20:5 increased (Fig. 8C). N deprivation triggered a significant reorganization of FA profiles, including a strong increase of 16:0 and 18:1 content and a dramatic drop in 20:5 amounts (Fig. 8D). NR was in turn accompanied by depletion of 16:0 and 18:1 and an apparent accumulation of 20:5. Collectively, these results showed a positive association between the expression of desaturase-encoding genes and the level of LC-PUFAs under diverse nutrient conditions.
Divergent Pathways of FA Recycling Are Active during N Deprivation and N Resupply
Recycling of membrane lipids into TAG during N deprivation has been reported in many microalgae strains (Li et al., 2012b; Yoon et al., 2012; Jaeger et al., 2017). This process can be catalyzed by a phospholipid:DAG acyltransferase (PDAT) that transfers an acyl group from phospholipids such as phosphatidylglycerol to DAG. Two putative PDAT-encoding genes (PDAT1|2212 and PDAT2|8602) were gradually up-regulated in response to N deprivation and down-regulated after NR, suggesting a role in membrane lipid turnover (Fig. 9). In Chlamydomonas and other microalgae like Myrmecia incisa, the increase in PDAT transcript abundance under N deprivation reflected both the reduction in membrane phospholipid content and increased TAG accumulation (Yoon et al., 2012; Liu et al., 2016b). The involvement of PDAT in membrane recycling was also directly confirmed in Chlamydomonas, where a knockdown of PDAT resulted in the increase of membrane lipid content and decreased levels of TAG (Yoon et al., 2012), although in this case the enzyme uses lipids other than phosphatidylglycerol, which is absent in Chlamydomonas.
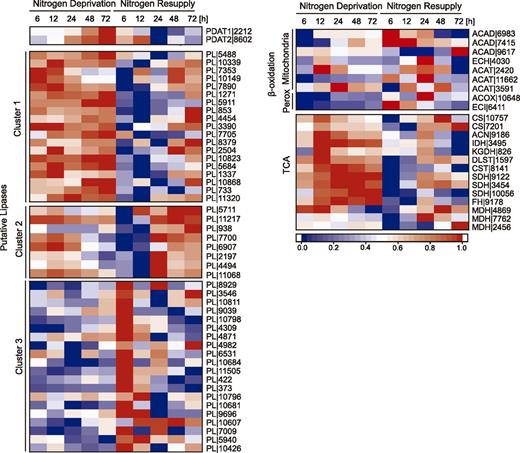
Expression of genes involved in TAG and FA degradation under N− and NR conditions. Expression profiles of genes encoding PDATs, putative lipases, β-oxidation machinery, and tricarboxylic acid enzymes. Log2-fold changes in expression >1 were normalized between 0 and 1 and used for heat map generation, and changes with P ≤ 0.01 were considered statistically significant (P values are given in Supplemental Dataset 2). Red indicates up-regulation of expression and blue a corresponding down-regulation. Descriptions and expression values can be found in Supplemental Dataset 2. Perox, peroxisome, TCA; tricarboxylic acid cycle. Numbers indicate digits of gene IDs.
Lipases and esterases are also likely involved in the recycling of membrane lipids into TAG. Clustering analysis of the genes encoding putative lipases in N. oceanica showed that 19 genes (Fig. 9, cluster 1) were highly expressed during N deprivation. Their transcript levels decreased immediately after NR and increased again at 48 h of NR. As proposed previously, degradation of membranes in N-starved microalgae cells involves galactolipases (Li et al., 2012b, 2014; Jaeger et al., 2017; Du et al., 2018). PLASTID GALACTOGLYCEROLIPID DEGRADATION1 (PGD1) was identified as one of the main lipases responsible for galactoglycerolipid turnover in C. reinhardtii (Li et al., 2012b; Du et al., 2018). However, we did not find a homolog of PGD1 by default BLAST search in N. oceanica. Putative lipases grouped in cluster 2 (Fig. 9) showed gradual decreased transcript levels under N deprivation and increased levels within the first 24 h of NR. Additionally, 20 putative lipase-encoding genes (Fig. 9, cluster 3) showed a very short expression peak within the first hours of NR. Within this cluster, one putative patatin-like lipase (10681) and two putative TAG lipase-encoding genes (8929 and 10426) were identified. Among patatin-like lipases, Arabidopsis (Arabidopsis thaliana) SDP1 has been shown to have a key role in TAG degradation during seed germination (Kelly et al., 2011). Although few homologs of AtSDP1 have been characterized in algae genomes, the SDP1-encoding gene from Lobosphera incisa (LiSDP1) was up-regulated during TAG mobilization in response to NR conditions (Siegler et al., 2017), and a repression of genes encoding SDP1-patatin like lipases in P. tricornutum and Chlamydomonas resulted in higher accumulation of TAG (Barka et al., 2016; Warakanont et al., 2019).
FAs released from TAG are metabolized by β-oxidation. In N. oceanica, both mitochondrial and peroxisomal β-oxidation pathways were identified (Vieler et al., 2012b; Poliner et al., 2015). The expression of β-oxidation-related genes reached its peak after NR, with the exception of two genes encoding putative thiolases (ACAT|2420 and ACAT|3591; Fig. 9). It is noteworthy that increased levels of transcripts for mitochondrial acetyl-CoA dehydrogenase (ACAD|6983, ACAD|7415, and ACAD|9617) and enoyl-CoA hydratase (ECH|4030) were observed under N deprivation. A similar expression pattern was reported for these genes also for N-starved N. oceanica IMET1 (Li et al., 2014). Acetyl-CoA generated by β-oxidation enters the tricarboxylic acid cycle. Most of the mitochondrial tricarboxylic acid cycle-related genes were highly expressed in the absence of N, whereas NR resulted in their rapid repression (Fig. 9). However, the later stages of growth under NR were accompanied by higher abundance of mRNAs encoding tricarboxylic acid cycle enzymes. As proposed by Li et al. (2014), the up-regulation of tricarboxylic acid cycle-related genes can reflect also a massive degradation of proteins and amino acids under N deprivation conditions, which contributes to the production of carbon chains for TAGs. Moreover, the high activity of the tricarboxylic acid cycle at later steps of NR may also indicate enhanced β-oxidation-mediated degradation of LDs.
Autophagy Plays a Role in LD Degradation following N Resupply
Autophagy is a catabolic process responsible for the degradation and recycling of intracellular components under different stress conditions in animal, plant, and algae cells (Behrends et al., 2010; Pérez-Pérez et al., 2010; Michaeli et al., 2016; Pérez-Pérez et al., 2016). Cellular components are sequestered by a double-membrane structure called an autophagosome (macroautophagy) and delivered to the lysosome/vacuole for their degradation and recycling (Ward et al., 2016). Autophagy-related genes (ATGs) encode proteins required for autophagosome biogenesis and fusion with the lysosome/vacuole. To investigate the possible role of autophagy in the recycling of molecules and organelles under N deprivation and NR in N. oceanica, we first identified ATG homologs and analyzed their gene expression levels (Fig. 10A). As previously described, the nutrient deprivation signal is first transmitted to the autophagic complex by the Ser/Thr kinase Target of Rapamycin (TOR; Xiong and Sheen, 2014). In N. oceanica, we found two putative TOR-encoding genes (TOR|10647 and TOR|8890; Fig. 10A). TOR|10467 transcript levels decreased gradually during N deprivation followed by a significant increase after NR. In contrast, TOR|8890 showed the opposite expression pattern.
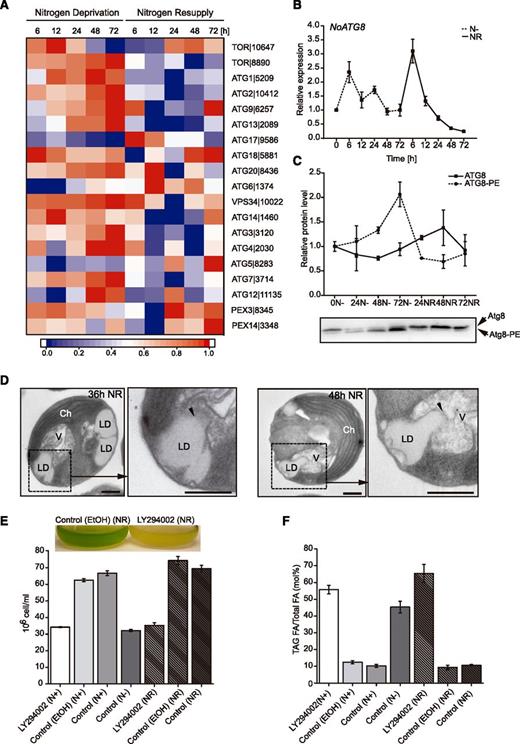
Expression of autophagy-related genes and identification of autophagy-mediated LD degradation. A, Expression of genes related to autophagy under N deprivation and after NR. Log2-fold changes in expression >1 were normalized between 0 and 1 and used for heat map generation, and changes with P ≤ 0.01 were considered statistically significant (P values are given in Supplemental Dataset 2). Red indicates up-regulation of expression and blue a corresponding down-regulation. Descriptions and expression values of the genes can be found in Supplemental Dataset 2. B, Expression profiling of NoATG8 under N− and NR conditions analyzed with RT-qPCR. Values represent means ± sd (n = 3). C, Relative abundance of NoATG8 and NoATG8-PE protein isoforms during N deprivation and after NR. Values represent means ± sd (n = 3). D, Ultrastructural analysis of LDs fusing with vacuoles (arrowheads) in N. oceanica cells after NR. Ch; chloroplast, V; vacuole. E and F, Cell number (E) and TAG amount (F) of N. oceanica cultures grown in media with N (N+), without N (N−), and after NR treated with LY294002. Control (ethanol), media with addition of inhibitor solvent; Control, media (N+, N−, and NR) without inhibitor or solvent. Each data point represents the average of three independent cultures. Values represent means ± sd (n = 3).
Core autophagy genes can be divided into three groups: the ATG9 cycling complex (ATG1, ATG2, ATG9, ATG13, ATG18, and ATG27), the PI3 kinase complex (ATG6/VPS30/BECLIN1, ATG14, VPS15, and VSP34), and the Ub-like protein system (ATG3, ATG4, ATG5, ATG7, ATG8, ATG10, ATG12, and ATG16; Farré et al., 2009; Avin-Wittenberg et al., 2012a; Jiang et al., 2012). N. oceanica possesses a single copy of the ATG1, ATG2, ATG9, ATG13, and ATG18 genes belonging to the ATG9 cycling complex (Fig. 10A). N. oceanica ATG1|5209, ATG2|10412, ATG9|6257, and ATG13|2089 were highly expressed during the whole course of N deprivation and repressed after NR (Fig. 10A). High expression of ATG18|5881 gradually decreased in response to N deprivation but increased again at later time points after NR (Fig. 10A). In Arabidopsis, ATG18 belongs to an eight-member family (ATG18a–ATG18h), and the respective genes are differentially expressed upon exposure to various stress conditions. However, only AtATG18a is necessary for autophagosome formation under different nutrient deprivation conditions (Xiong et al., 2005). Two ATG18 genes were also identified in C. reinhardtii and Chlorella variabilis (Jiang et al., 2012). There is a possibility that more homologs of this gene exist also in N. oceanica, but they were not identifiable by a BLAST search using default settings.
ATG proteins of the PI3 kinase complex are also well conserved in microalgae (Jiang et al., 2012; Ramanan et al., 2018). VPS34|10022, encoding the only class III PI3K, was identified in N. oceanica. It contains only one PI3Kc_III domain and was up-regulated during N deprivation (Fig. 10A). Genes encoding three other members of the PI3 kinase complex (ATG6|1374, ATG14|1460, and VPS15|10526) were also highly expressed under N deprivation. Two distinct ubiquitin-like protein conjugation systems are involved in synthesis and closure of the autophagosome membrane (Rubinsztein et al., 2012; Nakatogawa, 2013). The first one is composed of ATG12, ATG5, and ATG16 (the ATG12 conjugation system) and the second one includes ATG8, ATG3, and ATG4 (the ATG8 conjugation system). ATG12 and ATG8 systems are activated by the E1-like enzyme ATG7 and conjugated by the E2-like enzymes ATG10 or ATG3, respectively. A Cys protease, ATG4, cleaves the C-terminal part of the ATG8 protein to expose a Gly residue that is necessary for the conjugation of ATG8 with phosphatidylethanolamine (PE). Finally, the ATG8-PE complex associates with the double-membrane vesicles that differentiate into the autophagosome (Seo et al., 2016).
Most of the ATG genes identified in the N. oceanica genome belong to the ubiquitin-like protein conjugation system including ATG12|11135, ATG7|3714, ATG3|3120, and ATG4|2030 and were up-regulated following N deprivation. ATG8 is one of the most abundant ATG proteins. In contrast to a single ATG8 gene in yeast, higher eukaryotes possess multiple ATG8 gene families. For example, eight ATG8 genes were identified in human and nine in Arabidopsis (Sláviková et al., 2005; Shpilka et al., 2011). A single ATG8 homolog is present in the N. oceanica genome and in green algae (Jiang et al., 2012). Transcriptional profiling of NoATG8, analyzed by RT-qPCR, showed its highest expression after 6 h of N deprivation and immediately after NR (Fig. 10B). Moreover, by immunoblotting we were able to follow the NoATG8 protein abundance and modification pattern in response to different N conditions. Two pools of ATG8 protein were detected in N. oceanica-free NoATG8 and NoATG8-PE. The level of NoATG8-PE increased gradually during N deprivation. Meanwhile, following NR, a depletion of the NoATG8-PE pool was observed together with a concomitant increase in the level of free NoATG8 (Fig. 10C).
To test for additional evidence of autophagy at the cellular level we performed ultrastructural analysis of N. oceanica exposed to N deprivation (Fig. 10D). We found evidence for fusion of LDs with vacuoles after NR. This suggests the occurrence of LD-mediated autophagy (lipophagy; Fig. 10D, arrowheads). This process is still largely uncharacterized in microalgae and plants. So far, lipophagy in microalgae was described in A. protothecoides during the transition from heterotrophy to autotrophy (Zhao et al., 2014) and in C. reinhardtii during NR (Tsai et al., 2018). Recently it was shown that lipid degradation in the atg8 mutant of Chlamydomonas in response to NR is slower when compared with the wild type (Kajikawa et al., 2019).
We used LY294002 to determine whether inhibition of the autophagy pathway in N. oceanica would influence TAG synthesis and degradation. LY294002 is a specific inhibitor of phosphatidylinositol (PI) kinases in plant cells (Jung et al., 2002; Lee et al., 2008; Leprince et al., 2015). It specifically inhibits III PI3K (VPS34), whereas other PI kinase inhibitors, such as wortmannin, inhibit not only VPS34 but also PI4K and PIPK (Jung et al., 2002). Adding LY294002 to the N. oceanica cells growing under N-replete conditions resulted in decreased cell number (Fig. 10E) and increased TAG level compared to the controls (Fig. 10F). When LY294002 was added to N. oceanica growing under NR conditions, inhibition of TAG degradation together with cessations of cell proliferation occurred. Recently it was shown that inhibition of VPS34 with 3-Methyladenine (3MA) resulted in an increase of TAG content under both N-replete and N-depleting conditions in C. reinhardtii (Ramanan et al., 2018). Moreover it was reported that concanamycin A, a vacuolar ATPase inhibitor, blocks autophagic flux in C. reinhardtii and suppresses TAG synthesis under N deprivation (Couso et al., 2018). However, adding concanamycin A to C. reinhardtii cultures growing under optimal conditions increased TAG accumulation. Therefore, a tight connection between autophagy-mediated TAG degradation, cellular lipid metabolism, and cell cycle seems to exist in microalgae cells.
Numerous multifunctional proteins that bind to ATG8 proteins have been annotated in mammalian cells, but there are only few and fragmentary data on ATG8-binding proteins in plants (Avin-Wittenberg et al., 2012b; Zhou et al., 2013; Dagdas et al., 2016). ATG8 homologs selectively bind their targets during autophagy and this occurs by the ATG8 Interacting Motif, also called the LC3-interacting region (LIR) and defined as W/YXXL/I/V in the target protein (Noda et al., 2010). We examined also the possibility of interaction between the NoLDSP and NoATG8 proteins in N. oceanica. Using the iLIR Atg8 binding motif prediction tool (Kalvari et al., 2014), we identified LIR motif WILI in the LDSP protein. To determine whether NoATG8 and NoLDSP interact in vivo we performed a biomolecular fluorescence complementation (BiFC) assay. We fused NoATG8 to the C-terminal YFP fragment (cYFP-NoATG8) and NoLDSP to the N-terminal YFP fragment (nYFP-NoLDSP) and coexpressed both in Nicotiana benthamiana leaves. The BiFC signal was detected in transformed cells in the form of ring-shaped structures (Supplemental Fig. S6). Control experiments, in which cYFP and nYFP were coproduced, did not show any fluorescence signal (Supplemental Fig. S6). We also expressed a construct encoding a site-directed mutant version of NoLDSP protein, from which the conserved WxxI LIR motif was removed. After coexpression of cYFP-NoATG8 and the mutant version of NoLDSP, no fluorescence was observed in N. benthamiana cells (Supplemental Fig. S6). Consequently, we propose that integral proteins of LDs in algae, such as LDSP, are the key factors mediating LD degradation through the interaction with the autophagy machinery. It is probable that this interaction facilitates the fusion and targeting of LDs into vacuoles. As there are numerous and diverse identified LD-associated proteins in microalgae, further studies are required to address the universality of this mechanism and its role in LD degradation.
CONCLUSION
In this study we used RNA-Seq supplemented with targeted biochemical and cell biological approaches to develop a comprehensive picture of the Nannochloropsis transcriptome and physiology in response to omission and resupply of N. The efficient coordination of cell metabolism of this microalga over relatively short timescales is clearly reflected at the transcriptome level. As a consequence, specific but distinct metabolic pathways are active under N deprivation and after NR and are accompanied by characteristic changes in the cellular organization of the N. oceanica cells (Fig. 11). Overall, our data provide evidence for the high metabolic plasticity of this single-cell organism to respond to dynamic environmental conditions. Transcriptome profiling revealed the existence of specific genetic programs in N. oceanica precisely adapted to actual growth conditions. Consequently, many candidate genes were identified as potential targets for further study. These include the functional analysis of selected cell cycle- and carbon flux-related genes, as well as several putative lipases with possible roles in LD degradation. Finally, we identified potential partners involved in autophagy-mediated LD degradation. Recently, autophagy has been recognized as an important pathway for many aspects of cellular physiology. As proposed here, this mechanism might also have a prominent role in maintaining lipid homeostasis in microalgal cells. The findings reported here provide the basis for deciphering the molecular mechanisms governing the transition of microalgae from quiescence to autotrophy. The key questions yet to be answered are: (1) What cellular and biochemical machinery links TAG formation and cell division control? (2) What is the role of autophagy in the regulation of lipid homeostasis in the cell? and (3) What are the molecular mechanisms of massive LD degradation in response to NR? This knowledge in combination with the recent advances in microalgae genetic engineering should enable biotechnological modification of microalgae to produce strains with higher oil content and biomass production under dynamic environmental conditions.
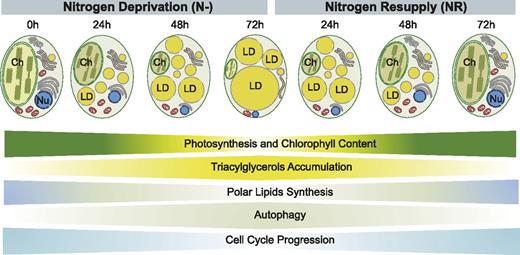
Schematic representation of cellular and physiological events related to the transition from quiescence to autotrophy during N deprivation and after NR, respectively. Width of the horizontal panels indicates intensification of the processes at given time points of N deprivation (N−) and NR conditions. Ch, chloroplast; Nu; nucleus.
MATERIALS AND METHODS
Culture Conditions
Nannochloropsis oceanica CCMP1779 cells were grown in F/2 medium (N+; Vieler et al., 2012b) under continuous light (85 μmol m−2 s−1 at 22°C with shaking at 105 rpm). Cells were harvested at a density of ∼15 million cells/mL by centrifugation (4,000g for 10 min at 22°C). For N deprivation (N−) experiments, cells were washed twice with N-free F/2 medium, then resuspended in N-free medium. For NR experiments, cells were grown in N-free medium for 72 h and then harvested by centrifugation (4,000g for 10 min at 22°C) and resuspended in F/2 medium supplemented with N. For some experiments, LY294002 (Life Technologies) dissolved in 96% (v/v) ethanol at a concentration of 1 mg mL−1 was added to the culture medium at a final concentration of 100 μm. Cell numbers were determined using a Z1 Coulter Counter (Beckman-Coulter) according to the manufacturer’s instructions.
RNA Preparation and RNA-Seq Analysis
Cultured cells (50 mL per sample) were harvested for RNA isolation after N− or NR treatments at 6, 12, 24, 48, and 72 h. For each time point two biological replicates were harvested by centrifugation (4,000g for 10 min at 22°C). Cells were flash-frozen in liquid N and ground using TissueLyser II (Qiagen). RNA was extracted using the E.Z.N.A. Plant RNA kit (OMEGA) according to the manufacturer’s instructions. RNA quality was verified using the Bioanalyzer (Agilent). Single-end, 50-bp nucleotide sequences were acquired for each sample using an Illumina HiSeq 2500 (MSU-Research Technology Support Facility). RNA-Seq reads were trimmed using Trimmomatic (version 0.32; Bolger et al., 2014) with removal of leading and trailing low-quality bases (below quality score 10 with a 4-base wide sliding window) as well as TruSeq Single End adaptors. The resulting reads were aligned to the N. oceanica CCMP1779 genome assembly (GSE36959; Vieler et al., 2012b) using STAR (version 2.3.0e; Dobin et al., 2013) by only allowing unique mapping, a maximum of four mismatches per pair and a maximum intron length of 10,000 bp. HTSeq (version 0.6.1; Anders et al., 2015) was used to generate a count table for all genes using the exon as the feature type as well as the intersect-nonempty mode so that only reads that were completely aligned to two genes were considered ambiguous. HTSeq count tables were used for differential expression analysis using DEseq2 (Love et al., 2014). A generalized linear model was fit and tested on condition (deprivation or recovery) and the time:condition interaction with log2-fold changes >1. Significant differentially expressed genes with P < 0.01 were identified after Benjamini-Hochberg multiple testing correction (Benjamini and Hochberg, 1995). Differentially expressed genes were clustered based on expression using K-means clustering (k = 4) with the Pearson correlation distance metric within MeV (version 4.8.1; Saeed et al., 2003). Correlation analysis between the two biological replicates was performed by generation of R2 values using the correlation tool in Microsoft Excel.
RT-qPCR
RNA was extracted as described above and used for complementary DNA synthesis using the GoScript Reverse Transcription System (Promega). Quantitative PCR was performed on a Mastercycler ep realplex apparatus (Eppendorf) by using SYBR Green Master Mix (Life Technologies). Primers used for RT-qPCR are listed in Supplemental Table S1. Gene expression levels were normalized to Actin (internal control) and calculated using the 2ƊƊCT method (Livak and Schmittgen, 2001). Three independent technical experiments were conducted on three biological cultures (n = 3).
Total Protein Extraction
Cells pelleted by centrifugation (4,000g for 5 min at 22°C) were ground into a fine powder using TissueLyser II (Qiagen). The pellet was resuspended in 0.5 mL of extraction buffer (100 mm Tris-HCl, pH 8.5, 4% [w/v] SDS, 2% [v/v] β-mercapthoethanol, and 2 mm phenylmethylsulfonyl fluoride) and incubated for 3 min at 80°C. Samples were centrifuged (13,500g for 10 min at 22°C), with the resulting supernatants used for immunoblot analysis. Total protein content in each sample was quantified using DC Protein Assay (Bio-Rad).
SDS-PAGE and Immunoblotting
Total protein extracts (25 µg per sample) were mixed with 2× SDS sample buffer (Laemmli, 1970) and boiled for 5 min prior to gel loading. Proteins were separated by SDS-PAGE on 18% acrylamide gels with 4.5% stacking gels and transferred onto a polyvinylidene difluoride membrane using Mini Trans-Blot Cell (Bio-Rad). Membranes were blocked for 1 h in solution containing 1% (w/v) nonfat dry milk in TRIS-buffered saline plus Tween 20 (20 mm Tris-HCl pH 7.5, 150 mm NaCl, and 0.05% [v/v] Tween 20, pH 7.4). Membranes were incubated at 4°C overnight with anti-LDSP antibody diluted at 1:10,000 (Vieler et al., 2012a) or anti-ATG8 antibody (ab77003, Abcam) diluted 1:500. Membranes were then washed three times with TRIS-buffered saline plus Tween 20 and probed with horseradish peroxidase-conjugated antirabbit IgG secondary antibody diluted 1:5,000 for 1 h at room temperature. Antigen was detected by using e Clarity western ECL Substrate (Bio-Rad), and the signal was visualized using a ChemiDoc MP Imaging System (Bio-Rad). For capillary immunoblot analysis Wes automated western blotting system (ProteinSimple) was used according to the manufacturer’s instructions. The primary antibody anti-PsbA (Agrisera, 1:4,000), anticytf (Agrisera, 1:600), anti-ATPase (Agrisera, 1:100), and anti-RbcLII (Agrisera, 1:600) were used for immunoblot analysis in the Wes machine. Compass software 2.5.11 (ProteinSimple) was used to identify and quantify chemiluminescent signal.
Lipid Analysis
First, 25 mL of cell culture was harvested by centrifugation (4,000g for 5 min at 22°C) followed by total lipid extraction of the cell pellet by vortexing samples in methanol and chloroform (2:1 [v/v], for neutral lipids) or methanol, chloroform, and 88% formic acid (2:1:0.1 [v/v/v], for polar lipids). Lipid extracts were washed with 0.9% (w/v) KCl (neutral lipids) or 1 M KCl and 0.2 M H3PO4 (polar lipids) followed by phase separation by centrifugation (3,000g for 3 min at 22°C). Neutral lipids were separated by thin-layer chromatography on Silica G60 plates (EMD Chemicals) developed in petroleum ether:diethyl ether:acetic acid (80:20:1 by volume). Polar lipids were separated on activated ammonium sulfate-impregnated Silica G60 plates using chloroform:methanol:acetic acid:water (75:13:9:3 by volume) as solvent. Lipids were visualized on the thin-layer chromatography plates by brief iodine staining and collected by excising lipid spots with a razor blade. Fatty acid methyl esters (FAMEs) were prepared as previously described (Poliner et al., 2015). Fatty acids were separated and quantified by gas chromatography and flame ionization detection using pentadecanoic acid (15:0) as an internal standard (Agilent 7890; Vieler et al., 2012b).
Chl a Extraction
Chl a was extracted as described previously with minor modifications (Henriques et al., 2007). Ground cell pellets were vortexed with 1 mL of 90% (v/v) acetone and then centrifuged at 13,000g for 10 min at 4°C. The extraction was repeated until the pellet was visibly devoid of green Chl. Resulting supernatants were combined, and Chl absorbance was measured at 665, 645, and 630 nm. Chl a concentration was calculated using Strickland and Parson correlation (Henriques et al., 2007).
Pigment Fluorescence Analysis
Confocal laser scanning microscopy analysis was conducted on N. oceanica CCMP1779 cells mounted in the cultivation media and observed after 72 h of N deprivation and NR. Images were recorded using a Nikon A1Rsi Super Resolution confocal microscope (Nikon Instruments Inc.). A 512 × 512-pixel area was imaged using a 100× objective (Plan Apo TIRF 100× Oil DIC H N2), with a 2× zoom. The pinhole was set to 1.2 Airy unit. The microscope was used in the λ-scan mode with a detection window of 10 nm. To detect flavonoids and carotenoids, λexc = 488 nm was used, with a λem over the 510–630 nm spectral band, while for Chls, λexc = 560 nm was used, with a λem over the 640–750 nm spectral band (Agati et al., 2009; D’Andrea et al., 2014). Fluorescence spectra of cells were analyzed using the Nikon elements AR software package through measurements using the spectrum profile and find spectra function.
Expression of NoLDSP in N. oceanica CCMP1779
The pSELECT100 plasmid (Vieler et al., 2012b) carrying the Hygromycin B resistance cassette was linearized by the StuI enzyme. The LDSP gene and its native promoter were amplified using N. oceanica CCMP1779 genomic DNA as templates with the primers LDSPF1 and LDSPR1 (Supplemental Table S1). The stop codon TAA was removed from the amplicon. The coding sequence of the enhanced GFP (EGFP) was amplified from the p35S-OCS-BM plasmid (PMID: 22307965) with the primers EGFPF1 and EGFPR1 (Supplemental Table S1). The LDSP terminator sequence was amplified from N. oceanica CCMP1779 genomic DNA with the primer LDSPF2 and LDSPR2. All fragments were assembled using the Gibson Assembly kit (New England Biolabs) following the manufacturer’s instructions. The assembled pLDSP-EGFP construct was confirmed by sequencing and linearized by AseI before the transformation. Nuclear transformation by electroporation of N. oceanica CCMP1779 cells was performed as previously described (Vieler et al., 2012b). Resistant colonies were picked and transferred into liquid F/2 medium. After about 1 week cells were observed under the Olympus FluoView 1000 confocal laser scanning microscope with excitation at 488 nm.
BiFC
The NoLDSP and NoATG8 complementary DNA was amplified using the primers listed in Supplemental Table S1. PCR products were cloned into the pENTR-d/TOPO vector (Invitrogen) and recombined, using the Gateway LR Clonase II system (Invitrogen), into pSITE-nEYFP-C1 and pSITE-nEYFP-N1 destination vectors obtained from the Arabidopsis Biological Resource Center. Site-directed mutagenesis (deletion) of NoLDSP was performed using gene-specific primers (Supplemental Table S1) and the Q5 Site Directed Mutagenesis Kit (BioLabs) according to the manufacturer’s instructions. The resulting constructs were transformed into Agrobacterium tumefaciens (GV3101 strain), and selected on Luria-Bertani medium plates supplemented with spectinomycin (100 μg/mL). A. tumefaciens overnight liquid cultures were centrifuged for 5 min at 4,000g and resuspended in MMA buffer (10 mm MES, pH 5.6, 10 mm MgCl2, and 100 μm acetosyringone) to an OD600 of 1.2. Next, cells were incubated for 3 h at room temperature. Before coinfiltration of Nicotiana benthamiana leaves, A. tumefaciens harboring nYFP and cYFP fusion constructs were mixed and adjusted to an OD600 of 0.4 in infiltration medium. Young leaves of 4-week-old N. benthamiana were injected using a 1-mL blunt-end syringe. Leaves were analyzed 48 h after infiltration using an Olympus FluoView FV1000 confocal microscope.
Confocal Microscopy
Cells were harvested by centrifugation (4,000g for 5 min at 22°C) and then fixed in 4% (v/v) paraformaldehyde and 0.25% (v/v) glutaraldehyde in phosphate-buffered saline (pH 7.2) for 1 h at room temperature. After washing with phosphate-buffered saline (5 min at room temperature), samples were used immediately or stored at 4°C. To detect LDs, cells were incubated with 1 mm BODIPY 493/503 (Invitrogen) for 30 min at room temperature. To visualize nuclear DNA, cells were stained with 4,6-diamidino-2-phenylindole (DAPI) for 30 min at room temperature. Stained cells were observed under a FluoView 1000 confocal laser scanning microscope (Olympus) with excitation at 488 nm and emission at 515 for BODIPY and excitation at 405 nm and emission at 410 nm for DAPI. Chl autofluorescence was captured using excitation at 633 and emission at 700 nm. Images were merged and pseudocolored using Olympus FluoView 1000 confocal microscope software (Olympus).
Transmission Electron Microscopy
For electron microscopy analysis 50 mL of cell cultures were centrifuged (4,000g for 5 min at 22°C) and then fixed in 4% (v/v) glutaraldehyde in 0.1 m sodium cacodylate buffer, pH 7.2, overnight at 4°C. Samples were postfixed with 1% osmium tetroxide in the same buffer for 2 h at room temperature. After dehydration in increasing ethanol concentrations, material was embedded in Araldite-Epon resin mixture (Araldite 502/Embed 812 Kit, Electron Microscopy Sciences). The embedded material was cut into ultra-sections (70 nm) and observed with a JEOL100 CXII transmission electron microscope (Japan Electron Optics Laboratories).
Accession Numbers
N. oceanica CCMP1779 genome data and gene IDs are available at https://www.genome.jgi.doe.gov. For clarity, in the main text and figures, gene IDs in the format NannoCCMP1779|xxxxx have been abbreviated to the short gene name and digits AAAA|xxxxx. Raw RNA-Seq read data have been deposited in NCBI’s Gene Expression Omnibus (Edgar et al., 2002) and are accessible through GEO Series accession number GSE129245.
Supplemental Data
The following supplemental materials are available:
Supplemental Figure S1. Scatterplot comparison of two biological replicates used for RNA-Seq analysis.
Supplemental Figure S2. Comparison of expression profiling of representative DGTT genes in N. oceanica during N deprivation and after NR measured by RNA-Seq (two biological replicates) and RT-qPCR (three biological replicates).
Supplemental Figure S3. Expression of genes involved in DNA replication under N deprivation and after NR.
Supplemental Figure S4. Behavior of photosynthetic pigments and expression of genes involved in their biosynthesis and interactions in N. oceanica under N deprivation and NR conditions.
Supplemental Figure S5. Expression of genes governing the Calvin-Benson cycle and glycolysis during N deprivation and after NR.
Supplemental Figure S6. BiFC analysis of NoLDSP interaction with NoATG8 in planta.
Supplemental Table S1. Primers used in this work.
Supplemental Dataset S1. Values and correlation analysis of log2-fold changes of two biological replicates used for RNA-Seq.
Supplemental Dataset S2. Expression of selected N. oceanica genes under N deprivation and NR represented as heat maps.
LITERATURE CITED
Author notes
This work was supported primarily by the U.S. Department of Energy-Great Lakes Bioenergy Research Center (cooperative agreement DE-FC02-07ER64494 to A.Z. and C.B.) and partially by the Division of Chemical Sciences, Geosciences and Biosciences, Office of Basic Energy Sciences of the U.S. Department of Energy (grant DE-FG02-91ER20021 to C.B., Z.-Y.D., P.H., and F.B.), by the National Science Foundation (grants MCB1714561 to F.B. and IOS-1354721 to E.M.F.), and by Michigan State University AgBioResearch (C.B. and F.B.). Support for research leading to these results was provided by the People Programme (Marie Curie Actions) of the European Union’s Seventh Framework Programme FP7 (Research Executive Agency grant agreement 627266 [AlgaeOilSynth] to K.Z.).
Articles can be viewed without a subscription.
Senior author.
The author responsible for distribution of materials integral to the findings presented in this article in accordance with the policy described in the Instructions for Authors (www.plantphysiol.org) is: Christoph Benning ([email protected]).
A.Z. and C.B. conceived the original research plans; A.Z., K.Z., E.P., J.A.P., Z.-Y.D., G.S., and C.-H.T. performed the experiments and analyzed the data; A.Z., K.Z., and P.H. wrote the article with contributions from all the authors; C.B., I.F., E.M.F., K.L.C., and F.B. supervised and complemented the writing.
