


Abstract
Mitochondria adjust their activities in response to external and internal stimuli to optimize growth via the mitochondrial retrograde response signaling pathway. The Arabidopsis (Arabidopsis thaliana) NAC domain transcription factor ANAC017 has previously been identified as a regulator of the mitochondrial retrograde response. We show here that overexpression of ANAC017 in Arabidopsis leads to growth retardation, altered leaf development with decreased cell size and viability, and early leaf senescence. RNA sequencing analyses revealed that increased ANAC017 expression leads to higher expression of genes related to mitochondrial stress, cell death/autophagy, and leaf senescence under nonlimiting growth conditions as well as extensive repression of chloroplast function. Gene regulatory network analysis indicated that a complex hierarchy of transcription factors exists downstream of ANAC017. These involve a set of up-regulated ANAC and WRKY transcription factors associated with organellar signaling and senescence. The network also includes a number of ethylene- and gibberellic acid-related transcription factors with established functions in stress responses and growth regulation, which down-regulate their target genes. A number of BASIC LEUCINE-ZIPPER MOTIF transcription factors involved in the endoplasmic reticulum unfolded protein response or balancing of energy homeostasis via the SNF1-RELATED PROTEIN KINASE1 were also down-regulated by ANAC017 overexpression. Our results show that the endoplasmic reticulum membrane tethering of the constitutively expressed ANAC017, and its controlled release, are crucial to fine-tune a fast reactive but potentially harmful signaling cascade. Thus, ANAC017 is a master regulator of cellular responses with mitochondria acting as central sensors.
Signaling pathways integrate developmental and environmental processes to control germination, growth, and the transition to flowering that produces the next generation of seeds. Mitochondria and chloroplasts provide the energy and are also the location of biosynthetic pathways that are essential for these processes (Van Dingenen et al., 2016). Anterograde signaling pathways directly affect the expression of nucleus-located genes encoding organellar proteins with concomitant downstream impact on organelle function. Mitochondria and chloroplasts actively feed back their functional status to the nucleus, referred to as retrograde signaling. Retrograde and anterograde signaling pathways are interconnected to optimize organellar functions for whole-plant growth (Chan et al., 2016; de Souza et al., 2017), with plant hormones acting as additional mediators (Berkowitz et al., 2016). Chloroplast retrograde signaling can be divided into biogenic and operational control mechanisms that regulate organelle biogenesis and acclimation to environmental conditions, respectively (Pogson et al., 2008). Chloroplast retrograde regulation also interacts with the phytochrome system to regulate light-induced gene expression (Martín et al., 2016). Signaling components include tetrapyrrole pathway intermediates, metabolites such as 3ʹ-phosphoadenosine 5ʹ-phosphate (PAP), 2-C-methyl-d-erythritol 2,4-cyclodiphosphate (MEcPP), β-cyclocitral, Ca2+, and reactive oxygen species (ROS; Kmiecik et al., 2016; Crawford et al., 2018; Hernández-Verdeja and Strand, 2018). Adverse environmental conditions often lead to the formation of ROS in chloroplasts due to reduced efficiencies in photosynthetic redox processes, which are a starting point for retrograde signaling cascades (Dietz et al., 2016). PAP accumulates under drought and high-light conditions and regulates a large proportion of the high light-responsive transcriptome by inhibiting the activity of several RNA-degrading 5′-3′ exoribonucleases (XRNs; Estavillo et al., 2011). Increased levels of the methylerythritol phosphate pathway intermediate MEcPP under conditions such as wounding, high light, and oxidative stress lead to the induction of a specific set of stress-responsive genes (Xiao et al., 2012). MEcPP also leads to the partial induction of the unfolded protein response (UPR) in the endoplasmic reticulum (ER; Walley et al., 2015) and is connected to auxin signaling (Jiang et al., 2018).
Much less is known about molecules with a similar signaling function for mitochondria. Mitochondrial dysfunction elevates ROS when mitochondrial electron transport is compromised, and ROS-mediated retrograde pathways have been described (Ng et al., 2014; Wang et al., 2018). Ca2+ has recently been proposed as a putative signal analogous to its function in chloroplasts (Wagner et al., 2016). The colocalization of the PAP-degrading enzyme 3′(2′),5′-bisphosphate nucleotidase (SAL1) and the PAPS transporter PAPST2 to chloroplasts and mitochondria, as well as overlapping transcriptomic responses of sal1 mutants with mitochondrial mutants and with plants treated with mitochondrial inhibitors, also suggest a role of PAP in mitochondrial signaling (Estavillo et al., 2011; Ashykhmina et al., 2019). However, direct experimental evidence is missing.
The perception of organellar signals leads ultimately to changes in the expression of nucleus-encoded genes, and hence identification of the corresponding transcription factors (TFs) has given further insight into mechanisms of retrograde signaling. TFs involved in the conversion of chloroplast retrograde signals include PHD-TYPE TRANSCRIPTION FACTOR WITH TRANSMEMBRANE DOMAINS (PTM), ABSCISIC ACID INSENSITVE4 (ABI4), GOLDEN2-LIKE (GLK1 and GLK2), and WHIRLY1 (WHY1; Koussevitzky et al., 2007; Kakizaki et al., 2009; Waters et al., 2009; Sun et al., 2011; Isemer et al., 2012). PTM is localized at the chloroplast envelope and is released from the membrane after proteolytic cleavage triggered by retrograde signals through an unknown mechanism. PTM then translocates to the nucleus, where it activates the expression of TFs, such as ABI4, to regulate further downstream genes (Sun et al., 2011; Isemer et al., 2012), although the central role of PTM for chloroplast signaling has been challenged (Page et al., 2017). Similarly, ABI4 was initially identified by the derepressed expression of photosynthesis genes, of which many also harbor abscisic acid (ABA) response elements in their promoters (Koussevitzky et al., 2007); however, its role in biogenic chloroplast-to-nucleus retrograde signaling has recently been questioned (Kacprzak et al., 2019). GLK1 and GLK2 are also part of a regulatory circuit to adjust the expression of photosynthesis genes to environmental conditions (Waters et al., 2009). WHY1 is important for plastid genome stability and able to move to the nucleus when transgenically expressed in chloroplasts (Grabowski et al., 2008; Isemer et al., 2012). However, it is unclear if this is part of a true retrograde pathway. Several TFs are involved in both mitochondrial and chloroplast retrograde signaling, such as ABI4, WRKY DNA-BINDING PROTEIN40 (WRKY40), and WRKY63, highlighting the integrated nature of these two signaling pathways (Koussevitzky et al., 2007; Giraud et al., 2009; Van Aken et al., 2013). The regulation of ABI4 expression by WRKY18, WRKY40, and WRKY60 provides another level of connecting both organellar functions and potential feedback loops (Shang et al., 2010).
Forward and reverse genetic approaches have identified ER membrane-bound NAC domain-containing TFs in Arabidopsis (Arabidopsis thaliana; ANACs), such as ANAC017 and ANAC013, as playing a key role in executing mitochondrial signals (De Clercq et al., 2013; Ng et al., 2013). Target genes of ANAC017 include other ANAC TFs, such as ANAC013, and a variety of other regulators (Ng et al., 2013). Deletion of the transmembrane domain as a result of a transfer DNA (T-DNA) insertion in the anac017-2/anac017ƊTM line results in a constitutively active ANAC017 protein (ANAC017ƊTM) due to abolished ER tethering that leads to the induction of ALTERNATIVE OXIDASE1A (AOX1A) transcript abundance (Ng et al., 2013). AOX1A is a marker gene of mitochondrial dysfunction and an activated retrograde signaling pathway (Selinski et al., 2018). Knockout mutants of ANAC017 (two ethyl methanesulfonate [EMS]-induced lines, anac017EMS/rao2-1 and rao2-2, as well as the T-DNA insertion line anac017KO) have increased sensitivity to drought stress, while the anac017ƊTM line is similar to the wild type (Ng et al., 2013). Recently, a role of ANAC017 has been proposed in chloroplast retrograde signaling after treatment with the chloroplast stress inducer methyl viologen (MV; Van Aken et al., 2016a). Additionally, mild overexpression of ANAC017 partially rescues growth after chemical inhibition of cellulose synthesis in Arabidopsis via an undefined mechanism driving an alternative growth pathway to increase tolerance to cell wall damage (Hu et al., 2016). Many ANAC TFs are regulators of leaf senescence (Kim et al., 2016), and in a recent study, ANAC017, together with ANAC082 and ANAC090, was identified as a regulator of leaf senescence progression in which a shift from positive to negative regulation occurs (Kim et al., 2018). Combined, these studies suggest a broad role for ANAC017, and consequently mitochondria, in mediating stress and development responses, such as senescence.
Studies on the function of mitochondrial retrograde signaling have largely focused on the analysis of loss-of-function mutants. Here, we show that overexpression of ANAC017 to varying degrees leads to a quantitative reduction in plant growth and development as well as altered leaf shape in conjunction with increased cell death and early senescence. RNA sequencing (RNA-seq) analyses identify an up-regulation of senescence and cell death-related genes upon ANAC017 overexpression, in addition to genes of the mitochondrial dysfunction stimulon (De Clercq et al., 2013) and other stress-related genes. Genes associated with chloroplast function were down-regulated along with the key regulators of the ER UPR. These results show the importance of a fine-tuned retrograde signaling pathway, the extensive transcriptomic reprogramming necessary to cope with its imbalances, and the resulting negative effects for whole-plant growth.
RESULTS
Overexpression of ANAC017 Affects Growth and Development
It was reported previously that ANAC017 is not responsive at the transcript level to mitochondrial perturbation (Ng et al., 2013). We further corroborated this by applying a variety of stress-inducing chemicals to wild-type plants to determine the transcriptional response of ANAC017 by RNA-seq. These chemicals included antimycin A targeting mitochondrial function (Roberts et al., 1980), ABA as an inducer of organellar signaling (Berkowitz et al., 2016), MV and 3-aminotriazole as inducers of oxidative stress through the production of O2 •− and hydrogen peroxide (H2O2; Babbs et al., 1989; Amory et al., 1992), respectively, salicylic acid as an inducer of biotic stress responses (Vlot et al., 2009), and UV light treatment as a stress treatment that causes more general cellular damage (Jenkins, 2009). Several genes encoding related membrane-bound ANAC TFs were responsive to these treatments, ranging from a single treatment (e.g. ANAC040/ANAC069/ANAC089 being responsive to ABA treatment only) to all six treatments, as in the case of ANAC053 (Fig. 1). Contrastingly, induction of ANAC017 was not observed in any treatment, indicating that it is constitutively expressed under a variety of stresses that induced other ER- or membrane-bound ANAC TFs (Fig. 1).
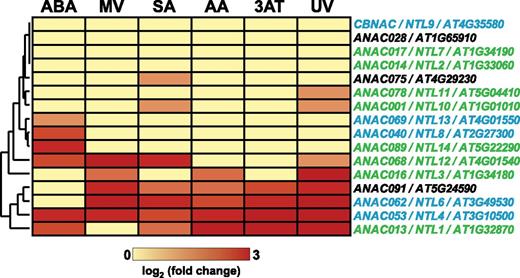
Stress-induced expression of transmembrane domain-containing ANAC TFs. The expression of 16 ANAC TFs with a transmembrane motif (Liang et al., 2015) was quantified by RNA-seq in six stress experiments including treatment by spraying with ABA, MV, salicylic acid (SA), antimycin A (AA), or 3-amino-1,2,4-triazole (3AT) and after exposure to UV light. Four ANACs, including ANAC017, show no transcriptional response to these stress treatments, while all others show induction for at least one of the treatments. Fold change values in gene expression compared with control plants sprayed with water or untreated for UV are indicated in the heat map. ANAC protein localization to the ER membrane is indicated by green letters, while ambiguous localization to the plasma membrane or ER (Liang et al., 2015) is indicated by blue letters and unknown localization by black letters.
Loss-of-function mutants of ANAC017 show no major growth defects under standard growth or stress conditions (De Clercq et al., 2013; Ng et al., 2013; Van Aken et al., 2016a, 2016b). We therefore opted to comprehensively analyze the effects of ANAC017 overexpression. Transgenic lines overexpressing a full-length ANAC017 or an ANAC017 lacking the N-terminal transmembrane domain under the control of the 35S Cauliflower mosaic virus promoter were generated and termed ANAC017OE and ANAC017ƊTMOE (abbreviated OE and ƊTMOE in figures), respectively. Among the obtained lines, varying degrees of growth retardation were evident, with a Mendelian cosegregation of the transgene and this phenotype in the T2 generation.
To elucidate the basis of these size differences, we conducted detailed growth analyses in a 14-h-light/10-h-dark cycle on three representative, homozygous lines overexpressing one of the two ANAC017 forms to varying degrees (i.e. six overexpression lines in total, together with previously described EMS and T-DNA lines; Ng et al., 2013). Expression analyses revealed a negative correlation between transcript abundance and plant size, with the highest overexpressing lines showing the most severe growth retardation (Fig. 2, A and B). ANAC017 expression was only about 2-fold higher than in the wild type in ANAC017OE1 and about 13- and 16-fold higher in ANAC017OE2 and ANAC017OE3, respectively (Fig. 2B). The overexpression of the ƊTM form was 1.5-, 3.6-, and 31-fold higher in the ANAC017ƊTMOE1, ANAC017ƊTMOE2, and ANAC017ƊTMOE3 lines, respectively (Fig. 2B). ANAC017OE2 and ANAC017OE3 showed severe growth retardation throughout their life cycle, while growth of ANAC017OE1 was only slightly impaired (Fig. 2, A and C). Similarly, the line highly overexpressing ANAC017 lacking the transmembrane domain (i.e. ANAC017ƊTMOE3) also showed a severe growth retardation, while ANAC017ƊTMOE1 and ANAC017ƊTMOE2 were affected to lesser degrees according to ANAC017 expression (Fig. 2, A and C). We also compared these growth phenotypes with two previously described loss-of-function anac017 mutant lines (anac017EMS and anac017KO with EMS-induced premature stop codon and a T-DNA insertion, respectively) and the gain-of-function mutant anac017ƊTM (expressing an ANAC017 protein lacking the transmembrane region due to a T-DNA insertion; Ng et al., 2013). No growth retardation was observed for these anac017 mutant lines, and levels of the (nonfunctional) residual transcripts differed by a maximum 2-fold from the wild type (Fig. 2B). Interestingly, the knockout mutant anac017KO had slightly increased rosette size and shoot height compared with the other lines (Fig. 2A).
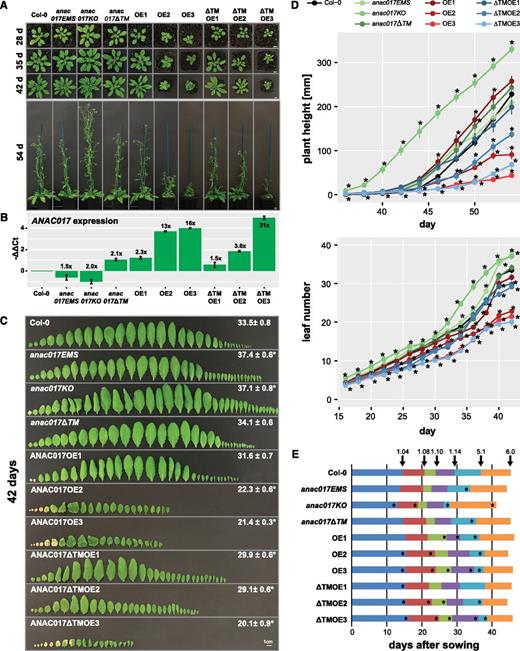
Altering ANAC017 expression levels affects development, with overexpression leading to growth retardation. Phenotypic analysis is shown for ANAC017 overexpression (OE, full-length ANAC017; ƊTMOE, ANAC017 lacking the transmembrane domain) and mutant lines grown on soil in a 14-h-light/10-h-dark cycle. A, At least 17 plants per genotype were used for analysis, and representative images at different time points are shown. Bars = 1 cm. B, Expression levels of ANAC017 determined by reverse transcription quantitative PCR (RT-qPCR) in the different genotypes correlate with their growth. Values shown are means ± se determined for three independents plants, with leaves 5, 6, and 7 pooled for each replicate. C, Leaf numbers and phenotypes for analyzed genotypes. Values give leaf numbers ± se at the time of bolting. Bar = 1 cm. D, Plant height and leaf numbers of analyzed genotypes. Asterisks indicate statistically significant differences from the wild-type Columbia-0 (Col-0). E, Growth stage progression in the 10 analyzed genotypes according to Boyes et al. (2001): 1.04 (four rosette leaves > 1 mm in length), 1.08 (eight rosette leaves > 1 mm in length), 1.10 (10 rosette leaves > 1 mm in length), 5.1 (first flower buds visible), and 6.0 (first flower opened). In all parts except B, the mean ± se of 17 plants is given, and asterisks indicate statistically significant differences (P < 0.05, Student’s t test) from the wild type.
Detailed analysis revealed that ANAC017OE2, ANAC017OE3, and ANAC017ƊTMOE3 had 40% reduction in leaf number (Fig. 2D), which decreased the dry weight in these lines to 62%, 63%, and 55% of the wild-type level, respectively. The inflorescence height was also much reduced in ANAC017OE2, ANAC017OE3, ANAC017ƊTMOE2, and ANAC017ƊTMOE3. The former two also had a more bushy growth phenotype, which might point to a loss of apical dominance. In addition, a more rounded, curled leaf shape with increased serration was visible in the high-overexpressing lines ANAC017OE2, ANAC017OE3, and ANAC017ƊTMOE3 (Fig. 2C), which is a similar phenotype to that found for the ANAC017-related ANAC053 (Lee et al., 2012). The developmental growth stages (Boyes et al., 2001), with four (stage 1.04), eight (1.08), 10 (1.10), and 14 (1.14) rosette leaves, were reached later in the overexpression lines, while the appearance of first flower buds (5.1) and first flower open (6.0) were earlier, which, together with the reduced leaf number, indicated an early-flowering phenotype (Fig. 2, D and E). The opposite was observed with two of the loss-of-function lines, anac017EMS and anac017KO, for which all the development stages were observed significantly (P < 0.05) earlier than in the wild type (Fig. 2, D and E). Likewise, these two lines had slightly but significantly (P < 0.05) more leaves than the wild type, and anac017KO also had an increased inflorescence height (Fig. 2, A and D).
We also observed early-occurring leaf senescence in the oldest leaves of the ANAC017OE and ANAC017ƊTMOE lines (Fig. 2C), which was correlated with the ANAC017 overexpression levels when grown under long-day conditions (14 h of light/10 h of dark). This is in agreement with a recent report showing ANAC017 as a regulator of senescence together with ANAC82 and ANAC90 (Kim et al., 2018), similar to several other ANACs, such as ANAC042, ANAC087, and ANAC092 (Matallana-Ramirez et al., 2013; Oda-Yamamizo et al., 2016; Huysmans et al., 2018). Chlorophyll concentration started to decline in ANAC017OE2, ANAC017OE3, and ANAC017ƊTMOE3 much earlier than in the other genotypes already after 5 weeks, indicating a faster chlorophyll breakdown with leaf aging. In these lines, the chlorophyll concentrations were reduced to half of the concentrations in the wild type and the low-overexpressing lines at 8 weeks (Fig. 3). Accordingly, the maximum quantum yield also decreased in those lines (Fig. 3).
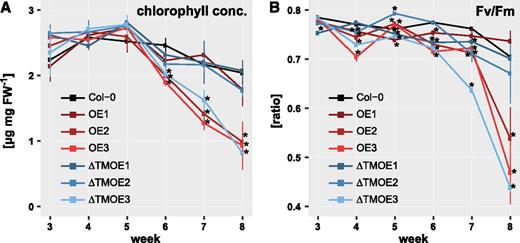
Chlorophyll concentrations and maximum quantum yield (Fv/Fm) of ANAC017 overexpression lines. Total chlorophyll concentrations (A) and maximum quantum yield (B) are shown for ANAC017 overexpression lines (OE, full-length ANAC017; ƊTMOE, ANAC017 lacking the transmembrane domain) and the wild type (Col-0). Leaves 5, 6, and 7 of each plant were harvested and pooled for chlorophyll measurement. Asterisks indicate statistically significant differences (P < 0.05, Student’s t test) from the wild type. Values given are means ± se of five plants. FW, Fresh weight.
We next assessed epidermal cell size, density, and the viability of leaf cells to investigate the underlying cellular basis of the observed differences in growth and development. While the general epidermal cell shape of ANAC017 overexpression lines was not visibly altered (Fig. 4A), the cells were smaller than those of the wild type, which negatively correlated with ANAC017 expression and corresponded with the smaller leaf size (Fig. 4B). This resulted in an up to 2-fold higher cell density compared with the wild type in the highest overexpression line ANAC017ƊTMOE3 (Fig. 4B). Even in the ANAC017OE1 line, it was apparent that cells were slightly smaller, with ∼10% higher cell density compared with the wild type. However, these changes did not alter the stomatal indices across the lines (Fig. 4B). Trypan Blue staining of leaves from all lines showed a higher intensity in the overexpression lines, and further quantification revealed a significantly increased staining intensity, which led to approximately 50% to 60% of the wild-type cell viability in ANAC017OE3 and ANAC017ƊTMOE3 (Fig. 4, C and D), indicating increased cell death as a cause of reduced leaf size.
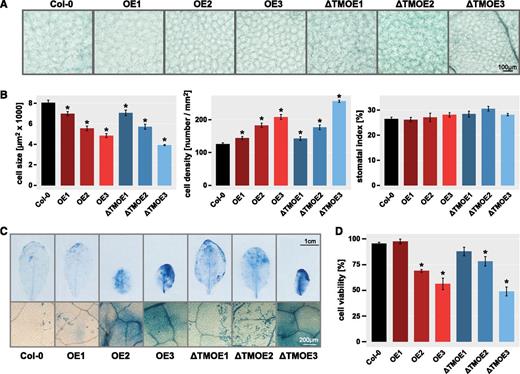
Altering ANAC017 expression levels affects epidermal cell size and cell viability. A, Representative microscopy images of leaf epidermal cells from 6-week-old plants of ANAC017 overexpression lines (OE, full-length ANAC017; ƊTMOE, ANAC017 lacking the transmembrane domain) and the wild type (Col-0). Bar = 100 µm. B, The epidermal cell size, epidermal cell density, and stomatal index were quantified from microscopy images as shown in A. Asterisks indicate statistically significant differences from the wild-type Col-0. C, The rosette leaves of 6-week-old plants stained with Trypan Blue for cell viability. Bars = 1 cm (top) and 200 µm (bottom). D, Cell viability was quantified by determining staining intensity as an indicator of cell death across the whole leaf area using ImageJ software (https://imagej.nih.gov/ij/). For all parameters, leaves 5, 6, and 7 from at least three plants for each genotype were analyzed, and means ± se are shown. Asterisks indicate statistically significant differences from the wild-type Col-0 (P < 0.05, Student’s t test).
Taken together, these results demonstrate that changing the constitutive expression of ANAC017 altered plant growth and development, with overexpression resulting in a severe reduction in leaf growth and number. This is caused by reduced cell expansion and viability leading to cell death and early senescence, as observed in leaves of the overexpressing ANAC017OE2, ANAC017OE3, and ANAC017ƊTMOE3 lines.
ANAC017 Overexpression Leads to Transcriptomic Reprogramming
We performed RNA-seq analysis to reveal differences between the transcriptomes of the analyzed genotypes, especially those leading to the observed growth retardation of ANAC017-overexpressing lines. Corresponding with their more severe phenotype and the ANAC017 overexpression levels, the largest transcriptomic response occurred in ANAC017ƊTMOE3, with 6,576 differentially expressed genes (DEGs; log2 [fold change] > 1, false discovery rate [FDR] < 0.05) when compared with the wild type (Col-0), followed by ANAC017OE3 with 3,350 DEGs and ANAC017OE2 with 2,275 DEGs (Fig. 5A). The smallest response was observed for ANAC017OE1 and ANAC017ƊTMOE1, with only 22 and 54 DEGs, respectively (Supplemental Table S1), and these lines were thus excluded from further detailed analyses. There were 812 DEGs for the gain-of-function line anac017ƊTM, 256 for the mutant line anac017EMS, and 537 for the mutant line anac017KO (Fig. 5A).
![RNA-seq analysis shows that ANAC017 overexpression significantly alters the transcriptome. ANAC017 overexpression (OE, full-length ANAC017; ƊTMOE, ANAC017 lacking the transmembrane domain) and mutant lines (anac017EMS, anac017KO, and anac017ƊTM) were analyzed for DEGs (log2 [fold change] > 1, FDR < 0.05) by comparing with the wild type (Col-0) using RNA-seq. A, The number of DEGs and their overlaps across genotypes are shown using an UpSet plot representation (Conway et al., 2017). The bar chart at top gives the number of DEGs in each genotype, with ANAC017ƊTMOE3 having the highest number with 6,576 DEGs and anac017EMS having the lowest number with 256 DEGs. The number of DEGs overlapping across genotypes is represented by the bar chart at bottom right, with the dot matrix at bottom left indicating the respective overlaps by connected black circles. For example, ANAC017ƊTMOE3 had the highest number of specific genes (3,399 DEGs), while 909 DEGs were shared between ANAC017OE3, ANAC017OE2, and ANAC017ƊTMOE3. A total of 2,336 DEGs were shared between at least one ANAC017OE line and one ANAC017ƊTMOE line. Shown are only overlaps with more than 100 DEGs. B, Heat map for DEGs after hierarchical clustering using the Ward method. This identified four clusters of DEGs as indicated. C, GO term enrichment analysis for the four DEG clusters identified in B. While up-regulated genes in clusters 1 and 2 were related to processes including (r)RNA processing (purple text), mitochondrial functions (orange text), and senescence (magenta text), the down-regulated genes in clusters 3 and 4 were largely associated with chloroplast functions (green text). The color scale indicates –log10 (P values) for enrichment after Bonferroni correction.](https://oup.silverchair-cdn.com/oup/backfile/Content_public/Journal/plphys/180/1/10.1104_pp.18.01603/2/m_plphys_v180_1_634_f5.jpeg?Expires=1750297388&Signature=lwAxlRu5TgR9CPLXzftOIif-cc2NQL25nezrNVHp~GYZrlro1ChHbtilZIm5Kx9TL7ar~e1q~N2eLdmItcFexUeiETJR9vb-u1cGHmwBcUe~oMdtmLPRZyLAwCFqALZny4pHp7nfWuthI4DrfrigllAls8U6jl4QRugZtJ9nDBOlJGKTmTAKTYO4pOeIhcA50mryZYOcUqsTie4GvHLV9GRrZyR1-CMmlTOtkql9eMW~N6fqD8G1trJkJ~ytbYom02StRBUA-Hmsh7dfnzkhfvxy78Aute6vIEr6270-bSE-bhgjsaH3y3Tzw01jbGdpTN9iyTTVXNUoJlXmvPRuJA__&Key-Pair-Id=APKAIE5G5CRDK6RD3PGA)
RNA-seq analysis shows that ANAC017 overexpression significantly alters the transcriptome. ANAC017 overexpression (OE, full-length ANAC017; ƊTMOE, ANAC017 lacking the transmembrane domain) and mutant lines (anac017EMS, anac017KO, and anac017ƊTM) were analyzed for DEGs (log2 [fold change] > 1, FDR < 0.05) by comparing with the wild type (Col-0) using RNA-seq. A, The number of DEGs and their overlaps across genotypes are shown using an UpSet plot representation (Conway et al., 2017). The bar chart at top gives the number of DEGs in each genotype, with ANAC017ƊTMOE3 having the highest number with 6,576 DEGs and anac017EMS having the lowest number with 256 DEGs. The number of DEGs overlapping across genotypes is represented by the bar chart at bottom right, with the dot matrix at bottom left indicating the respective overlaps by connected black circles. For example, ANAC017ƊTMOE3 had the highest number of specific genes (3,399 DEGs), while 909 DEGs were shared between ANAC017OE3, ANAC017OE2, and ANAC017ƊTMOE3. A total of 2,336 DEGs were shared between at least one ANAC017OE line and one ANAC017ƊTMOE line. Shown are only overlaps with more than 100 DEGs. B, Heat map for DEGs after hierarchical clustering using the Ward method. This identified four clusters of DEGs as indicated. C, GO term enrichment analysis for the four DEG clusters identified in B. While up-regulated genes in clusters 1 and 2 were related to processes including (r)RNA processing (purple text), mitochondrial functions (orange text), and senescence (magenta text), the down-regulated genes in clusters 3 and 4 were largely associated with chloroplast functions (green text). The color scale indicates –log10 (P values) for enrichment after Bonferroni correction.
Intersecting the lists of DEGs showed that ANAC017ƊTMOE3 had the highest number of specific genes (3,399 DEGs), in agreement with its highest ANAC017 expression level (Fig. 5A). A large number of DEGs were shared in at least two overexpressing lines with a total of 2,336 DEGs, while the overlap with any of the anac017 mutant lines was minimal (Fig. 5A). Hierarchical clustering of DEGs identified four major gene clusters, dividing the up- and down-regulated genes into two clusters each (Fig. 5B). For the up-regulated DEGs in cluster 1, a Gene Ontology (GO) term enrichment analysis identified that the corresponding genes were involved in processes relating to mitochondrial functions (transport, RNA), ribosome biogenesis, and cell proliferation, while genes in cluster 2 were enriched for GO terms associated with senescence and cell death (Fig. 5C; Supplemental Table S2). The down-regulated genes in clusters 3 and 4 were largely related to processes involving chloroplast function, with enriched GO terms such as chloroplast/plastid organization, photosynthesis, and carbon fixation (Fig. 5C; Supplemental Table S2). These GO terms are in agreement with the observed earlier senescence and reduced cell viability of the overexpression lines.
Corresponding with this GO term enrichment, a closer investigation of these DEG lists revealed that a large proportion of these genes encode mitochondrial or chloroplast proteins (Supplemental Fig. S1; Supplemental Tables S3 and S4). Among the approximately 450 DEGs in the ANAC017 overexpression lines encoding mitochondrial proteins were genes such as AOX1A, AOX1B, AOX1D, UP-REGULATED BY OXIDATIVE STRESS (UPOX), OUTER MITOCHONDRIAL MEMBRANE PROTEIN OF 66 KDA (OM66), NAD(P)H DEHYDROGENASE B4 (NDB2), NDB3, TRANSLOCASE INNER MEMBRANE SUBUNIT17-1 (TIM17-1), and ALTERNATIVE NAD(P)H DEHYDROGENASE1 (NDA1), with increases of 10- to 100-fold (Supplemental Table S3). These genes are important in the response to mitochondrial dysfunction, with AOX1A, for example, a direct target of ANAC017 (Ng et al., 2013). Another ∼70 mitochondrial protein-encoding genes were down-regulated in these lines (Supplemental Fig. S1A; Supplemental Table S3), but to a lesser degree and mostly below 2-fold. One of these genes encodes a SERINE HYDROXYMETHYLTRANSFERASE involved in photorespiration and down-regulated 5-fold in ANAC017ƊTMOE3 and 2-fold in ANAC017OE3.
In the subset of 1,166 DEGs encoding plastid proteins, 72% of these (846 DEGs) were down-regulated in ANAC017ƊTMOE3 (Supplemental Fig. S1B; Supplemental Table S4), corresponding with the enrichment of GO terms relating to central chloroplastic functions in the full DEG list (Fig. 5). Many of the associated genes encode components involved in photosynthesis, including several LIGHT HARVESTING CHLOROPHYLL A/B BINDING PROTEIN (LHCB) isogenes (e.g. LHCB2.3, LHCB1.4, LHCB2.1, LHCB3.1, LHCB1.5, and LHCB4.3) and also a starch degradation-related BETA AMYLASE6. FERRIC REDUCTION OXIDASE7, important for chloroplastic iron acquisition and photosynthetic efficiency (Jeong et al., 2008) , was down-regulated by 2- to 5-fold in the ANAC017-overexpressing lines. Another group of genes encodes proteins involved in the protection of the chloroplast membrane from stress, such as COLD-REGULATED15A (COR15A), COR15B, COR78, and COR413 THYLAKOID MEMBRANE1 (COR413-TM1), all showing an at least 4-fold down-regulation in the overexpression lines when compared with the wild type. Among the at least 4-fold up-regulated genes were TRANSLOCON AT THE INNER ENVELOPE MEMBRANE OF CHLOROPLASTS20-IV (TIC20-IV), NADP MALIC ENZYME3, FERREDOXIN3, and a gene encoding BRANCHING ENZYME1 with importance for carbohydrate metabolism (Wang et al., 2010). AUTOPHAGY8E (ATG8E), a component of the autophagy pathway and involved in plastid degradation during senescence (Michaeli et al., 2014), was also among the up-regulated genes in ANAC017ƊTMOE3.
Together, these data indicate a contrasting up-regulation of genes encoding mitochondrial proteins related to the mitigation of mitochondrial dysfunction and down-regulation of important chloroplastic functions, suggesting an antagonistic regulation of these two organelles due to overexpression of ANAC017. The observed differential expression of genes related to chlorophyll degradation, autophagy, and senescence prompted a closer inspection of the genes associated with these processes.
Overexpression of ANAC017 Leads to Misexpression of Genes Involved in Mitochondrial Stress, Senescence, Autophagy, and Cell Death
The up-regulation of the chloroplast-associated ATG8E together with the observed increased cell death in ANAC017 overexpression lines (Fig. 4, C and D) led us to investigate the expression of mitochondrial stress-, senescence-, autophagy-, and cell death-related genes across overexpression lines. The expression of 24 genes characterized as the mitochondrial dysfunction stimulon (De Clercq et al., 2013) was highly up-regulated (Fig. 6A; Supplemental Table S5), indicating the induction of the mitochondrial stress response upon ANAC017 overexpression. For 3,580 genes annotated as associated with senescence in the Leaf Senescence Database (LSD 2.0; Li et al., 2014) and quantifiable in our RNA-seq data, 74% were most highly expressed in ANAC017ƊTMOE3 under standard growth conditions (Fig. 6B; Supplemental Table S6). Similarly, the key components of autophagy, such as the ATG (iso)genes ATG1 to ATG18 as well as VACUOLAR PROTEIN SORTING15 (VPS15) and VPS34, showed highest expression in ANAC017ƊTMOE3 and generally lowest expression in the wild type (Fig. 6B; Supplemental Table S7). In addition, most genes annotated with GO terms relating to cell death (TAIR10) were also expressed at the highest level in ANAC017ƊTMOE3 and lowest in the wild type, with the other overexpression lines in between (Fig. 6B; Supplemental Table S8).
![Increased expression of genes associated with mitochondrial stress, autophagy, senescence, and cell death in ANAC017 overexpression lines. A, Expression of genes sharing a common cis-element for transcriptional response to mitochondrial stress (mitochondrial dysfunction stimulon; De Clercq et al., 2013) in ANAC017 overexpression lines (OE, full-length ANAC017; ƊTMOE, ANAC017 lacking the transmembrane domain) and the wild type. Expression is given as log2(TPM+1), where TPM represents transcripts per million. B, Expression of 3,580 genes annotated in the Leaf Senescence Database (LSD 2.0 [http://psd.cbi.pku.edu.cn/]; Supplemental Table S6), autophagy-related marker genes (Supplemental Table S7), and genes with a GO term annotation (TAIR10) related to cell death (Supplemental Table S8) in the indicated genotypes. Expression is given as z-scores of transcripts per million.](https://oup.silverchair-cdn.com/oup/backfile/Content_public/Journal/plphys/180/1/10.1104_pp.18.01603/2/m_plphys_v180_1_634_f6.jpeg?Expires=1750297388&Signature=ZtMDJfYDn0P17WyMYMjGEu0yAyJaC6aWPpBWh1QP36o~xnspCS~ThSNenaHk-IGoozDt4IU7~Ys3cUw2p9f~GaULM-Uxuj-ab1H7Vi-d~xcDKAHTOWh4c9HgqBUIxV5Gl0MWysJI2TWonxwHz7BcWjWw7yT9crkECepJ7iwtOXDIlz-TfubOtbkozi96eXrRe~LgQh78NTC~t1-Gjdhh6VqfSp4OsSk8R1ia9baMlfq3geRZ84jddPeXI8-4fHOXoUOF7A7xuGLxOHbePtGE~Bu6iAejrYb-t3NoF97I4Q-5VjjbGzvxU1GQSwlC6qhwE9Or37d6-ptGrLI9naWvtA__&Key-Pair-Id=APKAIE5G5CRDK6RD3PGA)
Increased expression of genes associated with mitochondrial stress, autophagy, senescence, and cell death in ANAC017 overexpression lines. A, Expression of genes sharing a common cis-element for transcriptional response to mitochondrial stress (mitochondrial dysfunction stimulon; De Clercq et al., 2013) in ANAC017 overexpression lines (OE, full-length ANAC017; ƊTMOE, ANAC017 lacking the transmembrane domain) and the wild type. Expression is given as log2(TPM+1), where TPM represents transcripts per million. B, Expression of 3,580 genes annotated in the Leaf Senescence Database (LSD 2.0 [http://psd.cbi.pku.edu.cn/]; Supplemental Table S6), autophagy-related marker genes (Supplemental Table S7), and genes with a GO term annotation (TAIR10) related to cell death (Supplemental Table S8) in the indicated genotypes. Expression is given as z-scores of transcripts per million.
From these results, we conclude that overexpression of ANAC017 leads to the up-regulation of genes, including known marker genes, involved in the mitochondrial stress response, senescence, autophagy, and cell death under standard growth conditions. This corresponds with the increased cell death and early-senescence phenotype observed.
ANAC017 Overexpression Leads to Altered Expression of TFs
Analysis of the expression of all ANAC TFs in the ANAC017 overexpression lines showed a substantial up-regulation of several family members (Fig. 7; Supplemental Table S9). Out of the 31 ANACs robustly quantifiable by the RNA-seq data, 18 showed a more than 10-fold increased expression in ANAC017ƊTMOE3 when compared with the wild type. ANAC013 and ANAC016, both functionally homologous to ANAC017 (De Clercq et al., 2013), were induced by 16- and 44-fold, respectively, while ANAC042, ANAC044, ANAC085, and ANAC087 showed the highest up-regulation above 50-fold (Fig. 7). The positive regulators of leaf senescence, ANAC016, ANAC029, ANAC046, ANAC059, ANAC087, and ANAC092, were up-regulated by 44-, 3-, 8-, 5-, 136-, and 23-fold, while the negative regulators, ANAC042 and ANAC055, were up-regulated 57- and 40-fold, respectively (Fig. 7). ANACs previously identified as having an ANAC017-dependent response to H2O2 and antimycin A in the anac017KO mutant (Ng et al., 2013), such as ANAC003, ANAC004, ANAC019, ANAC042, ANAC046, ANAC055, and ANAC087, were also up-regulated in the ANAC017 overexpression lines. These expression patterns provide evidence that ANAC017 is a major part of the transcriptional cascade and either directly or indirectly regulates the expression of other ANAC TFs.
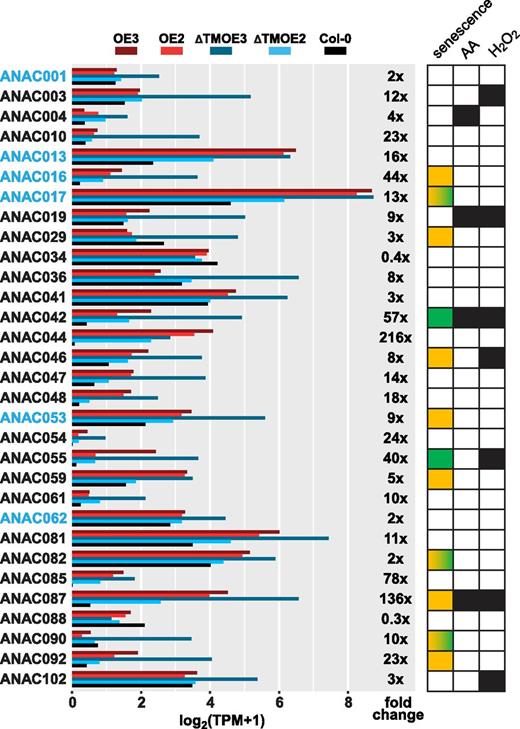
Expression levels of ANAC TFs in ANAC017-overexpressing plants. Transcript levels of ANAC TFs are shown with membrane- or ER-localized ANACs highlighted in blue. Expression is given as log2(TPM+1), where TPM represents transcripts per million, with fold change of ANAC017ƊTMOE3 relative to the wild type also given (Supplemental Table S9). At right, positive and negative regulators of leaf senescence (Kim et al., 2016) are indicated as orange and green squares, respectively. Three ANACs with a developmental stage-dependent role in positive and negative promotion of senescence (ANAC017, ANAC082, and ANAC090; Kim et al., 2018) are represented by squares with yellow-green gradients. ANACs directly regulated by ANAC017 under antimycin A (AA) or H2O2 treatment, as reported previously (Ng et al., 2013), are also indicated by black squares.
We further analyzed all TFs that changed expression in the ANAC017 lines relative to the wild type to understand why overexpression of ANAC017 had such a profound effect on the transcriptome (Fig. 8A; Supplemental Table S10). In agreement with the observed early senescence of older leaves in ANAC017 overexpression lines (Fig. 2C), GO term enrichment analysis for the up-regulated TFs identified a number of TFs (e.g. ANAC003/016/029/042/046/053/055/081/092, ORE15, and WRKY8/30/51/53) associated with leaf senescence (Fig. 8B). ANAC016 and ANAC053 are close functional homologs of ANAC017, also having a transmembrane domain and binding to similar DNA motifs, with ANAC016 activating chlorophyll breakdown (Sakuraba et al., 2016) and ANAC053 inducing drought-induced senescence through ROS accumulation (Lee et al., 2012). ANAC029/NAP and ANAC046 also promote chlorophyll degradation via ABA signaling (Yang et al., 2014a). The TFs ANAC029, ANAC055, and ANAC092 are directly regulated through the ethylene pathway by induction by ETHYLENE INSENSITIVE3 (EIN3), with EIN3 a direct target of the senescence regulator EIN2 (Kim et al., 2014; Gao et al., 2016; Oda-Yamamizo et al., 2016). The up-regulated ANAC042 is an H2O2-induced TF regulating longevity (Wu et al., 2012), represses PHYTOCHROME-INTERACTING FACTOR4 (PIF4; down-regulated in ANAC017ƊTMOE3), and restricts growth through GA/brassinosteroid-dependent signaling (Shahnejat-Bushehri et al., 2016). ANAC017 itself, together with ANAC055, ANAC092, WRKY8, and WRKY30, were also included in the enriched GO term response to H2O2 (Fig. 8B). A number of TFs were also associated with GO terms related to ethylene and jasmonic acid, both important hormones in the regulation of leaf senescence (Jibran et al., 2013), including several ETHYLENE RESPONSE FACTORS (ERF1/ERF2/ERF6/ERF11/ERF12/ERF59/ERF104) and WRKYs (WRKY46/WRKY50/WRKY51/WRKY53; Fig. 8B).
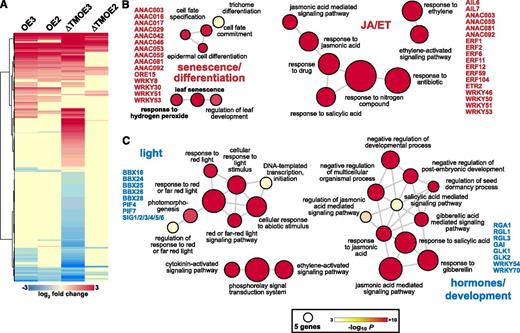
Differentially expressed TFs in ANAC017 overexpression lines are related to senescence, hormone, and light signaling. A, Heat map representing the 576 TFs differentially expressed in ANAC017-overexpressing lines after hierarchical clustering. B and C, GO term enrichment analysis for up-regulated (B) and down-regulated (C) TFs. The size of the circles reflects the number of genes in each GO term, and the fill color reflects the corresponding P value for enrichment after Bonferroni correction. ET, Ethylene; JA, jasmonic acid.
For the down-regulated TFs, a substantial number were associated with GO terms related to light responses (Fig. 8C). This included several members of the B BOX DOMAIN/CONSTANS-LIKE PROTEINS family, which are regulators of photomorphogenesis (Gangappa and Botto, 2014). PIF4 and PIF7 are also involved in the light regulation of growth, with PIF4 as a regulator of senescence via induction of ANAC092 (Sakuraba et al., 2014). The lower expression of all six plastid RNA POLYMERASE SIGMA FACTORS in the ANAC017 overexpression lines also indicates the general reduction in chloroplast functions. In conjunction, the two central regulators of chloroplast retrograde signaling, GLK1 and GLK2 (Waters et al., 2009), are linked to an enriched set of development- and hormone-related GO terms and are down-regulated by 2- to 4-fold in the ANAC017OE3 and ANAC017ƊTMOE3 lines. GA responses were also enriched GO terms and included four out of the five DELLA TFs in the Arabidopsis genome, REPRESSOR OF GA1 (RGA1) and RGA-Like1 (RGL1), RGL2, and RGL3, the key negative regulators of GA signaling (Ueguchi-Tanaka et al., 2007). In addition, the GLABROUS INFLORESCENCE STEMS (GIS) gene was also down-regulated in ANAC017ƊTMOE3 (Supplemental Table S10). GIS is a modulator of GA-dependent epidermal differentiation and shoot maturation and regulates phase transition (Gan et al., 2006). The two WRKY factors WRKY54 and WRKY70 are two negative regulators of leaf senescence and are also included in the enriched GO terms of down-regulated genes. Both are part of an integrated network of WRKY TFs, including the up-regulated WRKY30 and WRKY53, for the induction and progression of leaf senescence (Besseau et al., 2012). The latter is involved in a complex regulatory interaction with the also up-regulated WRKY18, which is a negative regulator of leaf senescence (Potschin et al., 2014).
The TF BASIC REGION/LEUCINE ZIPPER MOTIF60 (bZIP60) was 4- to 8-fold up-regulated in the ANAC017 overexpression lines (Supplemental Table S10). bZIP60 is the master regulator of the ER UPR (Iwata et al., 2008), with two of its target genes, BINDING PROTEIN1 (BiP1) and BiP2, also up-regulated by 2- to 5-fold across the overexpression lines. In addition, another bZIP TF regulating the ER stress response, bZIP17 (Liu et al., 2007), was up-regulated by 2-fold in the highest overexpression line only. It is tempting to speculate that the up-regulation of several ER membrane-tethered ANACs (i.e. ANAC017, ANAC013, and ANAC053) in the ANAC017 overexpression lines leads to the activation of the UPR via increased expression of bZIP60 and bZIP17.
Together, these data show that the up-regulation of ANAC017 results in the misregulation of key regulators and related hormonal pathways, including ethylene, jasmonic acid, and GA, leading to the observed retarded growth phenotype and early senescence of ANAC017-overexpressing lines. Furthermore, there is an up-regulation of a variety of stress response factors, including those of the ER UPR.
A Gene Regulatory Network for ANAC017 Overexpression-Dependent DEGs
Our next objective was to determine the interactions between DEGs in ANAC017-overexpressing lines and their regulatory TFs and their relation to the phenotypic changes. We consequently generated a gene regulatory network (GRN) for the 2,336 DEGs overlapping in at least two of the ANAC017-overexpressing lines (Fig. 5) using TF2Network. This tool integrates experimentally defined TF-binding sites in promoters of genes as well as the occurrence of these TF-binding sites in other gene promoters, together with robust enrichment statistics to define the GRN (Kulkarni et al., 2018). A semihierarchical radial layout algorithm was applied to visualize the obtained network consisting of 2,819 nodes and 22,584 edges (Fig. 9A; Supplemental Tables S11 and S12). This radial GRN layout, which generates a tree-like hierarchical structure, was overall dividing genes in up- and down-regulated DEGs, with genes placed on concentric circles according to their interconnectivity with other genes. ANAC017, together with ANAC013 and ANAC016, was placed on one of the intermediary circles of the network, due to its connections with genes on the outermost and central circles (Fig. 9A). The ANAC017 binding site is present exclusively in 343 up-regulated DEGs, conforming with it being generally considered a transcriptional activator (De Clercq et al., 2013; Ng et al., 2013). The GRN included another 95 TFs with putative binding sites in DEG promoters (termed regulators), with 32 of these regulators differentially expressed in ANAC017 overexpression lines themselves. A further 214 TFs included in the list of DEGs were part of the GRN, with 34 having ANAC017-binding sites and putative downstream targets of the regulators.
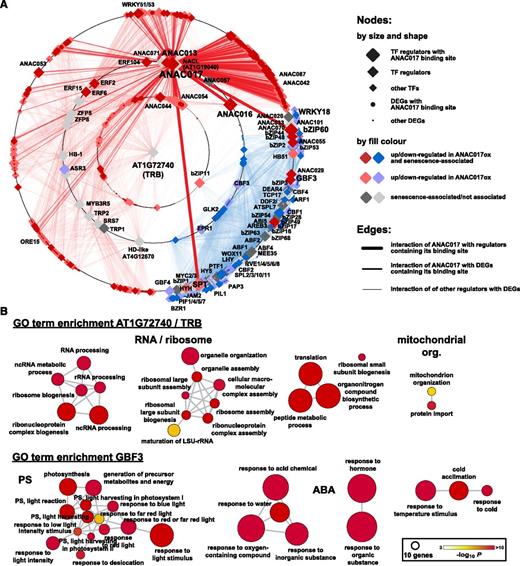
A GRN for DEGs in ANAC017 overexpression lines. A GRN was generated using the 2,336 DEGs shared in at least two overexpression lines (Fig. 5) as input for the TF2Network tool (Kulkarni et al., 2018). A, The radial layout reduces the GRN (Supplemental Tables S11 and S12) to a tree-like structure with a root node in the center and child nodes of the tree structure placed on the concentric circles depending on their shared interconnections. ANAC017 is located on an intermediary circle, indicating interactions with different hierarchical levels. It has a high number of connections with a cluster of senescence-related DEGs (dark red color), which includes ANAC042 and ANAC087. The single myb histone/telomere repeat-binding (TRB) protein AT1G72740 was identified as the root node with the highest number of interactions with 430 up-regulated genes, while GBF3 had the highest number (530) of edge connections with down-regulated genes. The different shapes of nodes indicate the different functions of genes in the GRN. TFs are indicated as diamonds, with decreasing sizes for GRN regulators having ANAC017-binding sites, other GRN regulators, and other differentially expressed TFs, respectively. DEGs with ANAC017-binding sites and other DEGs are represented by large and small dots, respectively. Colors indicate differential expression in the ANAC017 overexpression lines (red, up-regulated; blue, down-regulated; gray, no change), and their shading indicates if genes have been attributed with a function in senescence (dark, senescence associated; light, no senescence association). For edges, the stroke weight indicates interactions of ANAC017 with GRN regulators containing its binding site (thick), with DEGs containing its binding site (medium), and the interactions of other GRN regulators with DEGs (thin). The color of the edges indicates interaction with up- or down-regulated genes (red and blue, respectively). B, Analysis of AT1G72740 target genes identifies enriched GO terms (P < 0.001 after Bonferroni correction) related to organelle/mitochondrial organization, RNA/ribosome processing, and translation, indicating a role in the regulation of growth involving organellar function. For GBF3, the GO term enrichment analysis identified GO terms related to photosynthesis (PS) and ABA signaling.
Two out of the three up-regulated regulators with ANAC017-binding sites in their promoters, SPATULA (SPT) and bZIP60, were located within the network area containing the majority of down-regulated genes (Fig. 9A). SPT has binding sites in 160 down-regulated genes, and overexpression leads to reduced leaf sizes as a result of a decrease in cell sizes (Ichihashi et al., 2010). Thus, the observed reduced cell size upon ANAC017 overexpression (Fig. 4) might be caused by the up-regulation of SPT after direct activation by ANAC017. SPT protein levels are also regulated by DELLA proteins (Josse et al., 2011), and the down-regulation of the four DELLA genes RGA1, RGL1, RGL2, and RGL3 in ANAC017 overexpression lines (see above) might provide an additional level of hormonal control via GA. The gene encoding the regulator bZIP60 showed increased expression in ANAC017-overexpressing lines and has binding sites in 148 down-regulated genes of the GRN, likely to coordinate the ER UPR, which included FERRIC REDUCTION OXIDASE2 (FRO2) and FRO6. This hints, in conjunction with the up-regulation of chloroplastic FRO7 (see above), toward impaired plastidial iron homeostasis as a cause for the down-regulation of chloroplast functions.
Apart from bZIP60, another 14 genes encoding bZIP TFs were among the regulators in the down-regulated gene cluster of the GRN, making this TF family the most prominent among the GRN regulators (Fig. 9A; Supplemental Table S12). The bZIPs bZIP1/bZIP2/bZIP11/bZIP44/bZIP53/bZIP63 belong to the C/S1 dimerization network consisting of a total of nine bZIPs. Their main function is the reprogramming of metabolism under low energy supply and the fine-tuning of carbon and nitrogen metabolism to balance plant growth (Dröge-Laser and Weiste, 2018). Three regulator bZIPs, bZIP17, bZIP28, and bZIP49, also have a role in the activation of the ER stress response, with the bZIP60 interactors bZIP17 and bZIP28 both located at the ER membrane and translocating to the nucleus after proteolytic release, similar to ANAC017. Overexpression of bZIP17 and bZIP28 also leads to plant growth retardation, as observed for ANAC017 overexpression lines (Liu et al., 2007).
The regulator AT1G72740 was placed in the center of the GRN, although its gene was not differentially expressed upon ANAC017 overexpression (Fig. 9A; Supplemental Table S12). The protein belongs to the single myb histone/TRB protein family. Although there is little known about this particular protein, members of this family have initially been identified by their interaction with telomeric sites. Because they also bind to several thousand genes, it was suggested that TRBs are assisting in gene regulation by displacing nucleosomes to allow subsequent binding of more specific TFs (Zhou et al., 2016). Among all GRN regulators, AT1G72740 had the second most interactions and exclusively with up-regulated DEGs (Fig. 9A), suggesting that it has a similar role in making this subset of ANAC017 overexpression-dependent DEGs accessible for TFs. GO term enrichment analysis of these DEGs suggested that AT1G72740 is associated with organellar, specifically mitochondrial (associated genes include several TIM and TRANSLOCASE OF THE OUTER MEMBRANE components; Supplemental Table S12), organization, RNA processing, and translation (Fig. 9B). This indicates that this gene is controlling growth-related processes connected with mitochondrial function, as observed in the ANAC017 overexpression lines, and hence its central position in the ANAC017 overexpression-dependent GRN. The regulator with the highest number of targets (530 DEGs) was the up-regulated bZIP G-box-binding protein G-BOX BINDING FACTOR3 (GBF3), with interconnections to 527 down-regulated and three up-regulated genes, in ANAC017 overexpression lines (Fig. 9A; Supplemental Table S12). GBF3 is one of the five members (GBF1/GFB2/GFB3, bZIP16, and bZIP68) of the group G bZIPs, all of which were regulators in the GRN (Supplemental Table S12). GBF3 was shown to bind to the promoters of CATALASE2 and PROLINE DEHYDROGENASE, with concomitant up- and down-regulation of their expression, respectively (Llorca et al., 2015). Both have a function in ROS homeostasis, and hence their regulation by GBF3 may impact senescence. Correspondingly, the DEGs with regulatory interactions to GBF3 were enriched for GO terms relating to photosynthesis and ABA signaling (Fig. 9B). GBF1, bZIP16, and bZIP68 are redox-regulated repressors of LHCB2.4 (down-regulated in ANAC017 overexpression lines), and their binding to the LHCB2.4 promoter is enhanced under high-light conditions and diminished by reducing conditions (Shaikhali et al., 2012).
Taken together, the GRN shows the complex interactions of TFs, beyond those changing their expression in ANAC017 overexpression lines, to regulate the downstream DEGs and to drive transcriptomic reprogramming. These are in agreement with the ANAC017 overexpression phenotype and reveal a signaling cascade emanating from ANAC017 overexpression by guilt by association (Oliver, 2000).
DISCUSSION
Growth, development, and responses to the environment require plants to coordinate the functions and biogenesis of their cellular compartments to meet changes in metabolic and energy demands (Kmiecik et al., 2016; Van Dingenen et al., 2016). Mitochondria and chloroplasts as the energy-producing organelles are in the center of this regulatory network. Chloroplasts generate the primary products of photosynthesis, and these are used in the mitochondria to produce ATP. These processes are further connected through the mitochondrial AOX, which has a function in optimizing photosynthetic capacity by removal of excess reducing power, especially under stress conditions (Dahal and Vanlerberghe, 2017). Furthermore, metabolic intermediates and amino acids are exchanged between both organelles. These functions are regulated by changes of organellar protein-encoding gene expression in the nucleus and are adjusted through anterograde and retrograde signaling pathways (Chan et al., 2016; de Souza et al., 2017). While some molecules involved in chloroplast signaling, such as PAP, MEcPP, and ROS, have been established, little is known about similar components for mitochondria, with PAP and ROS also likely candidates, among others (Schwarzländer and Finkemeier, 2013; Chan et al., 2016; de Souza et al., 2017). Similarly, regulators of the two signaling cascades executing the integrated read out (i.e. TFs coordinating and balancing both organellar functions), and the underlying mechanisms, are largely unknown. The analysis of the phenotypic and transcriptomic responses of plants overexpressing ANAC017 and the generation of the GRN, integrating the different regulatory interactions of upstream and downstream TFs and their targeted genes, gives insight into this complex network.
Several ANAC TFs have been implicated in retrograde responses, especially five ANACs with transmembrane domains and known functions in mitochondrial signaling (ANAC013, ANAC016, ANAC017, ANAC053, and ANAC078). ANAC017 was first identified as a positive regulator of AOX and has a well-established function in mitochondrial retrograde signaling (Ng et al., 2013), while a role in chloroplast signaling is also emerging (Van Aken et al., 2016b). This is highlighted by the overexpression of ANAC017 in this study, which suggests a contrasting role of ANAC017 for the regulation of mitochondrial and chloroplast functions. As expected, the overexpression led to the up-regulation of known targets, including ANAC013, ANAC016, and ANAC053, likely through positive feedback loops (De Clercq et al., 2013). In conjunction, genes encoding proteins of the mitochondrial stress response were up-regulated. By contrast, genes important for chloroplast function were down-regulated. The absence of ANAC017 in anac017KO mutant plants causes a small stimulation of growth (Fig. 2A). It is likely that even under optimal growth conditions, ANAC017 maintains a low-level mitochondrial stress response due to metabolic ROS production. This will lead to some energy dissipation (e.g. by AOX) and reduced respiration efficiency, which, when removed, as in the ANAC017 loss-of-function line, may promote faster growth under optimal conditions.
The lack of transcriptional regulation of ANAC017 by internal and external stresses (Fig. 1) and the fact that overexpression has such detrimental effects point to the importance of balancing ANAC017 protein levels and nuclear localization by release from the ER. The localization of ANAC017 (and other ANACs) at the ER membrane makes them accessible for signaling pathways emanating from both mitochondria and chloroplasts, leading to their proteolytic cleavage and release from the membrane (De Clercq et al., 2013; Ng et al., 2013). The accumulation of ANACs on the ER membrane in a latent, active form allows for a quick response without the need for transcription and translation at the onset of stress conditions. Differential regulation of their cleavage and corresponding kinetics, dependent on the upstream signal, and the specificity for their target genes would allow for a highly combinatorial and fine-tuned response, as is evident from the complex interactions of regulators and DEGs identified by the GRN. This potential is further highlighted by emerging evidence of a direct physical association of the ER with mitochondria and chloroplasts (Stefano and Brandizzi, 2018), allowing for a direct signal transduction through membrane-associated proteins. The positive feedback loops initiated by binding of ANAC017 to the promoter of ANAC013 (Ng et al., 2013), resulting in a large increase in gene expression, reinforces a function of ANAC017 as a master regulator, with ANAC013 and possibly other ANACs as checkpoints, and also involving the UPR. In general, ANACs have already been associated with the regulation of the UPR. The plasma membrane-bound ANAC062 and ANAC089 (both up-regulated in the ANAC017-overexpressing lines) are activated by ER stress and, after release from the membrane, induce UPR pathway genes (Yang et al., 2014b, 2014c). bZIP60 is the key regulator of the UPR in the ER and also is induced by the chloroplast signaling molecule MEcPP (Walley et al., 2015). The up-regulation of bZIP60, which has ANAC017-binding sites in its promoter, in ANAC017-overexpressing lines also suggests an ANAC017-dependent function of the ER for the coordination of organellar function. This is further evidenced by the identification of the ER-localized bZIP17 and bZIP28 as regulators of the ANAC017 overexpression-dependent GRN. It will be interesting to see if organellar retrograde signaling and stress responses indeed involve these UPR-related functions through ER-associated ANACs. Given that mitophagy and chlorophagy are increasingly seen as important regulatory pathways, the organellar signaling network could use autophagy-related mechanisms in retrograde responses (Broda et al., 2018; Nakamura and Izumi, 2018).
Autophagy also plays an important role during senescence. ANAC017-overexpressing plants show early senescence in older leaves and a faster decline of chlorophyll levels with leaf age than the wild type. Almost all genes directly involved in autophagy mechanisms (ATG genes) are most highly expressed in the ANAC017-overexpressing lines, with 74% of all senescence-associated genes also having a higher expression than in the wild type. ANAC and WRKY TFs are important regulators of leaf senescence, with complex integrated networks and genetic redundancy (Li et al., 2018). In total, 14 ANACs have been ascribed a function in the regulation of leaf senescence (Kim et al., 2016; Li et al., 2018). Out of the 11 positive senescence regulators, seven showed an up-regulation by more than 3-fold in ANAC017-overexpressing lines. The genes encoding the negative regulators ANAC042 and ANAC055 were also substantially up-regulated, by 57- and 40-fold, respectively. Further complexity in the regulation of senescence is added by a leaf age-dependent shift from positive to negative regulation of senescence for the ANAC troika ANAC017, ANAC082, and ANAC090 (Kim et al., 2018). The two negative regulators of senescence, WRKY54 and WRKY70, are down-regulated, matching the senescence phenotype of ANAC017 overexpression lines. These senescence-related TFs belong to subgroups within their families, indicating a phylogenetic functionalization within this family toward regulation of senescence. For some, duplication events in the Arabidopsis genome have also led to genetic redundancy, with several TF pairs having similar functions (Li et al., 2018). Of three duplicated ANACs, the pairs ANAC046/ANAC087 and ANAC059/ANAC092 are both substantially up-regulated in ANAC017-overexpressing lines, while for the ANAC032/ANAC102 pair, only ANAC102 shows a response. Similarly, the duplicated pair WRKY54/WRKY70 shows down-regulation. These data suggest that ANAC017 controls senescence-associated responses through a subset of coregulated downstream targets.
It is likely that the imbalanced mitochondrial signaling pathway also contributes to a reduced cell viability and cell expansion after ANAC017 overexpression, leading to increased cell death. The decreased starch concentration but higher photosynthetic rates in ANAC017-overexpressing lines in standard growth conditions indicate a response to either a reduced biosynthetic capacity or an increased demand by constitutively activated stress pathways. Several bZIP TFs have reduced expression in the ANAC017 overexpression lines and are regulators in the GRN. The C/S1-family bZIPs are balancing energy homeostasis in a SUCROSE NONFERMENTING RELATED KINASE1 (SnRK1/KIN10)-dependent manner (Dröge-Laser and Weiste, 2018). SnRK1 kinase activity is induced by starvation conditions and subsequently activates metabolic pathways, including carbohydrate catabolism (Baena-González and Sheen, 2008), and integrates energy signaling between mitochondria and chloroplasts (Wurzinger et al., 2018). bZIP63 links to organellar function as it is phosphorylated by the SnRK1/KIN10 in response to low energy status, which leads to the activation of an alternative mitochondrial respiration pathway, also involving dimerization with other C/S1-family bZIPs (Mair et al., 2015; Pedrotti et al., 2018). SnRK1 has also been implicated in a mitochondrial retrograde signaling pathway by interaction with the CYCLIN-DEPENDENT KINASE E1 (CDKE1; Ng et al., 2013). The misregulation of several bZIPs might impact this SnRK1 regulatory network and reduce the ability of cells to adjust to environmental changes in ANAC017 overexpression lines, leading to their reduced cell viability. Activation of the mitochondrial retrograde response partially rescues cell wall defects induced by the inhibitor C17. ANAC017 overexpression led to C17 tolerance, while mutation increased sensitivity (Hu et al., 2016). These data show a link of mitochondrial function with the maintenance of cell wall synthesis. The mechanisms of C17 action are unknown but are not directly on cell wall synthase and are more likely associated with the ER, as most enzymes of cell wall synthesis pass through this compartment (Hu et al., 2016). A putative effect of C17 on ER function or organization provides another link to ER-bound ANAC017. This regulation of cell wall synthesis might depend on the level of ANAC017 or its release from the ER, and this will also impact cell expansion.
Mild overexpression of a full-length or truncated, non-membrane-bound ANAC017 does not result in an inhibition of growth compared with the wild type under optimal conditions (Ng et al., 2013), and as shown here, only high expression cannot be compensated. In addition to the up-regulation of ANACs with related function, such as ANAC013 and ANAC016, this compensation may be achieved through the actions of hormone signaling. Auxin fine-tunes mitochondrial signaling (Ivanova et al., 2014; Kerchev et al., 2014). Inhibition of auxin transport and biosynthesis leads to accentuated mitochondrial signaling as, for example, the induction of AOX, a downstream target of ANAC017, increases under stress. By contrast, mitochondrial perturbation has a negative impact on auxin signaling, as treatment of plants with the respiration inhibitor antimycin A decreases auxin levels and correspondingly auxin-dependent responses (Ivanova et al., 2014; Kerchev et al., 2014). Hence, the phenotype of the highly ANAC017-overexpressing lines, with retarded development and bushy growth, is indicative of a lost apical dominance. This might be related to an inhibited auxin signaling pathway and lower indole acetic acid levels, which is similar to the phenotype observed for auxin-deficient and signaling mutants (Ljung, 2013). A joined role of ANAC017 and auxin in mediating the coordination of signaling pathways between the mitochondria and the chloroplast is further evidenced by recent findings that the interplay of auxin and MEcPP regulates growth (Jiang et al., 2018). The constitutive expression of hydroperoxide lyase1 mutant has constitutively high levels of the chloroplast signaling molecule MEcPP and a stunted growth phenotype. This leads to lower auxin levels and an altered distribution due to lower expression of genes encoding auxin biosynthetic YUCCA proteins and the auxin transporter PINFORMED1 (Jiang et al., 2018). Thus, stress-related signaling of both organelles impacts auxin homeostasis to coordinate plant growth to their function, and vice versa, and these may also be involved in compensating for ANAC017 overexpression.
CONCLUSION
Fine-tuning of mitochondrial and chloroplast signaling to integrate their function with overall cellular processes is important for plant growth and stress responses. By overexpressing the retrograde signaling component ANAC017, we have shown that ANAC017 has a function in coordinating the signaling of both organelles by reprogramming the transcriptome. Tethering of ANAC017 to the ER membrane allows for a fast-responsive system under stress conditions while avoiding induction of cell death and senescence, as demonstrated by constitutive activation of the ANAC017-dependent signaling network.
MATERIALS AND METHODS
Plant Material and Growth Conditions
ANAC017ƊTMOE plants were generated by amplifying the ANAC017 sequence lacking the transmembrane domain encoding amino acids 1 to 524, insertion into the vector pK7WG2 (Karimi et al., 2002), and transforming the construct into wild-type Arabidopsis (Arabidopsis thaliana) Col-0 by floral dipping (Clough and Bent, 1998). The identification of the anac017/rao2 mutant lines (anac017EMS/rao2-1, anac017KO/anac017-1, and anac017ƊTM/anac017-2) and the generation of ANAC017OE plants were described previously in Ng et al. (2013).
For soil experiments, seeds were sown in a vermiculite, perlite, and soil mixture (1:1:3) and cold stratified in the dark for 3 d. Plants were grown in climate-controlled chambers with the indicated photoperiod (14 h of light/10 h of dark or 10 h of light/14 h of dark), 65% relative humidity, and 120 μmol m−2 s−1 photosynthetic photon flux density.
For chemical stress treatments, 18-d-old Arabidopsis seedlings grown in soil were sprayed with 2 mm salicylic acid, 1 mm MV, 10 mm 3-amino-1,2,4-triazole, 100 µm ABA, or 50 μm antimycin A with 0.01% (v/v) Tween 20. The first spray treatment was followed by a second treatment after 30 min. Control plants were treated in the same way with water/0.01% (v/v) Tween 20. Furthermore, Arabidopsis seedlings were exposed to UV radiation for 20 min. Leaf tissue of three individual Arabidopsis plants was harvested 3 h after the first treatment for total RNA extraction.
All samples were taken 2 h into the light cycle at indicated time points.
Photosynthetic Parameters
For quantification of photosynthetic rates, fully expanded leaves were enclosed into a 1-cm reach chamber (Li-COR; 6400-15) attached to a Li-COR portable photosynthesis system (BioScientfic) and measured at 23°C with a photosynthetic photon flux density of 400 μmol m−2 s−1 (using the Li-COR 6400-18A with a red/green/blue light source) and CO2 concentration of 400 μmol mol−1 according to the manufacturer’s instructions (Li-COR). For chlorophyll extraction, leaf material (50 mg) was incubated in prechilled 100% methanol at 4°C in the dark overnight and inverted from time to time. After complete extraction, the supernatants were kept and chlorophyll was quantified at 666 and 653 nm with a spectrophotometer (BMG; ClarioSTAR) as previously described in Lichtenthaler (1987). Maximum quantum yield was determined after dark acclimation and pulsing with 120 μmol m−2 s−1 actinic light using the IMAGING-PAM M-series Chlorophyll Fluorescence System according to the manufacturer (Heinz Walz).
H2O2 Staining
The 3,3′-diaminobenzidine staining method was performed to stain for H2O2 accumulation in leaves as described previously (Thordal-Christensen et al., 1997). Leaves were stained using 8.23 mm solution of 3,3′-diaminobenzidine for 6 h and incubated for 24 h in 80% (v/v) ethanol twice to remove the chlorophyll.
Starch Analysis
Starch was extracted and analyzed using a NAD(P)H-linked enzymatic assay (Lowry and Passonneau, 1972). Changes in the absorbance were determined by performing end-point assays before and after the addition of each enzyme.
Trypan Blue Staining
Cell death was visualized in rosette leaf tissue after staining with lactophenol-Trypan Blue (Keogh et al., 1980). Briefly, leaves were stained by incubation in 10 mL of ethanol-lactophenol solution (2:1 volumes of ethanol and phenol:glycerol:lactic acid:water [1:1:1:1]) containing 0.05% (w/v) Trypan Blue. After boiling for 10 min and cooling to room temperature for 30 min, the leaves were destained in 30 mL of chloral hydrate destaining solution (2.5 g mL−1 water) for 2 d with shaking and replacing the destaining solution twice. Leaves were stored in 50% (v/v) glycerol, scanned at 600 dots per inch resolution (AtrixScan 3200XL; Microtek), and examined with a Zeiss microscope (Axio Observer A1; 100×). The cell viability was quantified by measurement of the staining intensity using ImageJ (version 1.51j8).
RT-qPCR and RNA-Seq Analysis
For gene expression studies by RT-qPCR and RNA-seq, leaves 5, 6, and 7 of 5-week-old plants were pooled for each of the three biological replicates and ground using a Tissue Lyser II (Qiagen). Total RNA was isolated using the RNeasy Plant mini kit (Qiagen) according to the manufacturer’s instructions, and DNA was removed via on-column DNase digestion using the RNase-Free DNase kit (Qiagen). The RNA was eluted in molecular grade DNase- and RNase-free water and integrity validated on agarose gels.
For RT-qPCR, 1 µg of total RNA was reverse transcribed using the iScript cDNA Synthesis Kit (Bio-Rad) according to the manufacturer’s instructions. RT-qPCR was conducted using 1 ng of cDNA with a SYBR Green PCR Master Mix and a QuantStudio 12K flex real-time PCR system (Applied Biosystems) using UBIQUITIN-CONJUGATING ENZYME21 (AT5G25760) and ACTIN7 (AT5G09810) as reference genes (Czechowski et al., 2005). Gene-specific primer pairs were designed using QuantPrime (Arvidsson et al., 2008), and their sequences are given in Supplemental Table S13.
RNA-seq libraries were prepared with total RNA isolated as described above using the TruSeq Stranded mRNA Library Prep Kit according to the manufacturer’s instructions (Illumina) and sequenced on a HiSeq1500 system (Illumina) as 60-bp single-end reads with an average quality score (Q30) of above 95% and on average 23 million reads per sample. Quality control was performed using FastQC software (https://www.bioinformatics.babraham.ac.uk/projects/fastqc/). Transcript abundance as transcripts per million and estimated counts were quantified on the gene level by pseudoaligning reads against a k-mer index build from the representative transcript models downloaded for the Araport 11 annotation using a k-mer length of 31 (Cheng et al., 2017) using the kallisto program with 100 bootstraps (Bray et al., 2016). Only genes with at least five counts in one-quarter of all samples per genotype were included in further analyses. The program sleuth with a likelihood ratio test was used to test for differential gene expression (Pimentel et al., 2017). DEGs were called with FDR < 0.05 and log2 fold change > 2. Overlaps in the list of DEGs across the different genotypes were identified and represented using UpSet plots (Conway et al., 2017). The Partek Genomics software suite version 6.16 (Partek) was used for further analyses, hierarchical clustering, and generation of heat maps. GO term enrichment analysis was performed using the ClueGO plugin for Cytoscape. RNA-seq read data were deposited at the National Center for Biotechnology Information Sequence Read Archive database under project identifiers PRJNA486068 (Arabidopsis stress treatments) and PRJNA517774 (ANAC017 overexpression study).
GRN Construction
The list of 2,336 DEGs shared in at least two ANAC017 overexpression lines was searched for enriched binding sites independently for up- and down-regulated DEGs using the TF2Networks tool comprising 2,058 Arabidopsis position weight matrices for 921 TFs (Kulkarni et al., 2018). All predicted TFs among the DEGs (q < 0.001) were retained and additionally analyzed for coexpression and experimental protein-DNA interactions with their predicted target genes. The final network was constructed in Cytoscape 3.5.1 (Shannon et al., 2003) using a yFiles radial layout algorithm (yWorks).
Accession Numbers
Accession numbers are as follows: SAL1, AT5G63980; PTM, AT5G35210; WHY1, AT1G14410; GLK1, AT2G20570; GLK2, AT5G44190; ANAC001, AT1G01010; ANAC003, AT1G02220; ANAC004, AT1G02230; ANAC010, AT1G28470; ANAC013, AT1G32870; ANAC016, AT1G34180; ANAC017, AT1G34190; ANAC019, AT1G52890; ANAC029, AT1G69490; ANAC032, AT1G77450; ANAC034, AT2G02450; ANAC036, AT2G17040; ANAC040, AT2G27300; ANAC041, AT2G33480; ANAC042, AT2G43000; ANAC044, AT3G01600; ANAC046, AT3G04060; ANAC047, AT3G04070; ANAC048, AT3G04420; ANAC053, AT3G10500; ANAC054, AT3G15170; ANAC055, AT3G15500; ANAC059, AT3G29035; ANAC061, AT3G44350; ANAC062, AT3G49530; ANAC069, AT4G01550; ANAC078, AT5G04410; ANAC081, AT5G08790; ANAC082, AT5G09330; ANAC085, AT5G14490; ANAC087, AT5G18270; ANAC088, AT5G18300; ANAC089, AT5G22290; ANAC090, AT5G22380; ANAC092, AT5G39610; ANAC102, AT5G63790; AOX1A, AT3G22370; AOX1B, AT3G22360; AOX1D, AT1G32350; XRN2, AT5G42540; XRN3, AT1G75660; XRN4, AT1G54490; ABI4, AT2G40220; WRKY8, AT5G46350; WRKY18, AT4G31800; WRKY30, AT5G24110; WRKY40, AT1G80840; WRKY46, AT2G46400; WRKY50, AT5G26170; WRKY51, AT5G64810; WRKY53, AT4G23810; WRKY54, AT2G40750; WRKY60, AT2G25000; WRKY63, AT1G66600; WRKY70, AT3G56400; UPOX, AT2G21640; OM66, AT3G50930; NDB2, AT4G05020; NDB3, AT4G21490; TIM17-1, AT1G20350; NDA1, AT1G07180; SHM6, AT1G22020; LHCB1.4, AT2G34430; LHCB1.5, AT2G34420; LHCB2.1, AT2G05100; LHCB2.3, AT3G27690; LHCB2.4, AT3G27690; LHCB3.1, AT5G54270; LHCB2.4, AT3G27690; LHCB4.3, AT2G40100; BETA AMYLASE6, AT2G32290; FERRIC REDUCTION OXIDASE7, AT5G49740; COR15A, AT2G42540; COR15B, AT2G42530; COR78, AT5G52310; COR413-TM1, AT1G29395; TIC20-IV, AT4G03320; NADP MALIC ENZYME3, AT5G25880; FERREDOXIN3, AT2G27510; BRANCHING ENZYME1, AT3G20440; ATG1A, AT2G37840; ATG1B, AT3G53930; ATG1C, AT3G61960; ATG2, AT3G19190; ATG3, AT5G61500; ATG4A, AT2G44140; ATG4B, AT3G59950; ATG5, AT5G17290; ATG6, AT3G61710; ATG7, AT5G45900; ATG8A, AT4G21980; ATG8B, AT4G04620; ATG8C, AT1G62040; ATG8D, AT2G05630; ATG8E, AT2G45170; ATG8F, AT4G16520; ATG8G, AT3G60640; ATG8H, AT3G06420; ATG8I, AT3G15580; ATG9, AT2G31260; ATG10, AT3G07525; ATG11, AT4G30790; ATG12A, AT1G54210; ATG12B, AT3G13970; ATG13A, AT3G49590; ATG13B, AT3G18770; ATG16, AT5G50230; ATG18A, AT3G62770; ATG18B, AT4G30510; ATG18C, AT2G40810; ATG18D, AT3G56440; ATG18E, AT5G05150; ATG18F, AT5G54730; ATG18G, AT1G03380; ATG18H, AT1G54710; VPS15, AT4G29380; VPS34, AT1G60490; EIN3, AT3G20770; EIN2, AT5G03280; PIF4, AT2G43010; ERF1, AT3G23240; ERF2, AT5G47220; ERF6, AT4G17490; ERF11, AT1G28370; ERF12, AT1G28306; ERF59, AT1G06106; ERF104, AT5G61600; PIF4, AT2G43010; PIF7, AT5G61270; RGA1, AT2G01570; RGL1, AT1G66350; RGL2, AT3G03450; RGL3, AT5G17490; GIS, AT3G58070; bZIP1, AT5G49450; bZIP2, AT2G18160; bZIP11, AT4G34590; bZIP17, AT2G40950; bZIP28, AT3G10800; bZIP49, AT3G56660; bZIP44, AT1G75390; bZIP53, AT3G62420; bZIP60, AT1G42990; bZIP63, AT5G28770; bZIP68, AT1G32150; BiP1, AT5G28540; BiP2, AT5G42020; SPT, AT4G36930; FRO2, AT1G01580; FRO6, AT5G49730; KIN10, AT3G01090; CDKE1, AT5G63610; GBF3, AT2G46270; GBF1, AT4G36730; GBF2, AT4G01120; CATALASE2, AT4G35090; PRODH, AT3G30775; PINFORMED1, AT1G73590.
Supplemental Data
The following supplemental materials are available.
Supplemental Figure S1. Altered expression of genes encoding mitochondrial and chloroplast proteins in ANAC017 lines and analysis of GO term enrichment.
Supplemental Table S1. DEGs in ANAC017 lines after hierarchical clustering.
Supplemental Table S2. GO term enrichment analysis for clusters of DEGs in ANAC017 overexpression and mutant lines (Fig. 5).
Supplemental Table S3. DEGs encoding mitochondrial proteins in ANAC017 overexpression and mutant lines after hierarchical clustering.
Supplemental Table S4. DEGs encoding chloroplastic proteins in ANAC017 overexpression and mutant lines after hierarchical clustering.
Supplemental Table S5. Expression of genes of the mitochondrial dysfunction stimulon (De Clercq et al., 2013) in Col-0 and ANAC017 overexpression lines (Fig. 6A).
Supplemental Table S6. Expression of genes in the leaf senescence database (http://psd.cbi.pku.edu.cn) across Col-0 and ANAC017 overexpression lines.
Supplemental Table S7. Expression of autophagy-related genes across Col-0 and ANAC017 overexpression lines.
Supplemental Table S8. Expression of genes with cell death-associated GO terms across Col-0 and ANAC017 overexpression lines.
Supplemental Table S9. Expression of ANAC genes across Col-0 and ANAC017 overexpression lines.
Supplemental Table S10. Differentially expressed TFs in the analyzed genotypes.
Supplemental Table S11. TF2Network output for generation of a GRN of DEGs and their upstream regulators in ANAC017-overexpressing lines (Fig. 9).
Supplemental Table S12. Annotation of the ANAC017-dependent GRN (Fig. 9).
Supplemental Table S13. Primer sequences used for RT-qPCR.
ACKNOWLEDGMENTS
We thank Asha Haslem for technical assistance and the La Trobe University Genomics Platform for access to next-generation sequencing equipment.
LITERATURE CITED
Author notes
This work was supported by the facilities of the Australian Research Council Centre of Excellence in Plant Energy Biology (CE140100008). I.D.C. is supported by the Research Foundation Flanders (postdoctoral fellowship 12N2415N, travel grant 450215N). R.N. is supported by an Australian Research Council DECRA fellowship (DE160101536). X.M. and D.L.C. are supported by a La Trobe University postgraduate scholarship.
Author for contact: [email protected].
Senior author.
The author responsible for distribution of materials integral to the findings presented in this article in accordance with the policy described in the Instructions for Authors (www.plantphysiol.org) is: James Whelan ([email protected]).
J.W. and O.B. conceived the project; X.M., L.L., Y.X., A.H., D.L.C., and O.B. performed the experiments; X.M., R.N., I.D.C., D.L.C., E.C., M.G.L., and O.B. analyzed the data and contributed to the article preparation; X.M., J.W., R.N., and O.B. wrote the article with contributions by all authors.
Articles can be viewed without a subscription.
